Embed Size (px)
Citation preview

PerformanceA triannual topical digest for investment management professionals, issue 18, September 2015
In focusInterview—Selection and oversight of outsourced and delegated services—The search for a scalable framework
Private Equity as a catalyst for growth in the EU
A holistic approach to regulatory watch
Capital Markets Union— Will it be a game-changer?
AIFMD Reporting survey— What lies ahead, what went before?
AIFMD–Time for reflection and extension— ESMA release their advice and opinion
Money Market Funds— US 2014 rules v EU draft 2015 rules
Global risk management survey, ninth edition—Operating in the new normal: increased regulation and heightened expectations
Asset management for insurers —A brave new world
When A, C, and H spell “Connect”…
Asset servicing—Finding the silver linings of regulatory clouds
Deloitte 2014 European real estate investment management survey among asset managers and servicers— Forecast? Mostly sunny, with scattered clouds
How can investment managers supercharge their alpha?
EMEA

22
246 14
In this issue
4 Foreword
5 Editorial
6 In focus Interview—Selection and oversight of outsourced and delegated services
The search for a scalable framework
14 Private Equity as a catalyst for growth in the EU
24 A holistic approach to regulatory watch
32 Capital Markets Union Will it be a game-changer?
40 AIFMD Reporting survey What lies ahead, what went before?
48 AIFMD—Time for reflection and extension ESMA release their advice and opinion
56 Money Market Funds US 2014 rules v EU draft 2015 rules
32 40

3
66
66 Global risk management survey, ninth edition Operating in the new normal: increased regulation and heightened expectations
74 Asset management for insurers
A brave new world
86 When A, C, and H spell “Connect”…
96 Asset servicing Finding the silver linings of regulatory clouds
100 Deloitte 2014 European real estate investment management survey among asset managers and servicers Forecast? Mostly sunny, with scattered clouds
110 How can investment managers supercharge their alpha?
118 Link’n Learn Webinars - Programme 2015
120 Contacts
74 86 96 1005648 110
4
Foreword
A well-known Luxembourg banker recently mentioned in conversation that for the moment he had given up looking for opportunity and was happy to get the obligations out of the way. He was, of course, referring to implementing the wave of legislation that has come out of Brussels and elsewhere in recent years. He made the point that in the past his approach had always been two-fold: “what must I do, what can I do?” when looking for the opportunity that accompanies—one might once have said inevitably—all new legislation. Now he is, for the moment at least, happy to get through the first part of the equation.
One can see his point when one considers that the last European Commission, in the wake of 2008, enacted almost 40 pieces of legislation and regulation, of which most have generated on average around 10 technical standards and sub-regulations making a daunting total of some 400 documents to assimilate, evaluate, and, where appropriate, comply with. (And knowing the gentleman in question, he is being overly modest and that well known gleam will return to his eye when he sees areas where there are positive things to be done).
Lord Hill, when he took up his post as Commissioner for the newly re-shaped Directorate responsible for Financial Stability, Financial Services and Capital Markets Union, referenced the difficulties of assimilation that the industry and market faced and declared himself no enthusiast of legislation for the sake of legislation.
So it is with pleasure that in this edition of Performance, we bring you articles that we trust will offer insights into opportunity as well as obligation. To do so, we have articles that examine the role of private equity in pension investing, we look once again at China and the ever-evolving paths that take us to inward and outward investment in the Middle Kingdom, and we look at the question of investment management for insurance companies. We mentioned Lord Hill previously, and his mandate with regard to Capital Markets Union; this issue of Performance will be reaching you just shortly ahead of the date fixed by the Commission for the release of its draft CMU action plan, so we have allowed ourselves the liberty also to dream a little, and look at what could be at least some profoundly favorable outcomes of the initiative.
This quest of optimistic opportunity is rounded off and completed with fascinating insights into the ongoing trade-off between in-house and outsourced responses, and updates on such matters as money market funds, against a background that, away from the CNAV VNAV issue, promoters were obliged to quietly get on with the task of accommodating negative interest rates, something they managed with aplomb.
We trust as ever that you will find much to interest you in this issue, and hope that, as for our banker with whom we started this reflection, we may just put a gleam of opportunity into your eyes.
Vincent Gouverneur EMEA Investment Management Leader
Nick SandallEMEA Co-Leader Financial Services Industry
Francisco Celma EMEA Co-Leader Financial Services Industry
5
Editorial
Simon RamosEditorialist
Please contact:
Simon Ramos Partner Advisory & Consulting
Deloitte Luxembourg 560, rue de Neudorf L-2220 Luxembourg Grand Duchy of Luxembourg
Tel: +352 451 452 702 Mobile: +352 621 240 616 [email protected] www.deloitte.lu
Johnny YipLuxembourg Investment Management Leader
Asset Management – a Profession with Identity.
We speak, and analyse and work a lot with the term asset management – sometimes investment management (is there a difference and if so which?) – and yet we are generally concerned with its effects, its outcomes, its facets rather than its essence per se. That we are concerned with outcomes is only right, one of the signs of asset management coming of age is that it starts to sell solutions and not products.
On the downside, it clearly is not held in high esteem by the general public as a whole. In surveys, asset managers are considered lower in the eyes of those responding than bankers or more or less any other profession. It is slightly hard to understand this poor ranking given that it is more than probable that few if any of that same general public could readily define what an asset manager is or what she or he does. So dire is this perception of the profession that some industry professionals themselves have publicly stated that there is little if any hope of improving that image, a view not shared by all thankfully. Nevertheless seeking to redress the balance is likely to be an uphill task.
Part of the explanation may come from the very fact that what is done is not easily described, and what is not described tends to attract suspicion. Part of the explanation may be that there are no world bodies focused specifically on asset management – even IOSCO which caters as far as any one does for asset managers – is an association of Securities Commissions, a body by default closer to asset managers than say banking, and yet still a good few miles away from them.
One might even be forgiven for asking if indeed the question matters. It does. For, as a noted commentator from the asset management world often says – “we are part of the solution”.
Recent years in the wake of the (last) financial crisis, has seen many advised and some more ill-advised attempts to legislate away the next financial crisis. (A lovely idea incidentally but one doomed to disappoint). Now we are at last turning the page to look ahead (or rather – since asset managers by definition must always look ahead) and moving the debate to looking ahead rather than recrimination and justification.
We have always sought to look ahead in Performance, but in this edition we have taken a step further down that path. We consider asset management, in its broadest form, in the context of pension investing, of insurance investing, as a part of the global market and a tool for geo-political change. We consider the inter-relationship between core investment management and those services it needs to function, and we look at those initiatives that are likely to come to further shape the future of the profession whether we like them or not.
Asset management has its role to play; it may never be cherished in the hearts of the greater public but its practitioners will be satisfied if using the tools at their disposal, and their skill and judgement they can in future years look back on how the issues that are looming, issues of retirement provision and pensions, issues of funding long term economic growth through wealth creation, have been addressed and conclude “job done”.
We wish you fruitful and thought provoking reading.
6
In focus
Selection and oversight of outsourced and delegated services The search for a scalable framework
Enrico Turchi has 35 years’ experience in the financial industry, of which the last
12 have been spent in asset management. He started his career in retail and
corporate banking in Italy before moving to Hong Kong as Head of Resources and
Administration (COO/CFO) for UniCredit until 1999 and then to London in the same
position. Since September 2003, he is in charge of Pioneer Investments Luxembourg
operations. He was designated as Conducting Officer in January 2005 and he is
Managing Director of Pioneer Asset Management S.A., the Luxembourg-based
Management Company of Pioneer Investments, since December 2006.
He is also a Director for a number of Luxembourg-based SICAVs and a member of
various industry associations and committees.
Interview with Enrico Turchi, Director of Pioneer Asset Management S.A
The following article reflects Enrico Turchi’s knowledge and views on the above mentioned topic.

7
The use of outsourcing service providers and delegates (O&Ds) is a common feature in the asset management industry. Optimization of business processes or entire functions, access to specific expertise, cost-effectiveness, or simply a wider geographical reach, are among the reasons for the complex network of client-supplier relationships covering an investment fund’s value chain.
We believe that the functions responsible for the oversight of outsourcing service providers and delegates perform a paramount role in the mitigation of operational, reputational, and regulatory risks. Regulators are conscious that outsourcing and delegation are permanent features of the industry and are requiring the actors to maintain and develop sound methodologies for monitoring and controlling the arrangements.
The operational challenge of building scalable processes for these comparatively new activities has resulted in efforts by industry associations, consultants, and single organizations to produce guidelines and define criteria for best practices and standards. This article will look at the practical experience of our group and aspects that we believe are common to international groups of similar or greater complexity and geographical span, operating primarily UCITS funds. The approach and methodology described are used worldwide, with minor local adaptations, and provide a consistent and scalable framework for our oversight activities.

8
Outsourcing service providers’ and delegates’ selectionAlthough it might sound obvious, the main criteria we use for the selection of O&Ds are not dissimilar from those adopted when choosing a service vendor or a goods supplier, even if these services or goods are highly interchangeable or commoditized. For us, the development of a framework for the selection of O&Ds represents hence a refinement of an already existing process and not a completely new effort.
The decision whether to perform a service in-house (that, in our context, also means availing of other units of the group) or to use a third-party provider is often seen as the first step in the process. In practical terms, it is not uncommon that the selection is iterative in nature and that, while the process progresses, we reconsider the option of retaining or internalizing the service. Many factors require continuous weighting—knowledge and experience in-house, availability of human and technical resources, capacity and scalability, costs vs. benefits, among others.
Where possible, we have developed specific questionnaires or templates to improve comparability of prospective O&Ds against in-house options. The definition of requirements is an important element to set expectations and to appropriately engage and negotiate with the perspective O&Ds. We draw an “as-is” description of processes and operating flows and request the preparation of “to-be” models to enable the identification of gaps, prevention of operational risks via the closure of these gaps, and definition of quality measures and KPIs. We often couple it with site reference visits, supplementing the documentation obtained and the meetings at various levels of the organizations. Experience indicates that this is a crucial phase of the selection, providing us with an opportunity for the assessment of hard and soft capabilities of O&Ds and setting the tone for a mutually rewarding relationship.

9
Once the competing O&Ds’ capabilities have been assessed, we apply a scoring to evaluate and rate them. The criteria include a number of categories, such as technical fit, quality of service, after-sales service and access to information to monitor it, data integrity and security, disaster recovery and business continuity plans’ soundness, economic terms, reputation of company and its management, and financial viability.
When the selection is made, the contractual arrangements include a detailed operating memorandum/service level agreement that outlines the parties’ respective responsibilities and their commitments in terms of deadlines and day-to-day deliverables. The agreement also defines change management process, communication, escalation procedures in case of disservice or incidents where practicable penalties for failure to meet service levels, and clauses on circumstances that may result in a termination of the agreement.
Ongoing oversight — General principlesThe evaluation criteria used for the initial selection phase equally apply throughout the life of the relationship and are subject to regular reviews. By calibrating the importance of the relationship, the level of assurance obtained from reputational and financial checks, and the risks associated with potential shortfalls, it is possible to develop a matrix of control measures that is both effective and efficient.
Ongoing due diligence measures we adopt include:
• Face-to-face meetings, ranging from day-to-day contact aimed at addressing specific issues to regular forums on recurring themes to overall service reviews conducted at different levels
• KPIs as defined in the contractual arrangements and internal or industry quality reports, the last two being particularly useful to align with the O&Ds’ own perception and measures of service quality and to benchmark against market trends
• Our own assessment of the service quality for the period, whenever possible resulting from the collective effort of several functions—this may take the form of a report card, a traffic light report, or an incident report
• Evaluation of incidents and escalation process, including the nature and scope of the issues, immediate remediation activities, and long-term actions aimed at preventing reoccurrences
• Internal audit access to the O&Ds and regular review of their activities; use of external audit reports (ISAE3402 or equivalent) to assess O&Ds’ control environment; on-site visits on focused on specific activities
• Data integrity and security; depth of disaster recovery and business continuity plans and their relevance to the activities outsourced or delegated
• Continuous review of O&Ds’ financial and reputational soundness; turnover of management and key personnel
We integrate these measures by designating reference experts who focus on the activities to be supervised. This could take the form of a specialized function primarily dedicated to oversight—an effective and sensible measure when the function has sufficient day-to-day interaction with the O&Ds. Our experience indicates that this solution is well-suited to monitoring activities concentrated with a single or a limited number of providers, typically for custody, fund administration, and transfer agency services.
10
Custody, Fund Administration and Transfer AgencyWhen it comes to these areas, there is a relatively large corpus of established oversight practices—such as standard questionnaires—and techniques compared with investment management and distribution activities. This has been facilitated by the work of various industry bodies and by the fact that these are the activities where the economies of scale are more evident and hence more often outsourced or delegated. More recently, the reciprocal due diligence between asset managers and depositaries foreseen by AIFMD—that will be a feature of UCITS V in a few months—has furthered the collaboration of the industry actors on this point.
While familiarity with the oversight processes undoubtedly helps, our experience suggests that relying on documentation is not sufficient to ensure the quality of services and to identify weaknesses in controls and procedures. Particularly when dealing with new regulatory requirements or with new products or instruments, the “as-is/to-be” methodology goes to great lengths to ensure correct implementation of new features, minimize the risk of regulatory breaches or operational errors, and develop a common culture and understanding with the O&Ds.
We make extensive use of KPIs, and we review and update them periodically. Many of them are relatively standardized (security and cash reconciliation, NAV calculation errors and timeliness, quality of financial reporting, investment compliance monitoring, application of cut-off times, share or unit reconciliation, etc.). A smaller portion typically deals with operative efficiency and the ability of the O&Ds to support the promoter’s new activities (funds or classes launches, opening of accounts in new markets, change management process, etc.).
11
We believe that the functions responsible for the oversight of outsourcing service providers and delegates perform a paramount role in the mitigation of operational, reputational, and regulatory risks
Investment management activities
Qualitative assessments of investment managers (IMs) have possibly been in place for a longer time than those of custodians, fund administrators and transfer agents. But until recently, they have been characteristic of third-party relationships, when an investor intends to select or has selected an IM to manage a particular portfolio, more than of intra-group delegation. Request for proposal (RFPs) selection processes typically cover exhaustively the capabilities, internal controls, and organizational structures of IMs. RFPs often have the limitation of being asset-class or mandate specific and cannot therefore be simplistically transposed when, as it is not uncommon in large groups, an IM manages a wide range of funds in multiple asset classes with very different investment objectives and markets. While regulators acknowledge that intra-group delegation presents practical advantages, there is no expectation that this is an authorization to lower the standard of controls or a shortcut for a purely cosmetic approachto discharging the oversight responsibilities.
Our group operates via three main IM centres and a number of smaller IM operations with specific capabilities. It is therefore common that our Management Companies (ManCos) have IM intra-group delegation arrangements with several sister companies. This has resulted in the need to develop common standards and the extensive use of internal benchmarking to define best practices. Part of the efforts, still ongoing, are aimed at sharing information already available at the level of single IMs or ManCos and ensuring that there are mechanisms in place to facilitate the provision of information via a common IT infrastructure rather than as a result of multiple one-to-one relationships or requests (“push” vs. “pull”).
The oversight areas (regulatory overview and internal control systems, execution/trading and matching/settlement, compliance, corporate actions, policies and processes, BCP/DRP, conflict of interest, to name just a few) have been mapped in a matrix developed by a working group composed by representatives of the most relevant ManCos.
The information available at group level or with the IMs, often produced for local reporting purposes, is linked to the control points in the matrix and will be shared via a common repository accessible to all group entities.
Other elements of the scalable approach include the adoption of a worldwide front-office system, the standardization of investment management agreements, the definition of a common format and coverage for investment risk management, compliance, internal audit, operational events, and performance reporting. Multiple entities are going to carry out coordinated on-site evaluations, and the aim is to share results amongst all internal clients and the intra-group O&Ds.
Together with the day-to-day interaction and the common operational work, we believe that this set of measures and the way they are deployed provide a scalable and effective oversight on IMs’ activities.
12
Distribution oversight
It is a common assumption that distribution oversight consists mainly of the oversight of distributors. While it is undeniable that the selection and monitoring of distributors and the management of the risks associated with money laundering and terrorist financing are the most visible portion of distribution oversight, it is equally true that this extends to the marketing and operational aspects and to reporting and information to investors. The industry is becoming increasingly aware of operational risks associated with distribution and new regulations are likely to increase the focus on compliance in areas not only associated with AML/CTF themes.
In our group distribution is organized by geographical areas. We use group companies as main delegates for distribution activities and as gatekeepers for distributors’ selection and ongoing due diligence, reputational checks, and day-to-day interaction. We adopt a common acceptance and approval process—involving sales, legal, compliance, finance and operations functions—that reviews the due diligence documentation and KYC information, verifies the compatibility of economic terms with legal requirements and internal targets, and ensures the operational flows are well-defined and understood by all parties involved.
Initial due diligence requirements are defined by a matrix that considers the assessment of AML/CTF legislation in the country where the distributor operates, legal and licensing status and ownership of the distributor, reputational checks, and compatibility of the operation model with prevailing standards. Whenever possible, we use standardized agreements, often adopting local industry standards, detailing respective obligations and responsibilities with reference to the legislation of the domicile of incorporation of the products.
Ongoing reviews draw elements from any change made to all above elements, continuous reputational checks, and indicators of anomalies in day-to-day operations, such as occurrences of errors, requests for deviations from the agreed operational processes, and instances of potential frequent trading or market timing. When necessary we arrange ad hoc meetings or on-site visits to resolve misalignments and to be comfortable with the adequacy of distributors’ internal procedures.
At the same time, we believe that controls of the distribution process flow do not consist solely of the oversight of distributors. The design phase of a product, the assessment of the target markets and clients’ segments, and the production and regular updates of clear and plain-worded documentation are all important elements for an effective and well-thought-out distribution, protecting the investors’ and our interests at the same time. The service quality in clients’ transactions, the controls on corporate actions such as mergers and liquidations, or interest or dividend payment, the accuracy of tax reporting, and the punctual publication of NAV prices and financial reporting are all aspects that massively influence the investors’ experience of our products. These factors ultimately define our brand perception and reputation vis-à-vis stakeholders—from regulators to investors, from distributors to our own people—who we want to be proud of the passion for quality that we put every day in our work.
We believe that controls of the distribution process flow do not consist solely of the oversight of distributors

13
To the point
• Oversight of outsourcing service providers and delegates is a key function to mitigate operational, reputational and regulatory risk
• The decision to perform a service in-house or to outsource it is iterative in nature: the option of retaining or internalizing the service should not be forgotten or dismissed forever
• It is possible to develop a matrix of efficient and effective control measures on O&D services using a risk-based approach
• Established oversight practices, such as standard questionnaires, are not sufficient to ensure the quality of services and identify weaknesses in controls and procedures. Day-to-day operational contacts are a must to “know your delegate” processes
• In intra-group delegations, culture and IT infrastructure will help to move the information flow from “push” to “pull”
• Distribution oversight is not only oversight of distributors: it extends to marketing, reporting, and operational activities
14
Private equity (PE) as an asset class for pension funds has the potential to create a virtuous circle; it could boost local grass-roots economies, offer returns to consistently outperform those of more conventional investments, and, by providing the most efficient means for injecting capital into the real economy, create new jobs and local tax revenues.
However, to realize this potential, the sector and its actors face, at best, an unfavorable and, at worst, a hostile regulatory and political environment.
Private Equity as a catalyst for growth in the EUAnnick EliasPartnerAdvisory & ConsultingDeloitte
Chris Stuart SinclairDirectorAdvisory & ConsultingDeloitte
Private equity and firms managing PE investments have a key role to play in defusing the “retirement time bomb” and might be strong catalysts for meaningful growth within the European Union (EU).
15
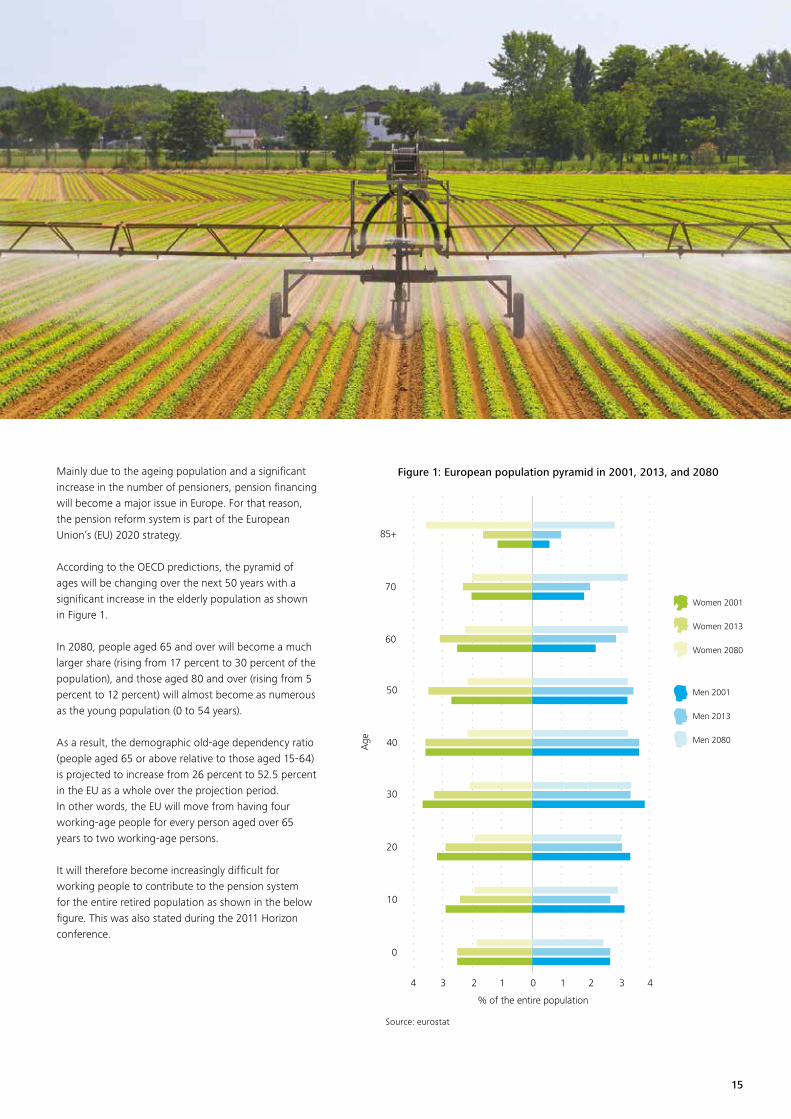
Figure 1: European population pyramid in 2001, 2013, and 2080Mainly due to the ageing population and a significant increase in the number of pensioners, pension financing will become a major issue in Europe. For that reason, the pension reform system is part of the European Union’s (EU) 2020 strategy.
According to the OECD predictions, the pyramid of ages will be changing over the next 50 years with a significant increase in the elderly population as shown in Figure 1.
In 2080, people aged 65 and over will become a much larger share (rising from 17 percent to 30 percent of the population), and those aged 80 and over (rising from 5 percent to 12 percent) will almost become as numerous as the young population (0 to 54 years).
As a result, the demographic old-age dependency ratio (people aged 65 or above relative to those aged 15-64) is projected to increase from 26 percent to 52.5 percent in the EU as a whole over the projection period.In other words, the EU will move from having four working-age people for every person aged over 65 years to two working-age persons.
It will therefore become increasingly difficult for working people to contribute to the pension system for the entire retired population as shown in the below figure. This was also stated during the 2011 Horizon conference.
20
30
10
0
4 43 32 21 10
% of the entire population
Age 40
50
60
70
85+
Men 2001
Men 2013
Men 2080
Women 2001
Women 2013
Women 2080
Source: eurostat
16
2001
0%
5%
10%
-10%
-5%
15%
20%
25%
Net
IRR
(%)
FTSE Europe HSBC Small Company Equity JP Morgan Euro Bonds (EMBI+) European private equity
2005 2006 2007
20 3010 40 50 60 70 80
2009 2010 20132002 2003 2004 2008 2011 2012
That’s why it is critical for the pension funds to invest in products offering higher returns than traditional financial products (equities, bonds, etc.). In that respect, private equity investments present a number of advantages:
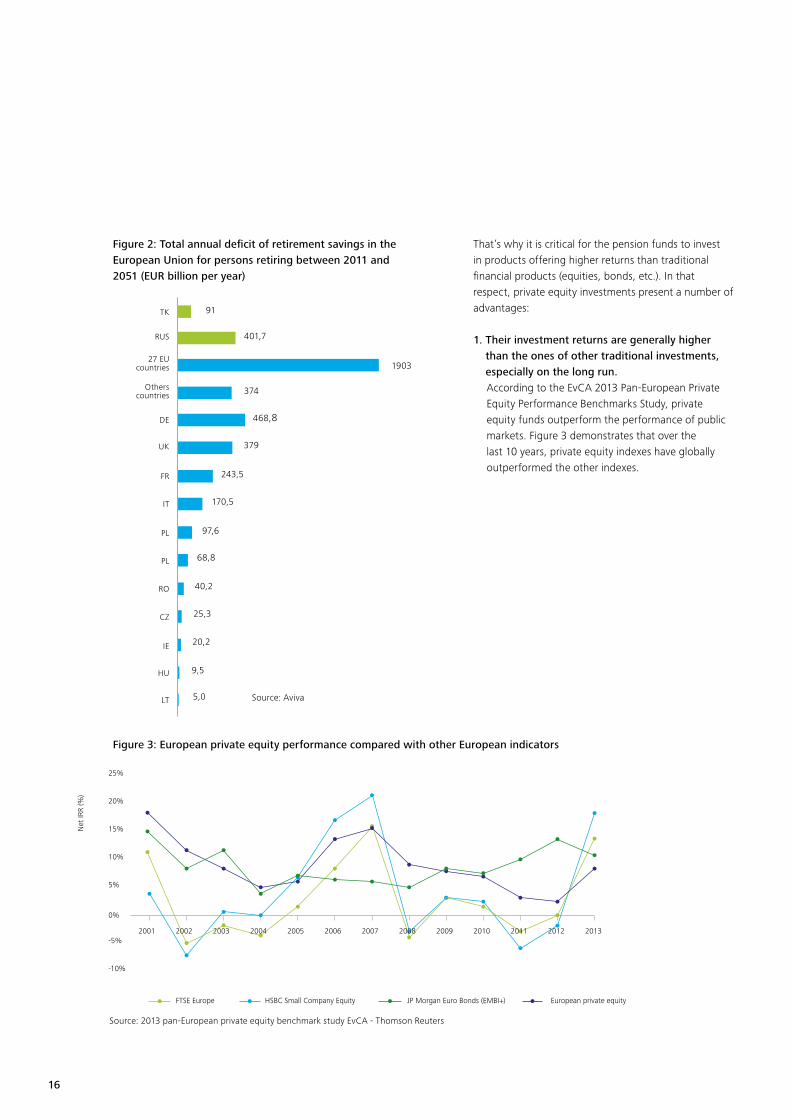
1. Their investment returns are generally higher than the ones of other traditional investments, especially on the long run.According to the EvCA 2013 Pan-European Private Equity Performance Benchmarks Study, private equity funds outperform the performance of public markets. Figure 3 demonstrates that over the last 10 years, private equity indexes have globally outperformed the other indexes.
Figure 3: European private equity performance compared with other European indicators
Figure 2: Total annual deficit of retirement savings in the European Union for persons retiring between 2011 and 2051 (EUR billion per year)
LT
HU
IE
CZ
RO
PL
UK
DE
Otherscountries
TK
FR
IT
PL
27 EUcountries
RUS
5,0
9,5
20,2
25,3
40,2
68,8
97,6
170,5
243,5
379
468,8
374
1903
401,7
91
Source: 2013 pan-European private equity benchmark study EvCA - Thomson Reuters
Source: Aviva
17
2. Private equity funds might also foster economic growth, creating therefore a virtuous circle.By offering their investors the possibility to invest in long-term products, private equity funds provide small and medium-sized companies (SMEs) with capital at different stages of their growth: when they are a start-up, needing capital to expand or access new markets, when they are close to bankruptcy, in financial distress, when they are family-owned companies requiring succession planning, etc. Besides, most private equity general partners also provide managerial expertise and specialized industry know-how to their portfolio companies.
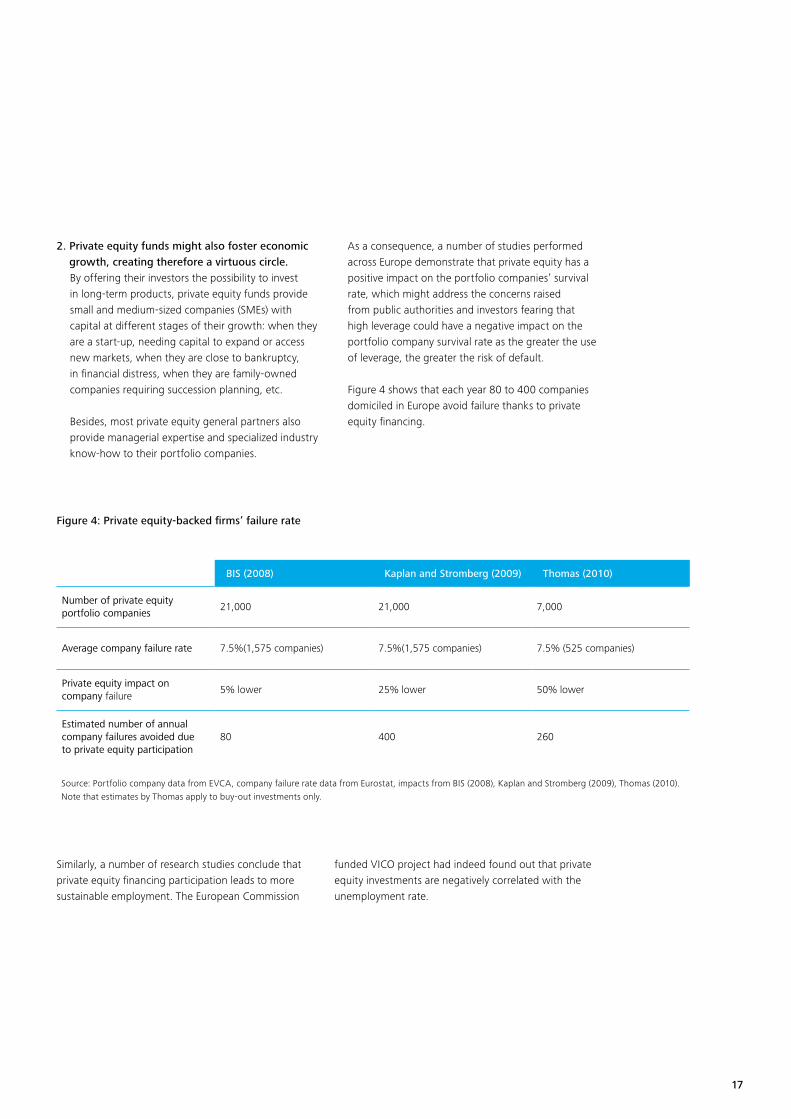
As a consequence, a number of studies performed across Europe demonstrate that private equity has a positive impact on the portfolio companies’ survival rate, which might address the concerns raised from public authorities and investors fearing that high leverage could have a negative impact on the portfolio company survival rate as the greater the use of leverage, the greater the risk of default.
Figure 4 shows that each year 80 to 400 companies domiciled in Europe avoid failure thanks to private equity financing.
Similarly, a number of research studies conclude that private equity financing participation leads to more sustainable employment. The European Commission
funded VICO project had indeed found out that private equity investments are negatively correlated with the unemployment rate.
Figure 4: Private equity-backed firms’ failure rate
BIS (2008) Kaplan and Stromberg (2009) Thomas (2010)
Number of private equity portfolio companies
21,000 21,000 7,000
Average company failure rate 7.5%(1,575 companies) 7.5%(1,575 companies) 7.5% (525 companies)
Private equity impact on company failure
5% lower 25% lower 50% lower
Estimated number of annual company failures avoided due to private equity participation
80 400 260
Source: Portfolio company data from EVCA, company failure rate data from Eurostat, impacts from BIS (2008), Kaplan and Stromberg (2009), Thomas (2010). Note that estimates by Thomas apply to buy-out investments only.
18
However, pension funds have been facing a number of constraints regarding investments in private equity funds:
Constraint 1: Bad reputation
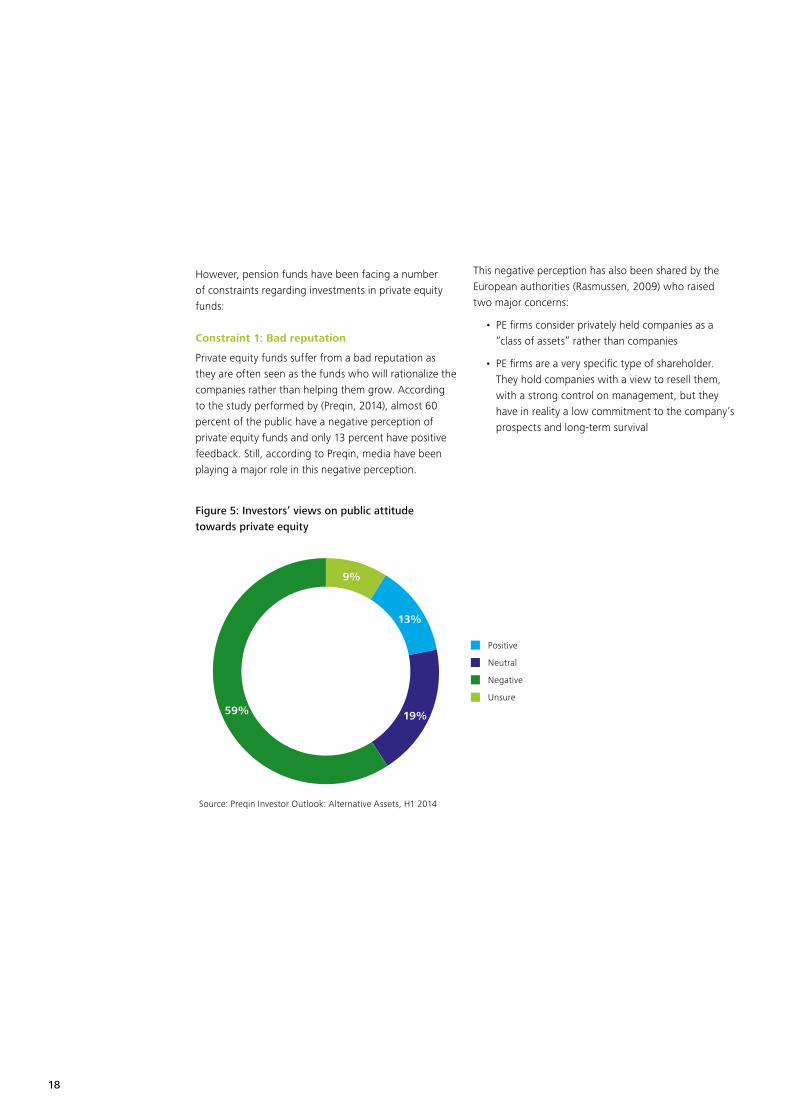
Private equity funds suffer from a bad reputation as they are often seen as the funds who will rationalize the companies rather than helping them grow. According to the study performed by (Preqin, 2014), almost 60 percent of the public have a negative perception of private equity funds and only 13 percent have positive feedback. Still, according to Preqin, media have been playing a major role in this negative perception.
This negative perception has also been shared by the European authorities (Rasmussen, 2009) who raised two major concerns:
• PE firms consider privately held companies as a “class of assets” rather than companies
• PE firms are a very specific type of shareholder. They hold companies with a view to resell them, with a strong control on management, but they have in reality a low commitment to the company’s prospects and long-term survival
Figure 5: Investors’ views on public attitude towards private equity
9%
13%
19%59%
Positive
Neutral
Negative
Unsure
Source: Preqin Investor Outlook: Alternative Assets, H1 2014

19
Constraint 2: Regulation on pension funds
Legal constraints preventing pension funds from investing into private equity funds could also become tighter should IORP II’s requirements align to Solvency II ones. While we address here public and private pension schemes (and not individual savings schemes in scope of Solvency II), we would like to highlight the potential impacts of Solvency II on private equity investments as some clauses of IORP II (applicable to private pension schemes) could be aligned to Solvency II ones.
The most significant Solvency II constraint for private equity investments might be the application of the Solvency Capital Requirement (SCR), which is higher for private equity stocks, potentially limiting the interest of pension funds and insurance companies in private equity underlyings.
Constraint 3: Regulation on private equity funds (AIF), namely AIFMD
AIFMD presents some constraints for private equity funds that might be unsuitable given the type of business, and notably along the following aspects:
1. Risk management and portfolio valuationAIFMD requires that the risk management and portfolio valuation functions be independent from the portfolio management’s one. Contrary to hedge funds and funds of hedge funds, a private equity fund’s portfolio manager will select a target company and follow-up on a day-to-day basis the performance of this company. In doing so, the portfolio manager will perform a valuation of the company and also assess the risks related to the company at the investment stage as well as throughout the investment period until the divestment stage. In other words, risk management and portfolio valuation are part of the duties of a private equity fund’s portfolio manager. Having independent risk management and portfolio valuation functions would generate extra costs with very limited added value.
2. Liquidity management processAIFMD specifies requirements for funds that hold investments with “limited liquidity.” Private equity falls into this category. AIFMD notably requires a process that must be put in place regarding how these assets should be managed and documented by the PE manager. We believe that such requirements represent a substantial task with a limited added value as private equity investments are long-term and therefore illiquid.
3. Asset strippingAsset stripping may happen in various contexts. It may be done, for instance, when the target company is performing well and the private equity fund wishes a quick reimbursement of its acquisition debt; or, on the contrary, it may be implemented when the target company is overloaded with the acquisition debt and its survival requires a quick sale of assets.
AIFMD introduced limitations on asset stripping. Private equity funds would not be allowed for two years to perform any distribution, capital reduction, share redemption, or acquisition of own shares by such companies. Also, the private equity fund wouldn’t be authorized to vote in favor of such events and will be making its best efforts to prevent such events from occurring. These restrictions mainly affect private equity with LBO and distressed / turnaround strategies; therefore, in these cases, private equity funds would have to take these restrictions into consideration when planning to make an acquisition as they may impact the timing of their expected returns.

20
We have two concerns about the asset stripping constraint:
• If the private equity is not allowed to perform asset stripping, it does not have the flexibility to rationalize when the target company is in financial distress; therefore, in the end, the target company goes bankrupt, which is a lose-lose situation
• Also, this constraint only applies to private equity funds domiciled in Europe. Private equity funds domiciled outside Europe can perform asset stripping on European-based target companies, which does not solve at all the problem
4. TransparencyAIFMD requires full transparency to regulators and investors before they invest. The main noteworthy requirement is disclosure of remuneration details, which is a major change for private equity funds who used to keep remuneration information confidential. Also, the fund will have to provide full information to the investors on the portfolio activity (target companies selected, leverage used, etc.). While these new requirements bring useful data to the funds investors, they generate significant extra costs to the fund to collect, compile, and disseminate those data and documents.
While it is important to provide sufficient information to the fund’s investors, we believe the requirements of the Directive go too far as they are as restrictive as the ones applied to UCITS, which are sold to retail investors whereas only institutional investors can buy AIF. This constraint also generates extra costs with limited added value.
5. LeverageAIFMD stipulates new ways to calculate leverage (Gross & Commitment methods) and adds new reporting requirements. We believe that these requirements are not really applicable to Private Equity funds as Leverage happens at the level of the Portfolio companies rather than at the level of the Fund.
The sector and its actors face, at best, an unfavorable and, at worst, a hostile regulatory and political environment

21
European authorities are setting up ELTIF to foster Long term investments
European authorities are becoming however more and more aware that long term investments are correlated to and foster economic growth. They are currently working on a new type of fund - the ELTIF or European Long Term Investment Fund1 which would still be under the AIFMD but would be designed for long term investments (notably in infrastructure). The specificities of the ELTIF will be that:
• This fund type would be open to Retail Investors (currently funds which can invest in Private Equity funds are only opened to Institutions) subject to certain minimum criteria in terms of net worth and total portfolio exposure to the asset class.
• The fund would be closed: Regulated European funds offered to Retail Investors are open, meaning that a Retail Investor can redeem his fund shares when he wishes. In this case, the Retail Investor would only be able to redeem his investment after a period stated in the prospectus of the fund (5 to 10 years generally).
While ELTIF will incentivize investments in Private Equity and similar funds as well as the very specific sector of infrastructure, although some barriers remain:
• AIFMD compliance will still be required
• As these funds will also be offered to Retail investors, the full set of documentation aimed at Retail investors will be required and probably investor education above and beyond the intended PRIIPS KID2, notably to avoid retail investors forming misconceptions as to the nature of the product. The public sponsorship of the formula by the European Commission could lead investors to the erroneous conclusion that the product benefits from some form of European guarantee.
As such, ELTIF might not yet be the “ideal” response to the constraints raised above.
2 “Packaged Retail Investment and Insurance-based Products Key Information Document.”
1 ELTIF will become applicable in member states from 9 December 2015
22
Key considerations going forward
As a conclusion, we would recommend to contemplate the following points should we decide to push towards further investments in private equity products.
1. Educate investors, pension funds, government about the benefits of private equity investmentsAs for the regulatory framework, this one should be adapted to private equity investments while ensuring pensioners’ protection as well as favoring sustainable economic growth in Europe (through private equity investments in European SMEs). In doing so, we could introduce the following points:
2. Ensure that pension funds wishing to perform investments in private equity companies “use“ experts to make private equity investment decisionsTo better protect the investors, it is critical that the asset managers of the pension funds have a good knowledge of private equity investments. Europe could benefit from the experience acquired in Australia, the United States, and Canada where large pension funds have recruited private equity experts to perform investments in those types of assets.
3. Ensure that the IORP 2 standard formula for capital requirements does not overstate the capital required to cover the private equity riskFor instance, we could for instance:
• Soften conditions so as private equity vehicles can be categorized type 1 standard calibration (instead of type 2)
• Ease the internal model validation process for pension funds
4. Adapt AIFMD to private equity fundsWe believe that the below AIFMD requirements should be amended or even removed in the case of private equity funds:
• Having independent “risk management” and “fund valuation” functions
• Applying the liquidity & leverage management constraints
• As for the asset stripping requirement, adapt it so as to ensure that a private equity firm has the flexibility to enhance the performance of the company while ensuring that the actions undertaken do not put at risk the portfolio companies’ sustainable growth and employment
5. Propose an attractive taxation model for pension funds investing in private equity funds investing in European companies (and generating sustainable return)One of the attractive features that was first proposed for ELTIFs was that they should benefit from the most favorable treatment in the hands of the investor afforded in each Member State. It was hoped that by adopting this approach the proposition would not be seen to encroach upon the fiscal prerogatives of Member States but, at the same time, offer a definite incentive for acquiring the product. Alas, the European Council did not see things in the same light and the proposal was struck down.
That’s why it is critical for the pension funds to invest in products offering higher returns than traditional financial products (equities, bonds, etc.). In that respect, private equity investments present a number of advantages
23
To the point
• An ageing population and a significant increase in the number of pensioners is forcing EU regulators to reform the current pension system. Private equity could potentially assist with the escalating issue of pension financing since it provides pension funds with the possibility to invest in products offering higher returns than traditional financial products
• Furthermore, private equity funds can foster economic growth by reducing the number of companies that go bankrupt. They provide small- and medium-sized companies (SMEs) with capital as well as managerial expertise and specialized industry know-how. Some studies have even shown that private equity financing participation leads to more sustainable employment
• Nonetheless, constraints to private equity funding exist. This alternative investment fund type has a bad reputation of profiting from suffering companies instead of helping them to grow. Therefore, EU legislations, such as such as Solvency II, IORP II and AIFMD, have been put in place to impose a stricter regulatory environment on funds. These regulations and the setting up of a European long- term investment fund (ELTIF) are constituents of an overall strategy to foster long-term investment and promote sustainable economic development within the EU
The paradox – the need for return but the inherent negative treatment of private equity and related investments for pension purposes – Solvency II, proposed similar capital requirements under IORPs rules – is recognised by the industry. It is an area in which the industry in its broader sense is out of step with the European co-legislators3.
The latest European Commission initiative, however, holds out some hope, as yet perhaps slender, that this may change. Earlier this year the Commission published a Green Paper to consult on Capital Markets Union— a project to stimulate economic growth via greater flexibility and access to capital markets across the European Union and to diversify the sources of funding available to small- and medium-sized companies, inter alia. Specifically, the Commission itself raised the question of Solvency II and CRD IV inviting comment as to their appropriateness for certain asset classes, including infrastructure. The same consultation asks also about improvements that could be made to ensure greater use of ELTIFs or other funds in the private equity space.
Over 700 replies were received to the Green Paper from all spectrums. It would be premature to speak of consensus, but many commentators raised the issues of the punitive reserve requirements on private equity, referenced the initial tax treatment proposed for ELTIFs and, in some cases, even went as far as advocating a pan-European defined contribution pension scheme. It is a long way to go from this consultation to seeing private equity as a regular and recognized component of all pension plans. However, viewed dispassionately, the case is unanswerable—private equity is at the heart of securing regular growth of the level required to fund retirement aspirations and as a by-product, its inclusion in the eligible universe of pension and insurance investing would stimulate long-term sustainable growth. All that remains is to convince the European co-legislators of the wisdom of this paradigm.
3 “Given the legislative process as it exists post Lisbon, legislation has become the joint preserve of the European Parliament, Commission and Council frequently referred to as “co-legislators.”

24
A holistic approach to regulatory watchMarc NoirhommeDirectorAdvisory & Consulting Deloitte
Laurent DaoConsultantAdvisory & Consulting Deloitte

25
A recent Deloitte survey revealed that most financial institutions have now realized the importance of the regulatory watch function for remaining ahead of regulatory challenges. With a holistic approach that combines regulatory watch, compliance, legal, and business functions, it does not have to be more complicated than it already is.
Why do we focus now on regulatory watch?
Following the global financial crisis that started to emerge in 2007, the political, regulatory, and supervisory responses have had major implications for the financial services industry.
1. Regulatory landscape The unprecedented regulatory weight has forced financial institutions to develop and broaden the full range of skills and tools necessary to address technical matters and to keep up with an evermore complex regulatory landscape.
2. Costs of regulatory transgressions Penalties for non-compliance have reached unprecedented levels. According to the Financial Times1, Wall Street banks and their foreign counterparts have paid out US$100 billion in U.S. legal settlements since the financial turmoil. If one believes that regulatory compliance has become too expensive, non-compliance would certainly be far more costly. While some institutions—usually smaller institutions with limited resources—have been tempted to adopt a risk-based approach toward regulatory compliance, this is nowadays a very risky decision.
1 Financial Times (25/03/2014): “Banks pay out $100bn in US fines” (R. McGregor and A. Stanley)

26
3. Tighter scrutiny from supervisory bodies Supervisory authorities have not only become increasingly demanding in terms of reporting and liquidity and capital requirements, but they also pay more attention to the strategies and business models chosen by their supervised entities. Board members and senior management are also being increasingly held accountable for the consequences of their decisions or lack of action. Financial institutions that are most likely to thrive in this environment will be those that understand what an adequate or sustainable strategy and business model look like from a supervisory perspective. To satisfy the increasingly demanding supervisors, they would also need to have the vision to extract the maximum possible benefits from the investments they make.
4. Multiple sources of regulatory information The demand for greater scrutiny has been accompanied by an emergence of new supervisory entities (e.g., the new European Supervisory Authorities) as well as an increase in staff members. With each supervisory entity publishing its own publications (e.g., guidelines and consultation papers), financial institutions have become overwhelmed with regulatory updates. In addition, law firms, consulting firms, global custodians, and industry associations also publish newsletters and alerts.
5. Generic vs. specific information Despite the high volume of publications available, the majority tend to contain rather generic information that is not specific to organizations. The challenge for financial institutions consists in figuring out which publications are really important and which will enable them to anticipate the specific business impacts.
In a nutshell, what should an efficient regulatory watch consist of?
1. Set up of the function First of all, businesses need to define the organization of the regulatory watch function. This includes determining the ownership of the function (e.g., compliance, legal, strategy, etc.) as well as the roles and responsibilities of all stakeholders involved, namely the watchers and business experts.
2. Screening and monitoring of changes In the second step, sources that will provide the relevant information in line with the activities and services of the institution should be identified. If the institution has an international footprint, it should also ensure that the scope of the watch covers both local and cross-border needs. This phase is key to ensure that the relevance, scope, and volume of information are well-suited to the organization.Watchers can then start screening the pre-selected sources and monitor existing topics, capture new ones, and prioritize them for further action. In parallel to the screening, the institution should set up means of storage and communication to transfer information to business stakeholders.
3. Pre-assessment of impacts To enhance the use of the regulatory watch input, a pre-analysis should be performed and its results shared with business stakeholders at the right moment. Keeping business units informed on a regular basis about upcoming regulatory changes will foster anticipation and facilitate project implementation. Bespoke information about regulatory updates should also be shared with the different compliance stakeholders such as the board and local entities.

27
4. Detailed business impacts Based on the pre-analysis, the organization may decide to conduct in-depth impact analysis. To coordinate horizontal impacts, it is recommended to involve every stakeholder from the beginning—not only compliance but also the executives, legal, IT, risk, and business units. This is the essence of the holistic approach to regulatory compliance.
5. Gap analysis Following the business impacts, a gap assessment clearly identifies what needs to be changed in the organization. It is a prerequisite for the implementation project that actions mitigating these gaps are planned and the required resources are identified (i.e., volume and type).
6. Implementation Finally, once the appropriate resources of those involved in the Business as Usual (BAU) are mobilized, the Project Management Office (PMO) can coordinate the implementation and post-mortem implications.
First of all, businesses need to define the organization of the regulatory watch function. This includes determining the ownership of the function (e.g., compliance, legal, strategy, etc.) as well as the roles and responsibilities of all stakeholders involved, namely the watchers and business experts
28
Deloitte survey
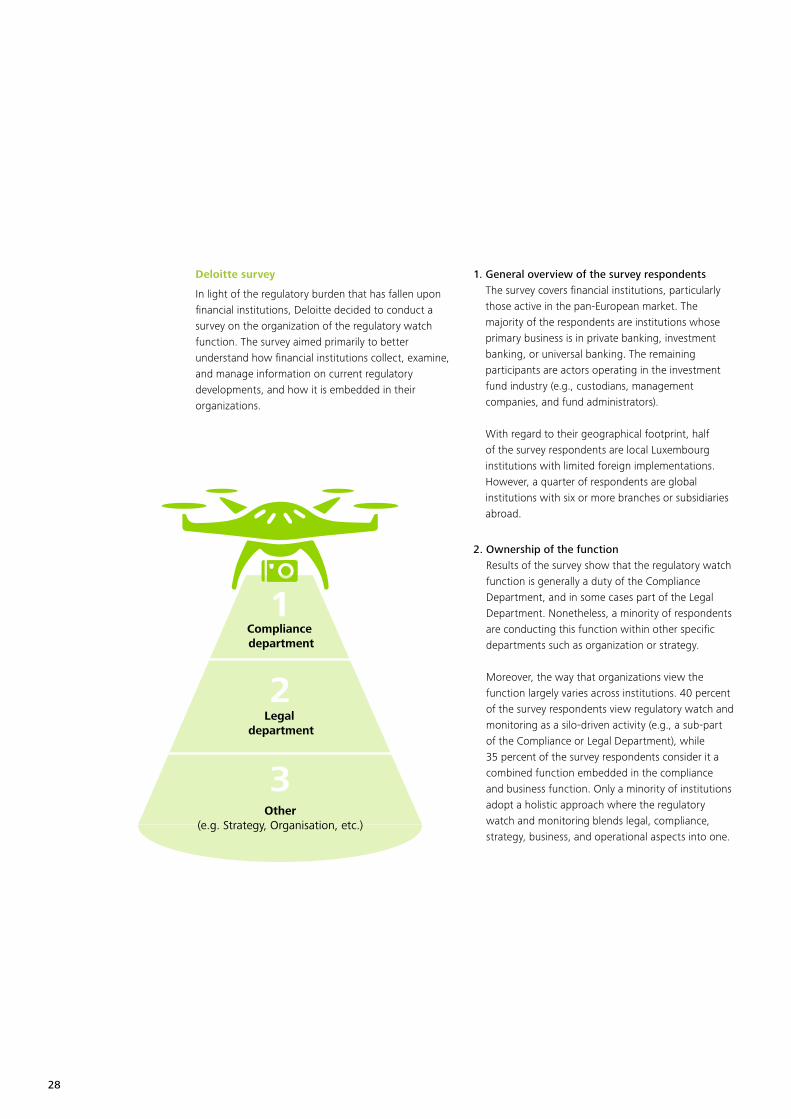
In light of the regulatory burden that has fallen upon financial institutions, Deloitte decided to conduct a survey on the organization of the regulatory watch function. The survey aimed primarily to better understand how financial institutions collect, examine, and manage information on current regulatory developments, and how it is embedded in their organizations.
1. General overview of the survey respondents The survey covers financial institutions, particularly those active in the pan-European market. The majority of the respondents are institutions whose primary business is in private banking, investment banking, or universal banking. The remaining participants are actors operating in the investment fund industry (e.g., custodians, management companies, and fund administrators). With regard to their geographical footprint, half of the survey respondents are local Luxembourg institutions with limited foreign implementations. However, a quarter of respondents are global institutions with six or more branches or subsidiaries abroad.
2. Ownership of the function Results of the survey show that the regulatory watch function is generally a duty of the Compliance Department, and in some cases part of the Legal Department. Nonetheless, a minority of respondents are conducting this function within other specific departments such as organization or strategy. Moreover, the way that organizations view the function largely varies across institutions. 40 percent of the survey respondents view regulatory watch and monitoring as a silo-driven activity (e.g., a sub-part of the Compliance or Legal Department), while 35 percent of the survey respondents consider it a combined function embedded in the compliance and business function. Only a minority of institutions adopt a holistic approach where the regulatory watch and monitoring blends legal, compliance, strategy, business, and operational aspects into one.
1
2
3
Compliance department
Legal department
Other(e.g. Strategy, Organisation, etc.)

29
3. Set up of the regulatory watch function For most survey respondents, the regulatory source screening function is generally performed internally, either fully or partially at the local level. 45 percent of respondents have indicated that they delegate the function to the group (35 percent partially, 10 percent fully), and only a minority have outsourced the function to an external provider such as a regulatory watch and monitoring provider.
Out of the respondents who have outsourced partially or fully the source screening function to the group level, 45 percent of them have indicated that their local specificities are only taken partially into account by the group. One in five even state that the group does not take into account their local specificities at all. This reflects how difficult it is for any group to follow the regulatory status in each country where it operates.
45%
35%
45%
10% 10% 20% 20%
15%
Current operating model
Fully Managed internally
Fully outsourced to the group
Outsourced to RW provider
Not at all
Fully
N/A
Partially
Partially outsourced to group level
Group consideration for local specificities
30
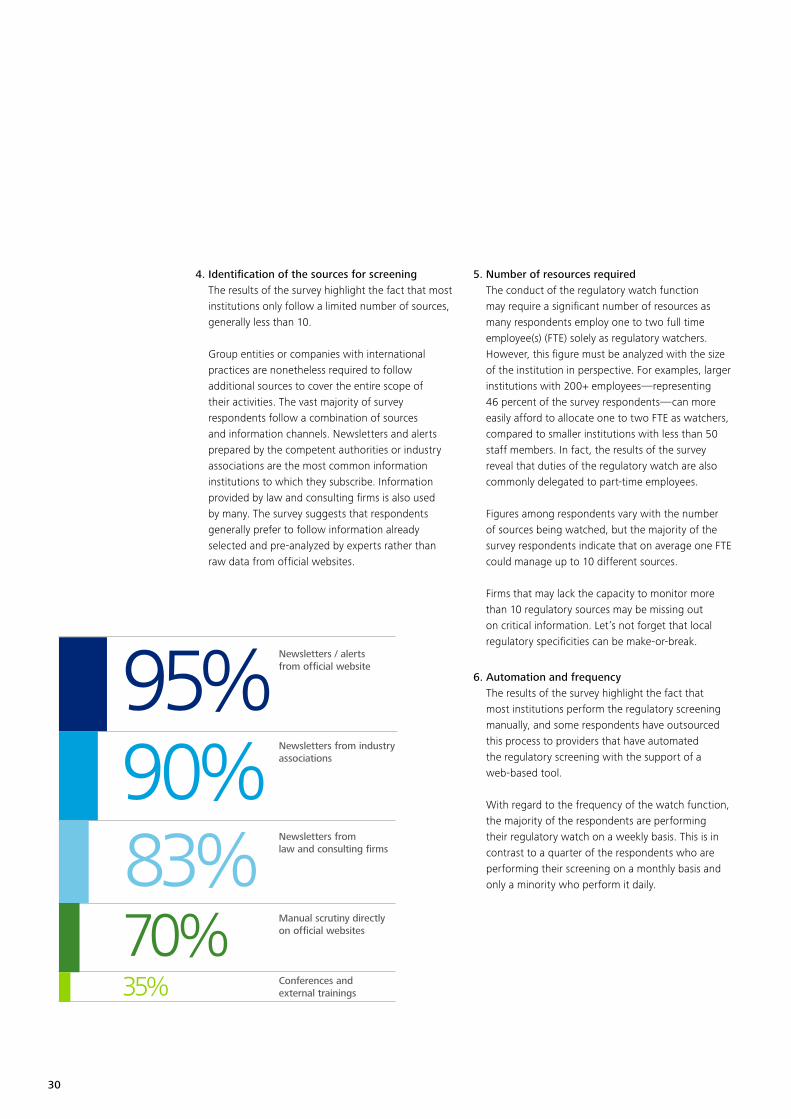
4. Identification of the sources for screening The results of the survey highlight the fact that most institutions only follow a limited number of sources, generally less than 10. Group entities or companies with international practices are nonetheless required to follow additional sources to cover the entire scope of their activities. The vast majority of survey respondents follow a combination of sources and information channels. Newsletters and alerts prepared by the competent authorities or industry associations are the most common information institutions to which they subscribe. Information provided by law and consulting firms is also used by many. The survey suggests that respondents generally prefer to follow information already selected and pre-analyzed by experts rather than raw data from official websites.
5. Number of resources required The conduct of the regulatory watch function may require a significant number of resources as many respondents employ one to two full time employee(s) (FTE) solely as regulatory watchers. However, this figure must be analyzed with the size of the institution in perspective. For examples, larger institutions with 200+ employees—representing 46 percent of the survey respondents—can more easily afford to allocate one to two FTE as watchers, compared to smaller institutions with less than 50 staff members. In fact, the results of the survey reveal that duties of the regulatory watch are also commonly delegated to part-time employees. Figures among respondents vary with the number of sources being watched, but the majority of the survey respondents indicate that on average one FTE could manage up to 10 different sources. Firms that may lack the capacity to monitor more than 10 regulatory sources may be missing out on critical information. Let’s not forget that local regulatory specificities can be make-or-break.
6. Automation and frequency The results of the survey highlight the fact that most institutions perform the regulatory screening manually, and some respondents have outsourced this process to providers that have automated the regulatory screening with the support of a web-based tool. With regard to the frequency of the watch function, the majority of the respondents are performing their regulatory watch on a weekly basis. This is in contrast to a quarter of the respondents who are performing their screening on a monthly basis and only a minority who perform it daily.
Newsletters / alerts from official website
Newsletters from industryassociations
Newsletters fromlaw and consulting firms
Manual scrutiny directlyon official websites
Conferences and external trainings
95%90%83%70%35%
31
7. Reporting of regulatory updates Only 20 percent of the survey respondents use a central repository as a tool for storing and sharing regulatory updates. In that context, most institutions use emails or arrange meetings to discuss regulatory changes. A combination of traditional communication channels are used by almost half of the survey respondents.
8. External service providers In a resource-constrained environment, where it is difficult to deprioritize any compliance-related task, freeing up time by using a regulatory watch service provider can be invaluable. In that sense, 75 percent of the survey respondents consider regulatory watch services valuable, while the remaining respondents would consider it depending on the scope and bespoke service. Moreover, the majority of the respondents have also expressed their interest in a tax watch and monitoring service, often to complement the regulatory watch function.
In fact, the increase in proactivity toward addressing negative regulatory changes is seen by many as the most important aspect of a regulatory watch and monitoring service.
Conclusion
A combined approach of compliance, regulatory watch, and business functions is essential to fully grasp the implications of upcoming regulations, mitigate risks, and prevent what might otherwise be huge compliance challenges.
When looking at the market, the survey has highlighted that only a minority of businesses currently employ a holistic approach to regulatory watch. However, the survey respondents have recognized its importance and are now considering a similar approach. In that regard, regulatory services providers can certainly provide valuable support to institutions overwhelmed with regulatory changes.
Only time will tell which institutions have successfully managed that transition and have turned regulations into competitive advantages.
To the point
• We have witnessed an unprecedented regulatory weight on financial institutions that have tried their best to cope with regulatory updates
• A flexible, efficient, holistic, and proactive approach to regulation can make changes more manageable. But one should keep in mind that one size does not fit all
• Deloitte’s survey reveals that most firms perform the source screening manually and do not use any tool or support from external parties
• The use of a global repository to share and store regulatory updates and analysis offers some great advantages
• Regulatory watch service providers can be invaluable for freeing up time and resources, allowing clients to refocus on core compliance issues
32
Capital Markets UnionWill it be a game-changer?Xavier ZaegelPartnerAdvisory & ConsultingDeloitte
Chris Stuart SinclairDirectorAdvisory & ConsultingDeloitte

33
How often can one say of something that it has the potential to be a game-changer?
It may seem a far cry from a general aspiration to create a more coherent and pan-European capital market to envisage the creation of a pan-European defined contribution pension market. One might even be forgiven for asking what the possible link may be, and one can feel a certain sympathy for the retirement, insurance, and pensions sector that asset management and financial markets are trying to “muscle in” in some way to their domain. And yet the process is a totally logical one.
We are however, getting ahead of ourselves. Capital Markets Union (CMU) is the title of a Green Paper issued soon after the Juncker European Commission took office.
The purpose of the Green Paper was to consult on the overall approach to put in place the building blocks for CMU by 2019, the underlying economic rationale of CMU, and possible measures that could be taken to achieve this objective.
The main areas that the Green Paper addressed were:
• Improving access to financing for all businesses across Europe and investment projects, in particular start-ups, SMEs and long-term projects
• Increasing and diversifying the sources of funding from investors in the European Union (EU) and all over the world
• Making the markets work more effectively so that the connections between investors and those who need funding are more efficient and effective, both within Member States and cross-border
The Green Paper and its subject are central to the ambitions and intentions of the Commission.
It has been entrusted to the Directorate-General Financial Stability, Financial Services and Capital Markets Union (rather strangely abbreviated to DG FISMA), which is the restructured and slimmed down DG that Lord Hill inherited from the previous larger organization headed by Michel Barnier.
In the foreword, there is a very clear and simple statement of intent: “In essence our task is to find ways of linking investors and savers with growth.”
The initial premise is quite simple. When Europe as a whole is compared to certain other developed countries—and here the only real direct comparison is the United States of course, although other cases can illustrate points in microcosm—it becomes abundantly clear that whereas Europe is very heavily dependent on the banking sector for the financing of the economy, especially the grass roots economy of PMEs and SMEs, the U.S. model relies much more heavily on alternative non-bank channels.
The Green Paper sketches out a certain vision of this current landscape in capital markets, makes reference to observations from other countries or regions, previous or current European initiatives, and invites comment specifically on certain questions that arise from these observations.

34
The reflection is articulated around five main themes (although one of the questions posed is if there is something significant that has been overlooked).
These themes are:
• Develop proposals to encourage high-quality securitization and free up bank balance sheets to lend
• Review the Prospectus Directive to facilitate firms, especially smaller ones, to raise funding and investors cross-border
• Start work on the transparency of SMEs, especially on credit information, to make it easier for investors to invest
• Put in place a pan-European Private Placement Regime to encourage direct investment into smaller businesses
• Support the take up of the new European Long Term Investment Fund (ELTIF) to channel investment in infrastructure and other long-term projects
In addition, accompanying these major sections, there are sub-sets of questions around these themes that invite responses on points as diverse as how to increase retail purchases of UCITS on a cross-border basis, crowdfunding, and the effectiveness of the European Supervisory Authorities (ESAs). In many ways, it is the free expression that these questions invite that is the most interesting aspect of this exercise. For if one is to stop at the major themes as they are articulated, then the results could be far from those hoped for.
Securitization, which seems to be viewed in a way as “low hanging fruit,” is a subject fraught with perils (securitization was not totally alien to the woes of 2008 and the notion of quality is relative—many of the dubious securitizations in 2008 had a triple A rating!) Furthermore, the fact that the Green Paper specifically envisages freeing up bank balance sheets for lending could be seen either as a sop to the banking sector or an admission that genuinely alternative sources of funding are likely to be unacceptable to the banking and, more importantly, the banking regulatory lobby.

35
Clearly it is the way people responded to these questions that is in the first instance of great interest and the way in which the Commission will look at those answers in another that can make or break the whole exercise. If the Commission is only prepared to consider a narrow spectrum of opinion around its analysis, and follow on the implicit assumption that this is fine-tuning rather than revolutionary, then the impacts will be relatively limited.
In many respects the language in which the questions are phrased is interesting, and begs the question how it should be interpreted. Take, for example, the question related to the two investment vehicles EuSEF and EuVECA:
“14) Would changes to the EuVECA and EuSEF Regulations make it easier for larger EU fund managers to run these types of funds? What other changes if any should be made to increase the number of these types of fund?”
Anyone coming to that question without prior exposure to the details of the EuSEF and EuVECA vehicles might be forgiven for assuming that we are talking about fine-tuning. The truth is that, if not exactly failures, both vehicles have a long, long way to go before they live up to anything like the hopes that accompanied their launch. Luxembourg is, to say the least, a recognized fund centre. It attracts funds across most asset classes and disciplines, from infrastructure to private equity, passing through all shades of alternatives and of course UCITS. As is often repeated, it is the second largest fund market in the world after the United States. It is never a laggard in adopting new legislation, nor is it tardy in seeing commercial possibilities.
The EuVECA regulation was enacted on the 17 April 2013 and came into force as from the 22 July 2013. We have had to wait until July 2015 to see the first EuVECA fund launched in Luxembourg. The picture is similar in EuSEFs. It is probably a little unkind to describe the two products as solutions looking for a problem, but certainly their scope of reference was so narrowly drawn, and in some instances with the introduction of a social dimension, bringing with it unnecessary levels of complexity, that they can hardly be described as a roaring success. This also alas despite some features
that are very interesting and that could indeed be usefully transferred to other products in the promotion of the aims outlined by the Green Paper. The tone of the question, however, suggests everything is fine but just could be improved. The politically correct responses would have been—“yes, wonderful product, just needs nudging in this or that direction,” hoping that the Commission would be ready to read between the lines. The true response would be as suggested above: it is not working, but here are the positive aspects and here is what is needed to make the product a success.
If this is an issue already for these two specialized vehicles, it is true to the power of n for ELTIFs that also figure prominently in this consultation. These are considered a cornerstone to Commission policy, but so far have not exactly set the markets alight in anticipation (despite the fact that, once again, there are some very interesting features proposed).
If this is a concern—how serious the Commission is in hearing the truth (or at least a truth that might not be that that has dominated much of recent debate) and doing something meaningful rather than being the guardian of the politically correct—with respect to detail such as the case quoted above, how much more fundamental it is with regard to some of the debates at the very heart of the question of capital market efficiency and scope— “shadow banking.”
The whole issue of shadow banking lurks like Banquo’s ghost throughout the consultation. Many of the positive examples and quasi-suggestions drawn from other countries fall directly within what the EBA, ECB, and probably a good part of EcoFin would probably term “shadow banking.”
In essence our task is to find ways of linking investors and savers with growth

36
This is hardly surprising; the analysis itself concludes that Europe is more dependent on banking for the medium- and long-term funding of the economy than other countries or regions. It postulates that growth can be stimulated by copying such models and facilitating access to alternative sources of funding. Ergo—shadow banking by any other name. And that brings us to the crux of the matter. Is the Commission prepared to challenge some of the things that have become accepted wisdom by so much of the Brussels establishment or is this Green Paper merely an exercise in consultation?
So the Green paper is an exercise itself that tends to leave one a little dubitative. It looks ambitious, it covers much, but its language can be interpreted in many different ways. In some ways, it seems over self-congratulatory of what has gone before; perhaps that is inevitable as it could hardly be overtly critical of previous initiatives.
However, when one considers the references to EuVECA and EuSEFs as we have discussed, or to ELTIFs there is an inescapable feeling of “the Emperor’s New Clothes.” Some of the identified “low hanging fruit”—and most notably securitizations—are fraught with potential difficulties. At the same time, there is apparently a refreshing willingness to look at issues dispassionately, and to even tackle some of the “sacred cows” of recent years. The Green Paper does invite comment
on Insolvency II and the levels of capital requirements it imposes; the Green Paper does venture into the minefield of shadow banking even if it does not use the name; and it does ask if some of those elements that have been anathema hitherto may not have a role to play in developing a capital markets union. What should one believe?
The timeline on this consultation is very ambitious. It is intended that having evaluated the responses received over the summer, the Commission will be in a position to publish a draft action plan when the institutions return from the summer recess sometime around September or October. If this timeframe can be maintained, then we shall not have long to wait to see which way the wind blows.
Technically that draft will be a plan; it is not intended that there should be one single big CMU Directive or piece of legislation but rather modifications and addenda to existing texts with some additional new ones as required. Among the 700 responses one can find a wide range of opinion. It will come as a surprise to noone that the ECB does not necessarily see things in exactly the same light as AIMA or, for that matter, the UK government. Choosing specific responses runs the risk of taking wishes for reality and focusing on subjects that may never get beyond the consultation phase. However, two themes of fundamental importance did seem to appear quite a lot.
The first of these was a desire to revisit, in as safe an environment as possible, the capital requirements of Solvency II, widely considered as a straitjacket that may have profound detrimental effects on insurance and, by association, pension investment in private equity.At least the issue is recognized and placed center stage.
The Green Paper and its subject are central to the ambitions and intentions of the Commission

37
The Commission asked the question:
“12) Should work on the tailored treatment of infrastructure investments target certain clearly identifiable sub-classes of assets? If so, which of these should the Commission prioritise in future reviews of the prudential rules such as CRDIV/CRR and Solvency II?”
It has received its response. It will be interesting to see what it does with it. The second, enticingly, is the suggestion that the best way to stimulate cross-border retail fund purchases is to implement a pan-European defined contribution pensions scheme. So let us dream for a moment. Let us imagine that the Commission takes on board the suggestions that a sponsored defined contribution retirement scheme should be a priority.
The arguments that may lead them to this conclusion are seductive; countries with such schemes in place see a marked upswing in investment in funds (around the low to mid 30 percent of retail investors—or even more versus Europe’s current 11 percent); markets with such schemes tend to be more resilient and recover faster from upsets as there are committed flows, month in month out.
The arguments are many, the negations—save for the difficulty of formulating and launching such a scheme—few. The benefits of finally addressing the retirement/pensions issue huge.
The secondary benefits within growth aspirations are equally enticing. They would answer in a single strategy the Commission’s concerns for ELTIFs, for example, if such a product were to find its natural and rightful place as only a small part of a savings market designed to serve the needs of over 460 million people. It might not be popular, but something coming from Brussels and seen as European, for all the disconnect that has set in between “Europe” and its citizens, is easier to implement for some somewhat paradoxical reason than homegrown reform.
Closing the funding gap on the pension time bomb cannot happen overnight. But that is hardly a reason for doing nothing. A Chinese proverb says that the best time to plant a tree was twenty years ago. The second best time is today.
A possible outcome or an impossible dream. Time will tell. Capital Markets Union may go down in history as the most important innovation since the Marshall Plan, or it may be relegated as a footnote to history as another experiment in integration that fell short of its anticipated objectives. In any event, the opportunity is too good to allow to pass in apathy, and if as an industry—however it is defined—does not throw itself heart and soul into this debate, it can only blame itself for a wasted opportunity.
To the point
• The first major plan since the Financial Services Action Plan from the 1970s
• Potentially forward looking planning rather than reactive legislation
• Openly recognises some key issues—Solvency II, CRD IV
• Has received over 700 responses
• Has the potential to positively shape European growth in the next decades
• Will require courage and perseverance to implement

38
39
Lou KieschPartnerAdvisory & ConsultingDeloitte
Chris Stuart SinclairDirectorAdvisory & ConsultingDeloitte
AIFMD reporting surveyWhat lies ahead, what went before
40
In response to the last financial crisis, there has been a global regulatory drive for greater financial transparency, and reporting schemes such as those under the European Market Infrastructure Regulation (EMIR), Markets in Financial Instruments Regulation (MiFIR), Packaged Retail and Insurance-based Investment Products (PRIIPS), Solvency II, and the Alternative Investment Fund Managers Directive (AIFMD) were put in place with this in mind.
The first round of AIFMD reporting is now behind us, providing a good opportunity to take a step back and consolidate our findings and experiences of the process. Certainly, there is still much ongoing discussion concerning the use and nature of the data collected, but while this debate continues, the survey results from this first round give a preliminary understanding of the reporting process and allow for the development of a more strategic approach for future iterations.
Whether the future reporting requirements of AIFMD will remain the same or not is uncertain and depends on the evaluation of regulatory authorities as well as on the maintenance of an ongoing dialogue between fund managers and regulators.
What is more certain is that the production landscape certainly warrants change, as our recent survey suggests.
In addition to these immediate conclusions, in a broader AIFMD perspective, the survey results also give indications of how important the distribution of non-EU products remains for asset managers and of the level of challenge they will potentially have to face once the European Securities and Markets Authority (ESMA) decides on the future direction of the AIFMD passport for non-European managers and funds.

41
The AIFMD reporting survey
Survey participantsThe survey was sent out to over 150 registered/ authorized alternative investment fund managers (AIFMs), with the majority located in Luxembourg and the rest located in the UK, France, Ireland and Belgium. Nearly two-thirds of all respondents qualified as “Universal ManCos,” also referred to as “Super ManCos,” which hold both a UCITS and AIFM license.
One-third of participants qualified as registered or authorized AIFMs and a small remaining portion fell under the all-encompassing category of “other” alternative investment fund managers. Of the funds captured by the AIFMD, less than 25 percent followed pure alternative strategies. The majority were split equally between plain vanilla funds and multi asset classes. One of the main criticisms of the AIFMD is precisely that it may be too comprehensive, capturing all alternative investment funds (AIFs) irrespective of asset class or strategy, provided the fund is not a UCITS.
Figure 1: Main strategy of AIFs managed
Plain vanilla funds*
Alternative strategies
Multi asset classes
* Plain Vanilla funds are also referred to in the document as UCITS “look-alikes”. They are funds that
are similar in investment strategy and most respects to UCITS funds but are not subject to the more
constraining UCITS Investment Restriction rules. They are the former Part II funds, and SIFs that follow
essentially “long only” investment strategies in recognised UCITS-like asset classes and sectors.
38,5%38,5%
23,1%
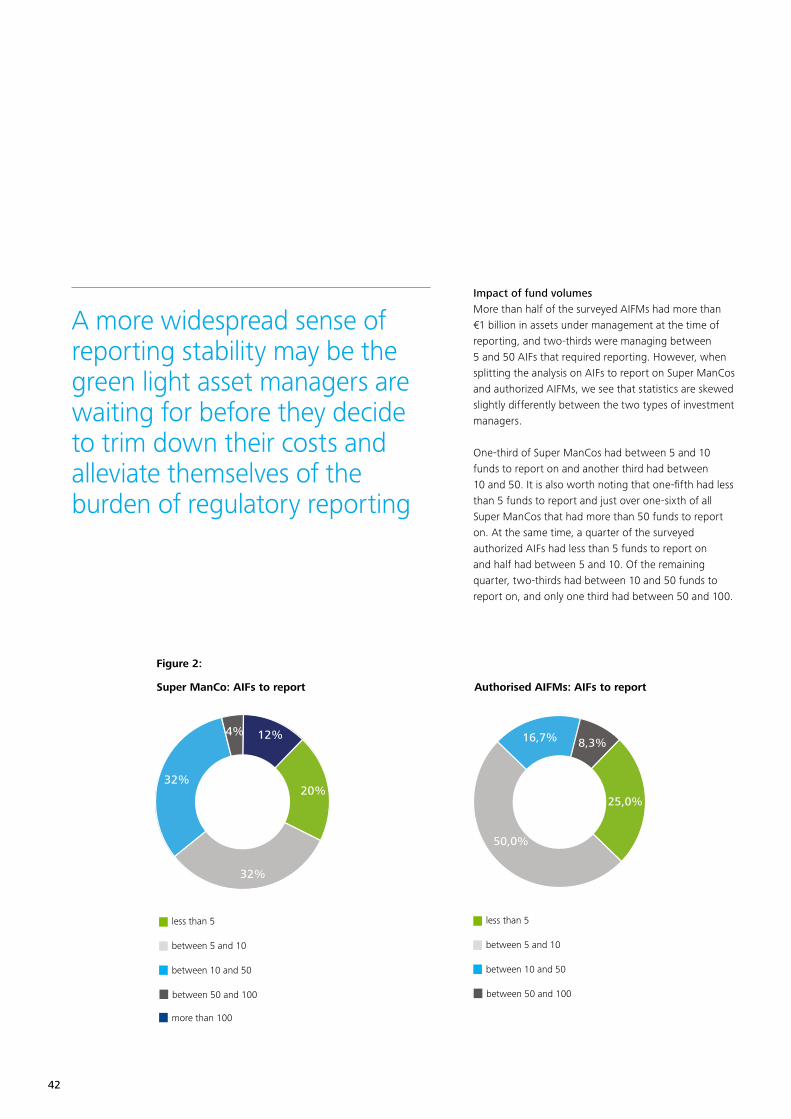
42
Impact of fund volumesMore than half of the surveyed AIFMs had more than €1 billion in assets under management at the time of reporting, and two-thirds were managing between 5 and 50 AIFs that required reporting. However, when splitting the analysis on AIFs to report on Super ManCos and authorized AIFMs, we see that statistics are skewed slightly differently between the two types of investment managers.
One-third of Super ManCos had between 5 and 10 funds to report on and another third had between 10 and 50. It is also worth noting that one-fifth had less than 5 funds to report and just over one-sixth of all Super ManCos that had more than 50 funds to report on. At the same time, a quarter of the surveyed authorized AIFs had less than 5 funds to report on and half had between 5 and 10. Of the remaining quarter, two-thirds had between 10 and 50 funds to report on, and only one third had between 50 and 100.
Super ManCo: AIFs to report Authorised AIFMs: AIFs to report
27%
13%
25,0%
50,0%
16,7% 8,3%
20%
32%
32%
4% 12%
27%
13%
25,0%
50,0%
16,7% 8,3%
20%
32%
32%
4% 12%
less than 5less than 5
between 5 and 10between 5 and 10
between 10 and 50between 10 and 50
between 50 and 100between 50 and 100
more than 100
A more widespread sense of reporting stability may be the green light asset managers are waiting for before they decide to trim down their costs and alleviate themselves of the burden of regulatory reporting
Figure 2:
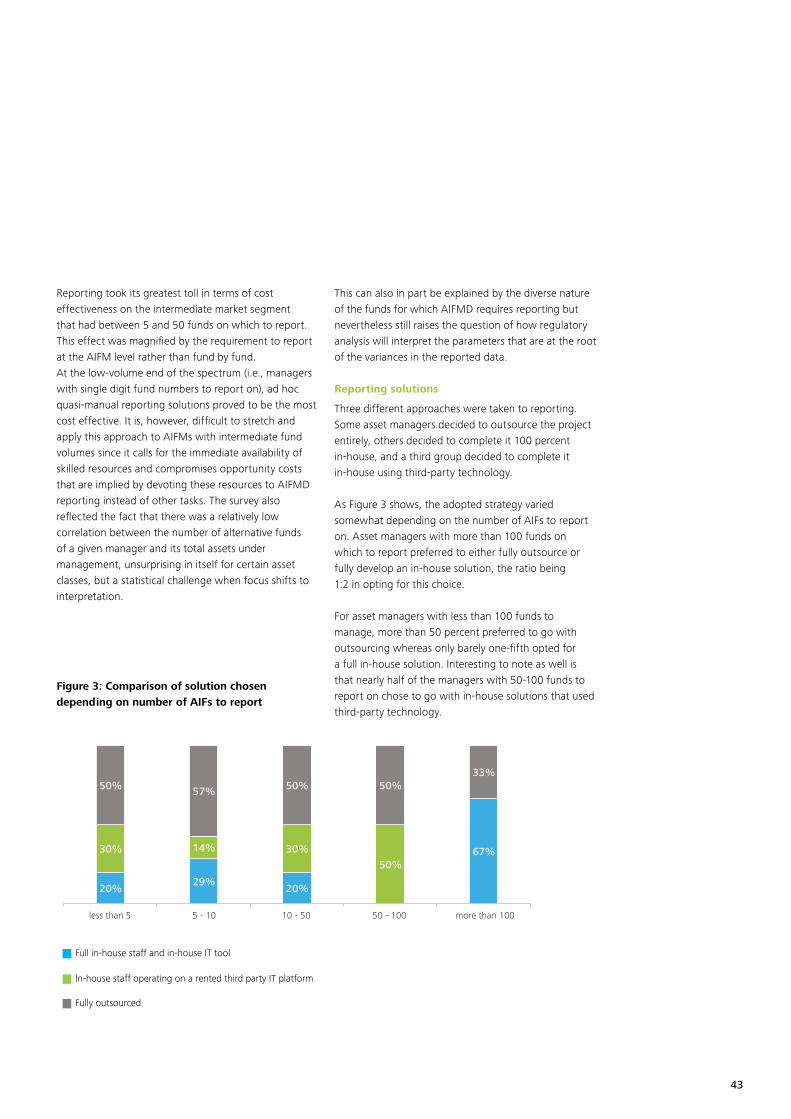
43
Reporting took its greatest toll in terms of cost effectiveness on the intermediate market segment that had between 5 and 50 funds on which to report. This effect was magnified by the requirement to report at the AIFM level rather than fund by fund. At the low-volume end of the spectrum (i.e., managers with single digit fund numbers to report on), ad hoc quasi-manual reporting solutions proved to be the most cost effective. It is, however, difficult to stretch and apply this approach to AIFMs with intermediate fund volumes since it calls for the immediate availability of skilled resources and compromises opportunity costs that are implied by devoting these resources to AIFMD reporting instead of other tasks. The survey also reflected the fact that there was a relatively low correlation between the number of alternative funds of a given manager and its total assets under management, unsurprising in itself for certain asset classes, but a statistical challenge when focus shifts to interpretation.
This can also in part be explained by the diverse nature of the funds for which AIFMD requires reporting but nevertheless still raises the question of how regulatory analysis will interpret the parameters that are at the root of the variances in the reported data.
Reporting solutions
Three different approaches were taken to reporting. Some asset managers decided to outsource the project entirely, others decided to complete it 100 percent in-house, and a third group decided to complete it in-house using third-party technology.
As Figure 3 shows, the adopted strategy varied somewhat depending on the number of AIFs to report on. Asset managers with more than 100 funds on which to report preferred to either fully outsource or fully develop an in-house solution, the ratio being 1:2 in opting for this choice.
For asset managers with less than 100 funds to manage, more than 50 percent preferred to go with outsourcing whereas only barely one-fifth opted for a full in-house solution. Interesting to note as well is that nearly half of the managers with 50-100 funds to report on chose to go with in-house solutions that used third-party technology.
Figure 3: Comparison of solution chosen depending on number of AIFs to report
20%29%
20%
67%30% 14% 30%
50%
50% 57% 50% 50%33%
less than 5 5 - 10 10 - 50 50 - 100 more than 100
Full in-house staff and in-house IT tool
In-house staff operating on a rented third party IT platform
Fully outsourced

44
33%
63%
4%
as expected
more difficult
simpler
Figure 4: How was the experience of producing AIFMD reports?
The costs
OverviewWhen it comes to estimating total costs for AIFMD reporting, the exercise is less straightforward than a simple assessment of the overt and billable costs. Indeed, the reporting also contains hidden internal costs such as the cost of staff engaged on the activity and the opportunity cost for allocating qualified staff like this the AIMFD reporting task instead of other activities.
Nonetheless, according to our survey results, the cost appraisals that had been carried out prior to reporting proved to be spot on since the majority of asset managers disclosed that reporting costs had fallen within the estimated ball park.
Having said this, our survey results also show that the experience of producing the reports was judged to have been far more difficult than anticipated, with 63 percent of asset managers backing this opinion. Taking the two together, we would seem to have seen either significant padding of budgets for contingency or significant under-estimation of internal costs.
In all probability, this suggests that the full costs in terms of time commitment and internal resource allocation have not been fully taken into account.
Four years ago when AIFMD was conjured up by the European Commission, Deloitte carried out a preliminary survey on the directive. One of the questions in this survey asked asset managers who was going to cover the implicit costs. 58 percent of AIFMs replied that they would be responsible for covering costs. However, when asked the same ques-tion this time round, only 42 percent of AIFMs replied that they will be covering the full extent of the costs, and another 25 percent believe the costs will be shared between the AIFMs and the AIFs.
Resource allocation costsThe greatest portion of total costs were due to staff allocation and the time spent reporting, with a clear correlation between the amount of staff assigned to work on the reporting and the number of funds to be reported on by the manager. Figure 5 clearly shows that there are two extremes to this scenario, where, depending on the number of AIFs, either very low levels or very high levels of staff were assigned to the reporting task. These staff distributions are similar to those that were assigned to the reporting task on a recurring basis. When comparing this distribution to that in Figure 3, we can suggest that the managers managing between 5 and 50 AIFs and using a partial or full in-house solution were likely to be those that were forced to engage a higher task force.
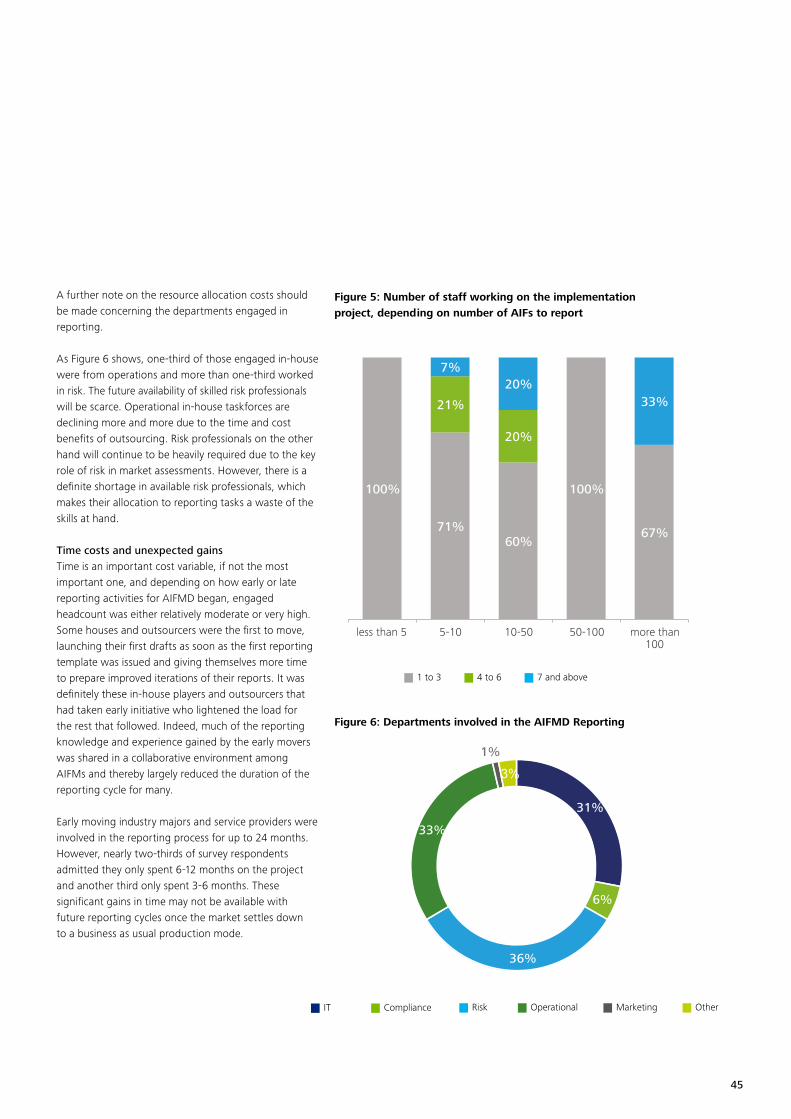
45
A further note on the resource allocation costs should be made concerning the departments engaged in reporting.
As Figure 6 shows, one-third of those engaged in-house were from operations and more than one-third worked in risk. The future availability of skilled risk professionals will be scarce. Operational in-house taskforces are declining more and more due to the time and cost benefits of outsourcing. Risk professionals on the other hand will continue to be heavily required due to the key role of risk in market assessments. However, there is a definite shortage in available risk professionals, which makes their allocation to reporting tasks a waste of the skills at hand.
Time costs and unexpected gainsTime is an important cost variable, if not the most important one, and depending on how early or late reporting activities for AIFMD began, engaged headcount was either relatively moderate or very high. Some houses and outsourcers were the first to move, launching their first drafts as soon as the first reporting template was issued and giving themselves more time to prepare improved iterations of their reports. It was definitely these in-house players and outsourcers that had taken early initiative who lightened the load for the rest that followed. Indeed, much of the reporting knowledge and experience gained by the early movers was shared in a collaborative environment among AIFMs and thereby largely reduced the duration of the reporting cycle for many.
Early moving industry majors and service providers were involved in the reporting process for up to 24 months. However, nearly two-thirds of survey respondents admitted they only spent 6-12 months on the project and another third only spent 3-6 months. These significant gains in time may not be available with future reporting cycles once the market settles down to a business as usual production mode.
Figure 5: Number of staff working on the implementation project, depending on number of AIFs to report
Figure 6: Departments involved in the AIFMD Reporting
100%
71%60%
100%
67%
21%
20%
7%20%
33%
less than 5 5-10 10-50 50-100 more than100
1 to 3 4 to 6 7 and above
IT Compliance Risk Operational Marketing Other
31%
6%
36%
33%
1%
3%

46
What additional hurdles were faced in the first round of AIFMD?
There are a few points that came to everyone’s attention either at the last minute or once reports were submitted. In essence, they constitute minor bumps in the process of first-round reporting attempts, and we hope to see them smoothed out in future. Some of these included ambiguities in reporting requirements, such as a general misunderstanding concerning the correct definition of the term “optional,” which we now understand to mean “if relevant” and not “if you would like to include”! Other more technical difficulties included the actual delivery of the data. Some regulators were not ready to receive the reports when the deadline was up, and, in other cases, there were complications for AIFMs that had to report in several jurisdictions. Indeed, although reporting templates were standardized throughout Europe (except for the UK where the FCA decided to use the first template provided by the ESMA instead of the second), validation protocols were not standardized—a situation that unfortunately caused some turmoil in several jurisdictions.
What does the future of AIFMD reporting hold?
Survey results clearly point out that the most cost-effective solution will depend on the scale to report on, and asset managers need to evaluate whether or not the choice of meeting the burden with internal resources and time is a beneficial one.
Future reporting cycles may or may not be as quick depending on the interest in going forward collectivelyand sharing reporting insights, and the degree of change management—either in the reporting itself or with the introduction of new product. Either way, a transversal approach to the required data management is necessary since AIFMD is not a regulatory initiative that stands in isolation. The most cost-efficient solution is surely to consolidate reporting efforts with the ongoing EMIR, MIFIR, KIID, PRIIPS, and Solvency II, which rely on the same or similar data sources.Certain general conclusions emerge from the work we have done that also point the way for the future. There is still a need for improvement in the data acquisition processes to get the required data to the relevant regulator and on to ESMA. There is a need for transparency as to what the recipient regulators and ESMA intend to do with the data. Some of the data sets may need revision to ensure that they are relevant and to avoid contaminating data sets with irrelevant information from different asset classes.
There is a need for transparency as to what the recipient regulators and ESMA intend to do with the data

47
Another very interesting conclusion to draw is that many AIFMs are not backing off from the distribution of non-EU products, notwithstanding the increase in reporting and compliance complexity. Indeed, the sample reports on a relatively high number of non-EU funds, especially for Luxembourg and the UK. This falls in line with a general opinion among asset managers concerning the potential extension of the passport to non-European entities that predicts that the passport will be more easily attainable for EU AIFMs with non-EU products than for solely non-EU structures, and we still have a way to go before we can anticipate the replacement of private placements with the passport. For many asset managers national placement regimes are working. This will add renewed energy to those calling for a continuance of the two regimes in parallel.
When asked whether they would consider outsourcing as a feasible solution in the future, 72 percent of the asset managers that replied answered “yes.” Between this general statement, however, and a move to outsource a number of impediments were noted and raised. Indeed, when questioned on their hesitation to outsource, many managers responded with a reluctance to separate production from responsibility at this stage of AIFMD maturity. Undeniably, ultimate liability will remain with the AIFM, but, nonetheless, there is an abundance of examples where the separation of task execution and responsibility was carried out successfully in the past; there is no reason why AIFMD reporting should be an exception. Debate remains open on whether or not the AIFMD reporting template will change, both in scope and content. This debate, of course, contributes to a certain atmosphere of apprehension with regard to future alterations to the reporting agenda and format. Thus, a more widespread sense of reporting stability may be the green light asset managers are waiting for before they decide to trim down their costs and alleviate themselves of the burden of regulatory reporting.
To the point
• Each entity encountered and resolved its own raft of issues—outsource providers encountered and resolved all of them. As the second cycle kicks in, as definitions, transmission protocols, and interpretations evolve and change, the outsource providers by definition must stay on top of them. The success of the first cycle was the result of a large degree of mutualization. A similar level of mutualization going forward will only be available in full through the outsource option
• There is the significant reporting activity on behalf of funds distributed under NPRs (National Placement Regimes), possibly a real surprise in terms of volume and the take up of this distribution option
• There are the complex cost/efficiency dynamics as they apply to a “sector” as diverse as AIFs. It has been said that many times that one size does not fit all, and yet we have a reporting universe that spans the spectrum from low volume, high AUM closed-ended funds to high volume, open-ended algorithmically traded funds. Each has its own dynamics and requirements. More work now needs to be done on finding a lasting cost-effective solution for the outliers to the reporting process
• AIFMD reporting is a huge step into a world in which transparency is an ever more pressing requirement. Just recently, the SEC announced its upcoming Investment Company Reporting Rules within the context of the ongoing market reforms following on from the Dodd-Frank Act. Never has there been a time when flexible, accurate, appropriate, and timely reporting was more important in the pursuit of success in international fund markets
48
AIFMD–Timefor reflectionand extensionESMA release their advice and opinionAisling CostelloSenior ManagerInvestment ManagementDeloitte
Paola Liszka-DraperSenior ManagerAdvisory & ConsultingDeloitte
Ciara SmithSenior ManagerInvestment ManagementDeloitte
After much debate, the Alternative Investment Fund Managers Directive (AIFMD) became a reality and entered into force on 21 July 2011. AIFMD provides the framework within the European market for the cross-border distribution of Alternative Investment Funds (AIFs). The key challenge is to understand the practicalities of not only how to comply with the Directive but also how to continue to raise capital.

49
Distribution
AIFMD, like UCITS, has introduced the notion of a passport enabling European Alternative Investment Fund Managers (AIFMs) to offer their management services and to market their European AIFs to professional investors throughout the European Union. For the purposes of AIFMD, professional investors are those that are defined as professional clients under the Markets in Financial Instruments Directive (MiFID).
National Private Placement Regimes
AIFMD mandates that an EU AIFM which wishes to market non-EU AIFs within the European Union must make separate applications (AIFMD Article 36 notifications) per fund to the individual host state regulators. Similar individual applications are required for non-EU AIFMs wishing to market either EU or non-EU AIFs across Europe (AIFMD Article 42 notifications). This marketing system is called the National Private Placement Regime (NPPR).

50
ESMA publications: opinion and advice
On 28 July 2015, a week later than expected, ESMA released their highly anticipated opinion on the potential extension of the European Passport to Non EU AIF’s/AIFM’s. The extension of the passport to a non-EU jurisdiction would allow alternative investment managers to gain access to European investors without the restrictions of the NPPR. The NPPR is scheduled to be reviewed by ESMA for 2018, however, it is important to note that each individual jurisdiction may choose to withdraw their private placement regimes at any point prior to this date. This becomes relevant for those managers still wishing to avail of NPPR currently as Germany has stated its intention to withdraw the regime as soon as non-EU manager passports become available1.
Having previously stated their intention to extend the passport in stages, there was no surprise as to the structure of ESMA’s opinion.
However, there was uncertainty in the industry regarding which countries were being assessed by ESMA and which would receive the passport. In the months prior to the publication, regulatory authorities in both the Cayman Islands and Bermuda publicized their legislative changes in order to position themselves for the passport. It transpired that only two countries, Guernsey and Jersey, received the recommendation for the “third country” passport, with Switzerland endorsed subject to the enactment of pending legislation.
In addition to the above opinion, ESMA also released its advice on the functioning of the AIFMD in the year since it came into force. ESMA advised that as AIFMD was still in embryonic stages, they recommend that more time elapse before they comment in detail on the success of AIFMD. They did, however, note that there was a lack of consistency on the operation of AIFMD between Member States.
1 http://cooconnect.com/news/aifmd-passports-for-the-channel-islands-and-switzerland-could-backfire
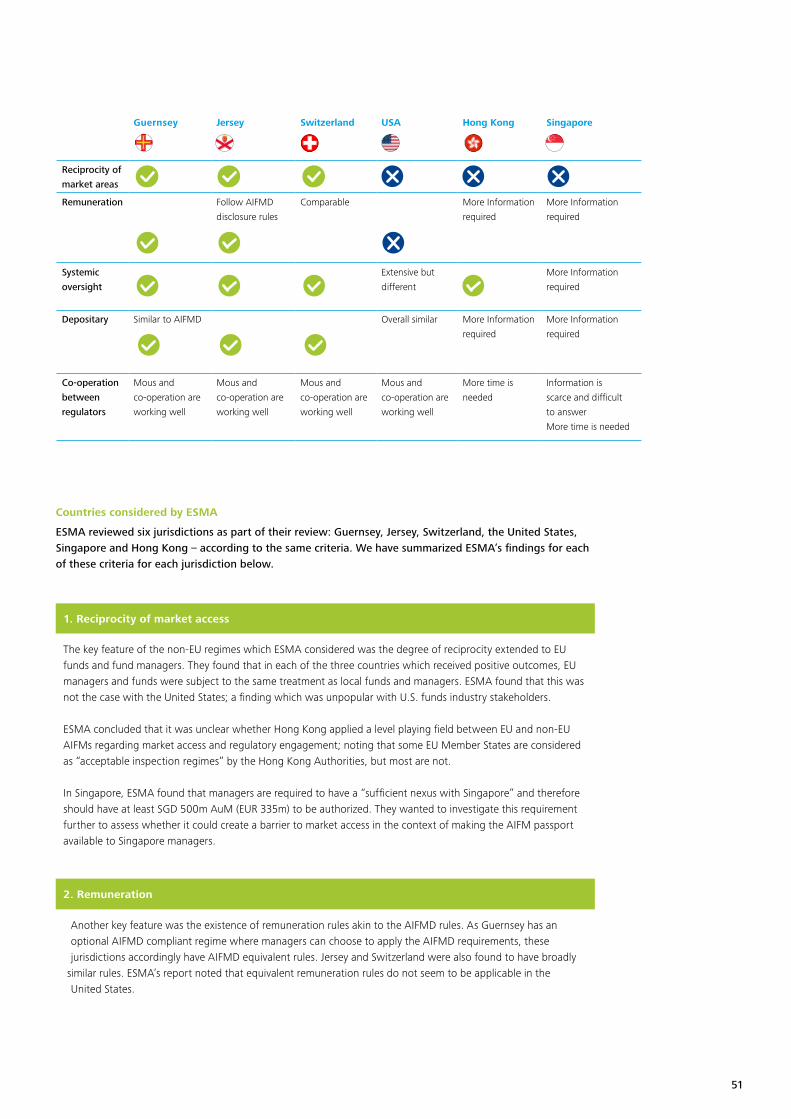
51
1. Reciprocity of market access
The key feature of the non-EU regimes which ESMA considered was the degree of reciprocity extended to EU funds and fund managers. They found that in each of the three countries which received positive outcomes, EU managers and funds were subject to the same treatment as local funds and managers. ESMA found that this was not the case with the United States; a finding which was unpopular with U.S. funds industry stakeholders.
ESMA concluded that it was unclear whether Hong Kong applied a level playing field between EU and non-EU AIFMs regarding market access and regulatory engagement; noting that some EU Member States are considered as “acceptable inspection regimes” by the Hong Kong Authorities, but most are not.
In Singapore, ESMA found that managers are required to have a “sufficient nexus with Singapore” and therefore should have at least SGD 500m AuM (EUR 335m) to be authorized. They wanted to investigate this requirement further to assess whether it could create a barrier to market access in the context of making the AIFM passport available to Singapore managers.
2. Remuneration
Another key feature was the existence of remuneration rules akin to the AIFMD rules. As Guernsey has an optional AIFMD compliant regime where managers can choose to apply the AIFMD requirements, these jurisdictions accordingly have AIFMD equivalent rules. Jersey and Switzerland were also found to have broadly
similar rules. ESMA’s report noted that equivalent remuneration rules do not seem to be applicable in the United States.
Countries considered by ESMA
ESMA reviewed six jurisdictions as part of their review: Guernsey, Jersey, Switzerland, the United States, Singapore and Hong Kong – according to the same criteria. We have summarized ESMA’s findings for each of these criteria for each jurisdiction below.
Guernsey Jersey Switzerland USA Hong Kong Singapore
Reciprocity of
market areas
Remuneration Follow AIFMD
disclosure rules
Comparable More Information
required
More Information
required
Systemic
oversight
Extensive but
different
More Information
required
Depositary Similar to AIFMD Overall similar More Information
required
More Information
required
Co-operation
between
regulators
Mous and
co-operation are
working well
Mous and
co-operation are
working well
Mous and
co-operation are
working well
Mous and
co-operation are
working well
More time is
needed
Information is
scarce and difficult
to answer
More time is needed
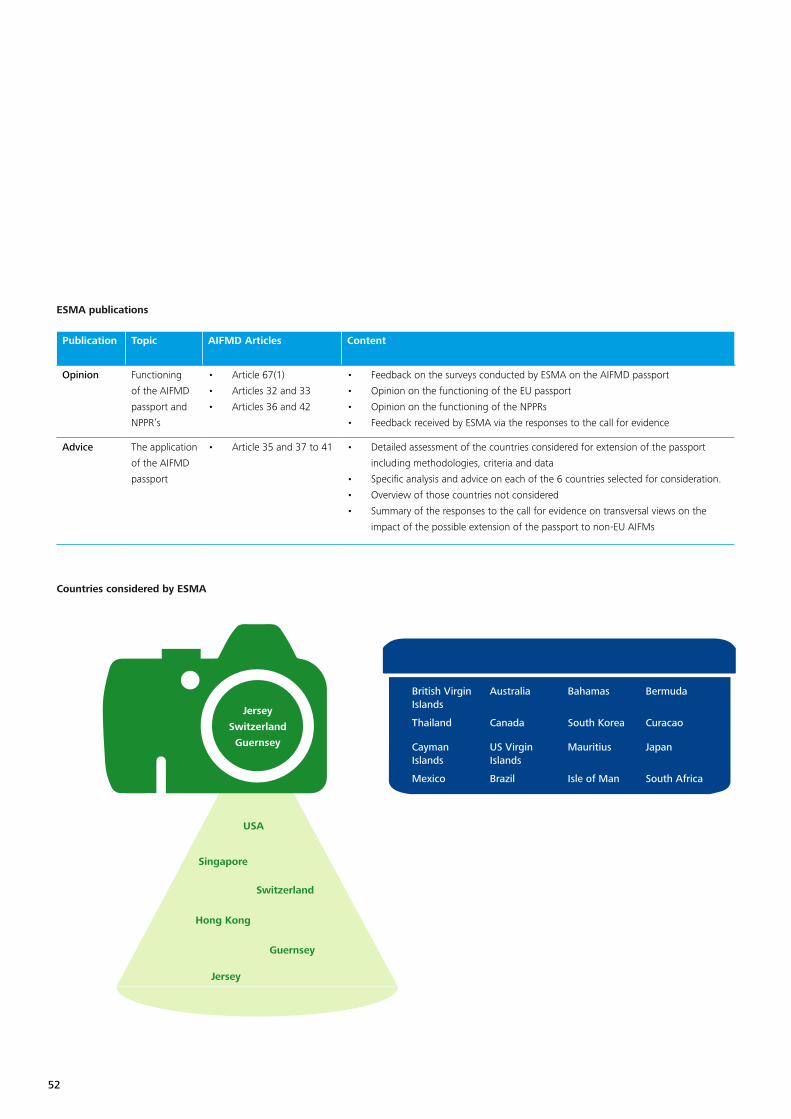
52
Publication Topic AIFMD Articles Content
Opinion Functioning
of the AIFMD
passport and
NPPR’s
• Article 67(1)
• Articles 32 and 33
• Articles 36 and 42
• Feedback on the surveys conducted by ESMA on the AIFMD passport
• Opinion on the functioning of the EU passport
• Opinion on the functioning of the NPPRs
• Feedback received by ESMA via the responses to the call for evidence
Advice The application
of the AIFMD
passport
• Article 35 and 37 to 41 • Detailed assessment of the countries considered for extension of the passport
including methodologies, criteria and data
• Specific analysis and advice on each of the 6 countries selected for consideration.
• Overview of those countries not considered
• Summary of the responses to the call for evidence on transversal views on the
impact of the possible extension of the passport to non-EU AIFMs
Jersey
Switzerland
Guernsey
USA
Singapore
Countries considered by ESMA
ESMA publications
Switzerland
Hong Kong
Guernsey
Jersey
British Virgin Islands
Australia Bahamas Bermuda
Thailand Canada South Korea Curacao
CaymanIslands
US Virgin Islands
Mauritius Japan
Mexico Brazil Isle of Man South Africa

53
3. Systemic oversight
Systemic oversight was another of the critical features. ESMA are confident that the three successful jurisdictions have equivalent regimes and that cooperation between the authorities of those jurisdictions and with EU authorities are working well.
Reporting on their review of the United States, ESMA noted that the reporting requirements were significant, but differed from AIFMD. It added that it could have benefited from having more time to assess the detailed information it received on the U.S. regulatory framework, particularly to allow ESMA to analyze whether the differences between the U.S. regulatory framework and AIFMD would affect their present assessment.
Reporting on the Singapore regime, ESMA found that overall, the requirements in terms of investor protection seem to be fulfilled. The FSAP Report concluded that the Singapore authorities are strict when it comes to market entry and that the authorization process is detailed – however, the follow up and ongoing supervision does not keep those high standards. This might lead to difficulties with reporting and monitoring of systemic risk.
ESMA delivered a positive opinion on the Hong Kong authority’s regulatory oversight with respect to the range of intermediaries and vehicles operating in Hong Kong.
4. Depositary regime
In Guernsey, the AIFMD opt-in includes identical depositary requirements; while the original trustee oversight system for open ended funds resembles AIFMD. Jersey’s depositary requirements follow the IOSCO principles which are similar to the AIFMD requirements. A Jersey depositary will therefore need to comply with AIFMD as well as local requirements. Overall, Switzerland’s depositary requirements are similar to those under AIFMD.
In the United States, ESMA found that mutual funds must place and maintain assets with a qualified custodian. However, certain funds qualify for ‘self-custody’ under U.S. rules; ESMA noted that these funds would not be appropriate for the EU passport.
5. Co-operation among national competent authorities
Guernsey, Switzerland, the United States and Jersey all received commendable reports on their interaction with national competent authorities (NCAs). ESMA reported that the feedback from NCA’s on interaction with the Hong Kong authorities was ‘in general terms, positive’, while the information available on the interaction with the Singapore authorities was scarce and difficult to address.
54
Jurisdictions not considered
The jurisdictions which were not considered by ESMA were arguably more significant in terms of impact. One of most notable being Cayman Islands, especially given Cayman domiciled funds use the NPPR’s more than any other jurisdiction. This will have implications for the hedge fund industry and the possibility of this changing soon seems quite minimal2.
ESMA identified four assessment methods for determining which countries to consider for this first opinion:
• Sufficient level of information about each relevant Non-EU jurisdiction
• Amount of activity currently being carried out under NPPR
• Existing knowledge and experience of EU NCA’s with respect to their counterparts
• Efforts made by stakeholders to engage in the process
All, one, or a combination of the above resulted in sixteen countries not being considered in this opinion.
Next steps
There are two potential outcomes:
• Either the European Commission decides to extend the AIFMD passport to non-EU domiciled AIFMs by adopting a Delegated Act specifying the date when this would become applicable in all Member States
• Or the European Commission may decide to defer any action until ESMA has completed further analyses
In either case, the question that remains for Managers who cannot access the passport is how to raise capital in the EU? As the non-EU marketing regimes are not changing, NPPR remains the option for EU Managers wishing to market non-EU AIFs and non-EU Managers wishing to market AIFs within the EU.
2 See: http://www.aima.org/en/media/press-releases.cfm/id/EF6EE637-F471-4D1E-BF926D3339CB0DEF “Cayman islands is confident of being granted AIFMD passport”
For the purposes of AIFMD, professional investors are those that are defined as professional clients under the Markets in Financial Instruments Directive (MiFID)

55
To the point
• Only 2 out of the 22 countries considered received the recommendation
• ESMA will continue to work on its assessment of non-EU countries not covered in the first advice in the coming months
• AIFMD has been deemed successful so far with the lack of harmonization being highlighted as a weakness to be addressed.

56
57
Money Market FundsU.S. 2014 rules vs EU draft 2015 rules
After much debate, the European Institutions (the European Parliament, the Council of the EU and the European Commission) are holding discussions on the latest draft of the regulation on Money Market funds (the Regulation). Originally proposed as part of a set of reforms to the UCITS regime, the Regulation will affect all European domiciled money market funds (MMFs), including UCITS and AIFs.
Brian JacksonPartnerInvestment ManagementDeloitte
Aisling CostelloSenior ManagerInvestment ManagementDeloitte

58
It has changed significantly since its original draft: some recent compromises reflect the approach adopted by the Securities and Exchange Commission (SEC) in 2014, particularly the replacement of the European “3 percent buffer” for MMFs with a constant net asset value, with a system of redemption gates and liquidity fees.
In this article, we consider the current status of the Regulation and how it compares to some of the key rules adopted by the SEC last year: particularly the definition of Constant Net Asset Value (CNAV) MMFs; the introduction of liquidity fees and redemption gates; increased disclosure; diversification; and stress testing.
Background
Following the financial crisis, Regulators were concerned about the systemic risks of “shadow banking”, including MMFs. When the European Commission issued the Regulation on 4 September 2013, its stated aim was to ensure “that MMFs can better withstand redemption pressure in stressed market conditions by enhancing their liquidity profile and stability.”
Internal Market and Services Commissioner Michel Barnier commented:
“We have regulated banks and markets comprehensively. We now need to address the risks posed by the shadow banking system. It plays an important role in financing the real economy and we need to ensure that it is transparent and that the benefits achieved by strengthening certain financial entities and markets are not diminished by the risks moving to less highly regulated sectors”.
MMF were one of the topics originally included in the European Commission’s proposed improvements to the UCITS regime in July 2012, dubbed “UCITS VI”.However, rather than just regulating UCITS MMFs,the Regulation instead applies to all European domiciled MMFs (including AIFs) by imposing an extra layer of regulation over and above UCITS and AIFMD.
In the US, the Securities and Exchange Commission (SEC) published their revised rules on MMFs on 23 July 2014. They stated that the “amendments are designed to address MMF’ susceptibility to heavy redemptions in times of stress, improve their ability to manage and mitigate potential contagion from such redemptions, and increase the transparency of their risks, while preserving, as much as possible, their benefits.”
59
MMFs provide short-term finance to financial institutions, corporates or governments, and thereby contribute to the financing of the real economy in Europe. MMFs provide short-term cash management solutions that provide a high degree of liquidity, diversification, and certainty, combined with a market-based yield. As MMFs are mainly used by corporations seeking to invest their excess cash for a short time frame, they represent a crucial link bringing together demand and supply of short-term money.
However, large redemption requests could prompt MMFs to realize investments in a declining market, potentially jeopardizing the viability of the constant NAV which is fundamental to many MMFs. Any contagion to the short-term funding market could then potentially create difficulties for the financing of financial institutions, corporations and governments, thus the economy.
Because of this systemic interconnectedness with the banking sector and with corporate and government finance, MMFs have been central to the US and EU revisions to shadow banking regulation.
The Commission described shadow banking as:
“The system of credit intermediation that involves entities and activities that are outside the regular banking system. Shadow banks are not regulated like banks yet engage in bank-like activities. The Financial Stability Board (FSB) has roughly estimated the size of the global shadow banking system at around €51 trillion in 2011. This represents 25-30 percent of the total financial system and half the size of bank assets. Shadow banking is therefore of systemic importance for Europe’s financial system.”
Key Facts
MMFs can be “short-term” or “standard”. The former hold securities with a residual maturity of less than 397 days while standard MMFs hold securities with a residual maturity of up to two years. They can be denominated in any particular currency - MMFs mostly invest in debt denominated in euro, pound sterling or US dollar
Some MMFs seek to maintain a stable price per share when investors redeem or purchase shares, known as “constant net asset value” or CNAV MMFs. The value of the underlying assets held by an MMF can, however, fluctuate. To avoid these fluctuations, a CNAV MMF uses amortized costs to calculate the NAV per share. MMFs which do not stabilize their share value (like most other mutual funds) are known as variable net asset value MMFs and are said to have “floating NAVs” (VNAV)
Some sponsors to MMFs provide additional capital to the MMF when its asset values are declining to maintain its NAV to prevent a potential investor run which could spread into the sponsor’s other businesses or affect its reputation. The support that the sponsor provides to the MMF could reduce its own liquidity, putting the sponsor itself at risk
60
Key comparison between the U.S. and proposed EU money market fund reforms
The key revisions to the MMF rules on both continents affect the calculation of the NAV and the definition of CNAV funds; the introduction of liquidity fees and redemption gates; increased disclosure; diversification; and stress testing.
1. CNAV funds and NAV calculation In the United States, the SEC’s revised rules restrict the use of amortized cost and/or “penny rounding” to government, retail funds and institutional prime money funds with securities with less than 60 days to maturity. These MMFs may also continue to use a constant NAV (usually US$1). All other MMFs are required to convert to using a floating or variable NAV, calculating their market-based NAV per share to the nearest basis point. This level of precision is 10 times greater than that required for other mutual funds and is 100 times greater than the penny rounding method currently utilized by MMFs.
Institutional MMFs will be required to use market-based values to price their shares and to have a floating NAV (or current net asset value) like those of other mutual funds. They may however “continue to use amortized cost to value debt securities with remaining maturities of 60 days or less if the fund directors, in good faith, determine that the fair value of the debt securities is their amortized cost value, unless the particular circumstances warrant otherwise”. The SEC’s rationale for introducing the floating NAV was to mitigate the “first mover advantage” and to reduce unfair dilution which could occur during periods of market stress when “first mover” investors redeem shares at a constant NAV and remaining shareholders receive less. Similarly, in the EU, the draft Regulation provides for three types of CNAV MMFs whose scope broadly reflects the three types in the United States: retail, public debt and Low Volatility NAV (LVNAV). In addition to calculating the actual NAV per unit or share according to the mark-to-model or mark-to-market methods as is the case with variable NAV MMFs, these three may also display a constant NAV when: the amortized cost method is used to value assets with a residual maturity below 90 days and the assets are rounded to two decimal places. However, the authorization of these MMFs lapses five years after the MMF Regulation comes into force.
This level of precision is 10 times greater than that required for other mutual funds and is 100 times greater than the penny rounding method currently utilized by MMFs

61
Types of CNAV MMFs US EU
Retail Restricted to subscription by natural persons only
Only available for subscription by charities, non-profit organizations, public authorities and public foundations
Government /public debt A MMF which invests 99.5 percent of its total assets in cash, US government securities and/or repurchase agreements collateralized fully in cash or government securities
Public Debt CNAV MMF, which would be required to invest 99.5 percent of its assets in public debt instruments; and to invest 80 percent of its assets in EU public debt by 2020
Institutional OR Low volatility NAV
Institutional prime MMF holding debt securities with 60 days or less to maturity
Low Volatility Net Asset Value MMF (LVNAV MMF), holding assets with a residual maturity of less than 90 days
The chart below compares each of the three types of CNAV funds in the United States and the EU
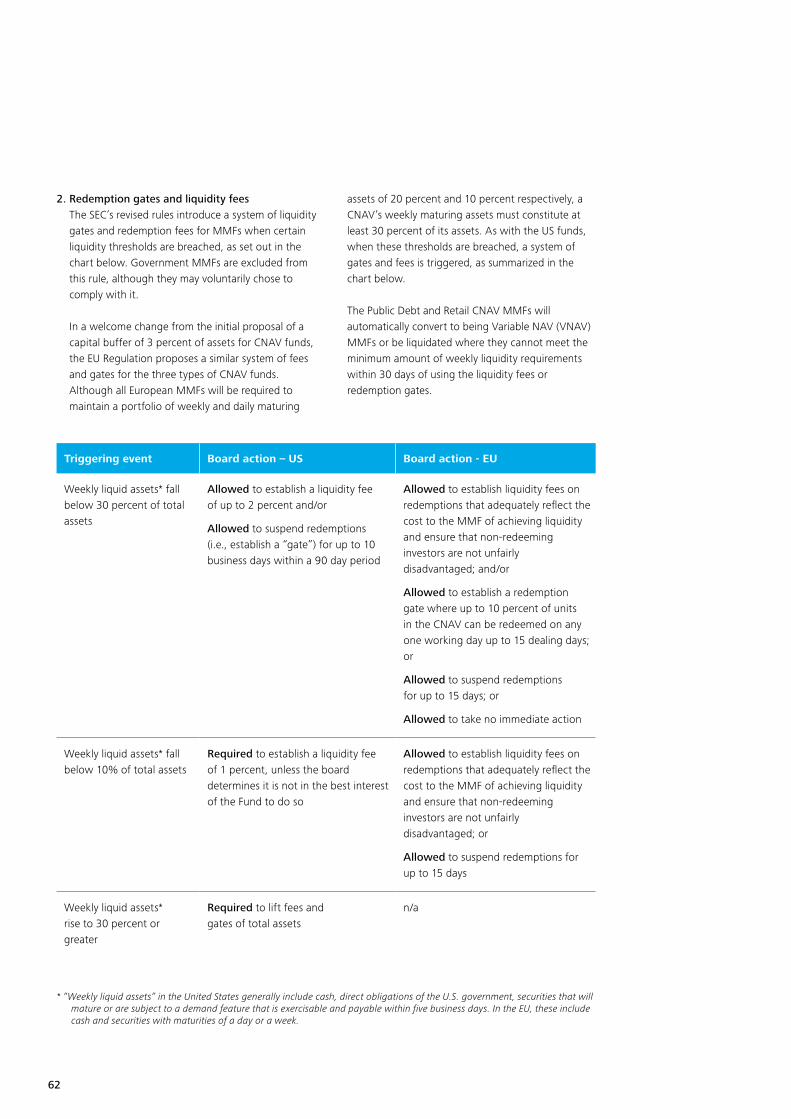
62
2. Redemption gates and liquidity fees The SEC’s revised rules introduce a system of liquidity gates and redemption fees for MMFs when certain liquidity thresholds are breached, as set out in the chart below. Government MMFs are excluded from this rule, although they may voluntarily chose to comply with it. In a welcome change from the initial proposal of a capital buffer of 3 percent of assets for CNAV funds, the EU Regulation proposes a similar system of fees and gates for the three types of CNAV funds. Although all European MMFs will be required to maintain a portfolio of weekly and daily maturing
assets of 20 percent and 10 percent respectively, a CNAV’s weekly maturing assets must constitute at least 30 percent of its assets. As with the US funds, when these thresholds are breached, a system of gates and fees is triggered, as summarized in the chart below. The Public Debt and Retail CNAV MMFs will automatically convert to being Variable NAV (VNAV) MMFs or be liquidated where they cannot meet the minimum amount of weekly liquidity requirements within 30 days of using the liquidity fees or redemption gates.
Triggering event Board action – US Board action - EU
Weekly liquid assets* fall below 30 percent of total assets
Allowed to establish a liquidity fee of up to 2 percent and/or
Allowed to suspend redemptions (i.e., establish a “gate”) for up to 10 business days within a 90 day period
Allowed to establish liquidity fees on redemptions that adequately reflect the cost to the MMF of achieving liquidity and ensure that non-redeeming investors are not unfairly disadvantaged; and/or
Allowed to establish a redemption gate where up to 10 percent of units in the CNAV can be redeemed on any one working day up to 15 dealing days; or
Allowed to suspend redemptions for up to 15 days; or
Allowed to take no immediate action
Weekly liquid assets* fall below 10% of total assets
Required to establish a liquidity fee of 1 percent, unless the board determines it is not in the best interest of the Fund to do so
Allowed to establish liquidity fees on redemptions that adequately reflect the cost to the MMF of achieving liquidity and ensure that non-redeeming investors are not unfairly disadvantaged; or
Allowed to suspend redemptions for up to 15 days
Weekly liquid assets* rise to 30 percent or greater
Required to lift fees and gates of total assets
n/a
* “Weekly liquid assets” in the United States generally include cash, direct obligations of the U.S. government, securities that will mature or are subject to a demand feature that is exercisable and payable within five business days. In the EU, these include cash and securities with maturities of a day or a week.

63
The system of fees and gates allows fund directors increased flexibility to protect the fund and its investors. In the United States in particular, the directors can impose the fees and gates on the same day that the redemptions occur, allowing them to react promptly to prevent or slow redemptions. However, this increased flexibility also imposes increased responsibility and accountability for directors. It also exposes the board to what Americans call ’Monday morning quarterbacking’ and criticism from those with the benefit of hindsight. Consequently, boards would be well advised to establish clear policies on how they will design and implement controls to discharge their duties in such a crisis – should fees and gates be imposed automatically once the thresholds are reached, or instead should a breach of the thresholds trigger a special meeting of the directors?
3. Disclosure The SEC’s new rules require the insertion of mandatory wording into the fund’s marketing material to increase transparency regarding fund holdings, operations and risks. The SEC’s particular concern was to change the expectations of MMF investors and to correct the common misconception that MMFs are without risk. The increased disclosures must be made in the fund’s prospectus and advertising materials, on its website and in the Form N-MFP (on which MMFs report portfolio holdings each month) and in Form N-CR. The additional disclosures in the prospectus include a table outlining fees, historic information on any fees and gates used by the fund over the past ten years and whether the fund’s weekly liquid assets fall below ten percent or thirty percent, and whether the fund received any financial support from a sponsor or fund affiliate over the previous ten years. The fund must include a prominent risk warning regarding the fund’s liquidity, the wording of which varies depending on whether the MMF has a constant NAV, a floating NAV, or whether it is a government MMF which has opted out of the fees and gates rule.To discourage “window dressing’ at month end, the funds must disclose daily on their websites their levels of daily and weekly liquid assets, the imposition of fees and gates, sponsor support, and net shareholder inflows and outflows.
Funds must promptly use Form N-CR to disclose material events within one business day of the trigger event. These include the imposition or removal of fees or gates and for CNAV funds, a decline in the fund’s NAV below $0.9975. The amended Form N-MFP will require funds to report information relevant to the assessment of risk. Funds will have to include the “Legal Entity Identifier” related to each security and at least one other security identifier, the fund’s reporting NAV and shadow price, its daily and weekly liquid assets and shareholder flows.
The EU’s approach was different – they are supplementing the existing disclosure requirements in AIFMD and UCITS with the following transparency disclosures:
• The liquidity profile of the MMF including the cumulative percentage of investments maturing overnight and within one week and how that liquidity is achieved
• The credit profile and portfolio composition
• The WAM and WAL of the MMF
• The cumulative concentration of the top five investors in the MMF
CNAV funds must also disclose additional information to their investors including:
• The total value of assets
• The NAV as published on its website
• The daily indicative value at the market rate to four decimal places
Each MMF manager must report, at least quarterly, to the MMF’s competent authority on matters such as the type and characteristics of the MMF, the results of stress tests, the shadow price, information both on the assets within the MMF’s portfolio and on the MMF’s liabilities. Unsurprisingly, increased transparency was not a controversial proposal and was included in most of the proposals.
64
4. Diversification The SEC’s revised rules require MMFs to:
• Treat certain affiliated entities as single issuers when applying Rule 2a-7’s 5 percent issuer diversification limit
• Exclude certain majority equity owners of asset-backed commercial paper conduits from the requirement to aggregate affiliates for purposes of the 5 percent issuer diversification limit
• Treat the sponsors of asset-backed securities as guarantors subject to Rule 2a-7’s 10 percent diversification limit applicable to guarantees and demand features, unless the MMF’s board makes certain findings; and remove the basket under which as much as 25 percent of the value of securities held in a MMF’s portfolio may be subject to guarantees or demand features from a single institution. (Tax-exempt MMFs instead have a limit of 15 percent)
The EU Regulation is also changing the permitted portfolio diversity limits. The current version proposes that MMFs must not hold over 5 percent of its assets in money market instruments issued by the same body or deposits made with the same institutions. Both the aggregate of all exposures to securities and the aggregate amount of cash provided to the same counterparty of a MMF reverse repurchase agreements must each be capped at 10 percent of the MMFs assets. National regulators can authorize MMFs to invest 100 percent of its assets in different MFFS issued by Central, regional or local authorities or central banks, where: the fund holds money market instruments from at least 6 different issues; and a maximum of 30 percent of its assets are invested in any one issue.
5. Stress testing and liquidity management The SEC’s revised rules require MMFs to regularly test their ability to (i) maintain weekly liquid assets of short-term interest rates; (ii) downgrade or default of particular portfolio security positions, each representing various exposures in a fund’s portfolio; and (iii) the widening of spreads in various sectors to which the fund’s portfolio is exposed, each in combination with various increases in shareholder redemptions. The MMFs’ advisers must notify the results of this stress testing to the board, including such information as may be reasonably necessary for the board to evaluate the results of the stress testing. Similarly, in the EU, MMF managers must implement certain stress testing processes, including analyzing hypothetical changes in the level of liquidity, credit risk, interest rate changes, and redemptions. They must also establish and apply several internal policies, as well as an in-depth “know your customer’ policy to assist them in anticipating potential future investor redemptions. CNAV funds must introduce additional stress testing to assess the difference between the constant and actual NAVs for different scenarios. As with the introduction of the systems of fees and gates, the rules on stress testing task directors (and the MMF manager) with additional responsibilities – particularly evaluating the results of the stress tests and recommending appropriate action. The requirements for boards are constantly changing: some jurisdictions require boards to appoint directors with different expertise, while others simply require boards to have expertise available to the board. Boards should ensure that they are appropriately skilled and expert in analyzing such data.
The European Institutions are currently holding discussions on the current text of the Regulation

65
Additional key features of the proposed EU Regulation include:
• Authorization to operate as a MMF is mandatory.Existing funds which fit the profile of a MMF will be required to register as MMFs and to comply with the Regulation. New funds will undergo authorization as a MMF at establishment
• Managers will need to carry out some internal credit risk assessment to avoid an over-reliance on external credit ratings
• Eligible assets are defined to include money market instruments, deposits with credit institutions, financial derivative instruments and reverse repurchase agreements
• Restricted investments include short-selling money market instruments, investing in other MMFs, taking direct or indirect exposure to ETFs, equities or commodities; borrowing or lending cash
Commentary
MMFs are an important source of short-term financing for financial institutions, corporates and governments - they hold short-term debt securities issued by governments and the corporate sector, as well as short-term debt issued by the banking sector. Because of this systemic interconnectedness of MMFs with the banking sector and with corporate and government finance, their operation has been at the core of international work on shadow banking.
The rationale behind the regulations on both sides of the Atlantic were to stabilize the MMF industry so as to minimize any potential contagion to the ‘real economy’ from a significant event in the MMF industry. However, as a result of the interconnectedness between MMFs and the real economy, changes in the MMF structuring and operation will have knock-on effects in the real economy. Suspending redemptions during “investor runs’ will protect the fund and its sponsor, however, how will this affect an MMF investor which may in turn be suffering from a liquidity challenges. Since the redemption gates apply to retail investor MMFs in the United States, it is possible that these gates and fees could have greater impact on investors less able to bear liquidity shortages.
Next steps
The European Institutions are currently holding discussions on the current text of the Regulation.In the United States, amendments to the SEC’s revised rules became effective 60 days after their publication in the Federal Register on 14 October 2014. Compliance is required on a staggered basis: 14 July 2015 for the new Form N-CR, 14 April 2016 for amendments to diversification, stress testing, disclosure, Form PF and Form N-MFP, while the compliance date for the floating NAV amendments and the fees and gates amendments is 14 October 2016.
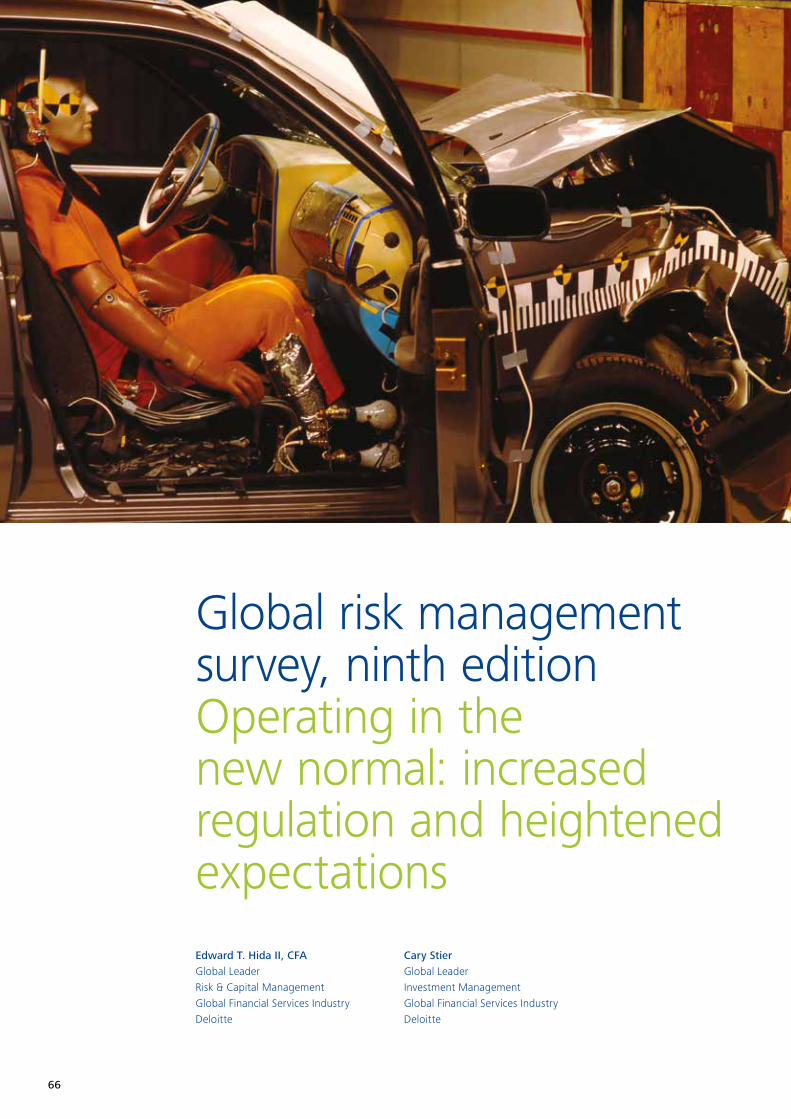
66
Global risk management survey, ninth editionOperating in the new normal: increased regulation and heightened expectationsEdward T. Hida II, CFAGlobal LeaderRisk & Capital ManagementGlobal Financial Services IndustryDeloitte
Cary Stier Global LeaderInvestment ManagementGlobal Financial Services IndustryDeloitte
67
Utilizing the ninth edition of Deloitte’s global risk management survey of financial services firms, we will explore investment management trends.
The investment management sector is diverse, comprising not only large and boutique stand-alone asset management firms but also subsidiaries of diversified banks and insurance companies. Depending on their structure, investment management operations can be subject to a variety of requirements imposed by regulators for the parent banking or insurance company.
Respondents from investment management firms were asked how their organization assesses investment risk. Performance attribution against a benchmark (97 percent) is by far the most common approach. Other measures are employed by half or more of investment management institutions: mandate breaches (72 percent), absolute return (69 percent), and Sharpe ratio (50 percent).
Investment management firms are typically strong in managing market risk since this is central to their business. Many are now addressing risk management areas where they may not be as strong, such as IT applications, data management, and oversight of the extended enterprise. Respondents were asked to rate how challenging each of a series of issues is for the investment risk management function in their organization.
Risk technology and data
The technology and data used to monitor and manage risk continue to be top priorities and concerns for investment management firms. In the period following the global financial crisis, many asset managers’ investments in risk technology reflected a best-of-breed approach, addressing gaps in coverage and the depth of risk analytics across asset classes and products through the use of multiple risk engines or service providers. Increasing the depth and coverage of risk analytics addressed one need but inadvertently created additional issues by increasing the sources and volume of risk data. The proliferation of risk data has challenged the ability of asset managers to aggregate risk measures and exposures across multiple products, funds, and strategies to achieve a holistic view of risk.
Further magnifying this challenge is the demand by regulators for additional data and reporting by asset managers. In Europe, the Alternative Investment Fund Managers Directive (AIFMD) established detailed requirements for reporting liquidity, risk profiles, and leverage. U.S. pension funds are now subject to accounting regulatory changes that have prompted a need for significant enhancements in data quality and analysis. Additionally, recent remarks by a member of the Board of Governors of the Federal Reserve in the

68
United States point to the focus of both the Financial Stability Board (FSB) and the Financial Stability Oversight Council (FSOC) on assessing the magnitude of liquidity and redemption risk within the asset management sector as a tool for macro-prudential regulation.1 This will require many asset managers to invest in their capabilities around liquidity risk measurement and monitoring.
Some institutions have invested in data warehouses in an effort to improve the availability and quality of risk data, but they have faced the challenge of making sure the data placed into them are “clean” and accurate. Some organizations have not implemented error-detection processes or assigned responsibility for data quality when creating their data warehouses. As a result, data governance is emerging as an important focus for investment managers, and some organizations have created a chief data officer position to help address it.
With the increasing complexity of risk data infrastructure and the focus of regulators on risk technology and data, it is not surprising that significantly greater percentages of respondents said they consider these issues to be extremely or very challenging for their investment management activities than was the case in 2012. The issue most often rated as extremely or very challenging was IT applications and systems (55 percent up from 23 percent in 2012), while data management and availability was cited third most often (42 percent up from 35 percent). Although 30 percent of respondents considered risk analytics and reporting to be extremely or very challenging, 88 percent said it is at least somewhat challenging, an increase from 71 percent in 2012.
1 Daniel K.Tarullo, “Advancing macroprudential policy objectives,” speech at the Office of Financial Research and Financial Stability Oversight Council’s 4th Annual Conference on Evaluating macroprudential tools: Complementarities and conflicts, January 30, 2015, http://www.federalreserve.gov/newsevents/speech/tarullo20150130a.htm.
2 May Jo White, “Chairman’s address at SEC Speaks 2014,” February 21, 2014, http://www.sec.gov/News/Speech/Detail/Speech/1370540822127#.VPsR_-Eeo4s.
3 Securities and Exchange Commission, “SEC adopts money market fund reform rules,”July 23, 2014, http://www.sec.gov/News/PressRelease/Detail/PressRelease/1370542347679#.VPtmheEeo4s.
4 Nicholas Elliott, “AIFMD complicates pursuit of capital,” Wall Street Journal, July 23, 2014, http://blogs.wsj.com/riskandcompliance/2014/07/23/the-morning-risk-report-aifmd-complicates-pursuit-of-capital/.
5 Financial Industry Regulatory Authority, “2015 regulatory and examination priorities letter,” January 6, 2015, https://www.finra.org/web/groups/industry/@ip/@reg/@guide/documents/industry/p602239.pdf.
69
Regulatory compliance
With greater scrutiny from regulators, 48 percent of investment management respondents considered regulatory compliance to be extremely or very challenging, up from 29 percent in 2012. Investment management firms have been subjected to a variety of new regulatory requirements. The SEC is paying greater attention to investment managers and funds, including introducing expanded stress testing, more robust data reporting requirements, and increased oversight of the largest institutions.2 In 2014, the SEC also amended its rules to require a floating net asset value for institutional prime money market funds.3 In Europe, the AIFMD introduced new regulations governing the marketing of funds and deal structure for private equity and hedge funds operating in the European Union.4
These and other new regulations affect a wide range of risk management issues for investment management firms.
Governance and accountability
Regulators expect investment management firms to implement strong governance of their risk management programs.5 Investment management firms need to clearly define the roles, responsibilities, and decision-making authority across the three lines of defense to help ensure there are no ambiguities that can create gaps in control or a duplication of effort. In particular, stand-alone investment management firms may need to reexamine the role of the boards of directors of their funds, their committee structure, and the process in place to identify and escalate key risks.
Investment compliance monitoring
Investment management firms can benefit from an investment compliance monitoring program. Such a monitoring program can help identify and address any breakdowns in controls used to comply with regulatory requirements, operational inefficiencies regarding trade monitoring, inconsistent or inadequate processes used to monitor client portfolios, and inconsistent data usage or poor processes to integrate new data.
Conflicts of interest
Reducing conflicts of interest among investment management and other financial institutions is a priority for regulators around the world. The SEC announced that one of its examination priorities for 2015 would be to assess the risks to retail investors, including such issues as fee selection, sales practices, suitability of investment recommendations, and products offered by alternative investment companies.6 In January 2015, the OCC issued a handbook for use by its examiners regarding conflicts of interest among banks that offer investment management services.7
In Europe, the Markets in Financial Instruments Directive (MiFID) II requires that investment firms put in place organizational and administrative procedures with a view to taking “all reasonable steps” to prevent conflicts of interest.8 In an effort to increase transparency for clients, in December 2014, the European Securities and Markets Authority (ESMA) recommended to the European Commission that portfolio managers should only be able to accept broker research when they pay for it directly or from a research account funded by a specific charge to their clients.9
6 Ibid.7 Office of the Comptroller of the Currency, “Asset Management Comptroller’s Handbook: Conflicts of interest,” January 2015,
http://www.occ.gov/publications/publications-by-type/comptrollers-handbook/conflictofinterest.pdf.8 European Securities and Markets Authority, Final Report: ESMA’s technical advice to the commission on MiFID II and MiFIR,
December 19, 2014, http://www.esma.europa.eu/system/files/2014-1569_final_report_-_esmas_technical_advice_to_the_commission_on_mifid_ii_and_mifir.pdf.
9 Deloitte, MiFID II: Product governance and unbundling dealing commission, January 16, 2015, http://blogs.deloitte.co.uk/financialservices/2015/01/mifid-ii.html.
70
In the United Kingdom, the Financial Services Authority requires that investment management firms must manage conflicts of interest fairly and that their boards of directors must establish effective frameworks to identify and control conflicts of interest.10
Conflicts of interest can affect nearly all aspects of investment management, including product development, client on-boarding, portfolio management, personal trading, and managing service providers. Investment management firms may need to enhance their processes to identify, record, analyze, and disclose conflicts of interest. Since conflicts of interest can arise as regulations change and a firm’s products and strategies evolve, it is helpful to conduct a compliance review at least annually to identify any new conflicts of interest that may have arisen.
Client onboarding
In Deloitte’s experience, many compliance violations can be traced back to the client onboarding process. “Know your customer” and customer classification requirements are incorporated into numerous regulations including MiFID II, European Market Infrastructure Regulation (EMIR), the Dodd-Frank Act, and the Foreign Account Tax Compliance Act (FATCA).
In August 2014, the Financial Crimes Enforcement Network (FinCEN) published proposed rules that would enhance customer due diligence requirements to identify and verify the identity of an institution’s customers and beneficial owners.11
As investment management firms and their products become more complex, it can be difficult and time-consuming to monitor whether guidelines have been followed as new clients are acquired. In some institutions, business functions or lines of business may be segregated, making it difficult to access complete information on client accounts.
Investment management firms need an integrated structure that provides clear authority for and transparency into decision-making; cross-functional participation in product development; a strong technology infrastructure that supports analytics and monitoring of client and product profitability; and strong governance and oversight of the onboarding process. Given the complexity of the task, institutions can benefit from automated compliance systems that work in tandem with strong manual oversight when setting up accounts for new clients.
10 Financial Services Authority, Conflicts of interest between asset managers and their customers, November 2012, http://www.fsa.gov.uk/static/pubs/other/conflicts-of-interest.pdf.
11 DavisPolk, “FinCEN’s proposed rule to enhance customer due diligence requirements for financial institutions,” September 30, 2014, http://www.davispolk.com/fincen%E2%80%99s-proposed-rule-enhance-customer-due-diligence-requirements-finan-cial-institutions-%E2%80%93-comments/.
Investment management firms may need to enhance their processes to identify, record, analyze, and disclose conflicts of interest

71
Model risk
Regulators are scrutinizing the models used by financial institutions, including investment managers. The SEC charged several entities of one firm with securities fraud for concealing a significant error in the computer code of the quantitative investment model that it used to manage client assets.12 Model risk can arise in a number of different areas, including investment decision making, trade implementation and monitoring, exposure management, and performance evaluation. Institutions should examine the oversight of their models and the responsibilities, policies, and procedures; validate models; employ ongoing monitoring programs; and increase the rigor of their process for developing models.
Extended enterprise risk
Managing the risks from third-party service providers across the extended enterprise is a growing concern. Third-party service provider oversight was considered to be extremely or very challenging for the investment management risk function by 41 percent of respondents, almost double the 21 percent in 2012.Third parties can pose risks for many different risk types such as cyber, financial, credit, legal, strategic, operational, and business continuity.
Adverse events in any of these areas can damage a firm’s reputation, undermining its ability to attract and retain clients and assets under management. The potential negative impacts of a risk event at a third party can quickly extend to an institution’s reputation and are only magnified today as social media and globalization catapults news around the world at lightning speed.
The impact of third parties on cyber security is a particular concern. Cyber threats continue to increase, and third parties are often their point of entry.
One analysis across multiple industries found that attackers gained access through third-party systemsin 40 percent of data breaches.13
There are a number of reasons for the increased focus on extended enterprise risk. Although the use of third parties by investment management firms is not new, it has become increasingly pervasive and complex as the emergence of unbundled services has created more diverse options to outsource specific functions or sub-functions. As firms continue to search for efficiency and focus on their core competencies, the expanded use of third parties is appealing to more areas of the business.
12 Securities and Exchange Commission, “SEC charges AXS Rosenberg Entities for concealing error in quantitative investment model,” February 3, 2011, http://www.sec.gov/news/press/2011/2011-37.htm.
13 Ponemon Institute LLC, 2013 cost of data breach study: Global analysis, benchmark research sponsored by Symantec and independently conducted by Ponemon Institute LLC, May 2013. Analysis performed on 277 companies globally in 16 industry sectors after those companies experienced the loss or theft of protected personal data, https://www4.symantec.com/mktgin-fo/whitepaper/053013_GL_NA_WP_Ponemon-2013-Cost-of-a-Data-Breach-Report_daiNA_cta72382.pdf.
72
Resourcing
Resourcing the investment management risk management function was considered to be extremely or very challenging by 33 percent of respondents (roughly similar to 29 percent in 2012).Managing resource constraints is a perennial issue, and investment management organizations are increasingly shifting to risk-based resourcing, which allocates resources to key areas based on strategic risk assessments. This approach can maximize impact and value by taking a holistic view of where the organization faces the greatest risk and where additional resources can help meet its strategic goals.
It can also identify gaps in skills and inform hiring decisions to more effectively manage key risk areas.
Risk governance
Many investment management firms are examining the role of the board of directors in overseeing risk, including which issues and decisions should be referred to the full board. They are also considering which management committees should be established to manage risk and how to implement an effective process to identify and escalate key risks.
While 24 percent of respondents said risk governance is extremely or very challenging for their investment management function, 85 percent described it as at least somewhat challenging.
In Europe, the Alternative Investment Fund Managers Directive (AIFMD) established detailed requirements for reporting liquidity, risk profiles, and leverage
To the point
• This report presents the key findings from the ninth edition of Deloitte’s ongoing assessment of risk management practices in the global financial services industry
• Survey participants that provide asset management services represent a total of US$5.6 trillion in assets under management
• To read the full report, please go to http://d2mtr37y39tpbu.cloudfront.net/wp-content/uploads/2015/05/DUP_GlobalRiskManagementSurvey9.pdf

73
74
Asset management for insurersA brave new worldDirk Jan Klein EssinkChief Financial Officer TVM Verzekeringen
Han RijkenHead of Insurance InvestmentsNN Investment Partners
Erwin HoubrechtsDirector Financial Risk ManagementDeloitte
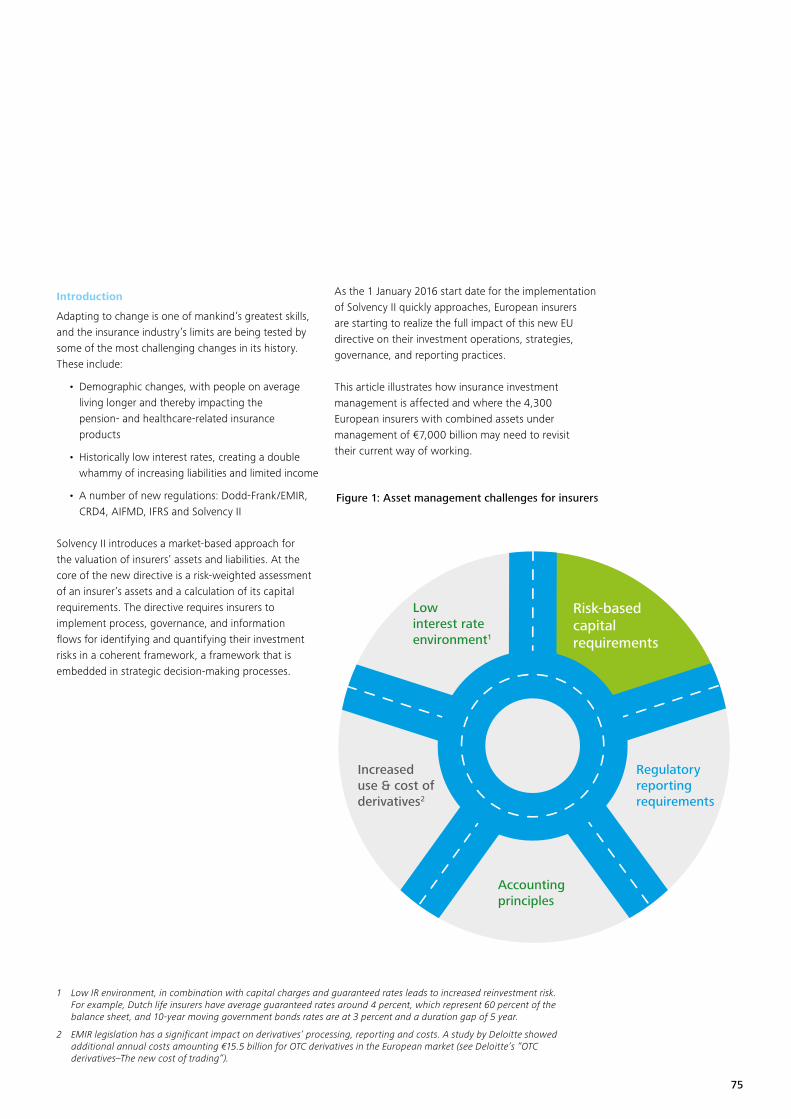
75
Introduction
Adapting to change is one of mankind’s greatest skills, and the insurance industry’s limits are being tested by some of the most challenging changes in its history.These include:
• Demographic changes, with people on average living longer and thereby impacting the pension- and healthcare-related insurance products
• Historically low interest rates, creating a double whammy of increasing liabilities and limited income
• A number of new regulations: Dodd-Frank/EMIR, CRD4, AIFMD, IFRS and Solvency II
Solvency II introduces a market-based approach for the valuation of insurers’ assets and liabilities. At the core of the new directive is a risk-weighted assessment of an insurer’s assets and a calculation of its capital requirements. The directive requires insurers to implement process, governance, and information flows for identifying and quantifying their investment risks in a coherent framework, a framework that is embedded in strategic decision-making processes.
As the 1 January 2016 start date for the implementation of Solvency II quickly approaches, European insurers are starting to realize the full impact of this new EU directive on their investment operations, strategies, governance, and reporting practices.
This article illustrates how insurance investment management is affected and where the 4,300 European insurers with combined assets under management of €7,000 billion may need to revisit their current way of working.
Risk-based capital requirements
Accounting principles
Increased use & cost of derivatives2
Low interest rate environment1
Figure 1: Asset management challenges for insurers
Regulatory reporting requirements
1 Low IR environment, in combination with capital charges and guaranteed rates leads to increased reinvestment risk. For example, Dutch life insurers have average guaranteed rates around 4 percent, which represent 60 percent of the balance sheet, and 10-year moving government bonds rates are at 3 percent and a duration gap of 5 year.
2 EMIR legislation has a significant impact on derivatives’ processing, reporting and costs. A study by Deloitte showed additional annual costs amounting €15.5 billion for OTC derivatives in the European market (see Deloitte’s “OTC derivatives–The new cost of trading”).

76
Figure 2: Integrated balance sheet management
ALM strategy execution
• Translate strategy into specific mandates
• Assign mandates to asset managers
• Monitor execution of mandates (risk, performance, cost) on individual and consolidated level
• Company objectives
• Risk appetite & tolerance
• Regulatory requirements
• Financial markets’ info
• Fiscal regime
• Accounting standards
Three main areas will be covered:
1. Investment strategies: an integrated approach
The changing regulatory landscape and the current market environment create major challenges for insurers in establishing and managing their investment strategies.While larger European insurance companies are already familiar with market-based assessments of assets and liabilities, medium-sized and smaller insurers may be overwhelmed by the new rules of the game.
As a result, managing insurance assets and overlay requires a dynamic process that follows an integrated approach, which implies a balance sheet perspective with a mix of income, capital, and economic/market objectives. Figure 2 represents this process approach. How this affects asset managers and insurers in practice is illustrated by a real life example of TVM, which has decided to partner with an external asset manager (in this case NN Investment Partners). The same challenges apply to the internal asset management organization of insurers.
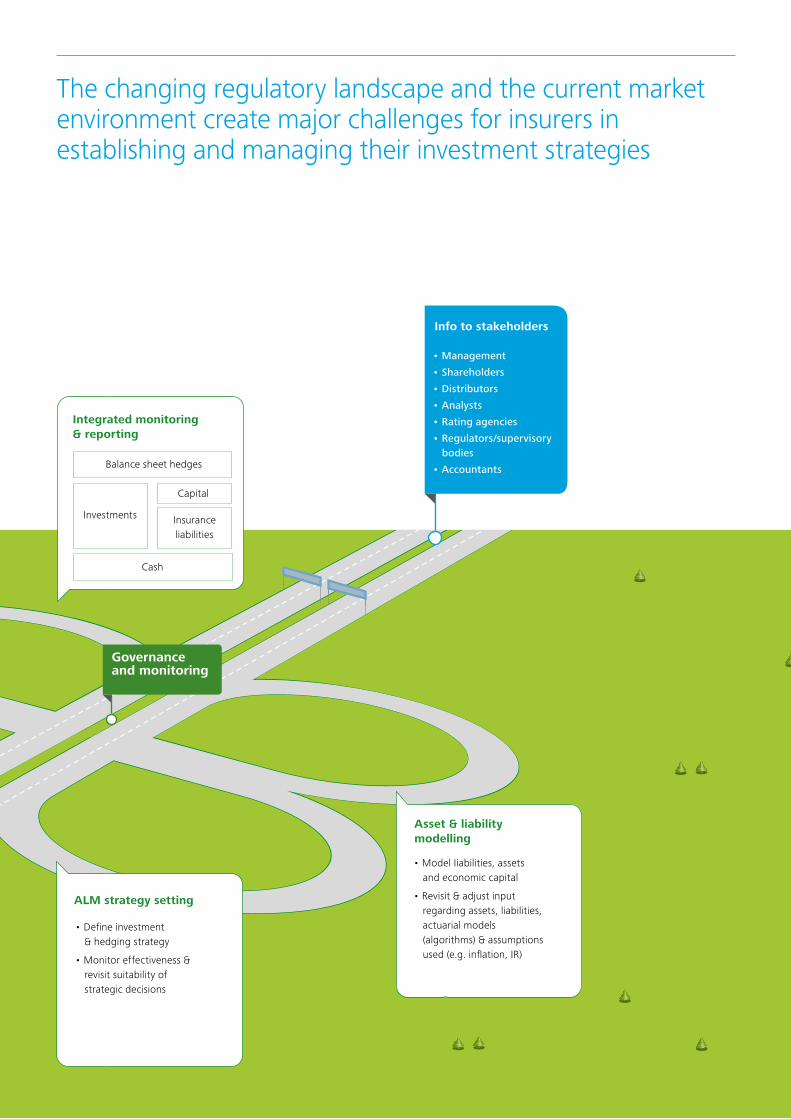
77
• Model Iiabilities, assets and economic capital
• Revisit & adjust input regarding assets, liabilities, actuarial models (algorithms) & assumptions used (e.g. inflation, IR)
Asset & liability modelling
Integrated monitoring & reporting
• Management
• Shareholders
• Distributors
• Analysts
• Rating agencies
• Regulators/supervisory bodies
• Accountants
Info to stakeholders
ALM strategy setting
• Define investment & hedging strategy
• Monitor effectiveness & revisit suitability of strategic decisions
Governance and monitoring
The changing regulatory landscape and the current market environment create major challenges for insurers in establishing and managing their investment strategies
Balance sheet hedges
Cash
Investments
Capital
Insurance liabilities

78
2. Governance: cross-function cooperation and clear KPIs
As the overall complexity increases, the organization’s capabilities to properly manage investment and hedging positions are also likely to evolve in a number of areas:
• The CIO, CFO and CRO will need to cooperate more intensively with regard to risk management models and tools, assessment of existing and new investment and hedging strategies, and assessment of new insurance products. The time that the Asset Liability Management (ALM) and Modeling Departments lived separately from the Investment Department is history
• In-house investment capabilities might not be up to the challenge of actively managing new asset classes (e.g., infrastructure, private placements). In that case, outsourcing solutions must be developed, including oversight; policies; and capabilities to select, monitor, and replace external managers. Using external partners also affects the reporting processes (see next section)
• While revisiting investment strategies, insurers realize that key performance indicators (KPIs) need to evolve, too, as capital considerations are added to traditional, accounting-based, income objectives and mandate-related objectives. There is, however, no one-size-fits-all solution due to (1) company-specific characteristics, such as insurance product portfolio, international reach, objectives, and risk appetite and tolerance, and (2) country-specific demands like regulatory requirements regarding profit-sharing and local GAAP
• Solvency II also introduces some fundamental principles that require translation into investment strategies, policies, and procedures. The “prudent person” principle, for example, states that asset risks are to be properly identified, measured, monitored, controlled, and reported. In addition, portfolio diversification is needed to avoid risk concentration, and investments should ensure security, quality, liquidity, and profitability of the overall portfolio while pursuing the best interests of policyholders
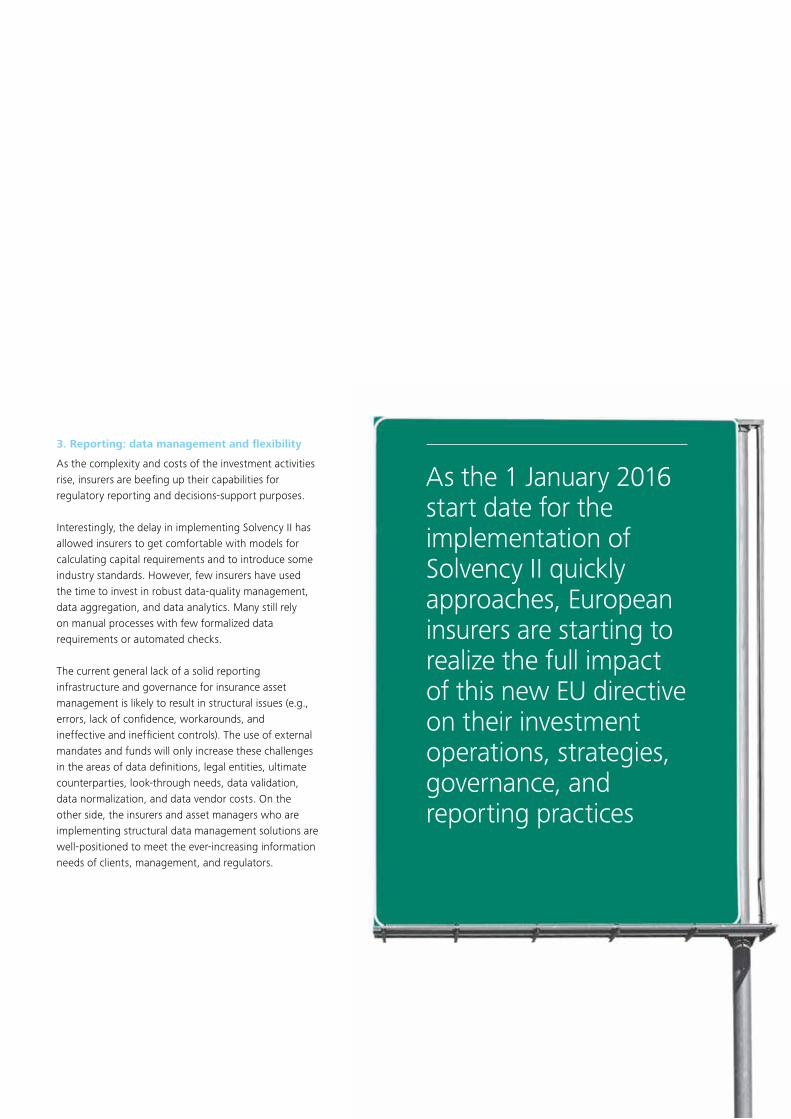
79
As the 1 January 2016 start date for the implementation of Solvency II quickly approaches, European insurers are starting to realize the full impact of this new EU directive on their investment operations, strategies, governance, and reporting practices
3. Reporting: data management and flexibility
As the complexity and costs of the investment activities rise, insurers are beefing up their capabilities for regulatory reporting and decisions-support purposes.
Interestingly, the delay in implementing Solvency II has allowed insurers to get comfortable with models for calculating capital requirements and to introduce some industry standards. However, few insurers have used the time to invest in robust data-quality management, data aggregation, and data analytics. Many still rely on manual processes with few formalized data requirements or automated checks.
The current general lack of a solid reporting infrastructure and governance for insurance asset management is likely to result in structural issues (e.g., errors, lack of confidence, workarounds, and ineffective and inefficient controls). The use of external mandates and funds will only increase these challenges in the areas of data definitions, legal entities, ultimate counterparties, look-through needs, data validation, data normalization, and data vendor costs. On the other side, the insurers and asset managers who are implementing structural data management solutions are well-positioned to meet the ever-increasing information needs of clients, management, and regulators.

80
In this Solvency II world, an integrated balance sheet approach is needed. Liabilities, assets, and capital continuously interact with each other in a way that requires insurers to perform an intricate balancing act. Balancing objectives: solvency ratio, income, and economic value
Solvency II introduces a market-consistent valuation approach to assets and liabilities. The difference between the insurer’s assets and liabilities is the market value-based equity, or the own funds (OF), which must exceed the solvency capital requirement (SCR). This is the capital needed to cover all risks the insurance company faces. The investment-related risks are typically measured on the back of realized market volatilities.
Hence, the solvency ratio (OF/SCR) becomes a crucial indicator for insurers’ financial strength. It is an indicator that will be difficult to manage, as many components of the balance sheet are volatile and interrelated: changing one component may have an impact on other parts and, subsequently, on the solvency ratio. For example, updates of mortality tables would change the value of the liabilities and therefore also the OF, the SCR and subsequently the solvency ratio. If the insurer wants to mitigate the duration impact of the updated mortality table, it has to switch
assets, which would again impact the SCR and the future volatility of the balance sheet. Clearly, Solvency II creates the need for a fully integrated balance sheet management approach.
Solvency II adds a layer of complexity for insurers with long-maturity books, a wide variety of products, and guaranteed structures. In Europe many insurers have guaranteed structures in the range from 2.5 percent all the way up to 6 percent. With current market rates, every investment is by definition loss-making unless higher-yielding assets are added to the balance sheet. These are usually more risky and consume more capital. Economic yields and book yields differ quite a bit due to the low market rates, which discourages insurers from massively shifting assets as the related accounting effects are often undesired.
The risk/return profile within a Solvency II context is clearly different from a normal economic risk/return approach. Figure 3 shows the difference. The curve that represents the Solvency II view shows a higher expected risk for higher-yielding assets such as equities, real estate, and hedge funds than under the economic view. For lower-yielding assets like government bonds, the opposite is true.
“This new world needs a new service model”Han Rijken, NN Investment Partners
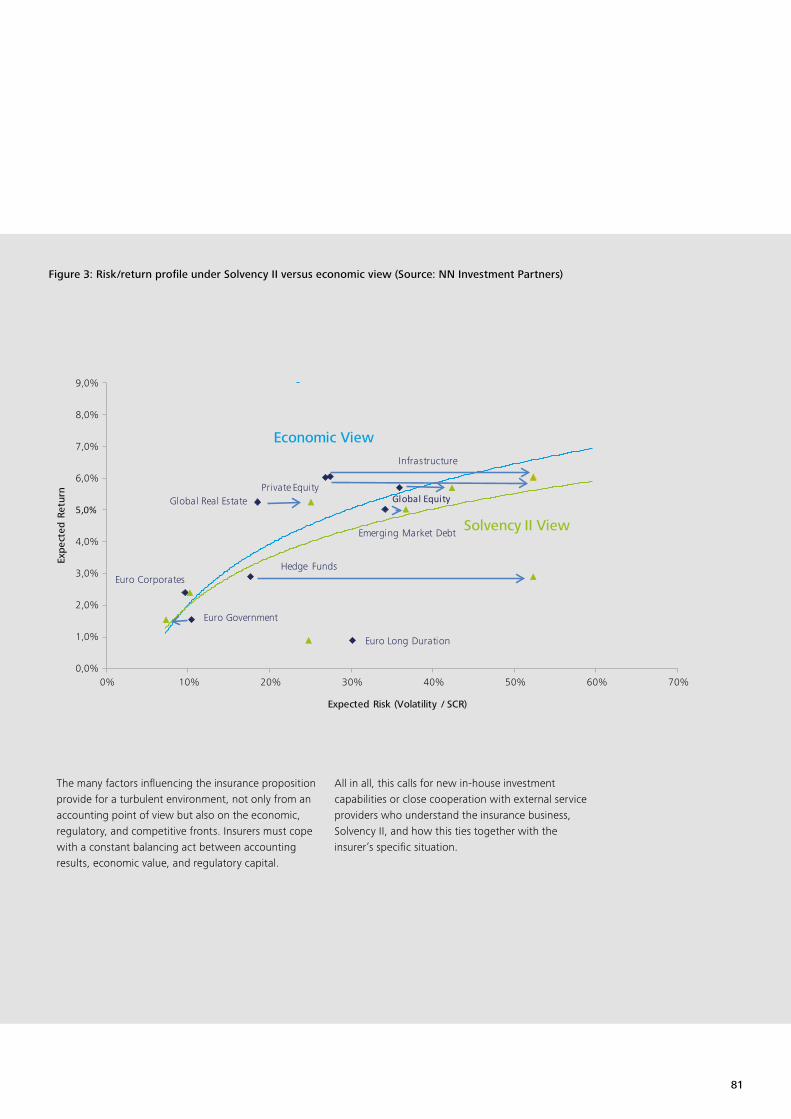
81
The many factors influencing the insurance proposition provide for a turbulent environment, not only from an accounting point of view but also on the economic, regulatory, and competitive fronts. Insurers must cope with a constant balancing act between accounting results, economic value, and regulatory capital.
All in all, this calls for new in-house investment capabilities or close cooperation with external service providers who understand the insurance business, Solvency II, and how this ties together with the insurer’s specific situation.
Economic View
Euro Government
Euro Long Duration
Euro CorporatesHedge Funds
Emerging Market Debt
Global Real Estate Global Equity
Infrastructure
Private Equity
0,0%
1,0%
2,0%
3,0%
4,0%
5,0%
6,0%
7,0%
8,0%
9,0%
0% 10% 20% 30% 40% 50% 60% 70%
Expe
cted
Ret
urn
Expected Risk (Volatility / SCR)
Solvency II View
Figure 3: Risk/return profile under Solvency II versus economic view (Source: NN Investment Partners)
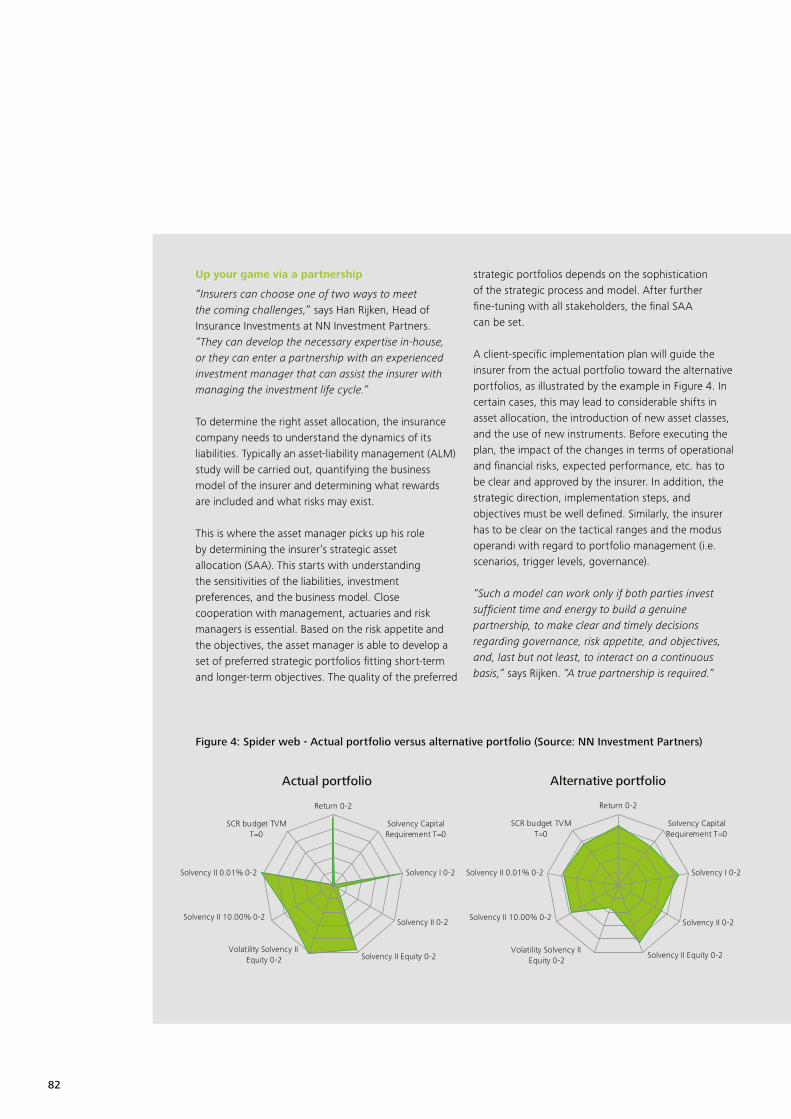
82
Figure 4: Spider web - Actual portfolio versus alternative portfolio (Source: NN Investment Partners)
Up your game via a partnership
“Insurers can choose one of two ways to meet the coming challenges,” says Han Rijken, Head of Insurance Investments at NN Investment Partners. “They can develop the necessary expertise in-house, or they can enter a partnership with an experienced investment manager that can assist the insurer with managing the investment life cycle.”
To determine the right asset allocation, the insurance company needs to understand the dynamics of its liabilities. Typically an asset-liability management (ALM) study will be carried out, quantifying the business model of the insurer and determining what rewards are included and what risks may exist.
This is where the asset manager picks up his role by determining the insurer’s strategic asset allocation (SAA). This starts with understanding the sensitivities of the liabilities, investment preferences, and the business model. Close cooperation with management, actuaries and risk managers is essential. Based on the risk appetite and the objectives, the asset manager is able to develop a set of preferred strategic portfolios fitting short-term and longer-term objectives. The quality of the preferred
strategic portfolios depends on the sophistication of the strategic process and model. After further fine-tuning with all stakeholders, the final SAA can be set.
A client-specific implementation plan will guide the insurer from the actual portfolio toward the alternative portfolios, as illustrated by the example in Figure 4. In certain cases, this may lead to considerable shifts in asset allocation, the introduction of new asset classes, and the use of new instruments. Before executing the plan, the impact of the changes in terms of operational and financial risks, expected performance, etc. has to be clear and approved by the insurer. In addition, the strategic direction, implementation steps, andobjectives must be well defined. Similarly, the insurer has to be clear on the tactical ranges and the modus operandi with regard to portfolio management (i.e. scenarios, trigger levels, governance).
“Such a model can work only if both parties invest sufficient time and energy to build a genuine partnership, to make clear and timely decisions regarding governance, risk appetite, and objectives, and, last but not least, to interact on a continuous basis,” says Rijken. “A true partnership is required.”
Return 0-2
Solvency CapitalRequirement T=0
Solvency I 0-2
Solvency II 0-2
Solvency II Equity 0-2Volatility Solvency II
Equity 0-2
Solvency II 10.00% 0-2
Solvency II 0.01% 0-2
SCR budget TVMT=0
Actual portfolio
Return 0-2
Solvency CapitalRequirement T=0
Solvency I 0-2
Solvency II 0-2
Solvency II Equity 0-2Volatility Solvency II
Equity 0-2
Solvency II 10.00% 0-2
Solvency II 0.01% 0-2
SCR budget TVMT=0
Alternative portfolio

83
Profile NN Investment Partners
NN Investment Partners, formerly known as ING Investment Management, is the asset manager of NN Group N.V., a publicly traded corporation and the second-biggest insurer in the Netherlands by assets.Our investment history dates back to 1845 through our strong roots in insurance and banking.
Headquartered in The Hague, The Netherlands, NN Investment Partners manages approximately €203 billion1 (US$218 billion) in assets for institutions (26 percent of AuM), retail investors (28 percent of AuM) and the insurance businesses of NN Group (46 percent of AuM). NN Investment Partners employs over 1,100 staff and is active in 16 countries across Europe, Middle East, Asia, and North America.
For further information see https://www.nnip.com.
“Insurers can choose one of two ways to meet the coming challenges. They can develop the necessary expertise in-house, or they can enter a partnership with an experienced investment manager that can assist the insurer with managing the investment life cycle”
1 Figures as of 31 March 2015
Erwin Houbrechts, Deloitte
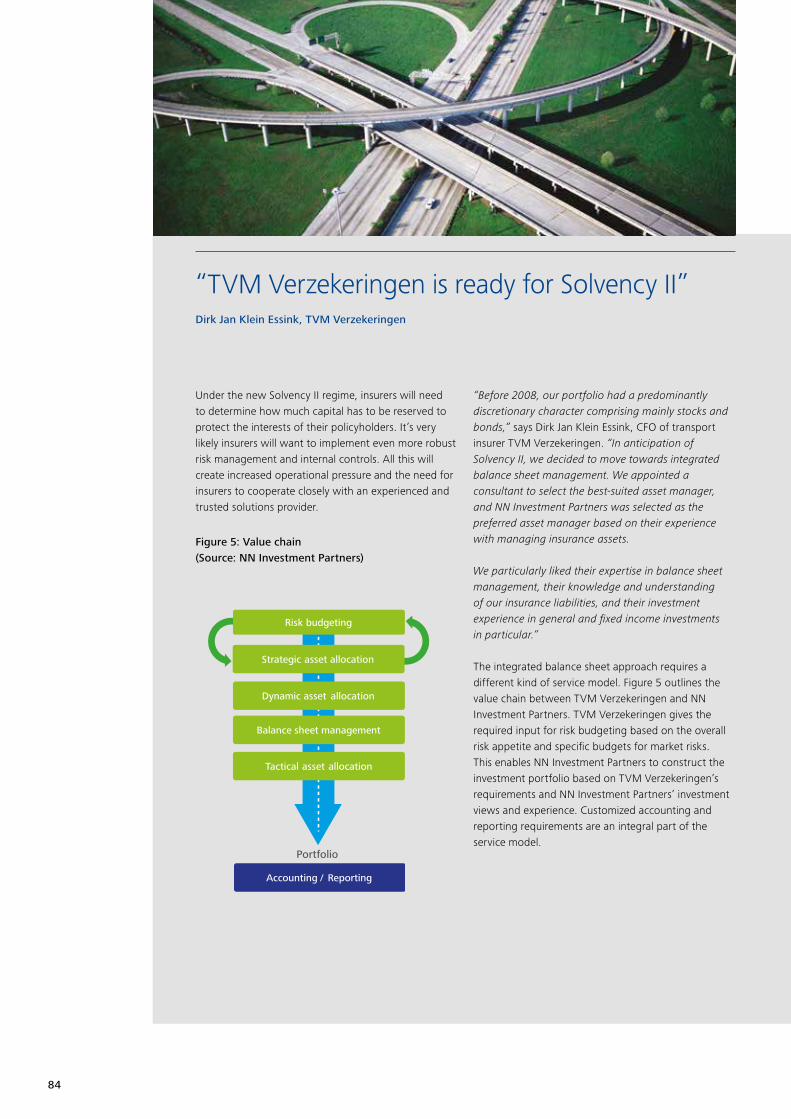
84
“TVM Verzekeringen is ready for Solvency II”
Under the new Solvency II regime, insurers will need to determine how much capital has to be reserved to protect the interests of their policyholders. It’s very likely insurers will want to implement even more robust risk management and internal controls. All this will create increased operational pressure and the need for insurers to cooperate closely with an experienced and trusted solutions provider.
“Before 2008, our portfolio had a predominantly discretionary character comprising mainly stocks and bonds,” says Dirk Jan Klein Essink, CFO of transport insurer TVM Verzekeringen. “In anticipation of Solvency II, we decided to move towards integrated balance sheet management. We appointed a consultant to select the best-suited asset manager, and NN Investment Partners was selected as the preferred asset manager based on their experience with managing insurance assets.
We particularly liked their expertise in balance sheet management, their knowledge and understanding of our insurance liabilities, and their investment experience in general and fixed income investments in particular.”
The integrated balance sheet approach requires a different kind of service model. Figure 5 outlines the value chain between TVM Verzekeringen and NN Investment Partners. TVM Verzekeringen gives the required input for risk budgeting based on the overall risk appetite and specific budgets for market risks. This enables NN Investment Partners to construct the investment portfolio based on TVM Verzekeringen’s requirements and NN Investment Partners’ investment views and experience. Customized accounting and reporting requirements are an integral part of the service model.
Accounting / Reporting
Risk budgeting
Dynamic asset allocation
Tactical allocation
Balance sheet management
Strategic asset allocation
asset
Portfolio
Figure 5: Value chain (Source: NN Investment Partners)
Dirk Jan Klein Essink, TVM Verzekeringen
85
Lessons learned
The introduction of Solvency II will affect every aspect of how insurers manage their balance sheet, income, and capital.
“Based on our positive experience with integrated balance sheet management, we recommend that insurers seriously consider this model,” says Klein Essink, who passes on the following lessons TVM Verzekeringen has already learned:
• Start implementing; learn along the way
• Talk to insurance companies with similar challenges
• Communicate with internal and external stakeholders
• Dare to make choices
Profile
TVM Verzekeringen, a Dutch insurer with 414 employees, provides insurance solutions for road transport, water transport, and the automotive industry. The company was founded in 1962 as a co-operative of number of carriers; our policyholders are therefore also our shareholders.As a co-op, TVM Verzekeringen has a no-profit principle. Its legal structure enables it to first and foremost look after the interests of policyholders in the industry. For further information see https://www.tvm.nl.
Some key figures1:
• Earned premium €199 million
• Technical reserves €353 million
• Investment portfolio €642 million
• Earnings after tax €19 million
• Shareholders’ equity €301 million
• SCR (SI: 850 percent and SII: 250 percent)
To the point
• Insurers currently face the great challenges of an evolving landscape: changing demographics, low interest rates, and new regulatory frameworks are testing the insurance industry’s aptitude for adaptation
• One of these new regulatory frameworks is Solvency II, a directive designed to identify and quantify insurers’ investment risks by valuating their assets and liabilities
• The Solvency Ratio is the ratio between market value-based equity, also known as own funds (OF), and the Solvency Capital Requirements (SCR). The directive dictates that OF exceed the SCR, thus making the Solvency Ratio (OF/SCR) a direct indicator of investment risk and of an insurer’s financial strength
• Managing the Solvency Ratio can be a difficult and tricky task, as many components of the balance sheet are volatile and interrelated and calls upon the need for a holistic balance sheet management approach to effectively integrate income, capital, economic, and market objectives
• Additional complexities are added on by long-maturity books, a wide variety of products and guaranteed structures as well as by a modified risk/return profile through Solvency II. This stormy environment throws insurers into a continuous balancing act between accounting results, economic value, and regulatory capital—a situation that demands clear governance either through in-house investment capabilities or direct cooperation with external service providers
• All in all, Solvency II demands new strategies for portfolio diversification, requires related KPIs to evolve, and provides the opportunity to revisit reporting standards through data quality management, data aggregation, and data analytics
1 2014 Annual Report

86
When A, C, and H spell “Connect”…
Nicolas HennebertPartnerAuditDeloitte
Chris Stuart SinclairDirectorAdvisory & ConsultingDeloitte
The alphabet soup for both inward and outward investment into China has long been a preserve for the initiated. QFII, RQFII, QDII, the more esoteric QDLP, and QFLP (yes they do exist—go to look them up!) may seem bewildering to the outsider, and a form of almost club-ish shorthand used among those in the know.
This is perhaps a little exaggerated as a perception, but overall there is the feeling that yes, it is possible to invest in China, even to some extent to distribute products in China (did you know that you can sell UCITS to QDIIs?), but to do so you must invest the time and effort to understand how the various structures work, to determine the most appropriate, and then to apply for the relevant authorizations.

87
88
The way in which China has developed these regulations—progressively, patiently, and over time—has also meant that to a large extent the market perception has been reinforced. The solutions are there, but it will take time before we can speak of genuine free access.
Stock Connect, or, more specifically, Hong Kong–Shanghai Stock Connect, therefore came as something of a surprise. Certainly there had been rumours of new initiatives in the making, but rumours had also implemented mutual recognition in Hong Kong almost monthly for over a year. Initially the project did not attract exceptional interest on the international stage—another initiative to be followed, monitored, and considered.
Then all of a sudden things accelerated. The last details were being worked out, there was a go-live date announced that was imminent. Finally, it dawned on the market that here for the first time was a scheme allowing access to a very significant Chinese market—the A-shares traded on the Shanghai board with minimal procedural difficulty and very little constraint.
And guess what? It was due to happen next month! In the end there were a couple of last minute delays that sent the cynics off muttering something to the effect of believing it when they saw it, but for once they were proved wrong. A new date, also imminent, was announced, and lo and behold China Stock Connect went live that day and exists.
The interest from asset managers was immediate. Not perhaps so much from those who were already active in the region, the giants, or the locally focused, but for many others either running emerging market equity funds, or even with a client base alive to the macro-economic opportunities in China, this was a golden opportunity to play catch up and to compete with those big boys by offering a product that had a similar investment profile but did not require the long lead time of an RQFII or QFII setup.
The basis for Stock Connect is very simple: it is a trading “infrastructure” routing in two legs. The “northbound” leg from Hong Kong to Shanghai allows anyone placing an order through a Hong Kong registered broker to purchase China A-shares quoted on the Shanghai Stock Exchange, while the “southbound” leg allows Chinese investors to purchase the shares in the Hang Seng large- and mid-cap index and any additional C- and H-shares that are not in those two indices but quoted in Hong Kong. The system does have a number of constraints. There is a quota system in place (as a Chinese friend remarked recently, quotas are in Chinese DNA).
Perhaps this is one of the first instances when sponsored schemes have arbitraged out market discrepancies rather than creating them

89
There is a total overall allocation for the northbound route of 300 billion renminbi and a daily quota of net 13 billion renminbi on the purchase side. When the daily net volume of transactions originated in Hong Kong reaches 13 billion renminbi, purchasing stops.
There is no limitation on sales, so foreign investors in Hong Kong or elsewhere accessing Hong Kong via the system are assured of liquidity— and their sales are netted against purchases in calculating the quota usage.
Currently of the overall quota approximately 40 percent has been used. Perhaps more surprisingly, the south-bound route that allows Chinese investors access to selected stocks in Hong Kong, saw a surge in recent months (before the current market setback), resulting in not infrequent daily volumes that hit the daily threshold as the value disparity between A-shares and other related stocks attracted investors. Perhaps this is one of the first instances when sponsored schemes have arbitraged out market discrepancies rather than creating them. Certainly as a pilot scheme, Stock Connect has already shown its capacity to take center stage. So the Hong Kong-Shanghai Stock Connect is here to stay. But what else is on the horizon? What else should we be looking out for in the ever-changing landscape of Chinese investing?
As mentioned, for those watching China, certain themes quickly become familiar, and, interestingly, they are common to both Hong Kong and the mainland, perhaps underscoring yet again that Hong Kong is part of China and developments involving the two are carefully coordinated.

90
One of these themes is that announcements of proposed developments are made at regular intervals. This was the case with mutual recognition, where the announcement of the scheme pre-dated its eventual launch by two years or more. Secondly, announcements that have been made some time in the past can very quickly accelerate and be implemented even after months or, in some cases, years when nothing very much seems to happen. To understand this process, it is important to understand that, almost without exception, all these announcements concern schemes or developments that are “pilots” within the greater objective of bringing the Chinese currency to the full status of a recognized and used reserve currency, and the complete opening of Chinese markets accompanied by the equivalent unhindered access of Chinese capital and investment to foreign and global markets.
Parallel to the notion of a “pilot” in terms of developments in China is the notion of quotas. The two concepts together are considered to be the cornerstones of development that have allowed China to leave the chaos and confusion of the early years of the previous century, to survive the shocks of civil and world war in the middle of the century, and finally to emerge from the upheaval and trauma of the Cultural Revolution to its current status on the world economic and geopolitical stage.
So each of these initiatives is seen as a continuum of several parts to a greater goal. In one respect, as noted, this can be confusing because it can also be noted that only one major initiative will be under way at any given time. This is best illustrated when we consider mutual recognition and Stock Connect. Mutual recognition, in addition to delays necessary to sort out certain technical issues and reach all important guidelines around the thorny issue of misselling, was to some extent sacrificed to allow space for Stock Connect.

91
Now that Stock Connect is functioning, what is likely to come next? Currently there are a number of initiatives that have been mentioned, or rather announced:
• The extension of Stock Connect to include Shenzhen, where, in addition to the remaining A- share market—those not quoted on Shanghai—there is also a mid-cap board and a small-cap board on the exchange that may eligible, as may be, as it is rumored, certain ETFs
• The extension of the QDII scheme to encompass six new cities
• The review of current RQFII and QFII regulations to bring them into line
• The “relaunch” of the QDLP and the QFLP schemes
The extension of Stock Connect to Shenzhen was considered to be key and central at one stage, and it probably still is. The initial launch date was expected for this year—by year end—although it looks likely now that it could well be pushed back to 2016. (Once again it is worth adding a note of caution. As we described earlier with the initial Stock Connect, all of a sudden it was on top of us; we cannot exclude a similar surprise for Shenzhen.) The importance of Shenzhen Stock Connect is that it extends or rather completes the A-share world—with, as mentioned, those A-shares not listed on Shanghai.
This is an important step in the bigger picture and probably a sine qua non for inclusion in the MSCI—certainly that is the strategic importance of the move that has been much discussed. Having said that, the potential inclusion of the mid-cap and small-cap offering alongside ETFs could also be far reaching in its implications. Thus far, the universe available via Stock Connect is limited to the A-shares: any other foreign investment requirement needs to be satisfied via an RQFII or QFII arrangement.
Many RQFII and QFII investors envisage the coexistence of both routes in their investment strategy, so an extension of Stock Connect into other fields would be a very welcome development.
At the same time we should not lose sight of what has been happening both under the existing Stock Connect arrangements and in the wider Chinese market itself. Some of the flows under Stock Connect have been probably different to what was anticipated. The “limit up” (in terms of quota) for a reasonably long period on the southbound track is something of a surprise. The degree of potential interest northbound is also hard to assess, especially when one remembers that this is indeed a pilot. What difference would MSCI inclusion have made? What difference would less reticence on the part of European funds have made? (The main foreign fund actors under Stock Connect to date have been offshore hedge funds and US 40 Act funds, while Europeans have struggled a little with the challenge of making Chinese and European regulation tie up, something that may not be over yet when one considers that UCITS V still has to be implemented). These considerations must also be evaluated against the backdrop of recent and current market turbulence in China, attributed in many cases to domestic and retail leverage, although rumors have also circulated to the effect that foreign houses may have found means to illicitly short the market.
Perhaps taking all these considerations together, and the prudent step-by-step approach that is characteristic of the way China is opening its markets, a period of further evaluation and analysis may not go amiss. After all, what is six months to the economy that will almost inevitably grow in time to be the world’s largest?
The extension of the QDII regime might well prove the wild card and the surprise. The QDII regime allows qualifying domestic Chinese investors to invest directly in foreign securities.

92
This was initially considered to be limited to stocks and bonds, but some QDIIs have taken foreign investment funds to be securities, and it is under the QDII arrangement that some UCITS have found their first distribution outlet in China. On the whole, take up under QDII has been muted, although this has been largely attributed to a combination of poor marketing and an overly competitive domestic market in terms of return.
Sometimes referred to as QDII2, it is reported that the new version will initially be launched in six Chinese cities: Shanghai, Tianjin, Chongqing, Wuhan, Shenzhen, and Wenzhou, and it is expected to be open to investors with financial assets of at least (the equivalent of) US$160,000. Details as to the total quota, etc. are as yet sketchy; however, it is widely believed that the range of eligible investments may well include foreign investment funds. Clearly, with a certain amount of uncertainty creeping into domestic markets and some pressure for foreign funds to be included under Mutual Recognition arrangements, QDII2 could be the next step in opening China’s new affluent markets to foreign investments.
Certainly it is the one for UCITS distributors to be watching. The current QFII and RQFII rules can represent their own challenges. Since initially introduced over a decade ago, QFII and subsequently RQFII rules, like the geographic allocation of RQFII quota, have changed significantly over time. This has had the greatest impact on the level to which ultimate beneficial owners may be segregated within the books of the QFII or RQFII without losing either specific rights or quota in the event of disinvestment and, more recently, the more flexible structures that may be obtained when running an “open-ended China fund” versus segregated mandates under the RQFII system. (An “open-ended China fund” benefits from flexible rules on regular repatriations without loss of quota, facilitating the use of the quota for foreign mutual funds; however, “fund” quota and mandate quota are not fungible and must be clearly identified from the outset.) Clearly a harmonization of the rules around the most flexible procedures would be a great boon to investment managers in planning their offering in Chinese markets to foreign investors.
QDLP (Qualified Domestic Limited Partnership) and QFLP (Qualified Foreign Limited Partnership) were schemes introduced in certain Chinese cities—with, once again, Shanghai figuring prominently, designed to facilitate the creation of joint ventures in the first instance to offer investment products to Chinese investors and to invest in domestic Chinese companies, respectively. It is probably fair to say that these two options, while finding immediate “takers” in terms of being setup, have not realized the potential that might have been anticipated. Again, a relaunch, possibly with more flexible rules, clarification on certain fiscal uncertainties, and a broader scope could both attract much greater interest and begin to unlock further parts of the jigsaw puzzle of investing in China.
Which of these initiatives will be prioritized? Only time will tell, although we would have a sneaking suspicion that QDII2 may well work its way up the agenda.
Or perhaps none of them.
For is one more, one that has yet to be announced, and yet one that must inevitably come. It may even be the greatest opportunity for Sino-European collaboration, but for that to happen, many moving parts would have to fall into place at the same time. This would be infrastructure investment. At the same time, as the EU is launching its ELTIF (European long-term investment fund) product designed specifically for this asset class, China has underway two of the most ambitious infrastructure projects in history. Sometimes decried as too ambitious, the Silk Road Economic Belt and the 21st Century Maritime Silk Road are designed to provide major trading and economic development links between China, through Asia to the western world.
93
While Europeans have struggled a little with the challenge of making Chinese and European regulation tie up, something that may not be over yet when one considers that UCITS V still has to be implemented)
The geopolitical challenge is immense, and the ambition is truly staggering. Some say that it may never happen. However, one of the first cornerstones for infrastructure development—the Asian Infrastructure Investment Bank—despite similar criticism and skepticism is well on the way to becoming a reality. What greater way for favoring inward and outward investment could there be for China to design and structure its own equivalent of the ELTIF. Indeed would it be far-fetched to suggest that voices calling for an extension of mutual recognition might look first at an infrastructure project vehicle for Chinese-EU mutual recognition rather than existing fund structures.
Certainly the idea is too complex, too advanced, and too sensitive for it to trouble the current calendar of initiatives that are progressively opening up Chinese markets to inward and outward investment. But in the future? Who knows. Infrastructure is in many ways the last investment horizon—it ticks so many boxes but poses so many challenges. It does, however, have one unique geo-political advantage. In creating physical infrastructure, it provides incentives to geopolitical stability that cannot be torn up on the whim of a single man or country. Food for thought indeed. China investment is here to stay.

94
To the point
• Investment and product distribution in China is becoming more and more a reality due to “pilot” schemes launched in Hong Kong and mainland China
• The Hong Kong-Shanghai Stock Connect is one of these pilot schemes. It constitutes a trading infrastructure that reaches in two directions. The “northbound” route from Hong Kong to Shanghai allows someone placing orders through a Hong Kong registered broker to purchase China A-shares that are quoted on the Shanghai Stock Exchange. The “southbound” route allows Chinese investors to purchase the constituent stocks of the Hang Seng Composite Large Cap Index and Hang Seng Composite Mid Cap Index. They can also purchase all H-shares that are not included as constituent stocks of the relevant indices but that have corresponding A-shares listed in Shanghai except for Hong Kong shares not traded in Hong Kong dollars and H-shares that have shares listed and traded not in Shanghai
• The only constraint to the Hong Kong-Shanghai Stock Connect is the quota system in place on the purchase side (i.e., the “northbound” route). There is a cap at 13 billion renminbi for daily net transaction volumes and a cap of 300 billion renminbi for total overall allocation
• The announcements of such proposed pilot schemes and developments are often made years before implementation. However, the launch itself is often difficult to predict; sometimes the launch date is continuously pushed back. At other times, the scheme surprises investors by being implemented with unexpected speed.
• Other schemes that deserve some attention are the extension of the Stock Connect scheme to include Shenzhen, which may potentially also include ETFs, the extension of the QDII scheme to include Shanghai, Tianjin, Chongqing, Wuhan, Shenzhen, and Wenzhou, the review of the current RQFII and QFII regulations as well as the relaunch of the QDLP and QFLP schemes
• The objective of facilitating foreign investment in Hong Kong and China is simple: China wishes to open its market to the world and bring the Chinese currency to the full status of a recognized and used reserve currency. This objective dovetails with the holistic strategy of developing major trading and economic links from China through Asia to the western world. The Silk Road Economic Belt and the 21st Century Maritime Silk Road are the two major infrastructure projects envisioned to meet this challenge. One of the prerequisites to tackle this geo-political challenge, the Asian Infrastructure Investment Bank, is already well on its way to becoming a reality

95
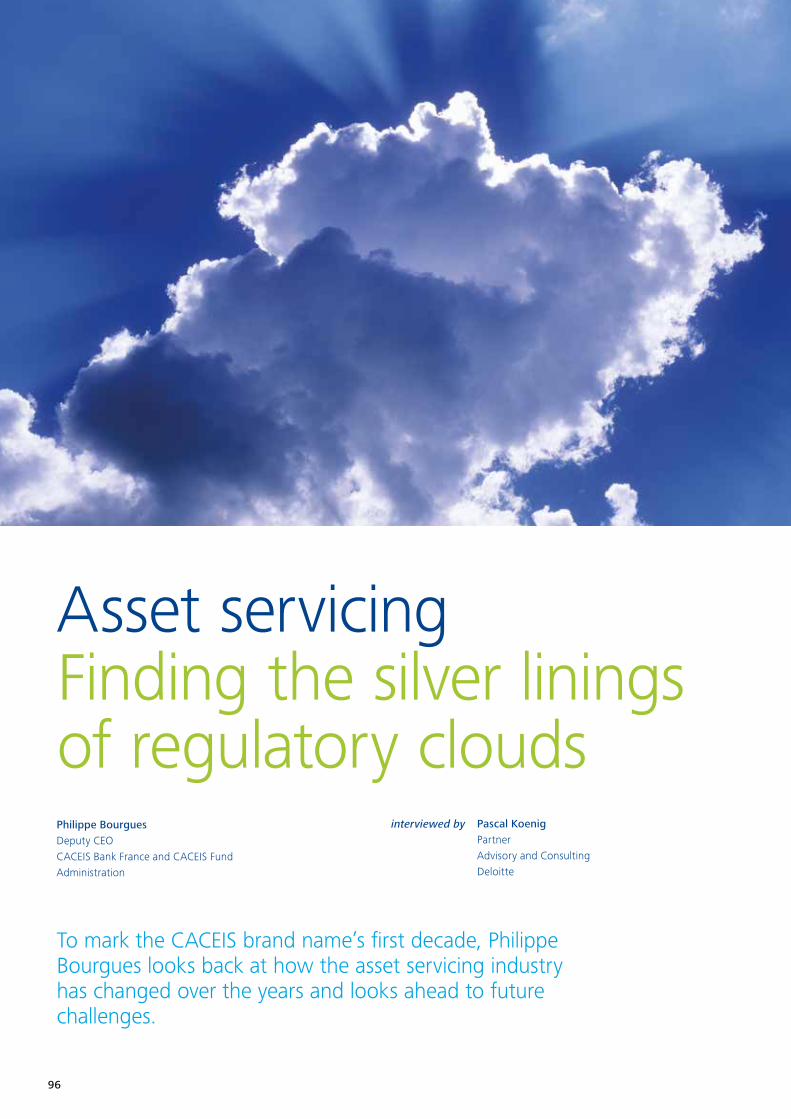
96
Asset servicingFinding the silver linings of regulatory clouds
To mark the CACEIS brand name’s first decade, Philippe Bourgues looks back at how the asset servicing industry has changed over the years and looks ahead to future challenges.
Philippe BourguesDeputy CEOCACEIS Bank France and CACEIS Fund Administration
interviewed by Pascal KoenigPartner Advisory and Consulting Deloitte
97
Deloitte: What is CACEIS’s principal market, and what are the biggest challenges for asset servicing in the years to come?
Philippe BourguesOur main market is Europe, which offers potential revenues of some €10 billion, and where a dozen asset servicing providers compete. In contrast, the market in the U.S. is twice the size of Europe’s, but just four companies compete. In Europe, such strong competition in a relatively narrow market serves to drive prices down.
At the same time, European asset servicing groups are faced with the unprecedented situation of interest rates remaining at zero for a long period, coupled with the increased liquidity requirements created under Basel III, and the contributions banks must pay into the EU’s Single Resolution Fund (SRF), which also eat into their profit margins. Yet another challenge asset servicing providers face is ensuring clients are fully compliant with new regulatory measures coming into force.
However, this often provides an opportunity for the asset servicing community to develop new services to assist clients in achieving compliance. Faced with these difficult economic conditions and an ever-changing regulatory landscape, the European asset servicing community is pushed to develop new services, which go beyond the areas of traditional custody and fund administration.
Economic and regulatory pressure are forcing them to consider different operating models to remain competitive, and so they develop services that extend further up the value chain, into the middle and front office.
Deloitte: How are regulatory developments shaping the business environment for institutional investors and for service providers?
Philippe BourguesThe G20’s initiatives to reduce systemic risk in financial markets and improve transparency and corporate responsibility in the asset management industry have put asset servicing at the heart of the debate.
Whether the new regulatory measures are seen as restrictions or opportunities, the ensuing European regulations (EMIR, MiFID II, UCITS V, AIFMD, Solvency II) will have a profound effect on the investment industry’s structures and strategies.Asset managers are subject to tighter regulation and increased pressure from investors to reduce their management fees.
As a result, many asset managers are refocusing on their core business (asset management and sales & marketing) and delegating non-core aspects of their business to third parties. The current economic environment contributes to the asset managers choosing to outsource to avoid costly in-house developments needed to meet new regulatory requirements. In terms of asset servicing product development, groups aim to anticipate change to offer management companies efficient services that help them achieve compliance and take advantage of any business opportunities the regulations might bring.
Asset managers are subject to tighter regulation and increased pressure from investors to reduce their management fees

98
Deloitte: What new services have asset servicing companies developed to meet the needs of institutional investors seeking outsourcing solutions?
Philippe BourguesThere are numerous opportunities for asset servicing providers to develop and enhance the services they offer, provided they have the financial resources to invest heavily in technology, expert staff, and product development, all of which are key to staying competitive. Asset managers seek services that enable them to reduce operational risk and adapt to regulatory changes while smoothing expenditure by turning variable costs into predictable fixed costs.Managers are also placing renewed focus on front-end activities and are looking in detail at how they handle execution, middle, and back office operations.
In response to the requirements of EMIR in terms of the new processing regulations for OTC derivatives, clearing, collateral management services and delegation reporting to trade repositories many asset managers have sought a comprehensive “Execution to Custody” offering. Such an offer provides a full-service solution, with execution on equities and futures markets that is fully integrated with related clearing, custody, fund administration and depositary bank services via a single access point. Not only do such offers enable trades to be consolidated but they can also be backed by a service covering the entire middle-office and back-office functions reducing the complexity of transactional chains and optimising management of collateral.
Asset managers can therefore outsource their middle and back office operations on a full or partial basis.In the context of the drive for transparency led by regulatory measures such as Solvency II, MiFID and SFT, data collection and communication to relevant parties is key. Derivative reporting under EMIR and AIFMD annual reporting started in 2014. Asset servicing companies also offer asset management and insurance companies’ solutions to produce look-through reporting in compliance with the Solvency II Directive.
Deloitte: How are asset servicing providers helping asset managers to make the most of the opportunities created by the AIFM and UCITS IV directives?
Philippe BourguesUnder AIFMD, which came into force in July 2014, EU authorized firms can use a marketing passport to distribute funds to professional investors in Europe but must appoint an independent depositary.
The “AIFMD fund” brand is proving to be a success in the same way that the “UCITS fund” brand has been. Consequently, with an increasing percentage of assets allocated to alternative investments such as hedge funds, real estate, and private equity, there come new revenue-generating opportunities for asset servicing groups, which are able to offer new middle office and valuation services for these complex and illiquid asset classes.
The AIFM and UCITS IV directives facilitate cross-border fund distribution through the creation of a product label and a management company passport. This approach brings many challenges for managers: adjusting structures, sales strategies, product ranges, the selection of domestic, Luxembourg, or Irish law funds, selecting countries for distribution, obtaining authorization from local regulators, understanding regulations, monitoring assets under management, commissions, and investors on a country-by-country basis. To help them to overcome this complexity, an asset servicing partner can offer cross-border fund distribution support services. For assets held in UCITS or AIFMD-compliant funds, a high level of asset protection is applied—with the fund depositary required to bear a sizeable liability for any loss. Asset managers recognize the importance of a strong fund depositary in contributing to the success of the UCITS and AIFMD brands. The environment is challenging, perhaps more challenging than it has ever been. But the asset servicing community nevertheless sees many opportunities to develop innovative solutions to maintain the profitability of their own business while helping clients grow and manage theirs.

To the point
• Faced with difficult economic conditions and the changing regulatory environment, asset servicing groups are developing new services that go beyond the traditional areas of custody and fund administration
• Clients are looking to outsource services that allow them to reduce operational risk and adapt to regulatory changes while smoothing out their costs
• Increased allocation to alternative investments such as hedge funds, real estate, and private equity give rise to other revenue-generating opportunities for asset servicing companies
• There are numerous opportunities for asset servicers to enhance the services that they provide clients if they can maintain the heavy investment in technology, staff expertise, and product
100
Deloitte 2014 European real estate investment management survey among asset managers and servicersForecast? Mostly sunny, with scattered cloudsBenjamin LamPartnerAuditDeloitte
Gérard LorentDirectorAdvisory & ConsultingDeloitte
Francesco PiantoniDirectorAdvisory & ConsultingDeloitte
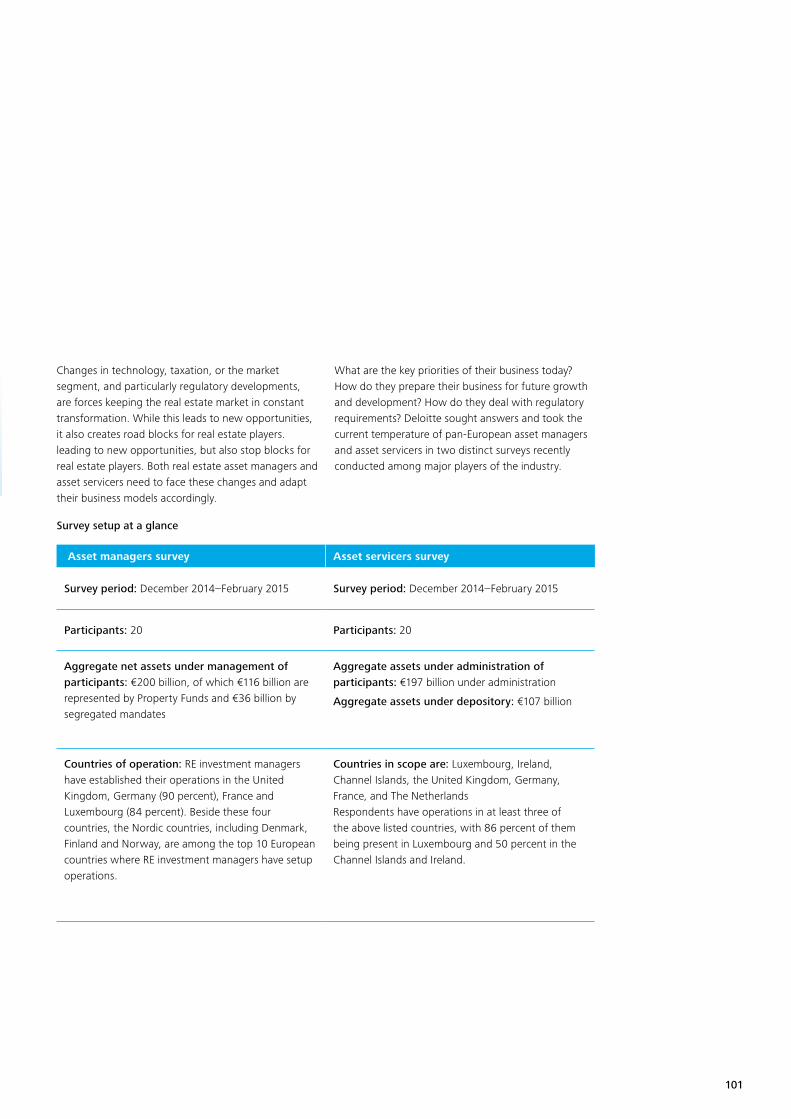
101
Survey setup at a glance
Changes in technology, taxation, or the market segment, and particularly regulatory developments, are forces keeping the real estate market in constant transformation. While this leads to new opportunities, it also creates road blocks for real estate players. leading to new opportunities, but also stop blocks for real estate players. Both real estate asset managers and asset servicers need to face these changes and adapt their business models accordingly.
What are the key priorities of their business today? How do they prepare their business for future growth and development? How do they deal with regulatory requirements? Deloitte sought answers and took the current temperature of pan-European asset managers and asset servicers in two distinct surveys recently conducted among major players of the industry.
Asset managers survey Asset servicers survey
Survey period: December 2014–February 2015 Survey period: December 2014–February 2015
Participants: 20 Participants: 20
Aggregate net assets under management of participants: €200 billion, of which €116 billion are represented by Property Funds and €36 billion by segregated mandates
Aggregate assets under administration of participants: €197 billion under administration
Aggregate assets under depository: €107 billion
Countries of operation: RE investment managers have established their operations in the United Kingdom, Germany (90 percent), France and Luxembourg (84 percent). Beside these four countries, the Nordic countries, including Denmark, Finland and Norway, are among the top 10 European countries where RE investment managers have setup operations.
Countries in scope are: Luxembourg, Ireland, Channel Islands, the United Kingdom, Germany, France, and The NetherlandsRespondents have operations in at least three of the above listed countries, with 86 percent of them being present in Luxembourg and 50 percent in the Channel Islands and Ireland.
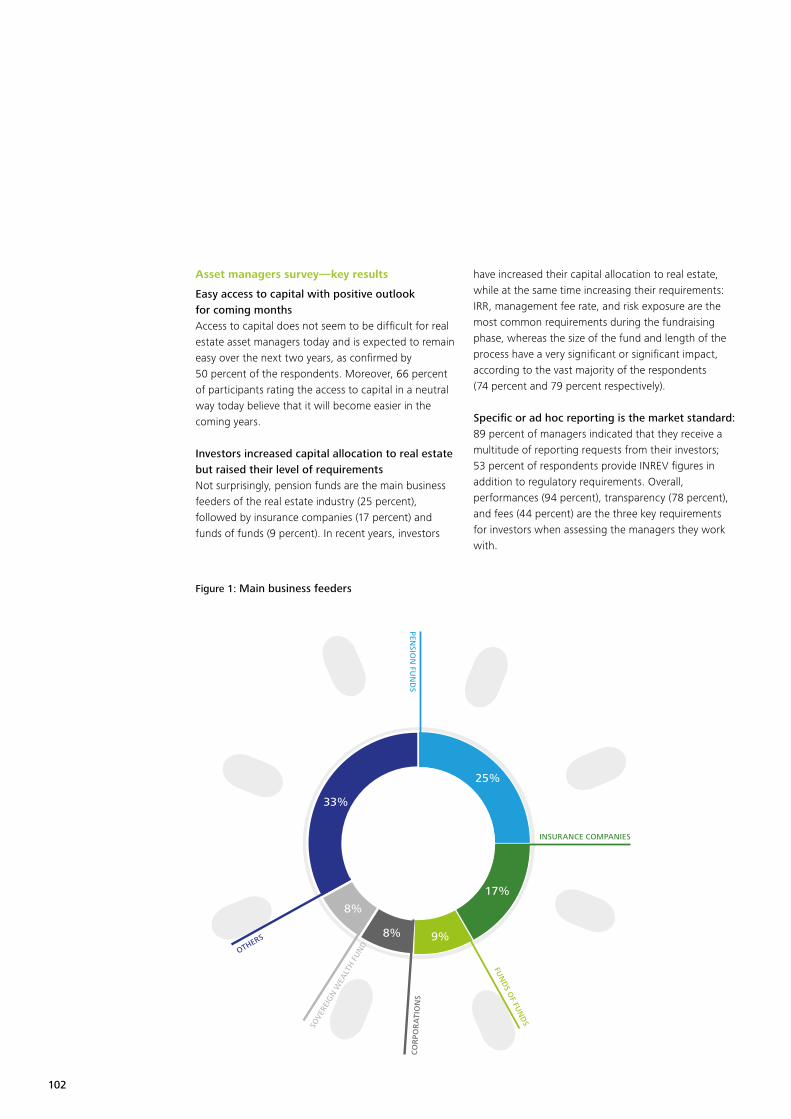
102
Asset managers survey—key results
Easy access to capital with positive outlook for coming monthsAccess to capital does not seem to be difficult for real estate asset managers today and is expected to remain easy over the next two years, as confirmed by 50 percent of the respondents. Moreover, 66 percent of participants rating the access to capital in a neutral way today believe that it will become easier in the coming years.
Investors increased capital allocation to real estate but raised their level of requirementsNot surprisingly, pension funds are the main business feeders of the real estate industry (25 percent), followed by insurance companies (17 percent) and funds of funds (9 percent). In recent years, investors
have increased their capital allocation to real estate, while at the same time increasing their requirements: IRR, management fee rate, and risk exposure are the most common requirements during the fundraising phase, whereas the size of the fund and length of the process have a very significant or significant impact, according to the vast majority of the respondents (74 percent and 79 percent respectively).
Specific or ad hoc reporting is the market standard: 89 percent of managers indicated that they receive a multitude of reporting requests from their investors; 53 percent of respondents provide INREV figures in addition to regulatory requirements. Overall, performances (94 percent), transparency (78 percent), and fees (44 percent) are the three key requirements for investors when assessing the managers they work with.
Figure 1: Main business feeders
PENSIO
N FU
ND
S
CO
RP
OR
ATI
ON
S
SOVE
REIG
N W
EALT
H F
UN
DS
OTHERS
INSURANCE COMPANIES
FUN
DS O
F FUN
DS
25%
17%
9%8%
8%
33%
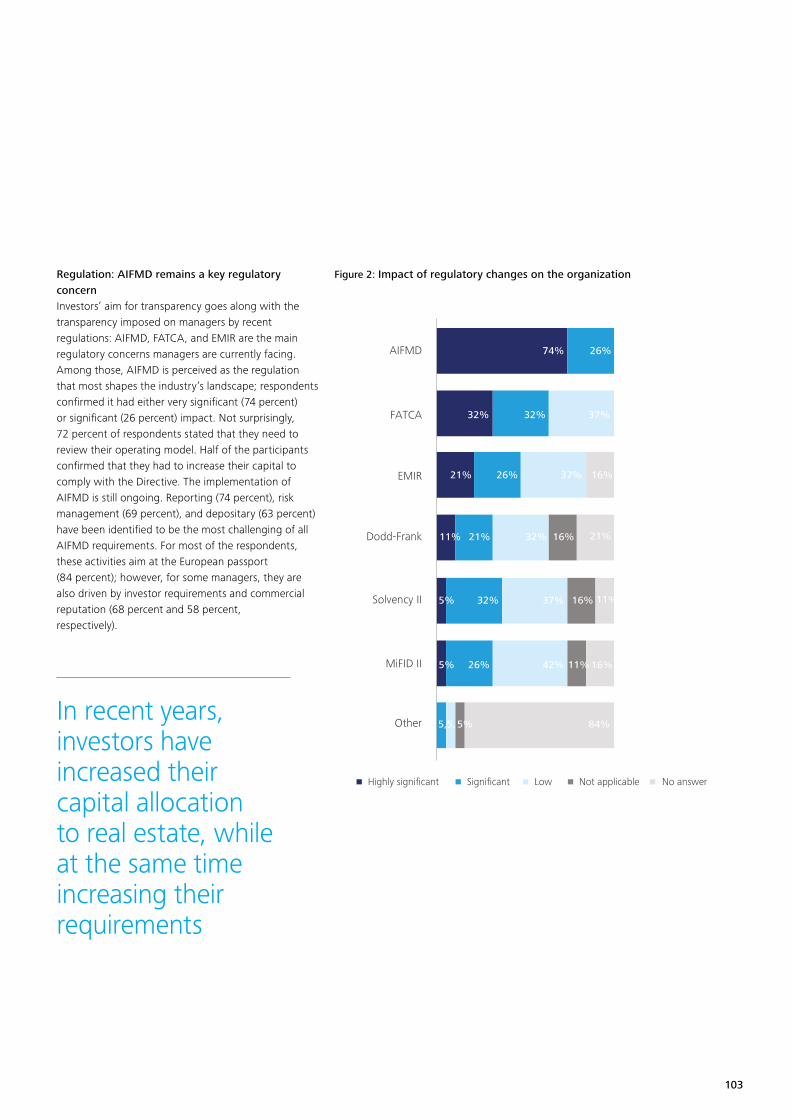
103
Regulation: AIFMD remains a key regulatory concernInvestors’ aim for transparency goes along with the transparency imposed on managers by recent regulations: AIFMD, FATCA, and EMIR are the main regulatory concerns managers are currently facing. Among those, AIFMD is perceived as the regulation that most shapes the industry’s landscape; respondents confirmed it had either very significant (74 percent) or significant (26 percent) impact. Not surprisingly, 72 percent of respondents stated that they need to review their operating model. Half of the participants confirmed that they had to increase their capital to comply with the Directive. The implementation of AIFMD is still ongoing. Reporting (74 percent), risk management (69 percent), and depositary (63 percent) have been identified to be the most challenging of all AIFMD requirements. For most of the respondents, these activities aim at the European passport (84 percent); however, for some managers, they are also driven by investor requirements and commercial reputation (68 percent and 58 percent, respectively).
Figure 2: Impact of regulatory changes on the organization
AIFMD 74%
32% 32% 37%
21% 26% 37% 16%
11% 21% 32% 16% 21%
5% 32% 37% 16% 11%
5% 26% 42% 11% 16%
5,5, 5% 84%
26%
FATCA
EMIR
Dodd-Frank
Solvency II
MiFID II
Other
32%
Highly significant Significant Low Not applicable No answer
In recent years, investors have increased their capital allocation to real estate, while at the same time increasing their requirements
104
Capitalizing the investment of AIFMD and simplifications are prioritiesWith AIFMD being one of the factors leading real estate asset managers to review their operating model, 17 percent of survey respondents confirmed the need for operational improvements.
However, when being asked about their operational priorities for the next two years, simplification is on top of the agenda, alongside the improvement ofefficiency and the increase in size of middle and back office functions to comply with regulatory requirements. The majority aims to turn AIFMD into a business opportunity rather than considering it as only a regulatory obligation, for instance, by increasing the number of mandates a single AIFM will manage or by developing a leaner structure via consolidating group entities.
The operational complexity real estate managers are facing is, first of all, driven by the large number of service providers involved in the fund administration (39 on average). More than 60 percent of respondents believe the number of service providers will even increase further.
The number of external parties involved is especially high at the level of property managers, accounting and corporate services and lawyers, which confirms that real estate is essentially a local business that requires local expertise and knowledge. At the portfolio level, the industry is using a variety of IT systems and tools for portfolio monitoring, while at the fund level, where standardization and efficiencies are achievable, asset managers heavily rely on MS Excel for consolidation, rather than using specific softwares.
In this respect, the outcome of the survey is not very promising: only 37 percent of managers are satisfied with their current RE systems, whereas only 16 percent are not. However, almost half of the asset managers plan to have to change or upgrade their systems in the next 12-24 months, turning the search for the right tool into an operational priority in the coming months.
Figure 3: Average number of service providers used
Property managers 11
Accounting/corporate services 7
Lawmakers 7
Fund administrator 4
Tax advisor 3
Auditors 3
Custodian 2
Financial advisors 2
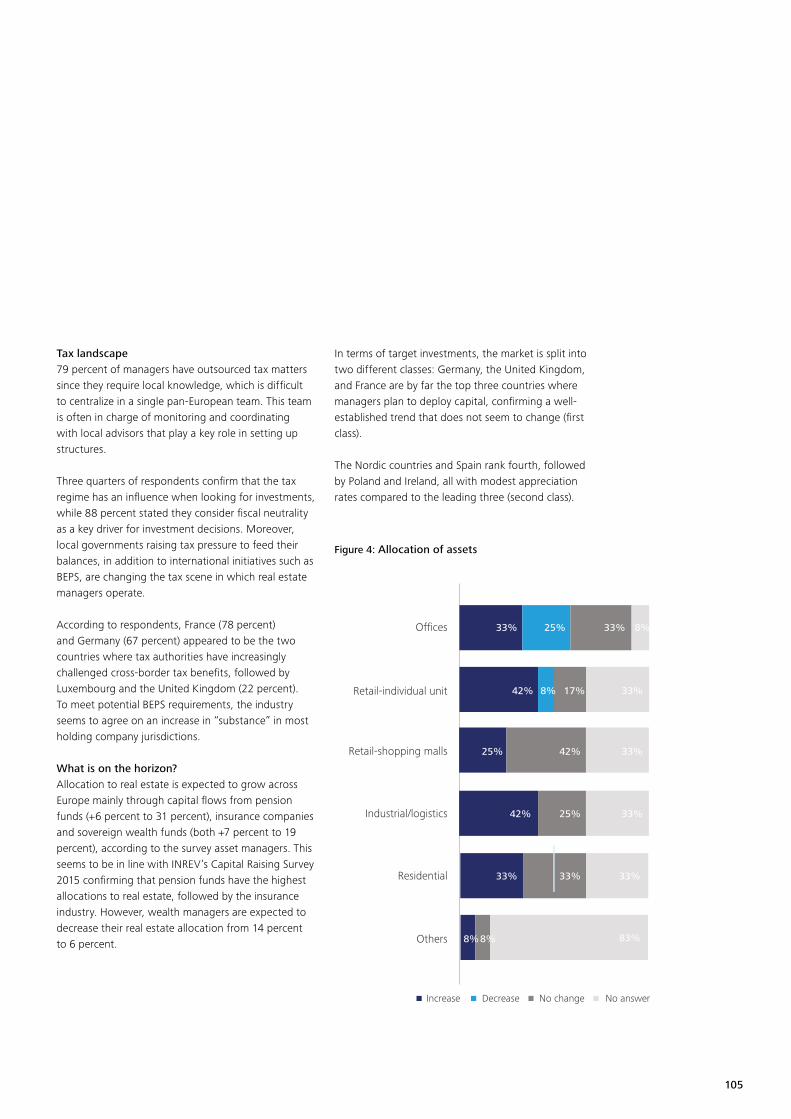
105
Tax landscape79 percent of managers have outsourced tax matters since they require local knowledge, which is difficult to centralize in a single pan-European team. This team is often in charge of monitoring and coordinating with local advisors that play a key role in setting up structures.
Three quarters of respondents confirm that the tax regime has an influence when looking for investments, while 88 percent stated they consider fiscal neutrality as a key driver for investment decisions. Moreover, local governments raising tax pressure to feed their balances, in addition to international initiatives such as BEPS, are changing the tax scene in which real estate managers operate.
According to respondents, France (78 percent) and Germany (67 percent) appeared to be the two countries where tax authorities have increasingly challenged cross-border tax benefits, followed by Luxembourg and the United Kingdom (22 percent).To meet potential BEPS requirements, the industry seems to agree on an increase in “substance” in most holding company jurisdictions.
What is on the horizon?Allocation to real estate is expected to grow across Europe mainly through capital flows from pension funds (+6 percent to 31 percent), insurance companies and sovereign wealth funds (both +7 percent to 19 percent), according to the survey asset managers. This seems to be in line with INREV’s Capital Raising Survey 2015 confirming that pension funds have the highest allocations to real estate, followed by the insurance industry. However, wealth managers are expected to decrease their real estate allocation from 14 percent to 6 percent.
In terms of target investments, the market is split into two different classes: Germany, the United Kingdom, and France are by far the top three countries where managers plan to deploy capital, confirming a well-established trend that does not seem to change (first class).
The Nordic countries and Spain rank fourth, followed by Poland and Ireland, all with modest appreciation rates compared to the leading three (second class).
Figure 4: Allocation of assets
Offices
Retail-individual unit
Retail-shopping malls
Industrial/logistics
Residential
Others
32%
26%
33% 25% 33% 8%
42% 8% 17% 33%
25% 42% 33%
42% 25% 33%
33%
8%8% 83%
33% 33%
Increase Decrease No change No answer

106
Asset servicers survey—key results
For real estate asset servicers, reinforcing staff and investing in technology are on top of the agenda, driven by a sustained and anticipated growth of the industry.
Investment in talent Real estate asset servicers have already directed their efforts toward recruiting the right profiles as well as creating learning and development opportunities for existing staff, as confirmed by 54 percent of respondents.
Figure 5: Future investments
Deloitte Drk GreenPantone 363
R60G138B46
100%
Deloitte Lt GreenPantone 381
R201G221B3
100%
Operating model and organizational transformation
Marketing and business development
Staff developmentand recruitment
Technology
LOW
HIGH
54%
27%
11%
8%
Ord
er o
f pr
iorit
y
For real estate asset servicers, reinforcing staff and investing in technology are on top of the agenda
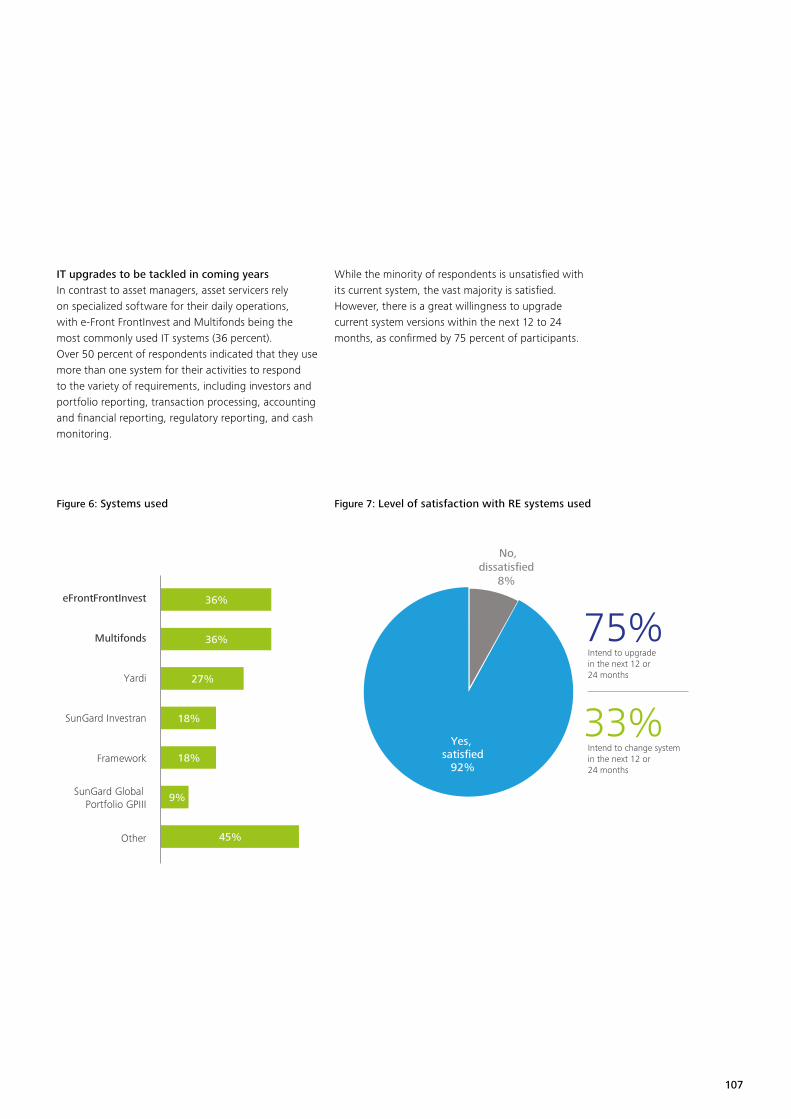
107
IT upgrades to be tackled in coming yearsIn contrast to asset managers, asset servicers rely on specialized software for their daily operations, with e-Front FrontInvest and Multifonds being the most commonly used IT systems (36 percent). Over 50 percent of respondents indicated that they use more than one system for their activities to respond to the variety of requirements, including investors and portfolio reporting, transaction processing, accounting and financial reporting, regulatory reporting, and cash monitoring.
While the minority of respondents is unsatisfied with its current system, the vast majority is satisfied. However, there is a great willingness to upgrade current system versions within the next 12 to 24 months, as confirmed by 75 percent of participants.
Figure 6: Systems used Figure 7: Level of satisfaction with RE systems used
Deloitte Drk GreenPantone 363
R60G138B46
100%
Deloitte Lt GreenPantone 381
R201G221B3
100%
45%
9%
18%
18%
27%
36%
36%
Other
eFront FrontInvest
Multifonds
Yardi
SunGard Investran
SunGard Global Portfolio GPIII
Framework
Deloitte Drk GreenPantone 363
R60G138B46
100%
Deloitte Lt GreenPantone 381
R201G221B3
100%
Yes,
No,dissatisfied
8%
Intend to upgradein the next 12 or 24 months
75%
Intend to change systemin the next 12 or24 months
33%
satisfied92%
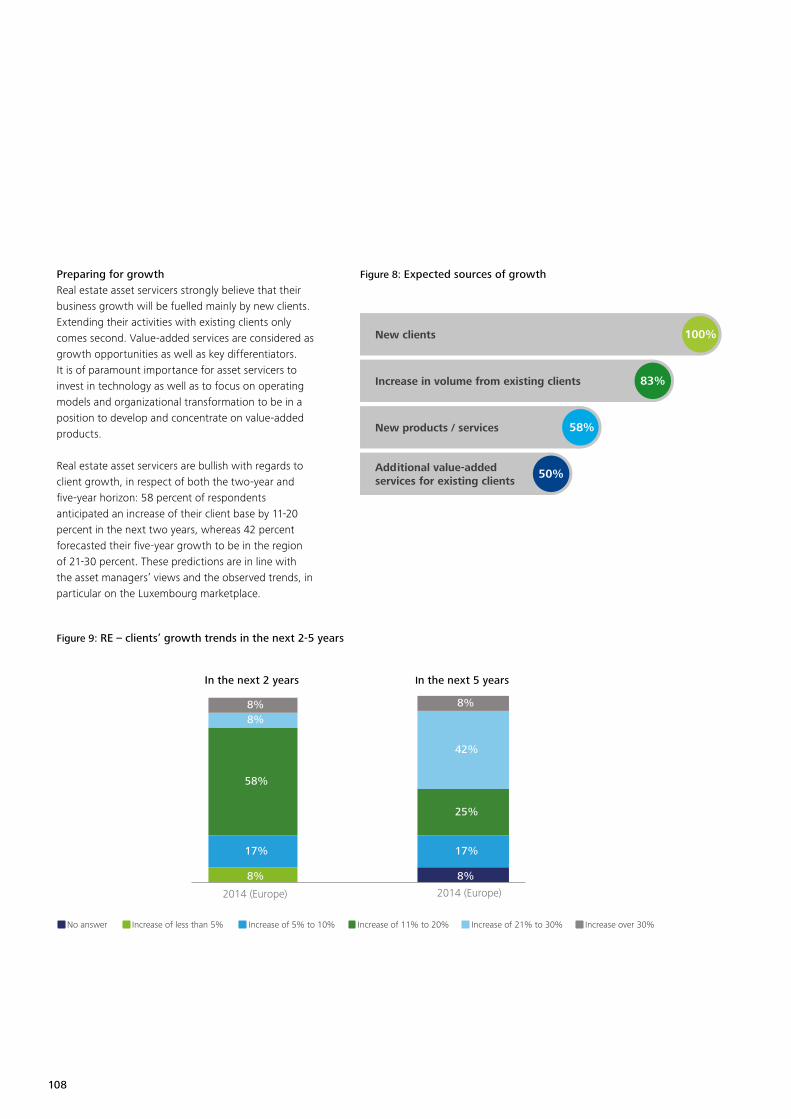
108
Preparing for growthReal estate asset servicers strongly believe that their business growth will be fuelled mainly by new clients. Extending their activities with existing clients only comes second. Value-added services are considered as growth opportunities as well as key differentiators. It is of paramount importance for asset servicers to invest in technology as well as to focus on operating models and organizational transformation to be in a position to develop and concentrate on value-added products.
Real estate asset servicers are bullish with regards to client growth, in respect of both the two-year and five-year horizon: 58 percent of respondents anticipated an increase of their client base by 11-20 percent in the next two years, whereas 42 percent forecasted their five-year growth to be in the region of 21-30 percent. These predictions are in line with the asset managers’ views and the observed trends, in particular on the Luxembourg marketplace.
Figure 8: Expected sources of growth
Figure 9: RE – clients’ growth trends in the next 2-5 years
New clients
Increase in volume from existing clients
New products / services
Additional value-added services for existing clients
100%
83%
58%
50%
8%
17%
58%
8%8%
2014 (Europe)
8%
17%
25%
42%
8%
2014 (Europe)
No answer Increase of less than 5% Increase of 5% to 10% Increase of 11% to 20% Increase of 21% to 30% Increase over 30%
In the next 5 yearsIn the next 2 years

109
To the point
• Two surveys were carried out, one targeting RE asset managers established primarily in the UK, Germany, France, Luxembourg, Denmark, Finland, and Norway, and one targeting RE asset servicers established primarily in Luxembourg, Ireland, Channel Islands, UK, Germany, France and the Netherlands
• Asset managers have a positive outlook in terms of access to capital over the next coming years, their main business feeders currently being pension funds, insurance companies, and funds of funds. Nevertheless, this increase in capital allocation is partnered with an increase in requirements such as the IRR, management fee rates and risk exposure
• Despite positive outlooks for capital, the AIFMD remains a top regulatory concern for asset managers and is considered to have great impact on the organization. It is a driver to review operating models, seek simplification, improve efficiency, and increase the size of middle and back office functions in order to meet the needs of the regulatory requirements
• Asset servicers on the other hand are currently prioritizing their investments in talent and technology. In contrast with asset managers who rely predominantly on MS Excel for their consolidations, asset servicers require more specialised software for their daily operations and there is great interest for IT system upgrades over the next 12-24 months
• Conclusively, both asset managers and asset servicers are expecting increased growth rates over the next two years; asset managers expect their increase to come mainly through greater capital flows and asset servicers expect their increase to come primarily through new client acquisitions
Conclusion: favorable winds, despite obligations
The survey shows a very positive outlook for the industry that is equally shared by asset managers and asset servicers, both of which have one common issue to tackle: the target operating model. How can we cope with new business, regulatory and investor pressure, and pan-European presence without costs being an obstacle to growth?

110
How can investment managers supercharge their alpha?Jordy MiggelbrinkDeloitte Alumnus& Co-Founder FusionATCM
The financial turmoil followed by the European debt crisis sparked an urgent search within the investment management sector for alternative strategies. Declining market valuations leading to decreased assets under management, new demands from regulators for greater transparency, and the increased presence of online broker platforms have all converged to drive down management fees while operational costs continued to rise.

111

112
These developments combined have had a huge and negative impact on organizational profitability and returns for the entire sector. Furthermore, over the same period, investment managers have faced continued challenges regarding their off-the-shelf trade management solutions. The implementation and configuration of such solutions can only be done with the support of an expensive vendor consulting force, whose knowledge and focus is limited to the one component of the overall trade cycle. The objective of achieving a fully integrated and seamless trade management solution becomes ever more elusive.
The investment manager must be satisfied with the consultant knowing their own system by heart whereas in reality the vendor specialist will fall back on the specific knowledge of the platform available with his colleagues. Furthermore, these systems, first developed in the early nineties, have become legacy and even obsolete from the current technological perspective.As markets have slowly recovered, there is momentum for the investment management sector to redefine the course of the future. Validation of the organizational mission and strategic goals will be essential in a world that has changed drastically.
Market responses still did not solve the challenges encountered
In order to respond to the challenges investment managers face today, market participants try to gain a greater level of efficiency in several ways. Investment managers have frequently outsourced their support functions and highly-commoditized operational functions to specialized partners. Often this means that technical and back office functions are outsourced to a service provider. Effectively, this means that nothing will change or improve; only the location of the proceedings has been transferred. The regulator also outlined that the investment manager remains responsible for all activities as a whole in all situations.
Consequently, outsourcing does not reduce operational and financial risks: core problems are not solved and additional reconciliations are required, causing increased and unneeded complexity.
As markets have slowly recovered, there is momentum for the investment management sector to redefine the course of the future

113
Investment managers move also away from reactive, tactical cost-cutting toward more strategic, forward-thinking initiatives. These cost-intensive initiatives consume a massive amount of time plus budget through the whole organization.
The investments in these programs, although planned and forecasted intensively, often end in extensive overruns. Furthermore, this approach has to be supported by expensive vendor consultants who are inadequate in achieving significant, durable improvement for the investment organization as a whole. This lack of improvement is caused by the limited focus of these consultants: they are only working towards their own product offering and are mostly technical driven with no value chain perspective. This has resulted in the situation where fundamental functional knowledge of the trade cycle is wholly unknown by vendor consultants, creating increasingly tough challenges for operational excellence.
Technology available nowadays causes massive challenges
Market challenges from the business and functional perspectives have already put a remarkable pressure on the organization as a whole. The dynamics of the investment manager’s organization even change drastically the instant that technology is being discussed at the table. Considering technology enables another view on the paradoxical world of investment management.
Current reactive development strategies applied by vendors, currently considered as top-tier software companies, create overall dilemmas from a trade cycle management perspective. This means that relatively valuable clients ask for feature requests based on their specific situation and their specific trade management cycle.
This defines new functionalities for the whole community. Other clients, with their specific situations, must comply with this new module or must create workarounds to fulfill their specific requirements. The vendors that try to avoid this situation have created their adjustments as add-ons instead to rebase the core functionalities. This means that the modules and add-ons will grow organically without an overall understanding of the platform behavior, missing out on chances of integration and optimization.
In case of urgent operational issues the investment manager will not be serviced properly. The lack of specific organizational knowledge on the side of the vendor or due to implementation decisions causes workarounds and inadequate processing. Furthermore software licenses and maintenance fees these days are considered to be sky high and unacceptable, yet necessary since there are no alternatives available. Implemented trade cycle management software solutions, however, generally only support a (small) part of the operational process. This consequently results in a squared cost result (also database, operating system, and other related systems).
114
From a technical perspective, well-known systems are only vertically scalable and therefore encounter severe performance challenges, causing operational risks in the trade cycle management process. This is solved using extra expensive hardware, memory and CPU, which in turn brings extra unforeseen and unintended costs with downside pressure on company financial results. Also, this extra technical capacity is constantly available but not continuously required.
Besides these difficulties, investment managers nowadays are confronted with the fact that available trade management cycle solutions are not able to build, evolve, and scale new functionalities and requirements in an agile, modular, and accelerated manner. Huge financial and time-consuming investments in implementation, upgrading and testing are required to keep up with these developments.
Basically the lack of functionalities and capabilities within the platforms currently available are financially compensated by the vendor’s clients. Our experience taught us that whenever the investment manager’s target-operating model is not controlled adequately, then operational costs become excessive, even so far as to put the organization as a whole at risk. The target-operating model reaches from portfolio management up to risk and performance management.
How to supercharge investment managers’ alpha?
The market is in an urgent need of a software partner that realizes that the investment management sector has fundamentally changed. A partner that understands the business challenges ahead, supports the investment manager in the changing market environments, understands new technological developments and increased investor’s demands, which require adaption of the investment managers, instantly. Because it seems that in the current situation the available well-known software vendors are finding it extremely difficult to anticipate required change and to adapt their off-the-shelf solutions accordingly. This is being expressed in the complex version upgrades that are planned over several months. This situation is accepted in a world where continuous agility is the new norm and is already adopted in other markets with great success.
Therefore the investment managers should focus on partnerships with companies that really encompass expert investment management business knowledge in combination with an in-depth understanding of the newest technological developments. A fusion should take place, a long-term software partnership that is able to assess the investment manager’s current and future needs based on continuous integration and development.
Since the recent market turmoil, there have arisen an increasing number of start-ups that are here to optimize the financial results and investment decisions and to enable the investment management organizations, allow them to become fully focussed on their key objective: meeting their client’s (financial and pension) needs.
These start-ups are standing up in order to supercharge progressive, result-focused and authentic investment managers to reach alpha, combined with absolute investment returns in an ever-changing environmental landscape, now and in the future.
Instead of a client-supplier relation, investment managers are best equipped for the challenges ahead in case they partner with a reliable, humble, yet forceful and passionate software partner

115
Nevertheless there are no investment managers or software partners that have the complete overview and expertise necessary to operate peerlessly in this complex and volatile market. The investment management sector must realize now that they are in a need of intensive support from “allies” on a “tour of duty.” Together with their allies, the investment manager is capable of developing new, fresh insights and staying widely connected with technological, environmental, and financial challenges ahead. These allies may enable key competences and keep them focused, enabling the investment manager to deliver above market expectations.
Fierce product offerings will enter the market (soon)
New platform developments are rising within the financial sector. Specifically, new SaaS based trade cycle management solutions are entering the investment management sector. With a lack of legacy these product offerings will fundamentally improve the behavior and experience of software for the investment management sector.
Innovative platform solutions will rival the current software offerings, which will lead to positive change for market participants. Solutions that are fundamentally fast, real-time, scalable, flexible, responsive, and easily customizable in a matter of hours. These initiatives have been fully designed based on forward thinking that better empowers the business towards the future.
Also, the new developments concerning integrated workflow capabilities will enable portfolio managers, traders, and downstream operational staff to work based on exceptions only. Experiencing an exceptional result in the straight-through processing rates compared to the current standards.
These solutions are complementary, functional, and top of the class. From a technical perspective, these new initiatives also have the upfront opportunity to outperform the de facto standard of current well-known software vendors. These new initiatives leverage the momentum of several high-profile open source projects and apply them based on micro-service architecture. This approach prevents language and framework lock-ins and enforces solution-driven technique choices. Micro-service architecture, realized upon containers, delivers a consequent development pipeline through the entire DTAP flow, combined with solid integration testing per micro-service: this provides confidence to push out multiple releases per day without interrupting users and without harming the quality of the innovative platform.

116
To the point
• The investment management sector is in urgent need of a software partner that understands their needs in detail and will find the optimal functional and technical solution that benefit their investment objectives. In the current approach, software vendors offer hosting services without changing the fundamentals of their platforms and do not deliver the needed results
• Within the market start-ups are supercharging progressive, result-focused, and authentic investment managers to reach alpha. Alpha combines with absolute investment returns in an ever-changing environmental landscape, now and in the future
• Investment managers have to collaborate with allies that enable direct open access to expert market insights. The current functional and technological fragmentation force investment managers to co-create solutions together with a software partner as one collaborating community containing visionaries and practitioners, all with a passion for investment management
• There is a strong development within the SaaS based software platforms. These solutions are fast, agile, secure, and support trade cycle management functions across asset classes. All are based on current standards without the dissatisfactions that are experienced today
Conclusion
Investment managers will be supercharged with product offerings that will make the difference— a difference in the world with their investment strategy, the blazing experience and increasing freedom for structuring their portfolios and model investments— all in favor of the benefits of their clients, the pension contributors, and other investors from all around the world. Investment managers have the possibility to choose from highly automated and optimized system solutions that are measured and optimized for the trade cycle management processes of today. Instead of a client-supplier relation, investment managers are best equipped for the challenges ahead in case they partner with a reliable, humble, yet forceful and passionate software partner. This will give the investment manager the best chance to succeed in the complex landscape that forms the investment manager sector today and tomorrow.
The investment managers should focus on partnerships with companies that really encompass expert investment management business knowledge in combination with an in-depth understanding of the newest technological developments

117
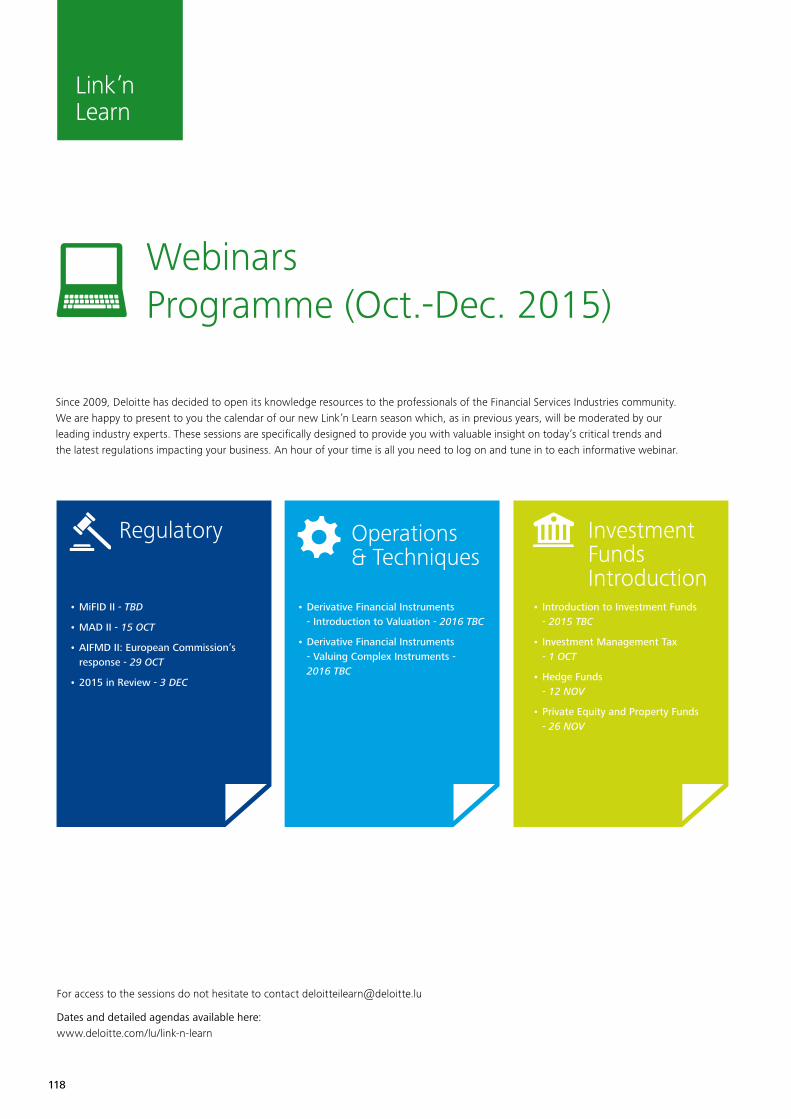
118
For access to the sessions do not hesitate to contact [email protected]
Dates and detailed agendas available here: www.deloitte.com/lu/link-n-learn
Since 2009, Deloitte has decided to open its knowledge resources to the professionals of the Financial Services Industries community.We are happy to present to you the calendar of our new Link’n Learn season which, as in previous years, will be moderated by our leading industry experts. These sessions are specifically designed to provide you with valuable insight on today’s critical trends and the latest regulations impacting your business. An hour of your time is all you need to log on and tune in to each informative webinar.
WebinarsProgramme (Oct.-Dec. 2015)
• MiFID II - TBD
• MAD II - 15 OCT
• AIFMD II: European Commission’s response - 29 OCT
• 2015 in Review - 3 DEC
Regulatory Operations & Techniques
• Derivative Financial Instruments - Introduction to Valuation - 2016 TBC
• Derivative Financial Instruments - Valuing Complex Instruments - 2016 TBC
• Introduction to Investment Funds - 2015 TBC
• Investment Management Tax - 1 OCT
• Hedge Funds - 12 NOV
• Private Equity and Property Funds - 26 NOV
InvestmentFundsIntroduction
Link’n Learn

119
Although the worlds of UCITS and AIFMD are converging, major challenges still lie ahead to ensure cross-border compliance when it comes to distribution and marketing of funds.
Deloitte can help you through the maze of regulatory and practical requirements to ensure a seamless and effective cross-border distribution strategy.
More information on: www.deloitte.com/lu
Keeping a cool head in an ever- changing regulatory landscape
Deloitte Luxembourg’s app isDeloitte Luxembourg’s app is
© 2015. For information, contact Deloitte Touche Tohmatsu Limited.
120
Contacts
Africa - East, West and South
Martin Oduor-OtienoPartner - Consulting+254 20 423 [email protected]
David AchugamonuPartner - FSI+234 190 417 [email protected]
Dinesh Munu Partner - Audit +27 011 806 5767 [email protected]
Argentina
Claudio FiorilloPartner - MSS+54 11 432 027 00 [email protected]
Australia
Neil BrownPartner – Assurance & Advisory, Wealth Management +61 3 967 171 54 [email protected]
Declan O'CallaghanPartner – Assurance & Advisory, Wealth Management +61 2 932 273 [email protected]
Austria
Dominik DammPartner - Advisory+431 537 005 [email protected]
Robert PejhovskyPartner - Tax & Audit+431 537 004 [email protected]
Bahamas
Lawrence LewisPartner - ERS+1 242 302 4898 [email protected]
Belgium
Philip Maeyaert Partner - Audit+32 2 800 [email protected]
Maurice VrolixPartner - Audit+32 2 800 [email protected]
Bermuda
Mark BaumgartnerPartner - Audit+1 441 299 [email protected]
James DockerayDirector - Tax+1 441 299 1399 [email protected]
Muhammad KhanPartner - Audit+1 441 299 [email protected]
Brazil
Gilberto Souza Partner - Audit+55 11 5186 [email protected]
Marcelo TeixeiraPartner - Audit+55 11 5186 [email protected]
British Virgin Islands
Carlene A. RomneyDirector - Audit+1 284 494 [email protected]
Canada
George KosmaPartner - Audit+1 416 601 [email protected]
Mervyn RamosPartner - Audit+1 416 601 [email protected]
Don Wilkinson Partner - Audit+1 416 601 [email protected]
Cayman Islands
Dale BabiukPartner - Audit+1 345 814 [email protected]
Anthony FantasiaPartner - Tax+1 345 814 [email protected]
Norm McGregorPartner - Audit+1 345 814 [email protected]
Stuart SybersmaPartner - Financial Advisory Services +1 345 814 [email protected]
Central Europe
Grzegorz CimochowskiPartner, Consulting+48 22 511 [email protected]
Chile
Ricardo BriggsPartner - Consulting+56 2 2729 [email protected]
Pablo HerreraPartner - Financial Advisory Services+56 2 2729 [email protected]
Alberto KulenkampffPartner - Audit+ 56 22729 7368 [email protected]
Pablo Vera Partner - Tax & Legal+56 2 2729 [email protected]
China (Southern)
Sharon LamPartner - International Tax Services +852 28 52 65 36 [email protected]
Anthony LauPartner - International Tax Services+852 2852 [email protected]
Colombia
Ricardo RubioPartner - Financial Advisory Services+57 1 546 [email protected]
Cyprus
Charles P. Charalambous Director - Investment Advisory Services+357 223 606 27 [email protected]
Denmark
John LadekarlPartner - Audit+453 610 207 [email protected]
Per Rolf LarssenPartner - Audit+453 610 318 [email protected]

121
Finland
Petri HeinonenPartner - Financial Services +358 20 755 [email protected]
France
Stéphane CollasPartner - Audit+33 1 55 61 61 [email protected]
Olivier GaliennePartner - Audit+33 1 58 37 90 62 [email protected]
Sylvain GiraudPartner - Audit+33 1 40 88 25 15 [email protected]
Pascal KoenigPartner - Consulting+33 1 55 61 66 [email protected]
Jean-Marc LecatPartner - Audit+33 1 55 61 66 [email protected]
Jean-Pierre VercamerPartner - Audit+33 1 40 88 22 [email protected]
Germany
Andreas KochPartner - Audit+49 892 903 687 [email protected]
Marcus RothPartner - Tax+49 892 903 682 [email protected]
Dorothea Schmidt Partner - Consulting+49 699 713 734 [email protected]
Annke von Tiling Director - Audit+49 697 569 560 [email protected]
Thorge Steinwede Director - Consulting+49 699 713 [email protected]
Gibraltar
Joseph CaruanaPartner - Audit+350 200 112 [email protected]
Jon TrickerPartner - Audit+350 200 112 [email protected]
Greece
Alexandra KostaraPartner - Audit +30 210 67 81 152 [email protected]
Despina XenakiPartner - Audit +30 210 67 81 [email protected]
Guernsey
John ClacyPartner - Audit+44 1 481 703 [email protected]
Iceland
Arni Jon ArnasonPartner - FAS+354 580 30 [email protected]
India
Porus DoctorPartner – ERS+91 22 6185 [email protected]
Vipul R. Jhaveri Partner - Tax +91 22 6185 4190 [email protected]
Kalpesh J MehtaPartner – IM +91 22 6185 [email protected]
Bimal ModiSenior Director - FAS+91 22 6185 [email protected]
Monish ShahSenior Director – Consulting+91 22 6185 [email protected]
Indonesia
Bing HariantoPartner - Audit+62 21 2992 [email protected]
Osman SitorusPartner - Audit+62 21 2992 [email protected]
Merliyana SyamsulPartner - Audit+62 21 2992 [email protected]
Ireland
David Dalton Partner - Consulting+353 140 748 [email protected]
Brian ForresterPartner - Audit+353 141 726 14 [email protected]
Mike HartwellPartner - Audit+353 141 723 [email protected]
Brian Jackson Partner - Audit+ 353 141 729 [email protected]
Christian MacManus Partner - Audit+353 141 785 [email protected]
Deirdre PowerPartner - Tax+353 141 724 [email protected]
Israel
Naama Rosenzwig Director - ERS +972 3 608 5251 [email protected]
Italy
Marco De PontiPartner - Audit+390 283 322 [email protected]
Maurizio FerreroPartner - Audit +390 283 322 [email protected]
Paolo Gibello-RibattoPartner - Audit+390 283 322 [email protected]

122
Laurent Fedrigo Partner - Audit +352 451 452 [email protected]
Nicolas Hennebert Partner - Audit +352 451 454 [email protected]
Lou KieschPartner - Regulatory Consulting +352 451 452 [email protected]
Johnny Yip Lan YanPartner - Audit+352 451 452 [email protected]
Malaysia
Kim Tiam HiewPartner - A&A+60 3 772 365 [email protected]
Anthony TaiExecutive Director – Enterprise Risk Services+60 3 7610 [email protected]
Malta
Stephen ParisPartner - Audit+356 234 324 [email protected]
Mexico
Ernesto PinedaPartner - Financial Services+52 55 5080 [email protected]
Javier VàzquezPartner - Financial Services+52 55 5080 [email protected]
Middle East
Humphry HattonCEO - FAS+971 4 506 47 [email protected]
Netherlands
Ton BerendsenPartner - Audit+31 88 2884 [email protected]
Bas Castelijn Partner - Tax+38 2886 [email protected]
Erwin Houbrechts Director - Audit+31 88 288 [email protected]
Remy Maarschalk Partner - Audit+31 88 288 [email protected]
New Zealand
Rodger MurphyPartner - Enterprise Risk Services+64 930 307 [email protected]
Michael WilkesPartner - Audit+64 3 363 [email protected]
Norway
Henrik WoxholtPartner - Audit & Advisory+47 23 27 90 00 [email protected]
Peru
Javier CandiottiPartner - Audit +51 (1) 211 [email protected]
Philippines
Francis AlbalatePartner - Audit+63 2 581 [email protected]
Portugal
Maria Augusta FranciscoPartner - Audit+351 21 042 [email protected]
Russia
Anna Golovkova Partner - Audit +7 495 5809 790 [email protected]
Singapore
Ei Leen GiamPartner - Assurance & Advisory+ 65 62 163 [email protected]
Kok Yong HoPartner - Global Financial Services Industry+65 621 632 [email protected]
Serena YongPartner - Global Financial Services Industry+65 6530 [email protected]
Japan
Masao AsanoPartner - Advisory Services+81 90 8508 [email protected]
Yang Ho KimPartner - Tax+81 3 6213 [email protected]
Nobuyuki YamadaPartner - Audit+81 90 6503 [email protected]
Mitoshi YamamotoPartner - Consulting+81 90 1764 [email protected]
Jersey
Gregory BranchPartner - Audit+44 1 534 82 [email protected]
Andrew IshamPartner - Audit+44 1 534 824 [email protected]
Kazakhstan
Roman SattarovDirector - Audit+7 7272 [email protected]
Korea
Kenneth KangPrincipal - Consulting+82 2 6676 [email protected]
Sun Yeop KimPartner - AERS+82 2 6676 [email protected]
Young An KimPartner - AERS+82 2 6676 3330 [email protected]
Nak Sup Ko Partner - Audit +82 2 6676 [email protected]
Luxembourg
Eric CentiPartner - Cross-Border Tax+352 451 452 [email protected]
Benjamin CollettePartner - Advisory & Consulting+352 451 452 [email protected]
123
Slovakia
Miroslava Terem GreštiakováAssociate Partner - Deloitte Legal+421 2 582 49 [email protected]
Spain
Rodrigo Diaz Partner - Audit +349 144 320 21 [email protected]
Gloria HernándezPartner – Regulatory Consulting+349 143 810 [email protected]
Alberto Torija Partner - Audit +349 143 814 91 [email protected]
Antonio Rios CidPartner - Audit +349 915 141 492 [email protected]
Sweden
Elisabeth Werneman Partner - Audit +46 733 97 24 86 [email protected]
Switzerland
Cornelia Herzog Partner - Financial Service Industry+41 58 279 [email protected]
Marcel Meyer Partner - Audit+41 58 279 [email protected]
Stephan Schmidli Partner - Audit +41 58 279 6221 [email protected]
Andreas Timpert Partner - Consulting +41 58 279 6858 [email protected]
Taiwan
Vincent Hsu Partner - Audit +886 2 545 9988 1436 [email protected]
Olivia KuoPartner - Audit +886 2 [email protected]
Jimmy S. WuPartner - Audit+886 2 2545 9988 [email protected]
United Kingdom
Tony GaughanPartner - Audit+44 20 7303 [email protected]
Jamie PartridgePartner - Audit+44 14 1314 5956 [email protected]
Andrew PowerPartner – Consulting+44 20 7303 [email protected]
Chris Tragheim Partner – Tax+44 20 7303 [email protected]
Mark WardPartner – Audit+44 20 7007 [email protected]
Thailand
Thavee ThaveesangsakulthaiPartner – Financial Advisory Services+66 2 676 [email protected]
Somkrit KrishnamraPartner – Enterprise Risk Services+66 2 676 [email protected]
Turkey
Mehmet SamiPartner - Financial Advisory Services+90 212 366 60 [email protected]
United Arab Emirates
George NajemPartner - Audit+971 2 408 [email protected]
United States
Edward DoughertyPartner - Tax+1 212 436 [email protected]
Joseph FisherPartner - Audit+1 212 436 [email protected]
Patrick HenryUS Investment Management Leader+1 212 436 [email protected]
Paul KraftUS Mutual Fund Leader+1 617 437 [email protected]
Peter SpenserPartner - Consulting+1 212 618 [email protected]
Adam WeismanPartner - Financial Advisory Services +1 212 436 [email protected]
Venezuela
Fatima De AndradePartner - Audit+58 212 206 8548 [email protected]
Vietnam
Thinh PhamCountry Managing Partner+84 [email protected]
Contacts
Cary Stier Partner - Global Investment Management Leader +1 212 436 7371 [email protected]
Vincent Gouverneur Partner - EMEA Investment Management Leader +352 451 452 451 [email protected]
Jennifer Qin Partner - Asia Pacific Investment Management Leader +86 21 61 411 998 [email protected]
Please do not hesitate to contact your relevant country experts listed in the magazine
Deloitte is a multidisciplinary service organisation which is subject to certain regulatory and professional restrictions on the types of services we can provide to our clients, particularly where an audit relationship exists, as independence issues and other conflicts of interest may arise. Any services we commit to deliver to you will comply fully with applicable restrictions.
Due to the constant changes and amendments to Luxembourg legislation, Deloitte cannot assume any liability for the content of this leaflet. It shall only serve as general information and shall not replace the need to consult your Deloitte adviser.
About Deloitte Touche Tohmatsu Limited: Deloitte refers to one or more of Deloitte Touche Tohmatsu Limited, a UK private company limited by guarantee, and its network of member firms, each of which is a legally separate and independent entity. Please see www.deloitte.com/lu/about for a detailed description of the legal structure of Deloitte Touche Tohmatsu Limited and its member firms.
Deloitte provides audit, tax, consulting, and financial advisory services to public and private clients spanning multiple industries. With a globally connected network of member firms in more than 150 countries, Deloitte brings world-class capabilities and high-quality service to clients, delivering the insights they need to address their most complex business challenges. Deloitte’s approximately 210,000 professionals are committed to becoming the standard of excellence.
© 2015. Designed and produced by MarCom at Deloitte Luxembourg.