Embed Size (px)
Citation preview

EMEA Investor Briefing
David Taylor-Smith
15 May 2014

2
Financial Review Angus Cockburn, CFO
Overview
Overview
3
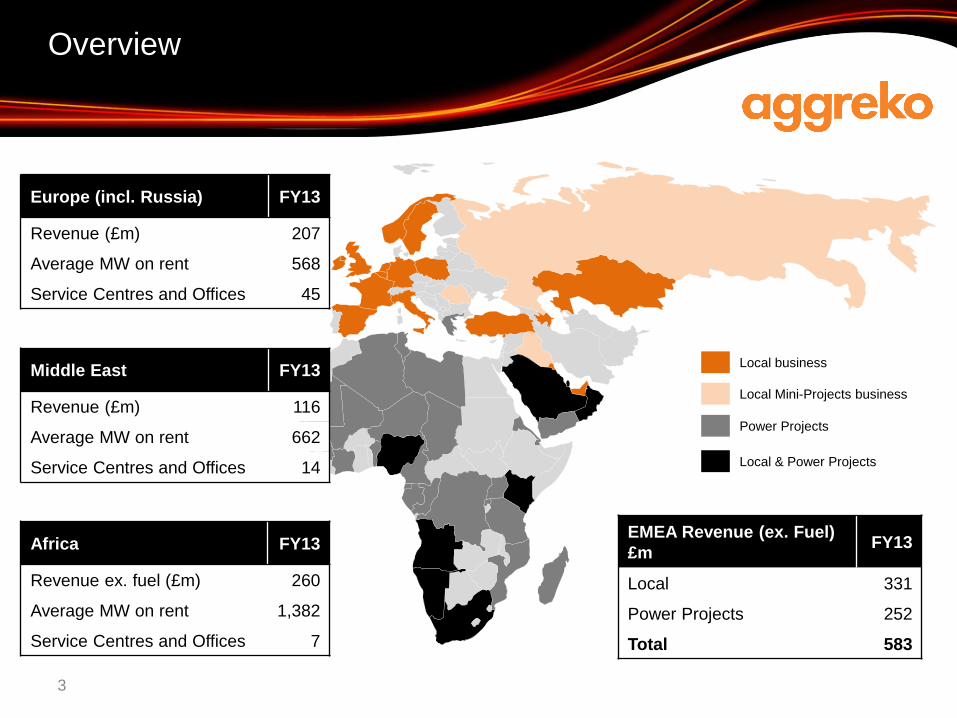
Europe (incl. Russia) FY13
Revenue (£m) 207
Average MW on rent 568
Service Centres and Offices 45
Local Mini-Projects business
Power Projects
Local & Power Projects
Local business
EMEA Revenue (ex. Fuel)
£m FY13
Local 331
Power Projects 252
Total 583
Middle East FY13
Revenue (£m) 116
Average MW on rent 662
Service Centres and Offices 14
Africa FY13
Revenue ex. fuel (£m) 260
Average MW on rent 1,382
Service Centres and Offices 7
2013 Performance
4
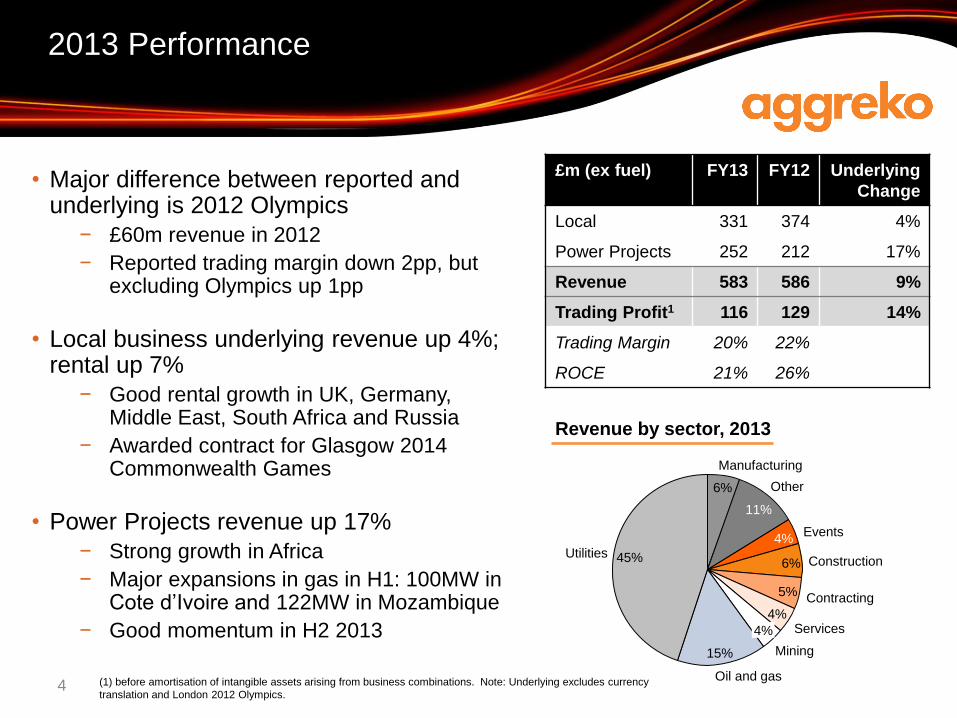
• Major difference between reported and underlying is 2012 Olympics
− £60m revenue in 2012
− Reported trading margin down 2pp, but excluding Olympics up 1pp
• Local business underlying revenue up 4%; rental up 7%
− Good rental growth in UK, Germany, Middle East, South Africa and Russia
− Awarded contract for Glasgow 2014 Commonwealth Games
• Power Projects revenue up 17%
− Strong growth in Africa
− Major expansions in gas in H1: 100MW in Cote d’Ivoire and 122MW in Mozambique
− Good momentum in H2 2013
(1) before amortisation of intangible assets arising from business combinations. Note: Underlying excludes currency
translation and London 2012 Olympics.
4%
11%
£m (ex fuel) FY13 FY12 Underlying
Change
Local 331 374 4%
Power Projects 252 212 17%
Revenue 583 586 9%
Trading Profit1 116 129 14%
Trading Margin 20% 22%
ROCE 21% 26%
Revenue by sector, 2013
5%
Oil and gas
15% Mining
4%
Contracting
Services 4%
Construction 6%
Events 4%
Utilities 45%
Other
11%
Manufacturing
6%

Local Business
Local Business Summary
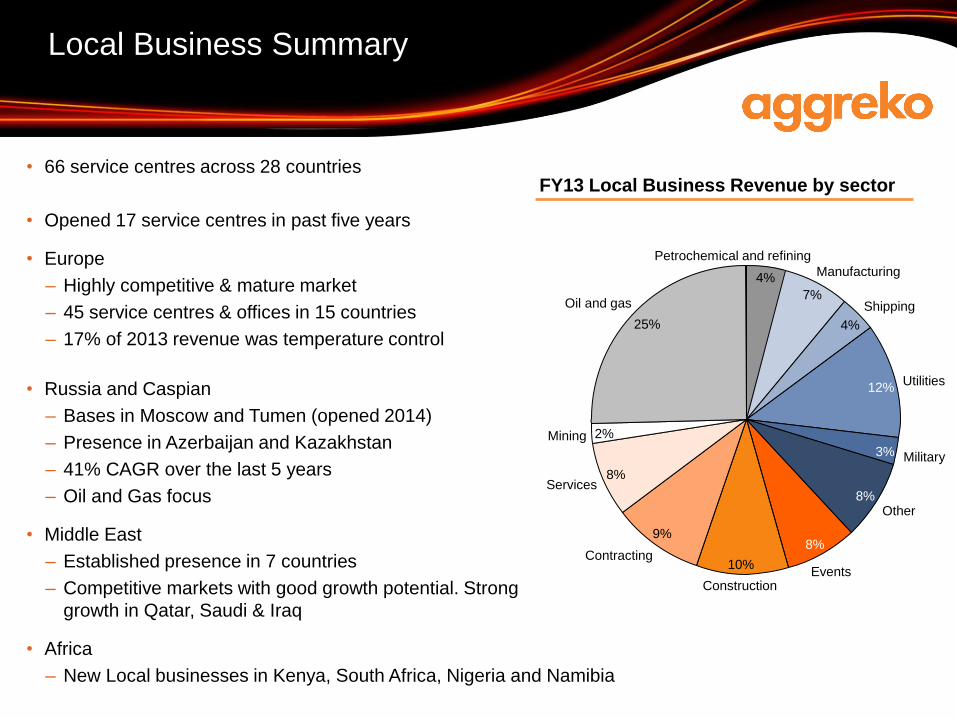
• 66 service centres across 28 countries
• Opened 17 service centres in past five years
• Europe
– Highly competitive & mature market
– 45 service centres & offices in 15 countries
– 17% of 2013 revenue was temperature control
• Russia and Caspian
– Bases in Moscow and Tumen (opened 2014)
– Presence in Azerbaijan and Kazakhstan
– 41% CAGR over the last 5 years
– Oil and Gas focus
• Middle East
– Established presence in 7 countries
– Competitive markets with good growth potential. Strong
growth in Qatar, Saudi & Iraq
• Africa
– New Local businesses in Kenya, South Africa, Nigeria and Namibia
FY13 Local Business Revenue by sector
Utilities
8% Other
12%
4%
Manufacturing
7%
Petrochemical and refining
4%
Oil and gas
25%
Mining 2%
Services 8%
Contracting
9%
Shipping
Construction
10% Events
8%
3% Military

Local Business Strategy
• EMEA
− Grow TC
− Bolt on acquisitions and enter new markets when logical
− Respond to emergencies
• Europe
− Focus on sectors where power is critical and/or growing – renewables, events, oil and gas, utilities
− Provide balancing services when market conditions are right
− Improve our cost and productivity
• Russia and Caspian
− Continue to grow oil and gas
− Expand into new sectors – mining, petrochemical, district heating
− Expand presence in Caspian
• Africa
− Focus on Kenya, Nigeria and South Africa markets and use these locations as regional hubs
− Focus on mining, industrials, telecommunications and oil and gas
• Middle East
− Focus on key sectors - infrastructure, oil and gas, events, utilities
− Focus on key high growth markets – Iraq, Saudi, Qatar
Local Business Case study: UK
Growth in mature markets
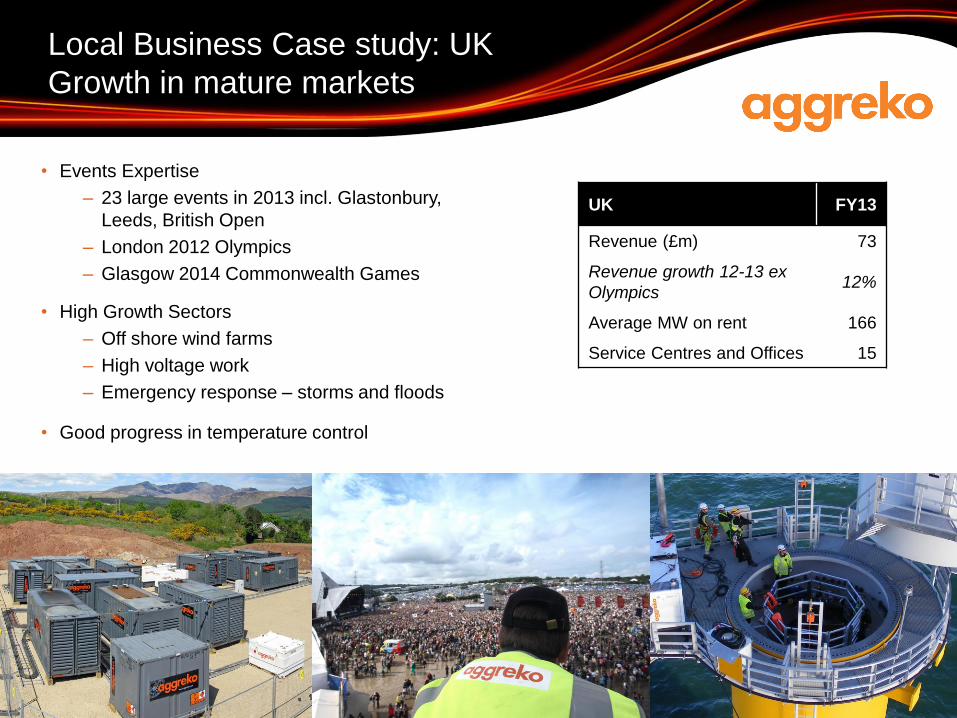
• Events Expertise
– 23 large events in 2013 incl. Glastonbury,
Leeds, British Open
– London 2012 Olympics
– Glasgow 2014 Commonwealth Games
• High Growth Sectors
– Off shore wind farms
– High voltage work
– Emergency response – storms and floods
• Good progress in temperature control
8
UK FY13
Revenue (£m) 73
Revenue growth 12-13 ex
Olympics 12%
Average MW on rent 166
Service Centres and Offices 15
Power Projects
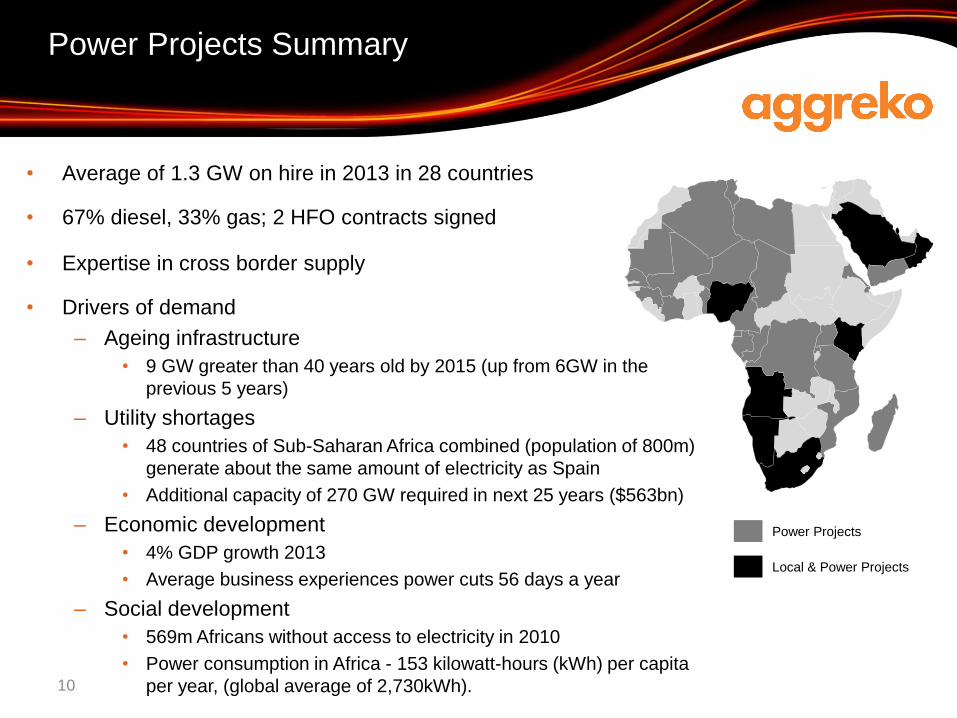
Power Projects Summary
• Average of 1.3 GW on hire in 2013 in 28 countries
• 67% diesel, 33% gas; 2 HFO contracts signed
• Expertise in cross border supply
• Drivers of demand
– Ageing infrastructure
• 9 GW greater than 40 years old by 2015 (up from 6GW in the
previous 5 years)
– Utility shortages
• 48 countries of Sub-Saharan Africa combined (population of 800m)
generate about the same amount of electricity as Spain
• Additional capacity of 270 GW required in next 25 years ($563bn)
– Economic development
• 4% GDP growth 2013
• Average business experiences power cuts 56 days a year
– Social development
• 569m Africans without access to electricity in 2010
• Power consumption in Africa - 153 kilowatt-hours (kWh) per capita
per year, (global average of 2,730kWh).
Power Projects
Local & Power Projects
10
Power Projects Strategy
11
• Focus on Africa but respond to large scale opportunities in other countries (emergencies and
balancing services)
• Technology - Grow gas and HFO. Diesel remains important
• Sectors – Utilities, mining, oil and gas, industrials
• Expand presence in Africa
– Use Kenya, Nigeria and South Africa businesses as logistics and sales hubs
– Establish greater presence in markets where we already have a presence
– Establish greater sales presence in Africa
– Enter new markets – Libya, Egypt
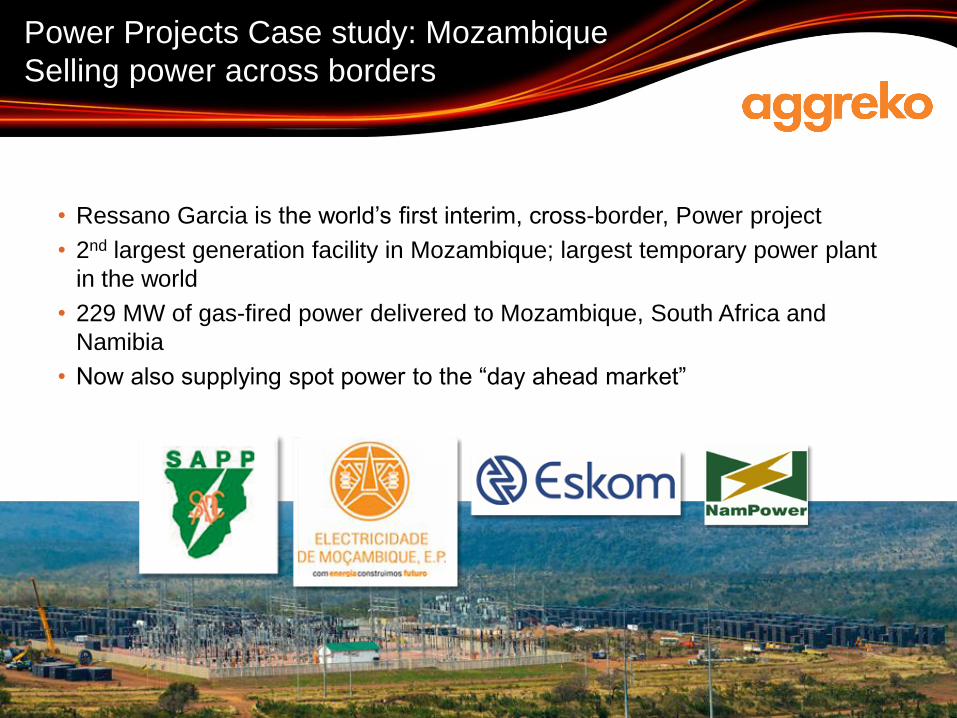
Power Projects Case study: Mozambique
Selling power across borders
• Ressano Garcia is the world’s first interim, cross-border, Power project
• 2nd largest generation facility in Mozambique; largest temporary power plant
in the world
• 229 MW of gas-fired power delivered to Mozambique, South Africa and
Namibia
• Now also supplying spot power to the “day ahead market”
13
Summary
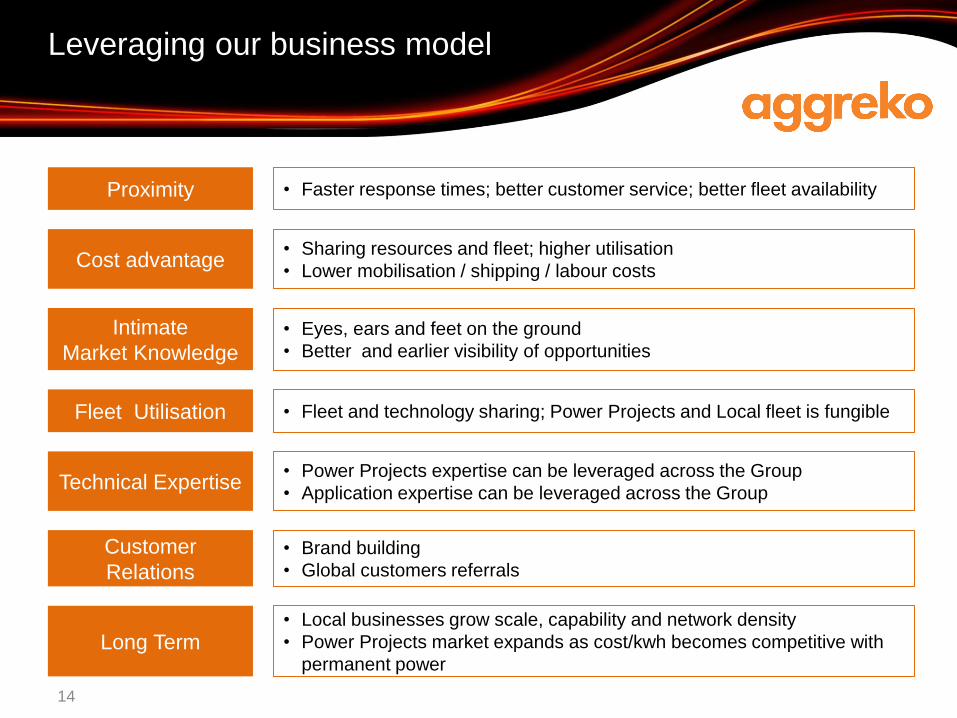
Leveraging our business model
14
Intimate
Market Knowledge
• Eyes, ears and feet on the ground
• Better and earlier visibility of opportunities
Fleet Utilisation • Fleet and technology sharing; Power Projects and Local fleet is fungible
Customer
Relations
• Brand building
• Global customers referrals
Cost advantage • Sharing resources and fleet; higher utilisation
• Lower mobilisation / shipping / labour costs
Technical Expertise • Power Projects expertise can be leveraged across the Group
• Application expertise can be leveraged across the Group
Proximity • Faster response times; better customer service; better fleet availability
Long Term • Local businesses grow scale, capability and network density
• Power Projects market expands as cost/kwh becomes competitive with
permanent power
Conclusion
15
• EMEA has good structural growth drivers particularly in Africa, Middle East,
Russia and Caspian
• We have a unique network in 28 countries which we can leverage
• We have a strong track record in key sectors – utilities, mining and oil and gas
• Our products offer excellent value to customers

Q&A
Disclaimer
This presentation may contain certain “forward-looking” statements. By their nature, forward-looking statements involve risk and uncertainty because they relate to future events and circumstances. Actual outcomes and results may differ materially from any outcomes or results expressed or implied by such forward-looking statements. Any forward-looking statements made by or on behalf of Aggreko speak only as of the date they are made and no representation or warranty is given in relation to them, including as to their completeness or accuracy or the basis on which they were prepared.
This presentation is published solely for information purposes.
The distribution of this presentation in jurisdictions other than the UK may be restricted by law and therefore any persons who are subject to the laws of any jurisdiction other than the UK should inform themselves about, and observe, any applicable requirements.
All opinions expressed in this presentation are subject to change without notice and may differ from opinions expressed elsewhere.
17