Embed Size (px)
Citation preview
1 © Copyright 2015 EMC Corporation. All rights reserved.
WELCOME EMC 2015 Annual Meeting of Shareholders
April 30, 2015
1 © Copyright 2015 EMC Corporation. All rights reserved.
CORPORATE OVERVIEW Zane Rowe
Chief Financial Officer
2 © Copyright 2015 EMC Corporation. All rights reserved.
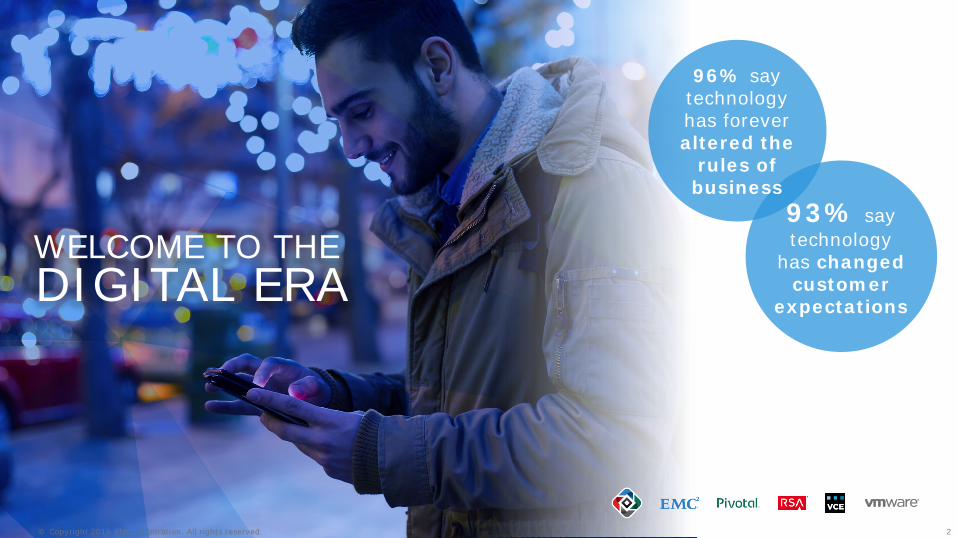
93% say technology
has changed customer
expectations
96% say technology has forever altered the
rules of business
© Copyright 2015 EMC Corporation. All rights reserved.
WELCOME TO THE DIGITAL ERA
3 © Copyright 2015 EMC Corporation. All rights reserved.
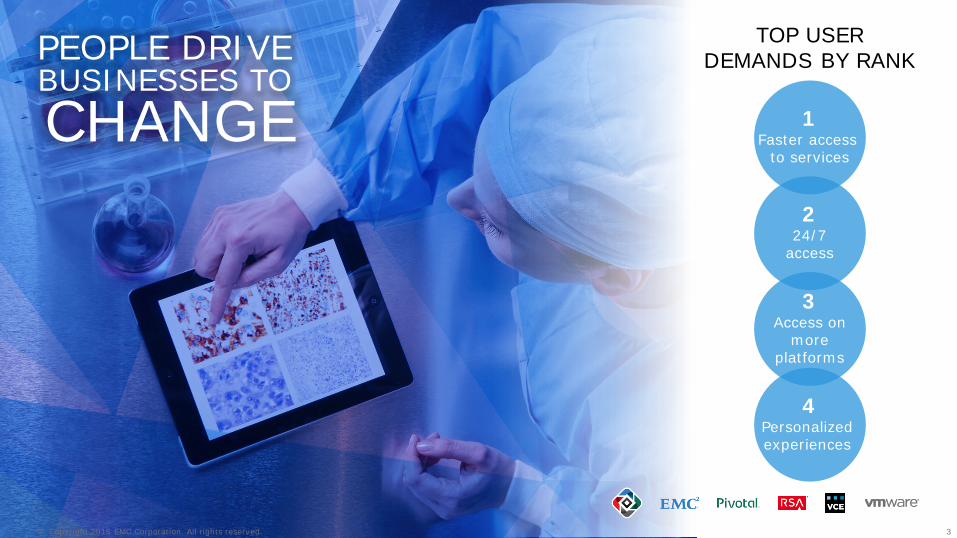
TOP USER DEMANDS BY RANK
© Copyright 2015 EMC Corporation. All rights reserved.
1 Faster access
to services
2 24/7
access
3 Access on
more platforms
4 Personalized experiences
PEOPLE DRIVE BUSINESSES TO CHANGE
4 © Copyright 2015 EMC Corporation. All rights reserved.
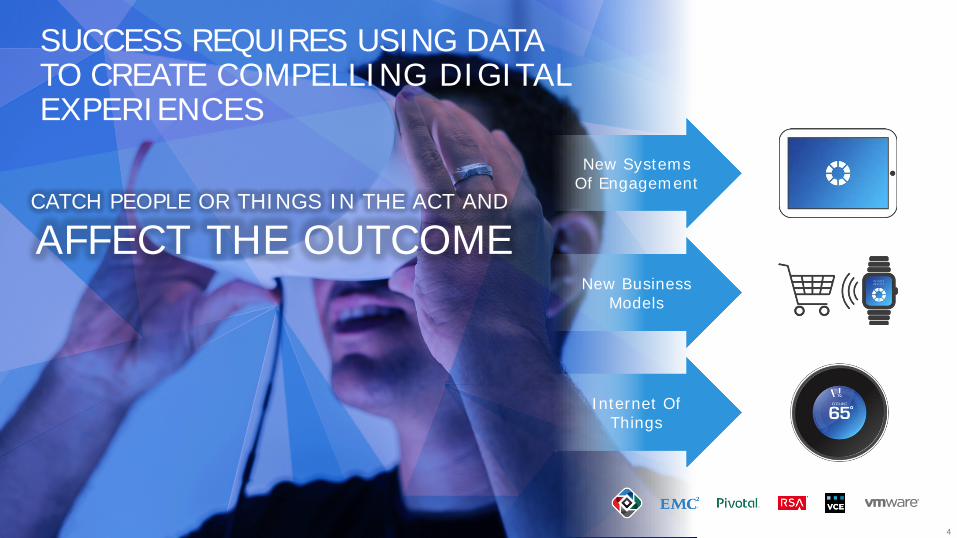
SUCCESS REQUIRES USING DATA TO CREATE COMPELLING DIGITAL EXPERIENCES
CATCH PEOPLE OR THINGS IN THE ACT AND
AFFECT THE OUTCOME
New Systems Of Engagement
New Business Models
Internet Of Things
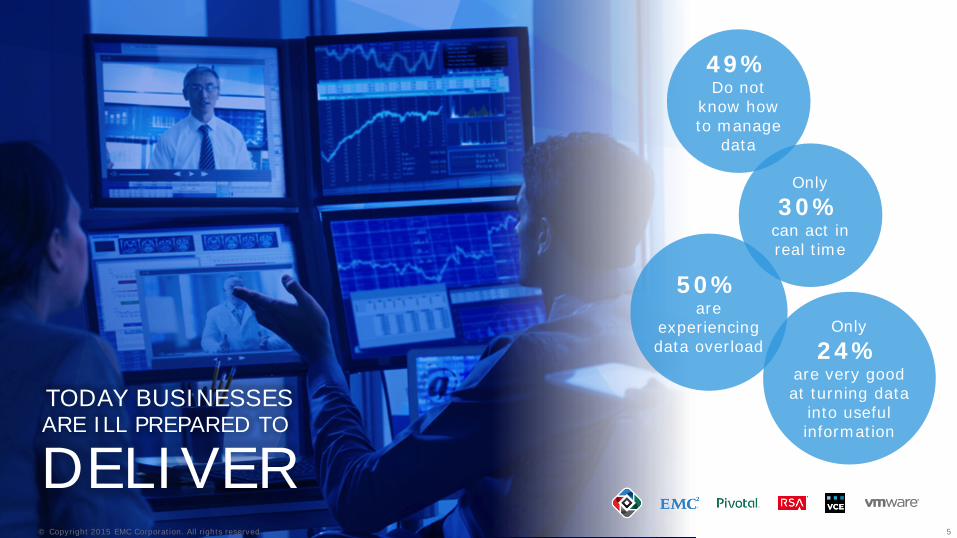
5 © Copyright 2015 EMC Corporation. All rights reserved.
Only
30% can act in real time
Only
24% are very good at turning data
into useful information
50% are
experiencing data overload
49% Do not
know how to manage
data
© Copyright 2015 EMC Corporation. All rights reserved.
TODAY BUSINESSES ARE ILL PREPARED TO
DELIVER
6 © Copyright 2015 EMC Corporation. All rights reserved.
WE HELP CUSTOMERS TRANSFORM AND DIGITIZE THEIR BUSINESSES
• SOFTWARE TO MANAGE COMPUTE, NETWORKING & STORAGE
• HYBRID CLOUD
• DESKTOP & MOBILE DEVICES
• APPLICATIONS
• PAAS - RUN APPS ON ANY CLOUD
• BIG DATA - SYNTHESIZE & ACT UPON DATA
6 © Copyright 2015 EMC Corporation. All rights reserved.
• STORAGE
• SOFTWARE-DEFINED STORAGE
• CONVERGED INFRASTRUCTURE
• SECURITY
1 © Copyright 2015 EMC Corporation. All rights reserved.
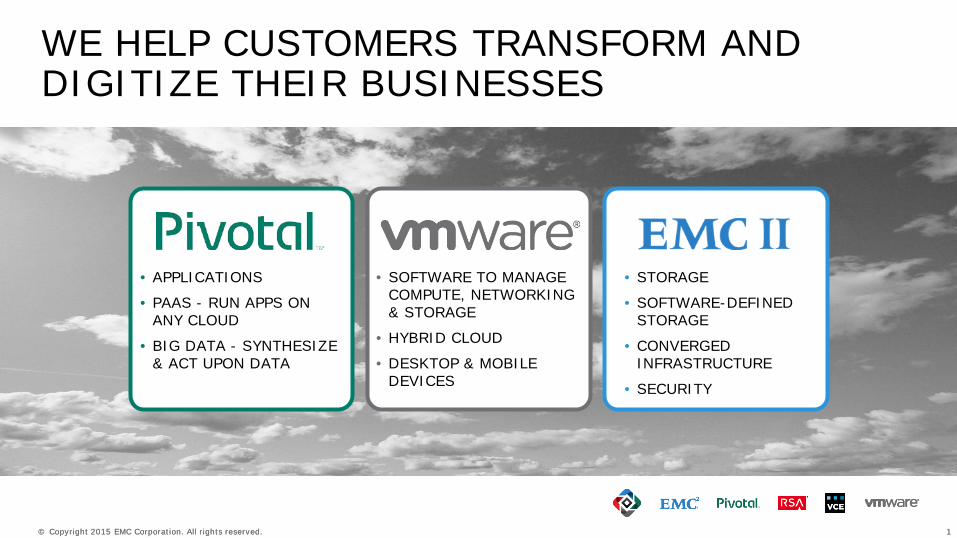
WE HELP CUSTOMERS TRANSFORM AND DIGITIZE THEIR BUSINESSES
• SOFTWARE TO MANAGE COMPUTE, NETWORKING & STORAGE
• HYBRID CLOUD
• DESKTOP & MOBILE DEVICES
• APPLICATIONS
• PAAS - RUN APPS ON ANY CLOUD
• BIG DATA - SYNTHESIZE & ACT UPON DATA
1 © Copyright 2015 EMC Corporation. All rights reserved.
• STORAGE
• SOFTWARE-DEFINED STORAGE
• CONVERGED INFRASTRUCTURE
• SECURITY
2 © Copyright 2015 EMC Corporation. All rights reserved.
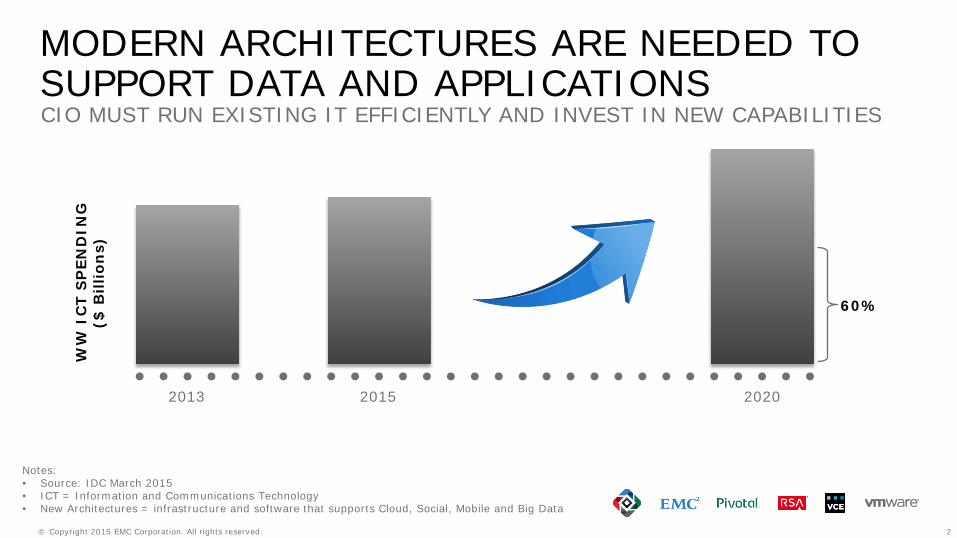
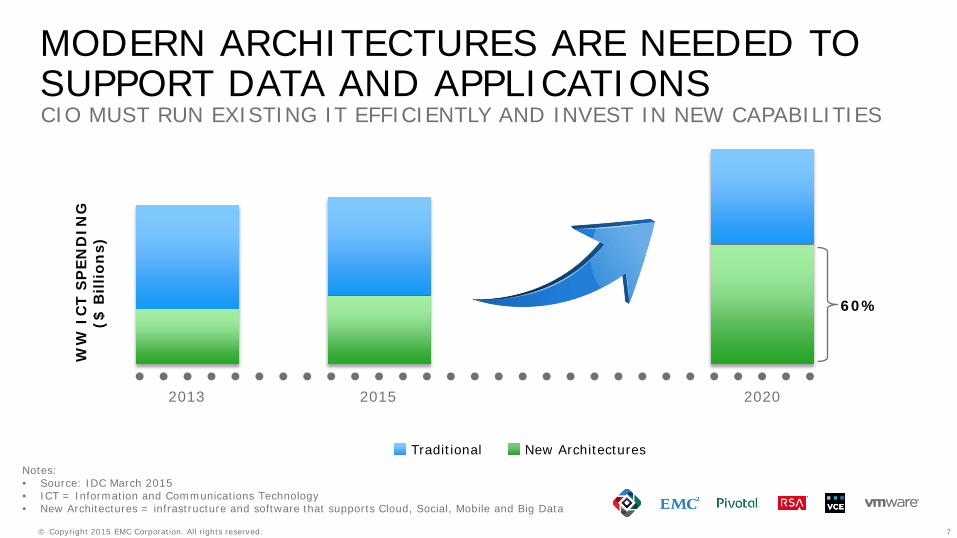
MODERN ARCHITECTURES ARE NEEDED TO SUPPORT DATA AND APPLICATIONS CIO MUST RUN EXISTING IT EFFICIENTLY AND INVEST IN NEW CAPABILITIES
Notes: • Source: IDC March 2015 • ICT = Information and Communications Technology • New Architectures = infrastructure and software that supports Cloud, Social, Mobile and Big Data
2013 2015 2020
WW
IC
T S
PEN
DIN
G
($ B
illio
ns)
60%
7 © Copyright 2015 EMC Corporation. All rights reserved.
MODERN ARCHITECTURES ARE NEEDED TO SUPPORT DATA AND APPLICATIONS CIO MUST RUN EXISTING IT EFFICIENTLY AND INVEST IN NEW CAPABILITIES
Notes: • Source: IDC March 2015 • ICT = Information and Communications Technology • New Architectures = infrastructure and software that supports Cloud, Social, Mobile and Big Data
2013 2015 2020
WW
IC
T S
PEN
DIN
G
($ B
illio
ns)
Traditional New Architectures
60%
3 © Copyright 2015 EMC Corporation. All rights reserved.
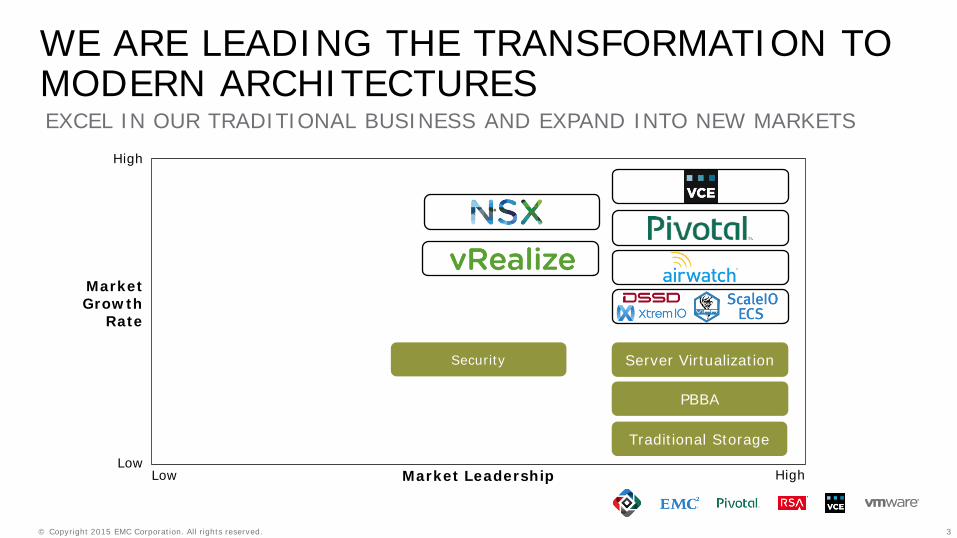
WE ARE LEADING THE TRANSFORMATION TO MODERN ARCHITECTURES EXCEL IN OUR TRADITIONAL BUSINESS AND EXPAND INTO NEW MARKETS
Market Leadership High
High
Low Low
Market Growth
Rate
PBBA
Security
Traditional Storage
Server Virtualization
8 © Copyright 2015 EMC Corporation. All rights reserved.
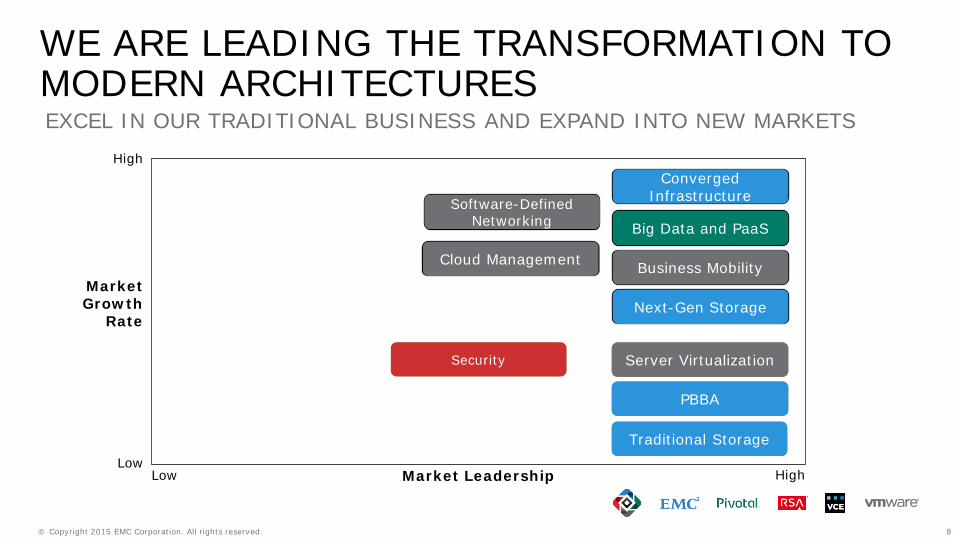
WE ARE LEADING THE TRANSFORMATION TO MODERN ARCHITECTURES EXCEL IN OUR TRADITIONAL BUSINESS AND EXPAND INTO NEW MARKETS
Market Leadership High
High
Low Low
Market Growth
Rate
PBBA
Security
Traditional Storage
Server Virtualization
Software-Defined Networking
Business Mobility
Converged Infrastructure
Next-Gen Storage
Big Data and PaaS
Cloud Management
Software-Defined Networking
Business Mobility
Converged Infrastructure
Next-Gen Storage
Big Data and PaaS
PBBA
Security
Traditional Storage
Server Virtualization
Cloud Management
9 © Copyright 2015 EMC Corporation. All rights reserved.
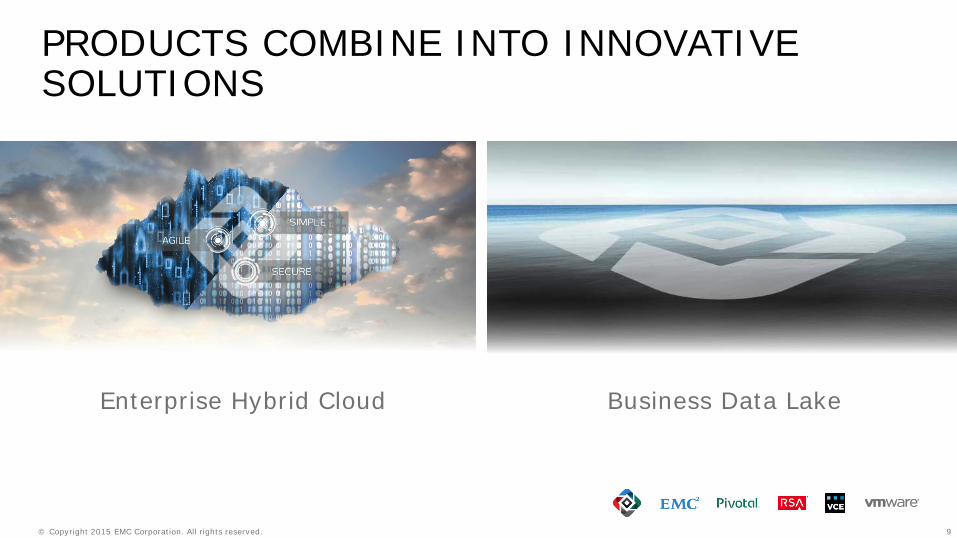
PRODUCTS COMBINE INTO INNOVATIVE SOLUTIONS
Enterprise Hybrid Cloud Business Data Lake
10 © Copyright 2015 EMC Corporation. All rights reserved.
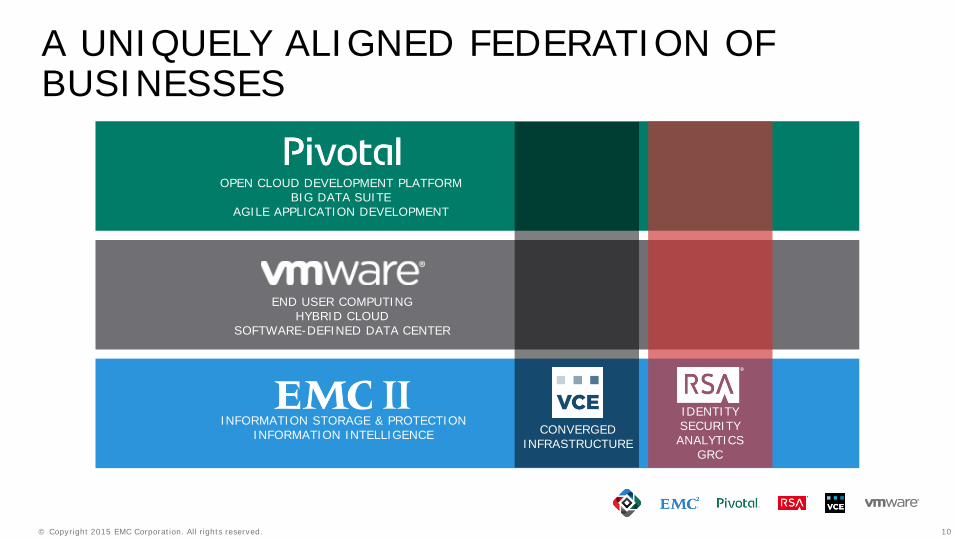
A UNIQUELY ALIGNED FEDERATION OF BUSINESSES
INFORMATION STORAGE & PROTECTION
INFORMATION INTELLIGENCE
END USER COMPUTING HYBRID CLOUD
SOFTWARE-DEFINED DATA CENTER
OPEN CLOUD DEVELOPMENT PLATFORM
BIG DATA SUITE AGILE APPLICATION DEVELOPMENT
IDENTITY SECURITY ANALYTICS
GRC
CONVERGED INFRASTRUCTURE
11 © Copyright 2015 EMC Corporation. All rights reserved.
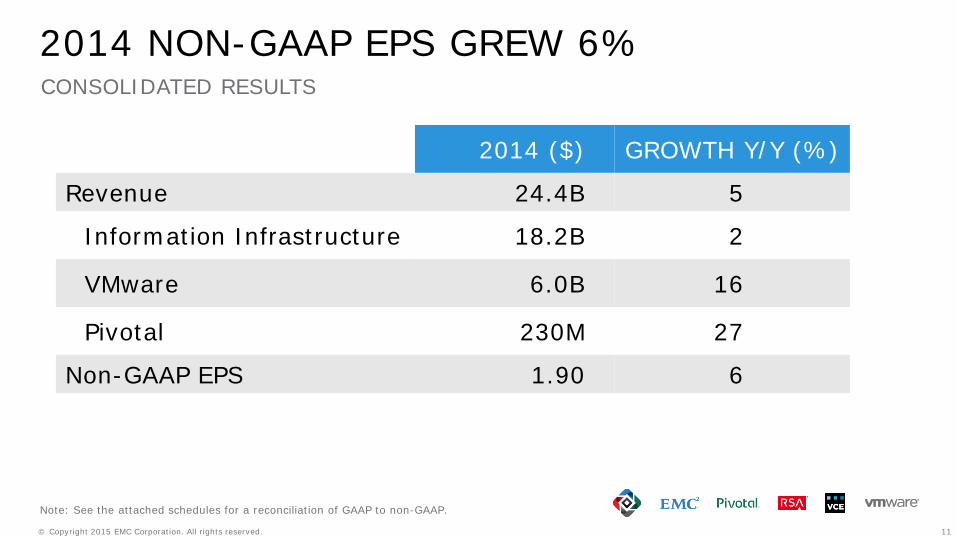
2014 NON-GAAP EPS GREW 6% CONSOLIDATED RESULTS
Note: See the attached schedules for a reconciliation of GAAP to non-GAAP.
2014 ($) GROWTH Y/Y (%)
Revenue 24.4B 5
Information Infrastructure 18.2B 2
VMware 6.0B 16
Pivotal 230M 27
Non-GAAP EPS 1.90 6
12 © Copyright 2015 EMC Corporation. All rights reserved.
-4%
-2%
0%
2%
4%
6%
8%
10%
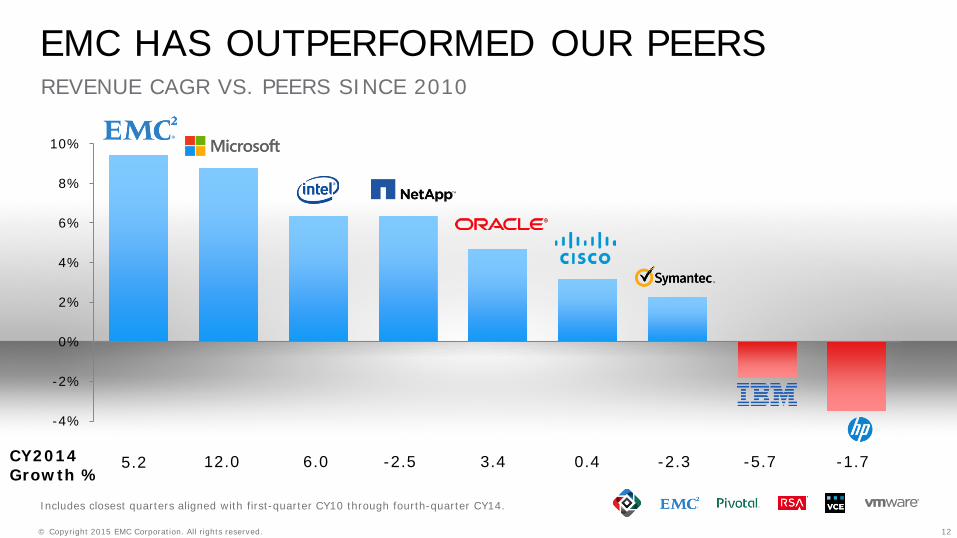
EMC HAS OUTPERFORMED OUR PEERS REVENUE CAGR VS. PEERS SINCE 2010
Includes closest quarters aligned with first-quarter CY10 through fourth-quarter CY14.
5.2 CY2014 Growth %
12.0 6.0 -2.5 3.4 0.4 -2.3 -5.7 -1.7
13 © Copyright 2015 EMC Corporation. All rights reserved.
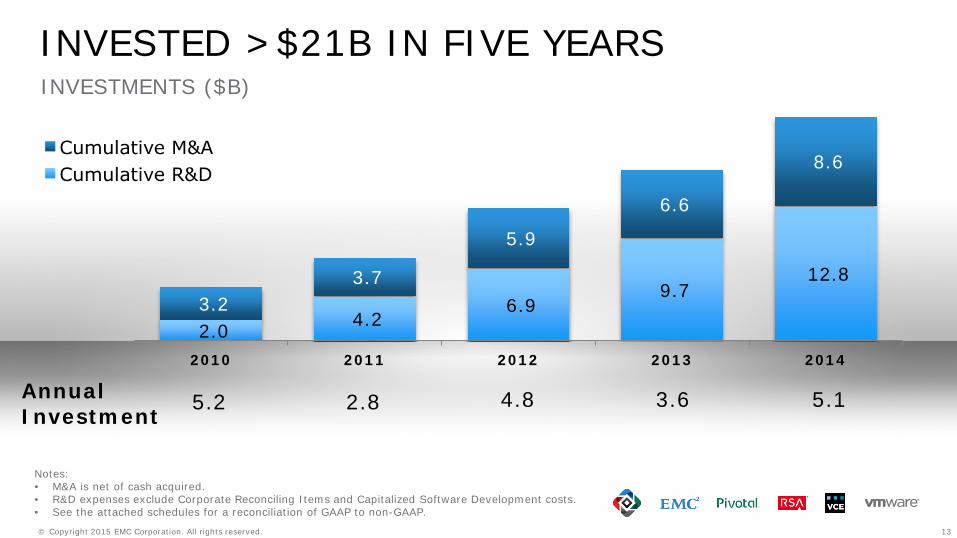
INVESTED >$21B IN FIVE YEARS INVESTMENTS ($B)
2.0 4.2 6.9
9.7 12.8
3.2 3.7
5.9
6.6
8.6
2010 2011 2012 2013 2014
5.2 2.8 4.8 3.6 5.1 Annual Investment
Notes: • M&A is net of cash acquired. • R&D expenses exclude Corporate Reconciling Items and Capitalized Software Development costs. • See the attached schedules for a reconciliation of GAAP to non-GAAP.
14 © Copyright 2015 EMC Corporation. All rights reserved.
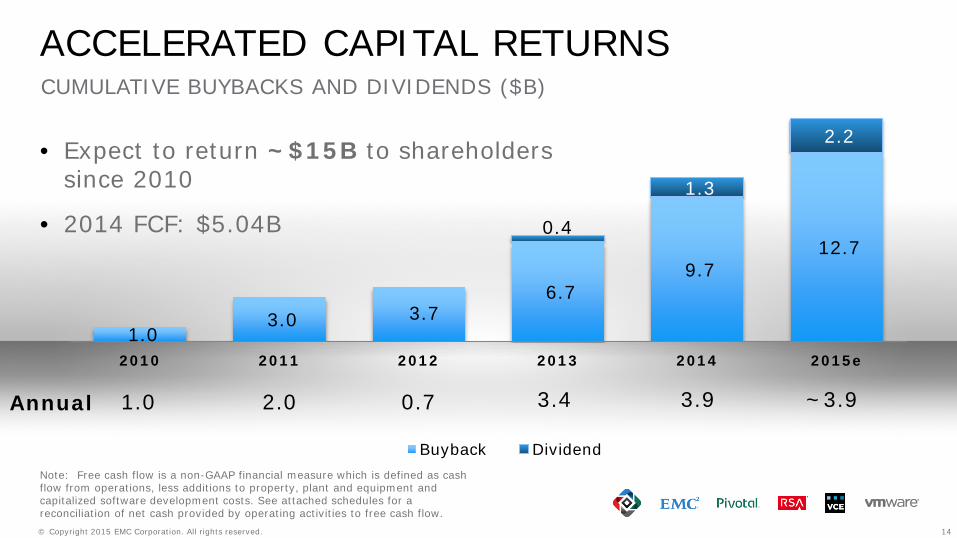
ACCELERATED CAPITAL RETURNS CUMULATIVE BUYBACKS AND DIVIDENDS ($B)
1.0 3.0 3.7
6.7 9.7
12.7 0.4
1.3
2.2
2010 2011 2012 2013 2014 2015e
Buyback Dividend
~3.9 1.0 2.0 0.7 3.4 3.9 Annual
Note: Free cash flow is a non-GAAP financial measure which is defined as cash flow from operations, less additions to property, plant and equipment and capitalized software development costs. See attached schedules for a reconciliation of net cash provided by operating activities to free cash flow.
• Expect to return ~$15B to shareholders since 2010
• 2014 FCF: $5.04B
15 © Copyright 2015 EMC Corporation. All rights reserved.
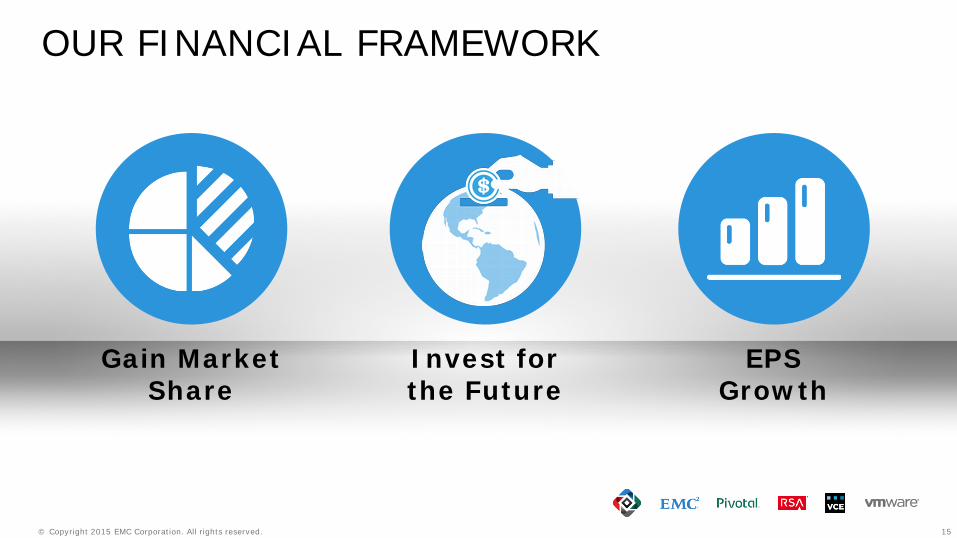
OUR FINANCIAL FRAMEWORK
Gain Market Share
Invest for the Future
EPS Growth
Use of Non‐GAAP Financial Measures
This presentation, the accompanying schedules and the additional content that is available on EMC's website contain non‐GAAP financial
measures. These non‐GAAP financial measures, which are used as measures of EMC's performance or liquidity, should be considered in addition
not as a substitute for, measures of EMC's financial performance or liquidity prepared in accordance with GAAP. EMC's non‐GAAP financial
measures may be defined differently from time to time and may be defined differently than similar terms used by other companies, and
accordingly, care should be exercised in understanding how EMC defines its non‐GAAP financial measures in this presentation.
Where specified in the accompanying schedules for various periods entitled "Reconciliation of GAAP to Non‐GAAP," certain items noted on each
such specific schedule (including, where noted, amounts relating to stock‐based compensation expense, intangible asset amortization,
restructuring charges, acquisition and other related charges, a gain on previously held interests in strategic investments and joint venture, an
impairment of strategic investment, capitalized software development costs and VMware litigation and other contingencies) are excluded from t
non‐GAAP financial measures.
EMC’s management uses the non‐GAAP financial measures in the accompanying schedules to gain an understanding of EMC's comparative
operating performance (when comparing such results with previous periods or forecasts) and future prospects and includes the benefit of the R&
tax credit in, and excludes the above‐listed items from, its internal financial statements for purposes of its internal budgets and each reporting
segment’s financial goals. These non‐GAAP financial measures are used by EMC's management in their financial and operating decision‐making
because management believes they reflect EMC's ongoing business in a manner that allows meaningful period‐to‐period comparisons. EMC's
management believes that these non‐GAAP financial measures provide useful information to investors and others (a) in understanding and
evaluating EMC's current operating performance and future prospects in the same manner as management does, if they so choose, and (b) in
comparing in a consistent manner the Company's current financial results with the Company's past financial results.
This presentation also includes disclosures regarding free cash flow which is a non‐GAAP financial measure. Free cash flow is defined as net cash
provided by operating activities less additions to property, plant and equipment and capitalized software development costs. EMC uses free cash
flow, among other measures, to evaluate the ability of its operations to generate cash that is available for purposes other than capital expenditu
and capitalized software development costs. Management believes that information regarding free cash flow provides investors with an importa
perspective on the cash available to make strategic acquisitions and investments, repurchase shares, pay dividends, service debt and fund ongoi
operations. As free cash flow is not a measure of liquidity calculated in accordance with GAAP, free cash flow should be considered in addition to
but not as a substitute for, the analysis provided in the statement of cash flows.
All of the foregoing non‐GAAP financial measures have limitations. Specifically, the non‐GAAP financial measures that exclude the items noted
above do not include all items of income and expense that affect EMC's operations. Further, these non‐GAAP financial measures are not prepare
in accordance with GAAP, may not be comparable to non‐GAAP financial measures used by other companies and do not reflect any benefit that
such items may confer on EMC. Management compensates for these limitations by also considering EMC's financial results as determined in
accordance with GAAP.
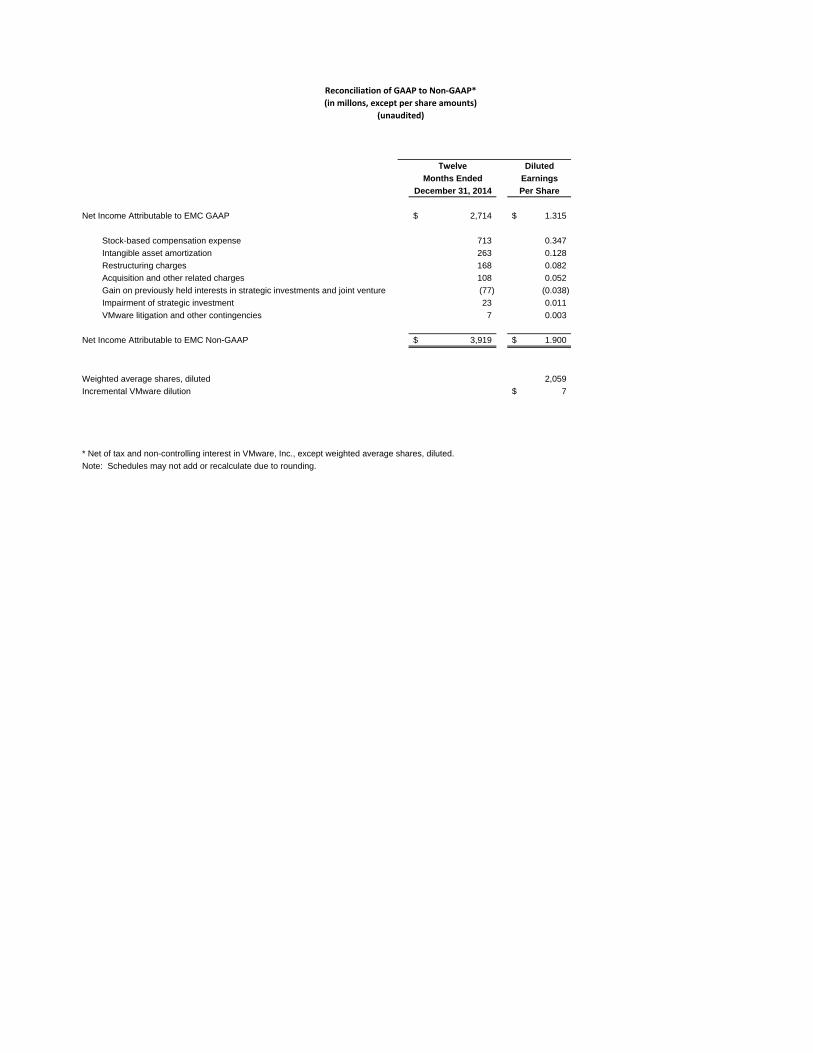
Twelve Diluted
Months Ended Earnings
December 31, 2014 Per Share
Net Income Attributable to EMC GAAP 2,714$ 1.315$
Stock-based compensation expense 713 0.347 Intangible asset amortization 263 0.128 Restructuring charges 168 0.082 Acquisition and other related charges 108 0.052 Gain on previously held interests in strategic investments and joint venture (77) (0.038) Impairment of strategic investment 23 0.011 VMware litigation and other contingencies 7 0.003
Net Income Attributable to EMC Non-GAAP 3,919$ 1.900$
Weighted average shares, diluted 2,059 Incremental VMware dilution 7$
* Net of tax and non-controlling interest in VMware, Inc., except weighted average shares, diluted. Note: Schedules may not add or recalculate due to rounding.
Reconciliation of GAAP to Non‐GAAP*
(in millons, except per share amounts)
(unaudited)
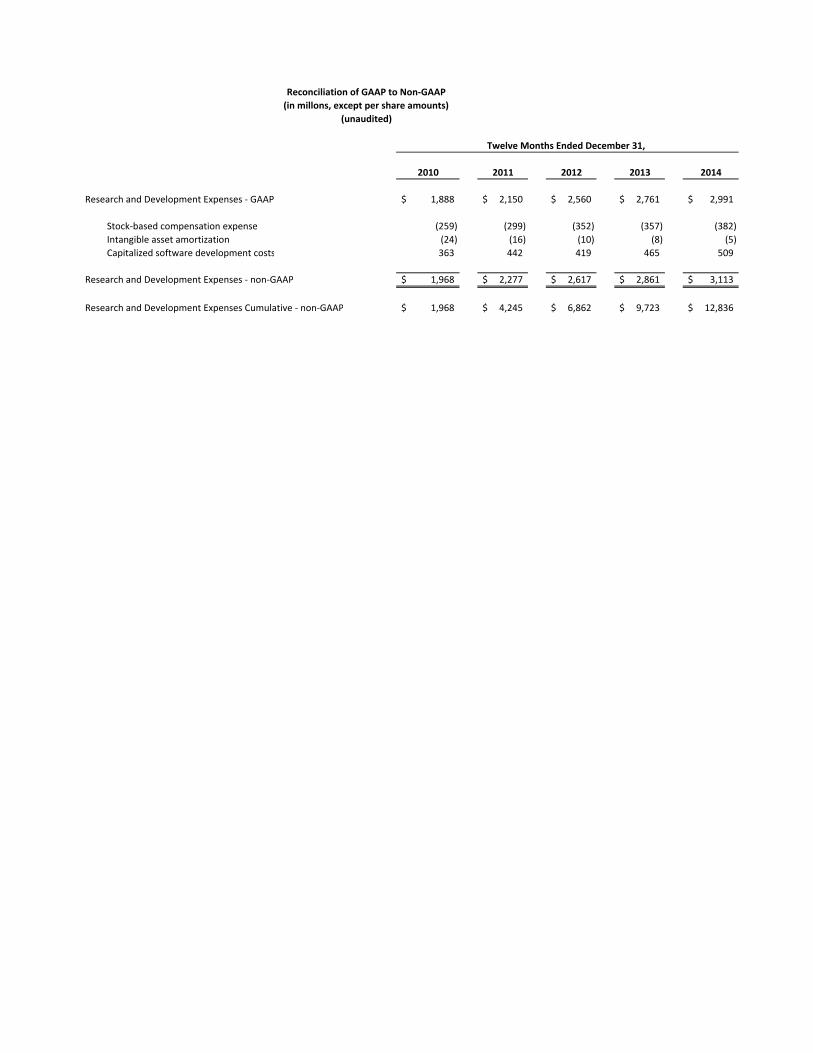
2010 2011 2012 2013 2014
Research and Development Expenses ‐ GAAP 1,888$ 2,150$ 2,560$ 2,761$ 2,991$
Stock‐based compensation expense (259) (299) (352) (357) (382)
Intangible asset amortization (24) (16) (10) (8) (5)
Capitalized software development costs 363 442 419 465 509
Research and Development Expenses ‐ non‐GAAP 1,968$ 2,277$ 2,617$ 2,861$ 3,113$
Research and Development Expenses Cumulative ‐ non‐GAAP 1,968$ 4,245$ 6,862$ 9,723$ 12,836$
Reconciliation of GAAP to Non‐GAAP
(in millons, except per share amounts)
(unaudited)
Twelve Months Ended December 31,
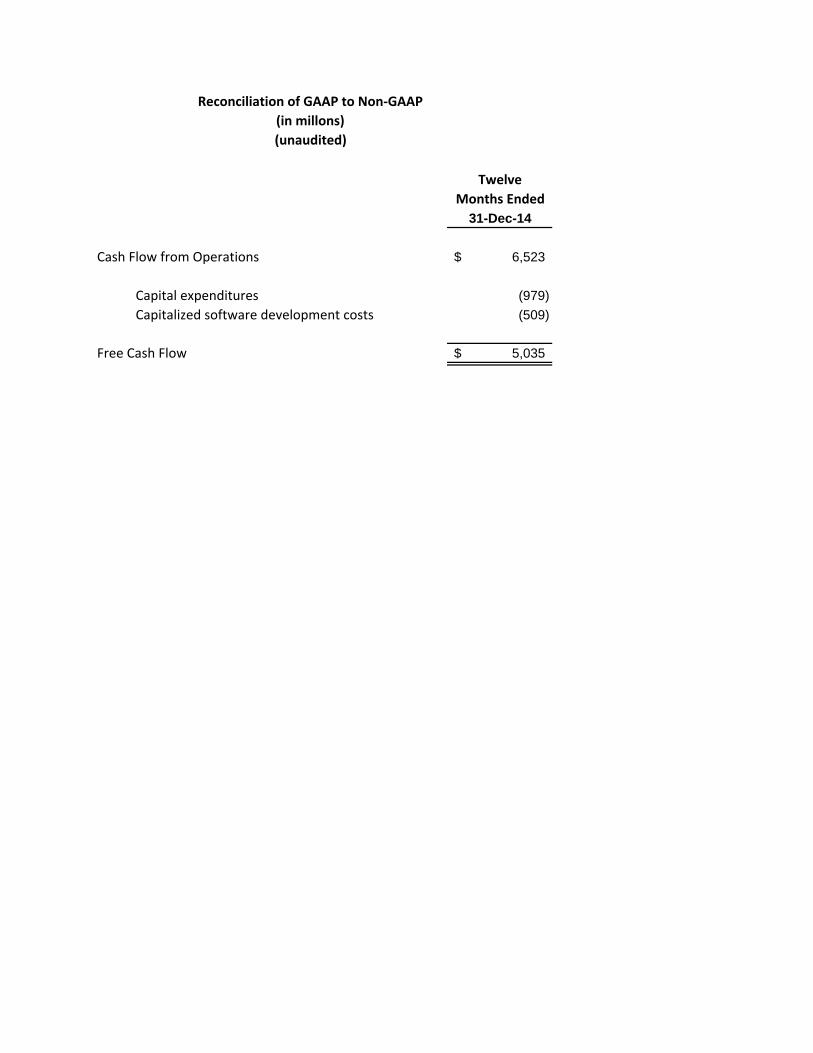
Twelve
Months Ended
31-Dec-14
Cash Flow from Operations 6,523$
Capital expenditures (979) Capitalized software development costs (509)
Free Cash Flow 5,035$
Reconciliation of GAAP to Non‐GAAP
(in millons)
(unaudited)