Embed Size (px)
Citation preview
BACKGROUND AND GOALS
Human pluripotent stem cells (PSCs) have broad applicability for cell therapy and other regenerative medicine applications. However, they are traditionally maintained on undefined feeder cells, which present concerns related to reproducibility and potential pathogen contamination. A variety of commercially available feeder-free substrates for stem cell maintenance have been developed to address these issues.
Our GOAL was to perform a rapid screen of 8 different commercially available PSC culture substrates in order to utilize the acquired information towards the design and development of novel stem cell maintenance substrates.
To enable our goal, we developed an automated screening approach that is suitable for rapid evaluation of large numbers of substrates, using a BioStation CT (Nikon).
Patrick H. Blit, Shahryar Khattak, Andreea A. Norman, Emily Titus, Manuel Alvarez, Joanna D. Fromstein, Peter W. Zandstra and Nicholas E. Timmins
Centre for Commercialization of Regenerative Medicine (CCRM), Toronto, Canada.
COMPARISON OF CYQUANT® DNA ASSAY AND BIOSTATION CT (NIKON) IMAGING BASED ASSAY
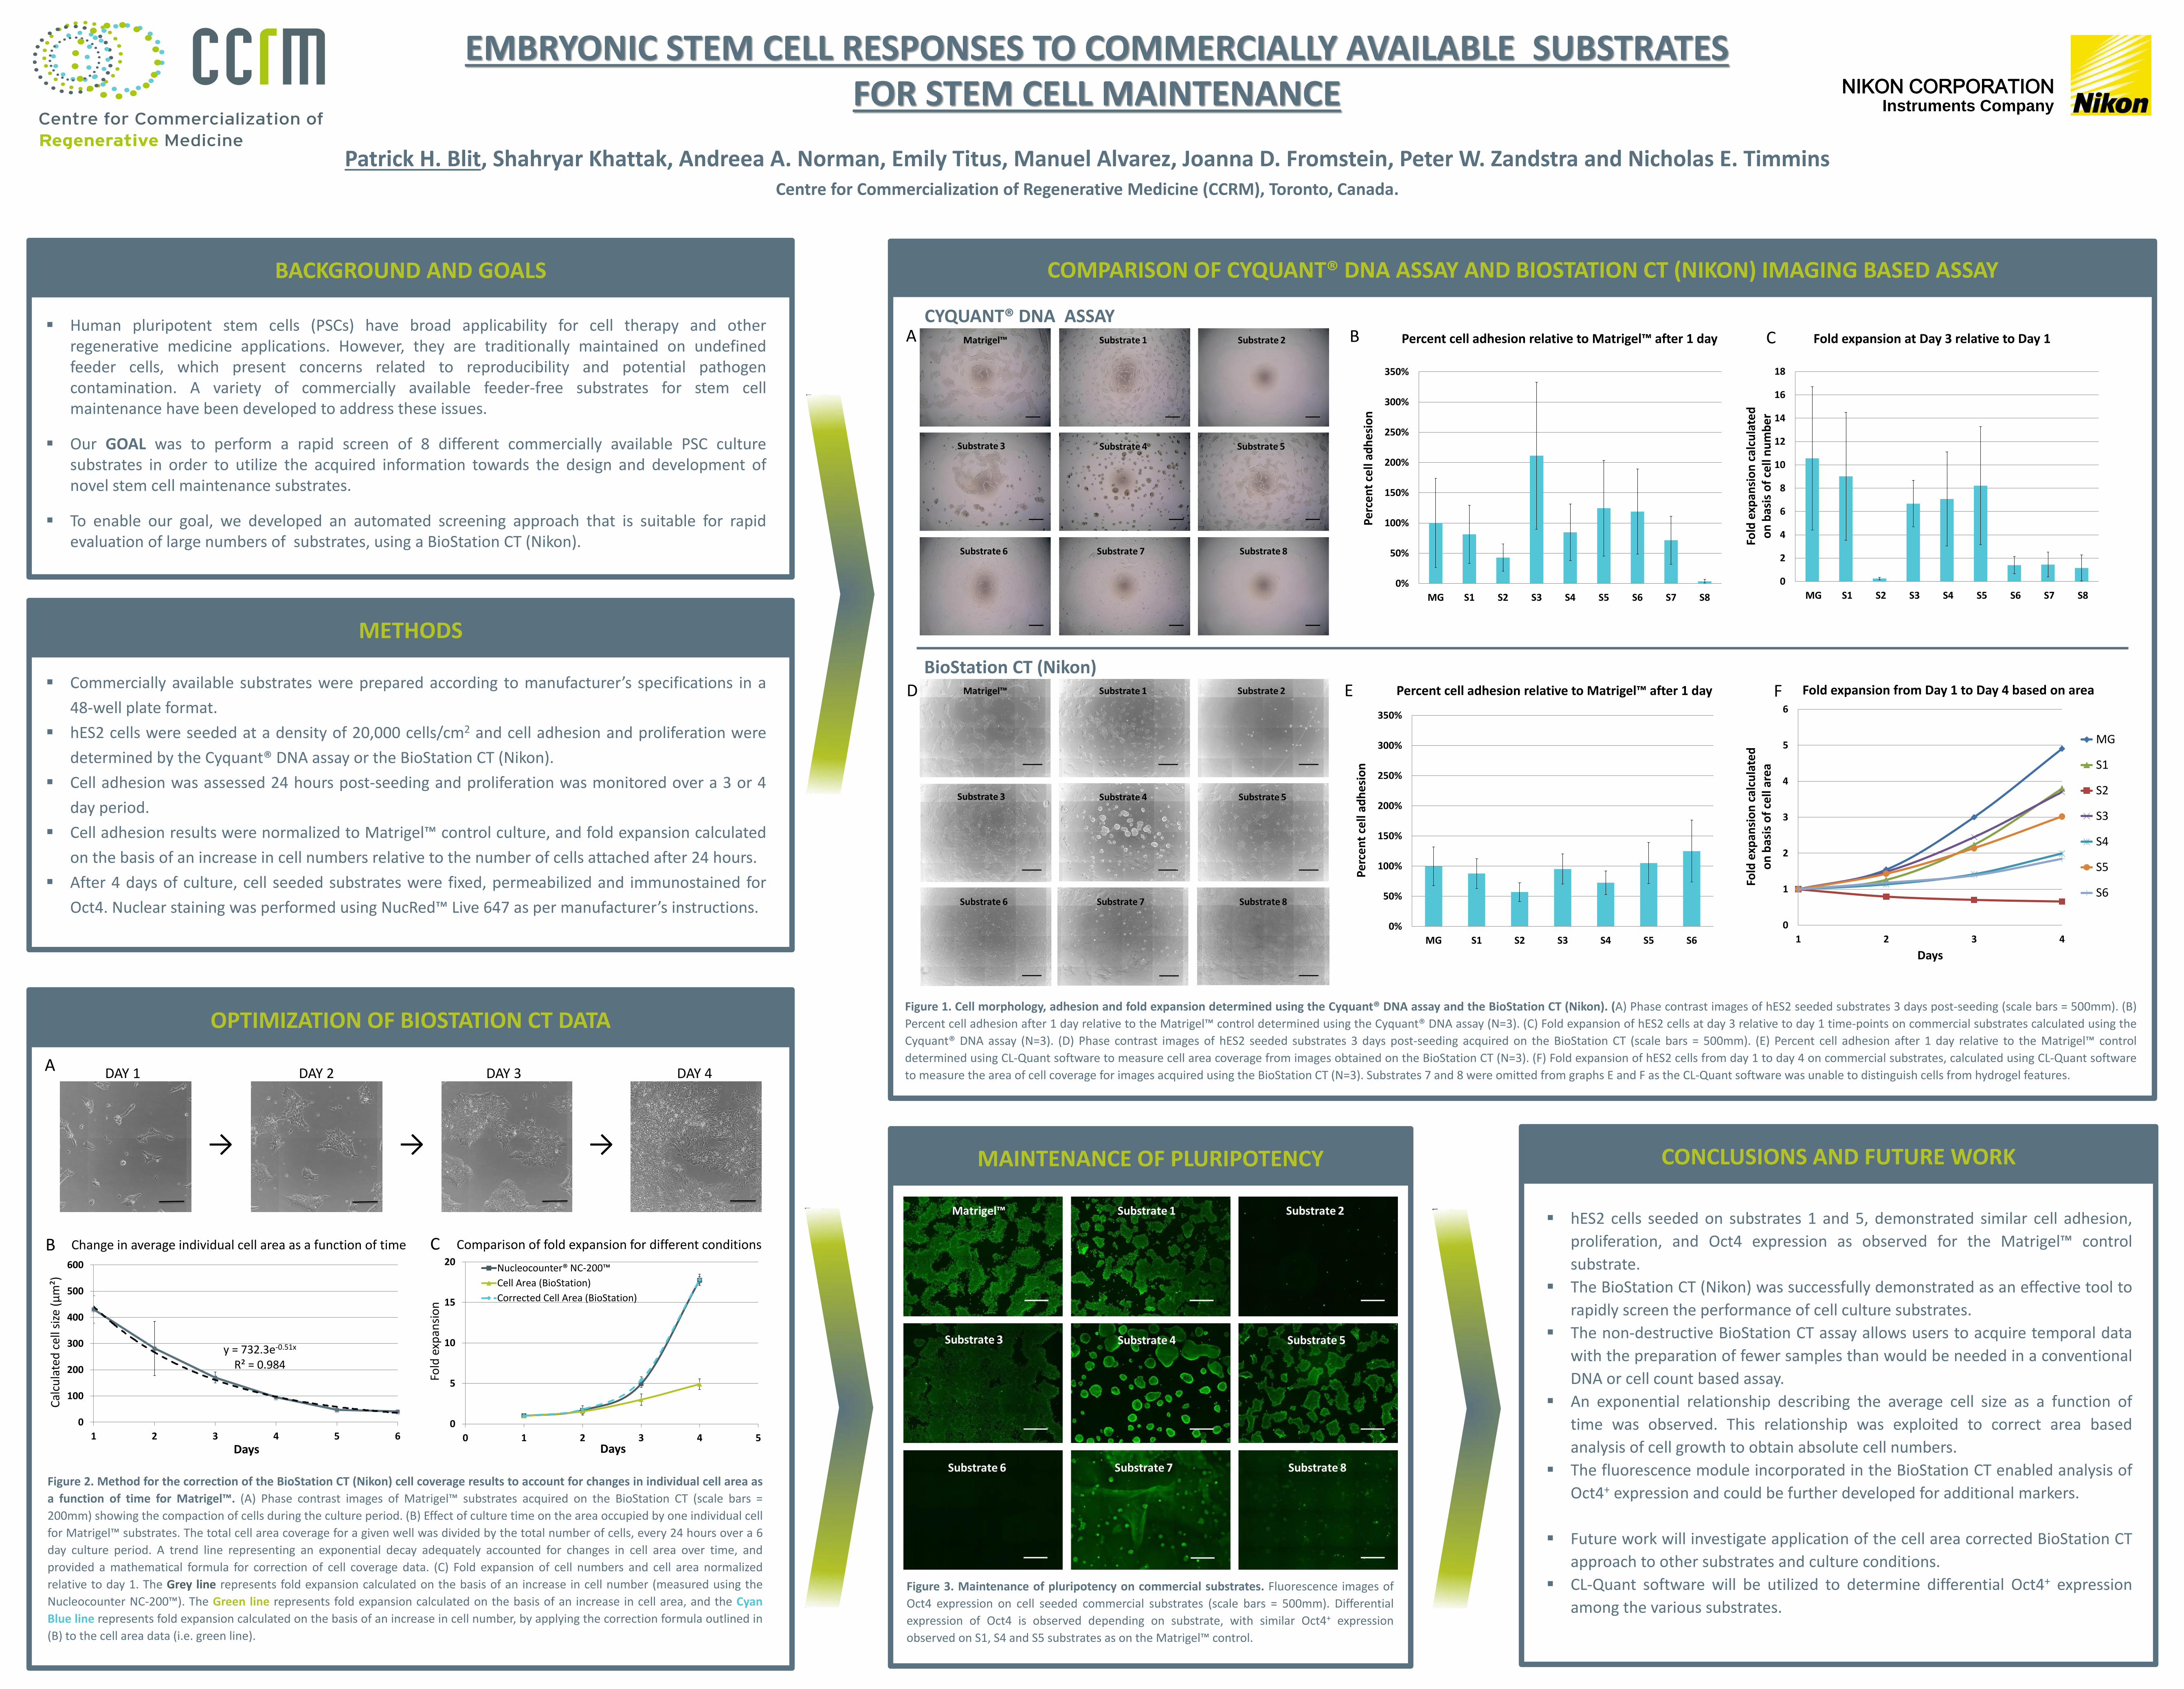
Figure 1. Cell morphology, adhesion and fold expansion determined using the Cyquant® DNA assay and the BioStation CT (Nikon). (A) Phase contrast images of hES2 seeded substrates 3 days post-seeding (scale bars = 500mm). (B)
Percent cell adhesion after 1 day relative to the Matrigel™ control determined using the Cyquant® DNA assay (N=3). (C) Fold expansion of hES2 cells at day 3 relative to day 1 time-points on commercial substrates calculated using the
Cyquant® DNA assay (N=3). (D) Phase contrast images of hES2 seeded substrates 3 days post-seeding acquired on the BioStation CT (scale bars = 500mm). (E) Percent cell adhesion after 1 day relative to the Matrigel™ control
determined using CL-Quant software to measure cell area coverage from images obtained on the BioStation CT (N=3). (F) Fold expansion of hES2 cells from day 1 to day 4 on commercial substrates, calculated using CL-Quant software
to measure the area of cell coverage for images acquired using the BioStation CT (N=3). Substrates 7 and 8 were omitted from graphs E and F as the CL-Quant software was unable to distinguish cells from hydrogel features.
EMBRYONIC STEM CELL RESPONSES TO COMMERCIALLY AVAILABLE SUBSTRATES FOR STEM CELL MAINTENANCE
BioStation CT (Nikon)
0%
50%
100%
150%
200%
250%
300%
350%
MG S1 S2 S3 S4 S5 S6 S7 S8
CYQUANT® DNA ASSAY
0%
50%
100%
150%
200%
250%
300%
350%
MG S1 S2 S3 S4 S5 S6
0
1
2
3
4
5
6
1 2 3 4
Days
MG
S1
S2
S3
S4
S5
S6
METHODS
Commercially available substrates were prepared according to manufacturer’s specifications in a
48-well plate format.
hES2 cells were seeded at a density of 20,000 cells/cm2 and cell adhesion and proliferation were
determined by the Cyquant® DNA assay or the BioStation CT (Nikon).
Cell adhesion was assessed 24 hours post-seeding and proliferation was monitored over a 3 or 4
day period.
Cell adhesion results were normalized to Matrigel™ control culture, and fold expansion calculated
on the basis of an increase in cell numbers relative to the number of cells attached after 24 hours.
After 4 days of culture, cell seeded substrates were fixed, permeabilized and immunostained for
Oct4. Nuclear staining was performed using NucRed™ Live 647 as per manufacturer’s instructions.
Figure 2. Method for the correction of the BioStation CT (Nikon) cell coverage results to account for changes in individual cell area as
a function of time for Matrigel™. (A) Phase contrast images of Matrigel™ substrates acquired on the BioStation CT (scale bars =
200mm) showing the compaction of cells during the culture period. (B) Effect of culture time on the area occupied by one individual cell
for Matrigel™ substrates. The total cell area coverage for a given well was divided by the total number of cells, every 24 hours over a 6
day culture period. A trend line representing an exponential decay adequately accounted for changes in cell area over time, and
provided a mathematical formula for correction of cell coverage data. (C) Fold expansion of cell numbers and cell area normalized
relative to day 1. The Grey line represents fold expansion calculated on the basis of an increase in cell number (measured using the
Nucleocounter NC-200™). The Green line represents fold expansion calculated on the basis of an increase in cell area, and the Cyan
Blue line represents fold expansion calculated on the basis of an increase in cell number, by applying the correction formula outlined in
(B) to the cell area data (i.e. green line).
OPTIMIZATION OF BIOSTATION CT DATA
Figure 3. Maintenance of pluripotency on commercial substrates. Fluorescence images of
Oct4 expression on cell seeded commercial substrates (scale bars = 500mm). Differential
expression of Oct4 is observed depending on substrate, with similar Oct4+ expression
observed on S1, S4 and S5 substrates as on the Matrigel™ control.
MAINTENANCE OF PLURIPOTENCY CONCLUSIONS AND FUTURE WORK
hES2 cells seeded on substrates 1 and 5, demonstrated similar cell adhesion,
proliferation, and Oct4 expression as observed for the Matrigel™ control
substrate.
The BioStation CT (Nikon) was successfully demonstrated as an effective tool to
rapidly screen the performance of cell culture substrates.
The non-destructive BioStation CT assay allows users to acquire temporal data
with the preparation of fewer samples than would be needed in a conventional
DNA or cell count based assay.
An exponential relationship describing the average cell size as a function of
time was observed. This relationship was exploited to correct area based
analysis of cell growth to obtain absolute cell numbers.
The fluorescence module incorporated in the BioStation CT enabled analysis of
Oct4+ expression and could be further developed for additional markers.
Future work will investigate application of the cell area corrected BioStation CT
approach to other substrates and culture conditions.
CL-Quant software will be utilized to determine differential Oct4+ expression
among the various substrates.
Percent cell adhesion relative to Matrigel™ after 1 day
Pe
rce
nt
cell
adh
esi
on
Fold expansion at Day 3 relative to Day 1
Fold
exp
ansi
on
cal
cula
ted
o
n b
asis
of
cell
nu
mb
er
Percent cell adhesion relative to Matrigel™ after 1 day
Pe
rce
nt
cell
adh
esi
on
Fold expansion from Day 1 to Day 4 based on area
Fold
exp
ansi
on
cal
cula
ted
o
n b
asis
of
cell
are
a
A
D
B C
E F
→ → →
DAY 1 DAY 2 DAY 3 DAY 4
y = 732.3e-0.51x R² = 0.984
0
100
200
300
400
500
600
1 2 3 4 5 6
Change in average individual cell area as a function of time
Cal
cula
ted
ce
ll si
ze (
µm
²)
0
5
10
15
20
0 1 2 3 4 5
Nucleocounter® NC-200™
Cell Area (BioStation)
Corrected Cell Area (BioStation)
Days
Comparison of fold expansion for different conditions B
A
C
Days
Instruments Company
Fo
ld e
xpan
sio
n
0
2
4
6
8
10
12
14
16
18
MG S1 S2 S3 S4 S5 S6 S7 S8
NIKON CORPORATION