Embed Size (px)
Citation preview
CORVINUS UNIVERSITY OF BUDAPEST
EMBRACING THE ROLE OF SOCIETAL
FACTORS IN THE LOW-CARBON
TRANSITION
Ph.D. THESIS
Doctoral Advisors:
Dr. Maria Csutora
and
Prof. Dr. Rolf Wüstenhagen
Andrea Tabi
Budapest, 2014


Andrea Tabi
EMBRACING THE ROLE OF SOCIETAL
FACTORS IN THE LOW-CARBON
TRANSITION

Department of Environmental Economics and
Technology
Doctoral Advisors:
Dr. Maria Csutora
and
Prof. Dr. Rolf Wüstenhagen
© Andrea Tabi
Corvinus University of Budapest
Doctoral School of Management and Business
Administration
Embracing the role of societal factors in the low-
carbon transition
Ph.D. Thesis
Andrea Tabi
Budapest, 2014

Acknowledgement
First and foremost, I would like to express my gratitude to my supervisor, Dr. Maria
Csutora for her professionel and personal support during my PhD pursuit. I owe special
thanks to my co-supervisor Prof. Dr. Rolf Wüstenhagen, the Head of the Institute of
Economy and Ecology at the University of St. Gallen for his guideance and helpful
remarks to my research. I would like to thank Prof. Dr. Sandor Kerekes for his comments
and discussions that made my PhD experience stimulating. I am especially grateful for my
past and present collegaues and PhD fellows and group members who I have had the
pleasure to work with at both the Corvinus and St. Gallen University. I would like to thank
my parents for all the support, encouragment, and love that they gave me along my path.
Thank you.
Andrea Tabi
Budapest, 15. October 2014

Dedicated
to my Mom

Table of Contents
List of Tables ............................................................................................................... 9
List of Figures ............................................................................................................ 10
I. Introductory chapter ............................................................................................... 11 1. Research objectives and significance .............................................................. 11 2. Theoretical background ..................................................................................... 14
2.1. The CO2 problem ......................................................................................... 14 2.2. Tackling the CO2 problem ........................................................................... 19 2.3. Climate policy instruments .......................................................................... 23
3. Conceptual framework ....................................................................................... 30 3.1. The framework ............................................................................................. 30 3.2. Social acceptance of renewable energy technologies .................................. 31 3.3. Promoting low-carbon pro-environmental behavior .................................... 34 3.4. Theoretical roots of servitization ................................................................. 35
4. Applied methodological background ................................................................ 39 4.1. Methods for measuring preferences ............................................................. 39 4.2. Methods for measuring CO2 impact............................................................. 41
II. Consumer acceptance of green electricity – Segmentation analysis based on choice experiment in Germany ................................................................................. 44
1. Introduction and Research Goal ....................................................................... 44 2. Related research and development of hypotheses ......................................... 46
2.1. Product differentiation of electricity products in liberalized markets .......... 46 2.2. Related research on potential adopters of green electricity ......................... 48 2.3. Related research on adopters of green electricity and hypotheses development ........................................................................................................... 49
3. Methods .............................................................................................................. 51 3.1. Chosen stated preference methodology: choice-based conjoint analysis .... 51 3.2. Selected product attributes for choice experiment ....................................... 53 3.3. Market segmentation with Choice Based Conjoint analysis ........................ 55 3.4. Design of study, dataset and method of data collection ............................... 56 3.5. Selection of variables for profiling segments .............................................. 57 3.6. Model selection for latent class analysis ...................................................... 59
4. Results ................................................................................................................ 60 4.1. Preferences for different product attributes ................................................. 61 4.2. Market segments analyzed by socio-demographic, psychographic and behavioral characteristics ....................................................................................... 66
5. Conclusions ........................................................................................................ 70 6. Limitations .......................................................................................................... 72 Acknowledgements ................................................................................................... 73 Appendix..................................................................................................................... 74
III. Measuring the carbon impacts of residential energy use linked to pro-environmental behavior ............................................................................................ 76
1. Introduction ........................................................................................................ 76 2. Measuring the effect of pro-environmental behaviour .................................... 77

3. Research goal and hypothesis .......................................................................... 80 4. Methodological approach .................................................................................. 81
4.1. Pro-environmental behaviour, socio-demographic and structural variables measured in the survey ........................................................................................... 81 4.2. Survey method ............................................................................................. 83 4.3. Statistical analysis ........................................................................................ 84
5. Results ................................................................................................................ 86 6.1. CO2 emissions from residential energy use ................................................. 86 6.2. Results of Latent Cluster Analysis ............................................................... 90
7. Discussion and conclusions .............................................................................. 98 8. Acknowledgements ......................................................................................... 100 Appendix.................................................................................................................. 101
IV. CO2 impacts of servitization – a structural decomposition analysis of the Hungarian economy .................................................................................................. 98
1. Introduction ........................................................................................................ 98 2. Latent factors behind the trends and hypotheses ........................................... 99
2.1. Embedded emission of services ................................................................... 99 2.2. Structural changes in economies over the last century ............................. 100 2.3. Hypotheses development .......................................................................... 104
3. Methodology .................................................................................................... 107 3.1. Calculating the CO2 emission using Environmentally Extended Input-Output analysis ................................................................................................................ 107 3.2. Structural Decomposition of the Input–Output Model ............................. 109 3.3. Structural changes over time ..................................................................... 114
4. Results ............................................................................................................. 115 4.1. The embedded emission of service sector in Hungary.............................. 115 4.2. Structural decomposition of the Hungarian service subsystem ................ 120
5. Summary .......................................................................................................... 130 6. Conclusion ....................................................................................................... 135 Appendix.................................................................................................................. 137
V. Overall conclusions and implications .............................................................. 139
Related publications ............................................................................................... 145
References .............................................................................................................. 147
9
List of Tables
Table 1: Sectorial reduction targets set by EU Roadmap 2050 .......................... 20 Table 2: National Renewable Energy Source (RES) targets by 2020 ................. 21 Table 3: Environmental policy instruments (Kerekes and Szlavik, 2001).......... 23 Table 4: Hypotheses ............................................................................................ 50 Table 5: Selection of variables ............................................................................ 58 Table 6: Summary of best replications................................................................ 60
Table 7: Hierarchical Bayes model estimation of mean utility values for five segments ...................................................................................................... 63
Table 8: Attribute importances............................................................................ 65 Table 9: Descriptive statistics by segment .......................................................... 69
Table 10: Choice experiment design: attributes and levels (Kaenzig et al., 2013) ..................................................................................................................... 74
Table 11: Results of Mann-Whitney U pairwise tests for selected variables ..... 75 Table 12: Selected socio-demographic and structural variables ......................... 83
Table 13: Direct and indirect CO2 emissions from residential use of different fuels (kgCO2/capita) .................................................................................... 89
Table 14: Latent class model selection ............................................................... 91 Table 15: The size of latent clusters and the profile output ................................ 92 Table 16: Results of Mann-Whitney U pairwise test by cluster ......................... 96 Table 17: Socio-demographic and structural variables by cluster .................... 101
Table 18: Energy conversion rate in selected countries in 2000 and 2008 (tCO2/TJ) ................................................................................................... 104
Table 19: Direct and total carbon intensities and emissions of service sectors in 2008 ........................................................................................................... 118
Table 20: Structural decomposition of Hungarian service sector in 2008 ........ 123
Table 21: Summary of emission changes directly linked to sectors between 2000 and 2008 (MtCO2) ..................................................................................... 125
Table 22: Summary of total (embedded and direct) emission changes in final demand between 2000 and 2008 (MtCO2) ................................................ 125
Table 23: Total CO2 emission changes in the service subsystem by components between 2000 and 2008 ............................................................................. 128
Table 24: Demand and technological elements by main components .............. 129
Table 25: Carbon intensities and direct and embedded emission of non-service sectors in 2008 .......................................................................................... 137

10
List of Figures
Figure 1: Atmospheric CO2 concentration (ppm) (Data source from Mauna Loa and Cape Grim Observatory stations’ webpage) ........................................ 16
Figure 2: Carbon prices EU ETS from 2009 Nov- 2014 July (Source: www.investing.com) ................................................................................... 26
Figure 3: The conceptual framework of the thesis (Source: Own compilation) . 30 Figure 4: CO2 emission by heating type ............................................................. 86 Figure 5: Calculated CO2 emission from electricity generation by source ......... 88 Figure 6: Calculated CO2 emission of passenger transport types ....................... 89 Figure 7: kgCO2/capita emissions from energy consumption by cluster ............ 93
Figure 8: Energy/GDP rate 1995-2010 in selected countries (Data source: IAE, 2012 and Eurostat, 2014) .......................................................................... 101
Figure 9: GDP growth in EU-28 between 1995-2012 (Data source: Eurostat, 2014) ......................................................................................................... 101
Figure 10: Material flow accounts for EU-27 countries 2000-2011 (Data source: EUROSTAT, 2014) .................................................................................. 102
Figure 11: Energy source consumption of power plants in Hungary (Source: MVM, 2012) ............................................................................................. 106
Figure 12: Total carbon emission in Hungary by sector in 2008 ...................... 116
Figure 13: Total carbon emission of service subsystem by structural component in Hungary 2008 ........................................................................................ 120
Figure 14: Summary of CO2 impact of the Hungarian service and non-service sector (2008).............................................................................................. 131
Figure 15: Distribution of structural components in main service groups, 2008 ................................................................................................................... 132
Figure 16: Changes in CO2 emission from service sector by components over time (ktCO2) .............................................................................................. 133
Figure 17: Changes in CO2 emission of Supply from non-service sector (pull effect) ........................................................................................................ 134
11
I. Introductory chapter
1. Research objectives and significance
Due to the energy- and resource-intensive lifestyle pursued in developed
countries during the last century, humankind has to face serious environmental
issues in the future. To avoid the threatening consequences of climate change
triggered by the rising CO2 emission worldwide, policy makers come up with
ambitious CO2 emission abatements targeting reductions in production and
consumption. Besides the promise of technological solutions we need to turn the
searchlight on societal factors that play a prominent role in engaging in
environmental actions.
The central topic of this thesis is the transition to a low-carbon economy and
society. Various definitions of a low-carbon economy exist from international
organisations and practitioners. Lately, it stands in the centre of sustainability
research as a more focused interpretation of the sustainable development
concept, introduced by the Brundtland Commission (WCED, 1987)1. According
to the definition of the UK’s National Strategy for Climate and Energy, low-
carbon economy ‘ensures that energy supplies remain secure, new economic
opportunities are maximised, costs are minimised and the most vulnerable are
protected’ (HM Government, 2009, p. 6.). Low-carbon societies aim at reducing
their greenhouse gas (GHG) emissions without significantly affecting their
economic growth, i.e. minimal use of intensive energy while shifting towards
resource-efficiency including renewable energy concepts and also societal
changes in consumer behaviour such as transport, heating activities or electricity
use, etc. (Ali et al., 2013). Since energy conversion is the main source of GHG
emissions, we need to elaborate on more efficient energy strategies including the
reconsideration of the current energy systems with low-carbon and renewable
1 Sustainable development refers to “development that meets the needs of the present without compromising the ability of future generations to meet their own needs” (WCED, 1987).
12
energy technologies and adoption of new consumption patterns (e.g. Nakata et
al., 2011). Skea and Nishioka (2008) suggested the following framework which
could provide a basis for research and action: ‘A low carbon society should: (1)
take actions that are compatible with the principles of sustainable development,
ensuring that the development needs of all groups within society are met; (2)
make an equitable contribution towards the global effort to stabilize the
atmospheric concentration of CO2 and other greenhouse gases at a level that
will avoid dangerous climate change, through deep cuts in global emissions; (3)
demonstrate a high level of energy efficiency and use low-carbon energy sources
and production technologies; (4) adopt patterns of consumption and behaviour
that are consistent with low levels of greenhouse gas emissions’ (Skea and
Nishioka, 2008, p. S6). In order to achieve the transition towards low-carbon
economy the steps described below regarding low-carbon society need to be
accomplished. This constitutes the theoretical basis of the present thesis that
covers all aspects and features of low-carbon transition.
The scientific significance of this thesis is to present a comprehensive scrutiny
and a summary of the most important societal barriers that could risk the
implementation of curbing CO2 emission. It aims at providing conclusions and
implications to both scientific research and praxis. Building on the theoretical
background and previous research experiences, this research broadens the
scientific discussion on low-carbon transition. The thesis is built upon three
research studies that revolve around possible decarbonisation pathways. Findings
of each study make a contribution to designing more efficient environmental and
climate policies. In the next part of this chapter the main research goals are
presented, which reflect the previous findings and shortcomings emerging from
the related literature.
In the first study, consumer preferences for green electricity products are
analysed and linked to socio-demographic, psychographic and behavioural
characteristics. The aim of this study is to study consumer acceptance towards
renewable energies The emergence of green power, where residents get the
opportunity to switch to renewable energy without being involved in the physical
generation (Wüstenhagen et al., 2007), is an unexploited field in the literature.
The research takes into account various factors that help to explain to what extent

13
subscribers of green electricity tariff differ from potential adopters. The findings
of this study provide targeted messaging improving the adoption of green
electricity and valuable information for policy makers and practitioners.
In the second study, the focus is on low-carbon behavioral patterns. Even
though we can measure high environmental concerns and preferences, yet we can
observe inertia among consumers to adopt low-carbon lifestyle elements.
Therefore, it seems that in order to reach actual carbon reduction, we need to
change our consumption patterns drastically. To do so, we need to have a closer
look upon the impacts of our current consumption behavior (Csutora, 2012). The
goal of this research is to explore the effect of pro-environmental behaviour on
CO2 emissions with respect to residential energy consumption. Changing such
behaviour has considerable potential for conserving energy resources and is an
important target of climate policies.
The last study challenges the theory of service economy that has been highly
promoted because of its putative environmentally-friendliness. Servitization of
economy is assumed to bring along less energy- and resource-intensity. By
means of a structural decomposition analysis of the environmentally extended
input-output framework, the actual environmental load of services can be
revealed (Alcántara and Padilla, 2009). Evidence shows how the traditional
concept of services that is still rather vague and ill–defined, leads to serious
underestimation of carbon impact in developed economies. The goal of this
study is to draw attention to the real carbon impacts of services and to provide
environmental policy implications.

14
2. Theoretical background
2.1. The CO2 problem
The rising concentration of greenhouse gases2 in the atmosphere is the main
trigger of climate change causing environmental damages and endangering our
current lifestyle. Although all these gases may have numerous natural sources,
yet ‘it is extremely likely that human activities caused more than half of the
observed increase in global average surface temperature from 1951 to 2010’
“(Stocker et al., 2013, p. 60.). CO2 emissions from fuel combustion and cement
manufacture are responsible for more than 75% of the increase in atmospheric
CO2 concentration since pre-industrial times (Denman et al., 2007). In the first
part of this section, the current policy measures and their efficiency to mitigate
carbon emissions are discussed. In the second part, possible explanations to the
CO2 problem are presented.
The Council of the European Union adopted a target of a maximum 2°C rise
in global average temperature above pre-industrial level in 1996. Later on, in
2009 at the 15th session of the Conference of Parties (COP 15) a new target was
suggested that the increase in global temperature should stay below 2°C
(UNFCCC, 2009b). CO2 emission on global level has increased in the last
decades, recently showed a little decline due to the financial crisis in Western
countries, but CO2 emission continued to rise by 4.6% in 2010 (IEA, 2012). On
the other hand, according to the latest report by the European Commission
(2013) on the progress towards achieving Kyoto targets, in 2011 the GHG
emission (excluding emissions due to land use, land use change and forestry, and
from international aviation) was 18.3 % lower compared to 1990 levels reaching
the lowest level ever since. The EU-15 countries agreed on reducing their overall
emission to 8% below the level of the base year in 1997, when they ratified the
Protocol. The first period’s target (2008-2012) seems to be overachieved; in
2011 the EU-15 emissions accounted for 14.9% below the base year (EU 2 Six GHGs are covered by the UNFCCC and its Kyoto Protocol: Carbon dioxide (CO2), Methane (CH4), Nitrous oxide (N2O), HFCs (Hydrofluorocarbons), PFCs (Perfluorocarbons), and Sulphur hexafluoride (SF6) (UNFCCC, 2009a).

15
progress report, 2013). In Hungary, the CO2 emission from domestic production
has declined in the last years mainly due to the economic downturn. Hungary has
also signed the United Nations Framework Convention on Climate Change
(UNFCCC) and the Kyoto Protocol with the target of 6% below the annual
average of 1985-1987 for the first period (EEA, 2013).
Despite the remarkable CO2 reduction achievements in the Western countries,
the CO2 concentration does not seem to stop rising. Figure 1 depicts the
measured CO2 concentration levels in two observatory stations; the first one is
the oldest CO2 monitoring station in Mauna Loa, Hawaii and other one is in Cape
Grim (operating from 1976), Tasmania. CO2 is released into the atmosphere
mostly by burning fossil fuels and cement production, land use change and other
human activities. Human activities especially from the industrial revolution in
the 19th century, when the global average concetration is estimated around 280
ppm (with fluctuations between 180 and 280 ppm during ice ages and
interglacial periods) started to increase sharply with the more intense fossil fuel
combustion (NOAA, 2013). According to the NOAA’s report (National Oceanic
and Atmospheric Administration), the atmospheric CO2 concentration level
exceeded 400 ppm in May 2013 for the first time. The current target to reach is
350 ppm that is regarded as a threshold of the planet’s capacity for preserving
and maintaining life in the long run (Hansen et al., 2008). The measured CO2
ppm at observatory stations show that 350 ppm level was already surpassed
around 1988.

16
Figure 1: Atmospheric CO2 concentration (ppm) (Data source from Mauna Loa and Cape
Grim Observatory stations’ webpage)
Despite all the efforts, there is an unstoppable global CO2 rise putting the eco-
system and current economies at risk. So long as there is no global climate policy
and global emission targets defined that applies to all nations, the CO2 abatement
measures can be undermined through several ways, which can suggest
misleading policy achievements.
CO2 reduction in Europe can be attributed to the partial decoupling of the
GHG emissions from the GDP growth, which can be mainly ascribed to the
international outsourcing of different economic activities leading to virtual
success (Schaltegger and Csutora, 2012). There are three main outsourcing
waves during the 20th century identified in the literature. The first wave dates
back in the late 1970s when mainly manufacturing processes were outsourced for
cost-cutting reasons within countries’ borders. In the second wave the motivation
was not only the cost efficiency, but also the intention of firms to focus on core
competencies and the idea was to outsource everything else that did not belong to
the area of the expertise. This is called the era of strategic outsourcing (Hätönen
and Eriksson, 2009). This happened in the 1990s, when IT outsourcing started to
boom (Gonzales et al., 2001). This phenomenon led the world to the outsourcing
300
310
320
330
340
350
360
370
380
390
400
410
19
58
19
61
19
64
19
67
19
70
19
73
19
76
19
79
19
82
19
85
19
88
19
91
19
94
19
97
20
00
20
03
20
06
20
09
20
12
Co
nce
ntr
ati
on
of
atm
osp
he
ric C
O2 (
pp
m)
Mauna LoaObservatory
Cape GrimObservatory

17
of waste and pollution mainly to Asian countries. The third wave, from the 2000
onwards, outsourcing has become a norm rather than a competitive edge.
As a consequence of unilateral climate regulations, carbon costs triggered
another type of outsourcing during the last decade that causes two interrelated
issues: carbon leakages and competitiveness losses (Böhringer et al., 2012;
Branger and Quirion, 2014). Carbon leakage affects primarily the EITE (Energy-
intensive and trade-exposed) sectors such as ferrous metals (e.g. iron and steel),
non-metallic mineral products (e.g. cement), non-ferrous metals (e.g.
aluminium), pulp and paper, chemicals, rubber and plastics. Carbon leakage is
defined as the increase in emissions outside a region as a direct result of the
policy to cap emission in this region (IAE, 2008, p. 8.). Carbon leakage can be
generated through two main mechanisms: energy and non-energy markets. The
leakage related to energy markets occurs, when in a large country group have an
unilateral carbon abatement, which triggers a decreasing demand in fossil fuels
that pushes down the international prices. This can induce larger demand and
consumption in non-abating countries (Arroyo-Curras et al., 2013). The carbon
leakage via non-energy markets occurs because of the increased production costs
imposed by CO2 abatement policies affecting the international competitiveness of
energy-intensive industries. So, these industries delocate their production
processes to countries with weaker environmental regulations (Burniaux et al.,
2000). Nonetheless, other sectors at the end of the supply chain (downstream
sectors), which purchase intermediate goods with high carbon content, could be
more affected by embedded carbon costs accumulated along the supply chain
than upstream suppliers (Csutora and Dobos, 2012) preventing technological
innovations.
Another well-studied phenomenon in energy research that contributes to
rising emission is the rebound effect. It describes a mechanism, whereby
efficiency improvements in energy services that make effective costs lower,
trigger an increase in consumption of those services, which partly or fully offsets
the positive effects of technological achievements. This is the so-called direct
rebound effect, which is elaborated by many studies in several fields such as
electricity systems and residential electricity consumption, heating activities and
transport (Jin, 2007; Howells et al., 2010; Hens et al., 2010; Matiaske et al.,
18
2012). This issue was first noted by William Stanley Jevons in the 18th century in
his paper ‘The coal question’. He observed that the coal consumption in England
had risen more sharply, after the introduction of James Watt’s new coal-fired
steam engine with improved energy efficiency. Now, it is known as the rebound
effect derived from Jevons paradox (Kerekes, 2012). The literature identifies an
indirect rebound effect as well, which occurs when the decrease in price of a
good or service rebounds not to itself but to the demand of another good or
service (Harangozo, 2009; Freire-González, 2010). Greening et al. (2000)
indicated a great variation in the magnitude of the effect because of identification
and measurement issues. According to numerous studies reviewed the extent of
rebound effect e.g. in space heating or in automotive industry generated by
household consumption account for in both cases around 10-30% (Greening et
al., 2000).
19
2.2. Tackling the CO2 problem
According to the Brundtland report, sustainable development should ensure
‘… that it meets the needs of the present without compromising the ability of
future generations to meet their own needs’. Although there are limits of
resources and nature’s resilience and its ability to absorb the effects of human
activities, ‘technology and social organization can be both managed and
improved to make way for a new era of economic growth’ (WCED, 1987, p. 16.).
At the UNCED conference held in Rio de Janeiro in 1992, the leading economies
expressed the need for changing consumption and production patterns (Lorek
and Spangenberg, 2014). The main document issued during the conference, the
Agenda 21, stresses the difference in lifestyles of the industrialized and
developing countries, namely the global problem caused by the overconsumption
in developed countries is not compatible with sustainable development. This
statement also appears in the document issued by the European Union entitled
‘Sustainable Consumption and Production and Sustainable Industrial Policy
Action Plan’ (2008) referring that our current practices need to be changed
radically.
As agreed in the UNFCCC Conference of the Parties (COP 16) in Cancun,
Mexico, developed countries should and developing countries are encouraged to
improve low-carbon development strategies or plans (LCDPs) to significantly
reduce greenhouse gas emissions over a specific period of time (UNFCCC,
2010). Some nations and international and intergovernmental organizations have
already elaborated their own low-carbon actions plans during the last years that
provide a detailed blueprint of planned reduction steps.
The implementation plan of low-carbon economy in the European Union is
established in the document entitled ‘A Roadmap for moving to a competitive
low-carbon economy in 2050’ (2011). This contains possible actions needed to
be adopted to achieve targets of reducing GHG emission. CO2 reduction in
domestic emissions by 80% compared to the level in 1990 is set by the EU until
2050 in terms of real internal reduction without any compensation in the carbon

20
market. Table 1 shows the reduction targets presented in the document, which
need to be accomplished by 2050. Regarding the current GHG emission, the
agreed reduction targets by 2020 seems to be met, but the 20% target set in the
Energy Efficiency Plan (European Commission, 2011) might not be fulfilled
under current conditions. The major goal is to reduce carbon emission from
electricity generation that could also contribute to lower emissions in transport
and heating sectors by replacing current feedstock with electric power.
Table 1: Sectorial reduction targets set by EU Roadmap 2050
GHG reductions compared to 1990 2005 2030 2050
Total -7% -40 to -44% -79 to -82%
Sectors
Power (CO2) -7% -54 to -68% -93 to -99% Industry (CO2) -20% -34 to -40% -83 to -87% Transport (incl. CO2 aviation, excl. maritime) +30% +20 to -9% -54 to -67% Residential and services (CO2) -12% -37 to -53% -88 to-91% Agriculture (non-CO2) -20% -36 to -37% -42 to -49% Other non-CO2 emissions -30% -72 to -73% -70 to -78%
Source: A Roadmap for moving to a competitive low-carbon economy in 2050 (2011)
Some nations have already prepared low-carbon development plans tailored to
their own countries (e.g. Bangladesh, Brazil, China, Costa Rica, Guyana, India,
Indonesia, Japan, Mexico, South Africa, South Korea and the UK). The planned
level of reduction varies across countries since no target value has been agreed
upon for LCDPs (WWF, 2011).
Though, Hungary has no focused low-carbon development plan yet, national
strategies are developed that address climate change and energy security.
According to the National Climate Change Strategy (2008-2025) (hereafter
NCCS), Hungary is threathened by changes in temperature and percipitation
resulting in more extreme wheather phenomena such as prolonged drought
periods, floods and inland inundations. It places emphasis on GHG reduction ‘ ...
achieved by reducing the overall energy use in a manner that enables a shift in
production and consumption towards lower material and energy needs’ (NCCS,
2008, p. 3.). Hungary’s NCCS is based on the scientific findings of VAHAVA
Report (Farago et al., 2010) that summarizes the results of the project titled
“Global climate change, Hungarian impacts and responses” launched in 2003.
21
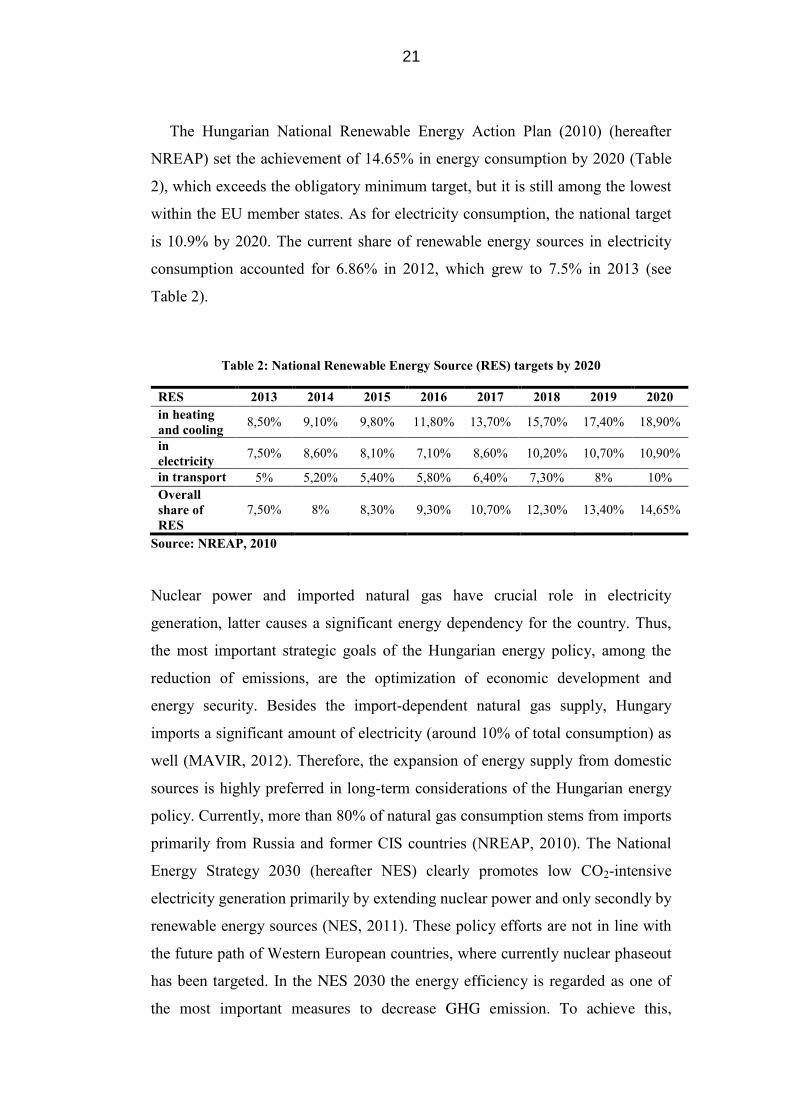
The Hungarian National Renewable Energy Action Plan (2010) (hereafter
NREAP) set the achievement of 14.65% in energy consumption by 2020 (Table
2), which exceeds the obligatory minimum target, but it is still among the lowest
within the EU member states. As for electricity consumption, the national target
is 10.9% by 2020. The current share of renewable energy sources in electricity
consumption accounted for 6.86% in 2012, which grew to 7.5% in 2013 (see
Table 2).
Table 2: National Renewable Energy Source (RES) targets by 2020
RES 2013 2014 2015 2016 2017 2018 2019 2020
in heating
and cooling 8,50% 9,10% 9,80% 11,80% 13,70% 15,70% 17,40% 18,90%
in
electricity 7,50% 8,60% 8,10% 7,10% 8,60% 10,20% 10,70% 10,90%
in transport 5% 5,20% 5,40% 5,80% 6,40% 7,30% 8% 10% Overall
share of
RES
7,50% 8% 8,30% 9,30% 10,70% 12,30% 13,40% 14,65%
Source: NREAP, 2010
Nuclear power and imported natural gas have crucial role in electricity
generation, latter causes a significant energy dependency for the country. Thus,
the most important strategic goals of the Hungarian energy policy, among the
reduction of emissions, are the optimization of economic development and
energy security. Besides the import-dependent natural gas supply, Hungary
imports a significant amount of electricity (around 10% of total consumption) as
well (MAVIR, 2012). Therefore, the expansion of energy supply from domestic
sources is highly preferred in long-term considerations of the Hungarian energy
policy. Currently, more than 80% of natural gas consumption stems from imports
primarily from Russia and former CIS countries (NREAP, 2010). The National
Energy Strategy 2030 (hereafter NES) clearly promotes low CO2-intensive
electricity generation primarily by extending nuclear power and only secondly by
renewable energy sources (NES, 2011). These policy efforts are not in line with
the future path of Western European countries, where currently nuclear phaseout
has been targeted. In the NES 2030 the energy efficiency is regarded as one of
the most important measures to decrease GHG emission. To achieve this,

22
renovations of the current building stock is highlighted (NES, 2011). Energy use
in buildings is an important part of global energy challenges, because they have a
significant share of GHG and other climate forcing agent emissions (Urge-
Vorsatz et al., 2013). Building energetics is responsible for around 40% in
Hungarian energy consumption (Szlávik and Csete, 2011).

23
2.3. Climate policy instruments
In the course of time, the palette of environmental and climate policy
instruments have been broadened (see Table 3) that can be classified into three
major groups; Direct or Command-and-control (CAC) regulations, Indirect
regulations or Market-based mechanisms and Decentralized regulations (Kerekes
and Szlavik, 2001).
Table 3: Environmental policy instruments (Kerekes and Szlavik, 2001)
Direct or Command-
and-control regulations
Indirect regulations or
Market-based mechanisms
Decentralized regulations
norms limits licensing liability fine ban standard
taxes, charges, levies, duties, effluent charges
incentives fiscal and budgetary
subsidies (tax credits, exemptions and allowances, direct transfers, low-interest loans and grants, R&D)
tradeable permits
unilateral firm statements voluntary agreements environmental marketing environmental certifications
(ISO, EMAS, etc.) eco-labelling ecoaudit enforcement incentives environmental liability
insurance information-based measures BAT (Best Available
Technology,), BATNEC (Best Available Technology Not Entailing Excessive Cost)
Historically, the first regulations aiming at reducing environmental damages
have come to life during the 1970s and 1980s. These were mostly CAC measures
that were exposed to constant criticisms for its costliness and inflexibility among
economists. As of the late 1980s, market-based instruments have emerged and
become widespread. Decentralized regulations such as voluntary agreements or
eco-labels have turned up firstly in the 1990s. They refer to commintments made
by firms regarding improvements of their environmental performance that
surpasses the required level (Lyon and Maxwell, 1999).

24
The following policy tools related to emission reduction are highlighted by
the IPCC report on mitigation of climate change (IPCC, 2007, 750. p.):
Regulatory measures and standards (these specify the abatement
technologies (technology standard) or minimum requirements for
pollution output (performance standard) that are necessary for
reducing emissions)
Taxes and charges (a levy imposed on each unit of undesirable activity
by a source)
Tradeable permits (these are also known as marketable permits or cap-
and-trade systems. This instrument establishes a limit on aggregate
emissions by specified sources, requires each source to hold permits
equal to its actual emissions and allows permits to be traded among
sources)
Voluntary agreements (an agreement between a government authority
and one or more private parties with the aim of achieving
environmental objectives or improving environmental performance
beyond compliance to regulated obligations. Not all Voluntary
agreements are truly voluntary; some include rewards and/or penalties
associated with participating in the agreement or achieving the
commitments)
Subsidies and incentives (direct payments, tax reductions, price
supports or the equivalent thereof from a government to an entity for
implementing a practice or performing a specified action)
Information instruments (required public disclosure of
environmentally related information, generally by industry to
consumers including labelling programmes and rating and certification
systems)
R&D (activities that involve direct government funding and
investment aimed at generating innovative approaches to mitigation
and/or the physical and social infrastructure to reduce emissions.
Examples of these are prizes and incentives for technological
advances)
25
Non-Climate Policies (other policies not specifically directed at
emissions reduction which may have nevertheless significant climate-
related effects).
In the next part of this section the most well-known policy intruments
targeting low-carbon transition are briefly analyzed, without attempting to be
comprehensive.
CO2 pollution as an externality of industrial and transport activities is deeply
rooted in economic theories. To handle external damages caused by an activity,
market-based instruments can be derived from two basic economic theories; the
Pigouvian tax and the Coase theorem. Pigou (1920/1938) introduced the
economic analysis of pollution starting with making a distinction between private
and social costs. Pigou argued that levying tax on a polluting activity internalizes
the external costs of the environmental damage and in doing so, limits the
pollution as well. The Pigouvian tax has gained attention and found disciples
among several economists and manifested in numerous environmental policies
such as the Polluter Pays Principle fostered by the OECD (Cerin, 2006). Eco-
taxes are applied in many countries around the world, e.g. the Environmental Tax
Reform (ETR) movement during the early 1990s has positive impacts on the
economy, environment and society (EEA, 2011).
As an alternative approach to incorporate externalities, Ronald Coase
introduced his idea in his seminal essay entitled “The Problem of Social Cost”
(1960), which has become widespread as the Coase theorem in the literature. It
states that if property rights are well-defined, transaction costs are minimal or
zero and trade in an externality is possible, then bargaining might lead to an
efficient outcome regardless of the initial allocation of property. Building on the
Coase theorem, the European Union launched the Emissions Trading Scheme
(EU ETS) in 2005 as the first cap-and-trade system for GHG emissions
(followed by the cap-and-trade initiatives in the US, Australia, Japan, New
Zealand). Cap-and-trade approach means that the system limits the overall GHG
emission, but within this limit, companies can buy and sell emission allowances,
so companies can cut their emissions in the most cost-effective way. The EU
ETS covers more than 11,000 power stations and manufacturing plants in the 28
EU member states as well as Iceland, Liechtenstein and Norway. Aviation
26
operators flying within and between most of these countries are also covered. In
total, around 45% of total EU emissions are limited by the EU ETS (European
Union, 2013). Recent studies report on the shortcomings of the emissions trading
system including carbon leakage and competitiveness loss (Monjon and Quirion,
2011; Meunier, 2014; Martin et al., 2014a). To alleviate these concerns, EU ETS
gives free allowances to firms in energy-intensive and trade-exposed industries
(Martin et al., 2014b). In the thid period of EU ETS, from 2013 onward, a much
higher number of free allowances are issued for electricity sector and industries
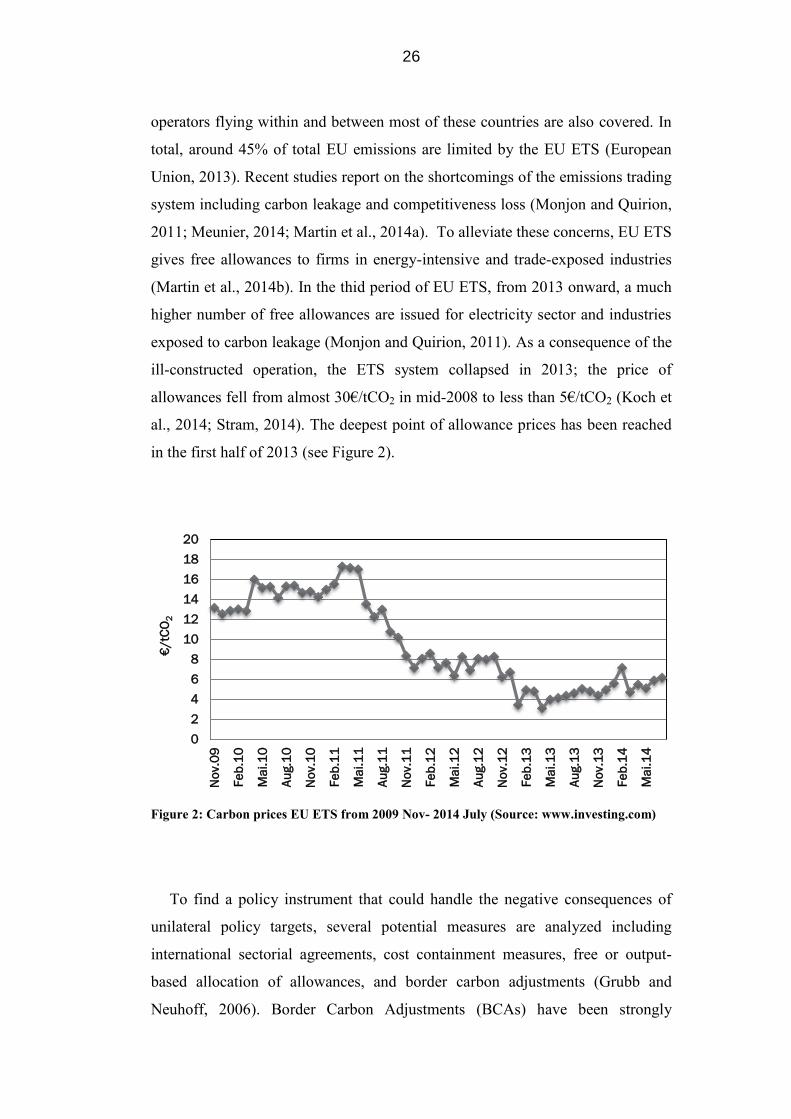
exposed to carbon leakage (Monjon and Quirion, 2011). As a consequence of the
ill-constructed operation, the ETS system collapsed in 2013; the price of
allowances fell from almost 30€/tCO2 in mid-2008 to less than 5€/tCO2 (Koch et
al., 2014; Stram, 2014). The deepest point of allowance prices has been reached
in the first half of 2013 (see Figure 2).
Figure 2: Carbon prices EU ETS from 2009 Nov- 2014 July (Source: www.investing.com)
To find a policy instrument that could handle the negative consequences of
unilateral policy targets, several potential measures are analyzed including
international sectorial agreements, cost containment measures, free or output-
based allocation of allowances, and border carbon adjustments (Grubb and
Neuhoff, 2006). Border Carbon Adjustments (BCAs) have been strongly
0
2
4
6
8
10
12
14
16
18
20
No
v.0
9
Fe
b.1
0
Ma
i.1
0
Au
g.1
0
No
v.1
0
Fe
b.1
1
Ma
i.1
1
Au
g.1
1
No
v.1
1
Fe
b.1
2
Ma
i.1
2
Au
g.1
2
No
v.1
2
Fe
b.1
3
Ma
i.1
3
Au
g.1
3
No
v.1
3
Fe
b.1
4
Ma
i.1
4
€/tC
O2
27
analyzed in the literature (Kuik and Hofkes, 2010; Schinko et al., 2014). BCAs
can be implemented as import tariffs, export rebates, or the obligation for
importers to surrender carbon allowances for the amount of CO2 that is emitted
as a consequence of the goods’ production (Kuik and Hofkes, 2010). According
to the findings of a recent review study based on a meta-analysis of numerous
studies, the typical range of carbon leakage is estimated from 5% to 25% without
policy interventions and -5% to 15% with BCAs (Branger and Quirion, 2014).
Stram (2014) suggest that implementing a small carbon tax would substantially
contribute to greenhouse gas inventories, which would have negligible economic
consequences for firms.
Policy instruments targeting a change in consumer behavior and lifestyle such
as eco-labeling or awareness raising programmes are of particular importance in
the field of energy conservation. With regard to low-carbon transition, energy
and carbon labeling are to be highlighted. Energy efficiency labels play a
significant role in reducing the energy consumption of appliances worldwide.
Energy labels may be categorized as endorsement (e.g. the Energy Star issued by
the US EPA) and comparison labels (e.g. the European Union Energy Label).
Endorsement labels are given to the most energy‐efficient products in a product
category. Comparative labels have a rating system related to the rate of the
energy efficiency of a product (Heinzle and Wüstenhagen, 2012). Heinzle and
Wüstenhagen (2012) show that the extension of the classification of applianes
and devices in the European Union (seven‐point A–G rating scale) by adding
new classes (A+, A++, etc.) result in a lower perceived importance of energy
efficiency in consumer decision‐making, which might not help to overcome
information asymmetries. Eco-labeling is also used among electricity providers
to differentiate their products along environmental characteristics (Truffer et al.,
2001). Carbon labeling informs consumers about the carbon footprint associated
with a certain good (the embedded CO2 or CO2-equivalent content). This way of
spreading information might raise awareness about climate change and ease
customers to make their purchase decisions based on CO2 intensity of a product
(Upham et al., 2011). Although the calculation of a product-level carbon
footprint is a very suitable approach for drawing attention to carbon footprint of a

28
particular product, on the other hand, its implementation also arises several
biases during calculation such as system boundary issues (different starting and
ending point choices in life-cycle analysis), product complexity, supply chain
variability, allocation issues, scaleability and costs (McKinnon, 2010). Currently,
the European market is flooded by different eco-labels that undermine the
transparency and credibility of labeling. Hartikainen et al. (2013) investigated the
Finnish consumers’ understanding about product carbon labeling and showed
that the majority of consumers are not familiar with the meaning of product
carbon footprint and only a low percentage of respondents attach product carbon
footprint to greenhouse gas emissions associated with the product. There are only
few studies posing the question how eco-labels influence consumer choices.
Governmental subsidies and incentives are also widespread to change
consumer behavior including industrial and residential users. In the European
Union numerous tax incentives are currently used to promote green electricity
including an exemption on the payments of excise duties for power plants,
limited tax incentives in personal income tax, lower tax rates in VAT etc.
(Cansino et al., 2010). Feed-in tariffs (FiT) are one of the most popular support
systems for renewable energy sources from small household applications to large
utility scale systems. For instance, feed-in tariffs accounted for nearly 72% of all
solar PV installed worldwide until 2012 (IEA, 2013). FiTs are designed to foster
both residential and industrial consumers to become “prosumers”, or, simply put,
people who are consumers and producers of energy at the same times. The
“prosumer movement” dates back to the 1980s. Back then prosumer was defined
as a person that creates goods, services or experiences for his own use or
satisfaction (Toffler, 1980). The concept has been developed in the course of
time and currently prosumers are characterized by a strong personal engagement
in co-creating value (Izvercianu et al., 2014).
Information or awareness-raising campaign is also a widespread method to
promote climate policy intention to the public. To mention one example, the
Energy Efficiency Advice Centres (EEACs) offer consultancy to encourage
households to understand, and then take action to reduce the negative
environmental impact of their energy use (Lucas et al., 2008). In spite of such
campaigns and incentives, consumers are still reluctant to adopt energy-efficient

29
measures and low-carbon technologies such as solar PV installations (IPCC,
2013).
The choice of appropriate policy instruments is the key for mitigating the
overall CO2 emission and for stimulating technological innovations. Besides
technological solutions, the role of societal factors in energy and climate research
is essential. It has been realised that low-carbon transition forced by regulations
and policies can only lead to partial success without appropriate social support.

30
3. Conceptual framework
3.1. The framework
Figure 3: The conceptual framework of the thesis (Source: Own compilation)
The way we produce and consume goods and services cause a constant rise in
CO2 level that current climate policies, for the time being, cannot stabilize
efficiently. To face the low-carbon challenge, current production and
consumption practices have to be revised and radically changed. Both sides
require the active social participation. Figure 3 depicts a simplified framework
that shows the most important societal factors playing a role in low-carbon
transition. To reduce carbon emission from production activities, we need to
adopt low-carbon and renewable energy technologies3 and increase energy and
3 Though, nuclear power generation is indeed a low-carbon technology, but considering the low social acceptance (Siegrist and Visschers, 2013) due to its other substantially harmful characteristics such as radioactive and thermal pollution, nuclear power is not incorporated into the conceptual framework towards a low-carbon society.
31
resource efficiency at the same time. The implementation of such technologies is
highly dependent on social acceptance with respect to socio-political, community
and market dimensions. To change our consumption patterns, the adoption of
policies promoting low-carbon lifestyle and reducing the consumption of
material goods are needed.
In this thesis the following three major social keystones of the framework are
analysed in-depth: (1) social acceptance of renewable energy technologies, (2)
promoting low-carbon pro-environmental behaviour, and (3) service economy.
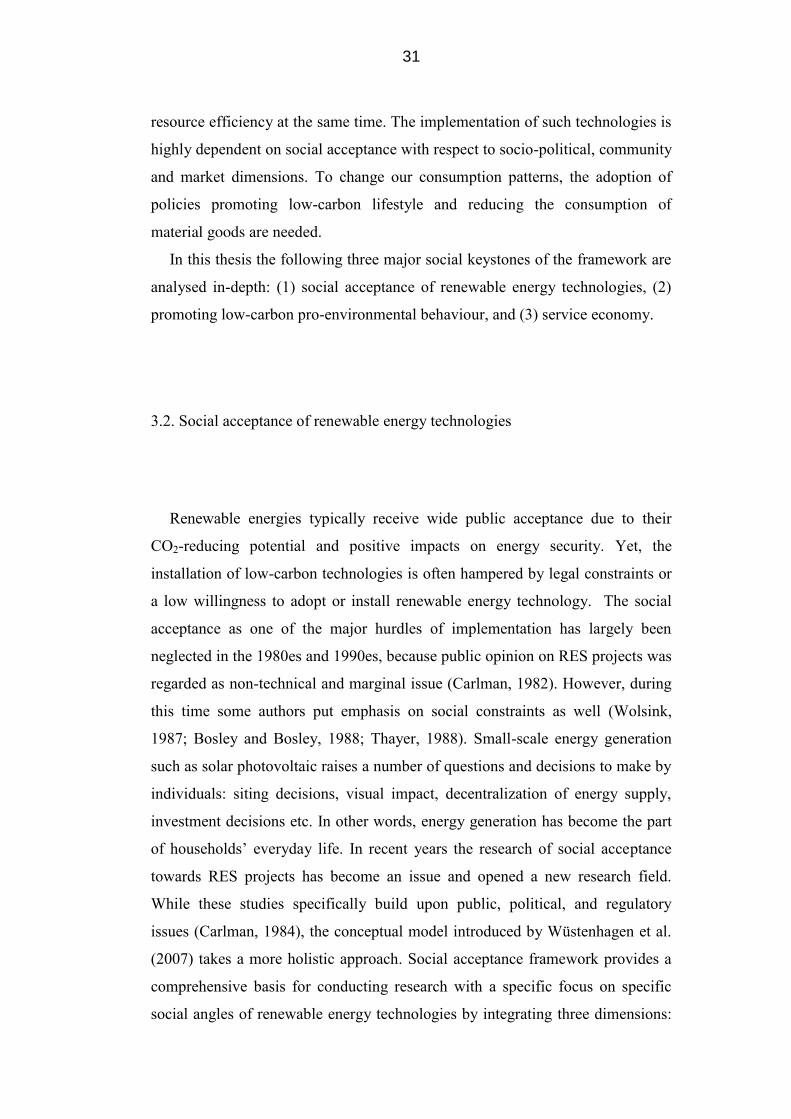
3.2. Social acceptance of renewable energy technologies
Renewable energies typically receive wide public acceptance due to their
CO2-reducing potential and positive impacts on energy security. Yet, the
installation of low-carbon technologies is often hampered by legal constraints or
a low willingness to adopt or install renewable energy technology. The social
acceptance as one of the major hurdles of implementation has largely been
neglected in the 1980es and 1990es, because public opinion on RES projects was
regarded as non-technical and marginal issue (Carlman, 1982). However, during
this time some authors put emphasis on social constraints as well (Wolsink,
1987; Bosley and Bosley, 1988; Thayer, 1988). Small-scale energy generation
such as solar photovoltaic raises a number of questions and decisions to make by
individuals: siting decisions, visual impact, decentralization of energy supply,
investment decisions etc. In other words, energy generation has become the part
of households’ everyday life. In recent years the research of social acceptance
towards RES projects has become an issue and opened a new research field.
While these studies specifically build upon public, political, and regulatory
issues (Carlman, 1984), the conceptual model introduced by Wüstenhagen et al.
(2007) takes a more holistic approach. Social acceptance framework provides a
comprehensive basis for conducting research with a specific focus on specific
social angles of renewable energy technologies by integrating three dimensions:
32
(1) socio-political acceptance; (2) community acceptance; and (3) market
acceptance.
Socio-political acceptance of renewable energy technologies considers the
acceptance of low-carbon energy technologies by the public, key stakeholders,
and policy makers. This is the broadest dimension embracing all barriers to
implementing low-carbon projects. At policy level, well-established
institutionalization of policy instruments, such as reliable financial supporting
mechanisms are required to effectively boost market and community acceptance.
However, opinion polls show that the vast majority of people support renewable
energies, even in countries where the government does relatively little to support
them (Wüstenhagen et al., 2007). Batel et al. (2013) draw attention to the
conceptual distinction in the two different meanings of public acceptance; a
reaction (passive) to something external or supporting something (active). They
empirically examined the difference between acceptance and support of high
voltage power lines and found that acceptance and support are different. They
state that support implies a more active position, whereas acceptance implies a
passive reception of power lines, rather only tolerating but not supporting them.
They also suggest that other types of responses to energy infrastructures should
be studied such as support, opposition, resistance, agreement, etc. (Batel et al.,
2013).
Community acceptance involves mostly the acceptance towards siting
decisions of renewable energy projects by local stakeholders, particularly
residents and local authorities, which also brings along the well-known NIMBY
(not in my backyard) problem regarding such projects (Wüstenhagen et al.,
2007). To overcome this issue we need to establish trust and fairness among
stakeholders by minimizing damages due to siting decisions and the use of
natural resources that potentially have negative effects on community’s social
well-being. So, NIMBY problem seems to be more complex as being assumed
before and there is some evidence found that social fairness or justice have a
major impact on social acceptance. Two essential types of environmental justice
can be discussed: distributive and procedural justice (Manaster, 1995). The
former refers to the equitable distribution of outcomes (public goods or burdens)
and the latter one means processes by which decisions are made (rights of
33
participation, access to information, and lack of bias on the part of the decision-
maker). Gross (2007) investigated the significance of procedural justice
regarding the social acceptance of wind power and found that community
perceptions of fairness influences how people perceive the legitimacy of the
outcome, and that a fairer process increases acceptance of the outcome
(procedural justice).
Finally, the last dimension of social acceptance is the market acceptance,
which embraces the process of market adoption of an innovation by investors
and consumers. Investor’s acceptance research is also crucial for the transition to
low-carbon energy systems that may require not only public engagement, but
also significant financial investments (Loock, 2012; Hampl, 2012). Venture
capital and private equity investments are important sources of financing for low-
carbon technologies to bring new technologies from research laboratories to
market (Bürer and Wüstenhagen, 2009). To overcome the challenge the
commercialization phase of succesful prototypes (“technology valley of death”),
venture capital and private equity investors are of utmost importance (Moore and
Wüstenhagen, 2004). Although there has been recently a remarkable increase in
attention to the renewable energy technology sector from the private investment
community, these type of investments are affacted by government policies at
various stages of venture capital, thus investors’ perceptions of such risks need to
be scrutinized (Bürer and Wüstenhagen, 2008). The role of consumers has
changed in energy market, besides their classical consumer position, they have
become investors as well (Zhai and Williams, 2012). Thus, consumers’
perceptions and preferences for adoption renewable energy technologies in their
homes as well as green energy tariffs provided by energy utilities are in the focus
of recent research. Therefore, consumer acceptance is one of the most important
components of market acceptance dimension that has not been exploited in the
literature yet.

34
3.3. Promoting low-carbon pro-environmental behavior
To support top-down climate policy instruments, bottom-up social support is
needed that promotes low-carbon pro-environmental behavior. Low-carbon pro-
environmental behavior embraces all types of actions people undertake to
maintain their lifestyle.
Research conducted on consumer behavior has usually two initial
assumptions; the first one is that most choices are made by individuals and the
second one is that these decisions are based on individual's personal attitudes,
beliefs, and preferences (Simpson et al., 2012). While psychological studies
stress the role of social and psychological factors, other studies place structural
conditions in the searchlight (Sanne, 2002). Thus, the structural lock-in causes
situations where consumers cannot act according to their preferences. Some
actions, however, can almost always be substituted for lower carbon-intensive
analogs, e.g. the use of a running machine that consumes electric power can be
avoided by outdoor running or short-distance transportation activities, in which
case one can usually choose from several options such as train, public
transportation, passanger car etc. Of course, energy-intensive activities are not
always interchangeable with low-carbon ones out of various reasons.
The main barrier to picking up low-carbon behaviour is the fact that people
are keen on consuming. In economic theories higher income leads to better-
covered needs, which also means a higher subjective wellbeing, but in sociology
and social psychology the relative economic position (compared to reference
group) is considered the carrier of utility, not absolute consumption; this is often
called the theory of „relative deprivation” (Ravallion and Lokshin, 2005;
Guillen-Royo, 2011). Ferrer-i-Carbonell (2005) analyses the importance of
„comparison income” (the income of a reference group) for individual well-
being or happiness and found that those individuals are happier that have larger
income than in comparison with the income of the reference group. Happiness
research is rooted in the Easterlin paradox named after Richard Easterlin (1974),
who conducted surveys of human happiness in nineteen developed and
developing countries to investigate the connection between happiness and
35
income. He concluded that within countries there is a positive association
between income and happiness, but in international comparisons this association
is much weaker (Easterlin, 1974), which opened a new field of research in
economics.
Measures and policies targeting energy efficiency among residents are
frequently hampered by a low willingness to invest in such technologies because
of misconceptions about the effectiveness of such measures (Gardner and Stern,
2008) or lack of knowledge about climate change (Sterman and Sweeney, 2007).
The lack of information leads to general inertia and the support of wait-and-see
policies that is highly promoted by the US government. It hampers the adoption
of low-carbon pro-environmental behavior and investments in low-carbon
technologies.
3.4. Theoretical roots of servitization
In the literature several authors pointed out that the reason of unsustainable
economic system roots primarily in our overconsumption (e.g. Shove, 2004;
Tóth and Szigeti, 2013). To tackle this problem, there are two main streams of
research; the first is to reduce demand and the second one is to reduce the
consumption of material goods by servitization.
The concept of services often creates a challenging, sometimes a puzzling
situation for practioners as well as for researchers. In economic theory, services
are mostly regarded as non-material, immaterial or intangible goods. Services’
non-materiality dates back to Adam Smith’s theory where he divides the
economy on the basis of productive and unproductive labour. Latter refers to
activities that have no tangible outcome and which are nowadays called services
(Fourcroy et al., 2012). Even though Smith did not explicitly use the word ‘non-
materiality’ as the basis for distinction, it has been spread and adopted as the
main charactersitic for separating goods and services. According to OECD
(2000) services are “a diverse group of economic activities not directly
36
associated with the manufacture of goods, mining or agriculture. They typically
involve the provision of human value added in the form of labour, advice,
managerial skill, entertainment, training, intermediation and the like” (OECD,
2000, p. 7.). It adds that the main characteristic that distinguishes services from
other activities is that they cannot be stored and have to be consumed at the point
of production. There are, however, economists who have come up with other
approaches to capture the essence of services, for example, Hill (1977) proposes
the following definition: ”A service may be defined as a change in the condition
of a person, or of a good belonging to some economic unit, which is brought
about as the result of the activity of some other economic unit, with the prior
agreement of the former person or economic unit” (Hill, 1977, p. 318). Hill
stresses that services cause a change in the condition of a person or a good,
which provides a comprehensive definition covering most service activities, but
in some cases it makes difficult to differentiate them from goods (Parrinello,
2003). Parrinello (2004) suggested that the concept of services should be grasped
through economic process analysis. He concluded that services are distinct
category from immaterial and material goods; service can be described as an
“activity, which requires not only labour as input, but also other means of
production” (Parrinello, 2004, p. 387.). This is considered as a parallel input-
output relation, where an activity performed by one process can be an input of
another process at the same time. In this study the process-based approach is
applied and reflected during the calculations to capture the actual impacts of
services on the whole economy.
There are lots of highly-linked notions spread related to the latest stage of
economic developement in the literature such as service economy, post-industrial
economy, knowledge-based economy, new economy, etc.
The term service economy roots in the notion that was first introduced as the
“post-industrial society” by Daniel Bell in 1973 that refers to the stage when
services overweight the manufacturing sector in the economy in terms of wealth.
He particularly emphasized the role of knowledge-based services and foresaw
the increasing importance of scientists shaping the future economies (Bell,
1973). Service economy originally does not imply the greening of economy, it
simply states that there would be a shift towards services in terms of monetary
37
value and employment in developed countries (e.g. Buera and Kaboski, 2012). In
the 1990s another term, the so-called ‘knowledge-based economy’ has emerged.
It describes ‘economies which are directly based on the production, distribution
and use of knowledge and information’ (OECD, 1996, p. 7.). These notions have
been of interests among environmental researchers. Chichilnisky (1998)
concluded that knowledge-intensive growth leads to the mitigation of
environmental damages since it does not require intensive use of the resources.
She calls it the knowledge revolution that means a transformation from a
resource-intensive to a knowledge-intensive economy and not the transformation
from industrial production to services. All revolutions need to adopt a new fuel,
which is in case of the knowledge revolution the information technology.
However, other authors, e.g. Ehrlich et al. (1999) pose the question if there is a
knowledge explosion and if so, whether it would help the environment. They
concluded that if knowledge is defined as only useful and accurate information,
then the evidence for a knowledge explosion becomes mixed or does not imply
an actual growth of environmentally beneficial knowledge. They claim that ‘the
ability to shift economic activity from goods toward services only partly
eliminates the need for fundamental natural resources and must eventually
encounter limits. Knowledge can never be a sole antidote to the increasing
pressures on the environment posed by increasing population and per-capita
consumption’ (Ehrlich et al., 1999). Cogoy (2004) investigates the environmental
impacts of human capital and knowledge-based services based on the assumption
that consumption is a time-requiring activity and consumers’ goal is to spend
time in a pleasant way. He describes the dematerialization process of the
economy as the structural change in time, which is structured in four parts in his
theoretical model: enjoyment, production, services and research. Assumingly, if
time were shifted to research, then due to the accumulation of human capital,
there would be a change induced from production to services. He adds that
individuals’ wellbeing is increased more by means of services and knowledge
than by means of commodities (Cogoy, 2004).
In general, servitization is believed to lead us to a sustainable pathway,
because it focuses on final user needs, rather than on selling products, which
could reduce environmental load (Tukker, 2013). Theoretically, the transition to

38
a service economy is supposed to bring less energy-intensive activities to reduce
energy demand. Another approach pertaining to natural capitalism appears to
define service economy in the literature introduced by Paul Hawken, Amory
Lovins and Hunter Lovins (1999). Unlike industrial capital that only includes
financial and manufacturing capital, it also places emphasis on both natural and
human capital. It proposes four strategies that enable business to increase profit
while behaving environmentally responsible. One principle is the so-called flow
economy that ‘involves shifting from a perception of wealth as goods and
purchases to a perception of value as desired services and satisfaction of human
needs’ (Hawken et al., 1999). This idea practically captures the essence of
sustainable Product-Service Systems (PSS). Currently, PSS stands in the
research focus of a lot of studies in the field of industrial ecology. The product-
service system can be defined as ‘a mix of tangible products and intangible
services designed and combined so that they are jointly capable of fulfilling final
customer needs’ (Tukker and Tischner, 2006). Initially, the aim of PSS is to
increase the value of a product by adding services and an additional favourable
side-effect is proven to be the reduction in consuming of energy intensive
physical products (Beuren et al., 2013). Nowadays, PSS is usually described as
‘a system of products, services, supporting networks and infrastructure that is
designed to be: competitive, satisfy customer needs and have a lower
environmental impact than traditional business models’ (Mont, 2002). The most
common examples in PSS are sharing, renting, and leasing. It has to be noted that
PSS does not necessarily mean a sustainable solution, only some PSS can
provide real environmental improvement. It offers only an attractive concept to
develop such solutions but there are a lot of constraints and barriers at the
moment that vary on a case by case basis such as rebound effect or the social
acceptance of such new services, which mostly pair up with the adoption of new
behavioral patterns. For example, in case of car sharing a cultural shift is needed
for consumers from having a car to using or renting it (UNEP, 2000). These
hurdles make the implementation of such innovations very difficult, therefore the
presence of such solutions in current economies is negligible.
39
4. Applied methodological background
The thesis contains both empirical and non-empirical research. Two studies
rely on a representative survey and one study applies a quantitative model. This
chapter specifically concentrates on the explanation of the chosen
methodological approaches for measuring preferences and carbon impacts.
4.1. Methods for measuring preferences
In the literature, there are two main approaches to measuring consumer
preferences; revealed and stated preference method (Adamowicz et al., 1994).
Revealed preferences can be observed through actual choices made by
individuals or households. Assuming that actions undertaken in the past reflect
consumers’ preferences are useful for studying existing products or services, but
new settings or product features can be barely investigated by historical data (van
Oel and van der Berkhof, 2013). Thus, stated preferences are theoretically
eligible for investigating both marketable and non-marketable goods. There are
several stated preference methods used in the literature, but the most prevalent
ones are the contingent valuation method (CVM) and the discrete choice
experiment (DCE). The CVM aims at estimating the benefits (or costs) resulting
from a policy that improves (or worsens) the environmental quality (Mitchell and
Carson, 1989). Respondents are asked in a hypothetical market about their
willingness to pay (WTP) for receiving a public good or service or about their
willingness to accept (WTA) a compensation for the loss of a good or service
(Ramajo-Hernández and del Saz-Salazar, 2012). In other words, it always
compares a (hypothetical) state to status quo and measures the change in
wellbeing in terms of monetary value. Discrete choice experiments are widely-
used in marketing research and are characterized by multinomial discrete choice
questions arranged in a choice set. The theoretical background of DCE is derived

40
from the classic microeconomic utility theory, which assumes that individuals
always maximize their utility. This theory advanced by Lancaster (1966) shifts
the focus from the product itself to product characteristics (Sammer and
Wüstenhagen, 2006). DCE is the most suitable method for measuring the
preferences for attributes of hypothetical products (or products that are before the
commercialization phase), because it is not possible to observe the actual
purchase behavior or measure preferences through revealed preference methods
(Ewing and Sarigöllü, 2000).
In the first study a conjoint method is applied. Conjoint (trade-off) analysis
belongs to stated preference methods (also referred to as discret choice
modelling) that indirectly determine the importance of product attributes in
consumer decision-making. The method has a long history that started in the
1920s, but its official starting point is agreed to be in 1964 when Luce and Tukey
introduced the methodology in their seminal paper (Green and Srinivasan, 1978).
Ever since conjoint techniques have received huge attention since the early
1970es among marketing and consumer researchers and practitioners as well
(Green and Srinivasan, 1990). The major advantage of this method over other
stated preference techniques is that it provides a real buying situation for
respondents, where they are asked to choose from different products. The
products vary in attribute levels and cannot be combined by the respondents, so
they need to choose one ‘package’ from the choice set (Sammer and
Wüstenhagen, 2006). In doing so, consumer preferences for product attributes
are implicitly derived from stated choices. This indirect type of questioning
method is more eligible for understanding how product attributes affect choices,
thus it offers more accurate predictions about the future market reception of a
new product. The indirect way of questioning about preferences gives the major
strength of the method, hence the bias occurring during direct questioning can be
eliminated (Zacharakis and Meyer, 1998).
Conjoint analysis has three main types; Choice-based conjoint (CBC),
Adaptive conjoint (ACA) and Menu-based conjoint (MBC) analysis. Adaptive
conjoint analysis can be more suitable than CBC, if the choice task involves a
complex product with 5 or more attributes. Adaptive conjoint analysis main
feature is that the survey is customized for each respondent, namely at each step
41
respondents’ utilities are re-estimated according to previous answers (Sawtooh,
2007). The main difference between CBC and ACA is that in CBC respondents
are presented with several sets of options, and asked to chose one rather than the
other by rating or ranking attributes. ACA starts with a set of questions to
identify relevant attributes, which are used for creating options at the end of the
survey. Menu-Based Conjoint (MBC) analysies is suitable for handling a variety
of menu choice situations in which respondents build their preferred selection
during the process. The first study applies the standard CBC method, which is
the most-widely used conjoint technique. CBC method is described in detail in
the next chapter.
4.2. Methods for measuring CO2 impact
Carbon impacts are measured in the second and third studies both at
residential and national level. To measure the carbon impact of a process,
product, service, organization, city or national economy, carbon footprint
analysis has to be carried out (Galli et al., 2012). Carbon footprint belongs to the
footprint family along with the ecological footprint concept introduced by
Wackernagel and Rees (1996) and the water footprint developed by Hoekstra and
Hung (2002). Carbon footprint was firstly defined by Høgevold in 2003, but until
recently various definitions and calculation techniques have come to life (Cucek
et al., 2012). On the one hand, carbon footprint can be regarded as the part of
ecological footprint, where the carbon footprint refers to a hypothetical land area
(global hectare) needed for the substitution of one unit fossil fuel burned. By
substitution is meant the area, which is required to absorb the CO2 emitted from
the burning process (GFN, 2008). Carbon footprint can also simply stand for the
amount of CO2 or CO2-equivalent (including other GHGs) emitted within a
defined system boundary.
Methodologically, carbon footprint analysis can be delivered in three ways;
(1) IPCC method, (2) process-based life cycle analysis and (3) input–output
analysis method (Dong et al., 2013).
42
The IPCC method provides detailed calculation formula and emission factors
for various emission sources combusted at various sites. These factors consider
only the direct emission from fuel combustion, namely they lack a life cycle
perspective and they are also not suitable for calculation of embedded emissions
(IPCC, 2006).
Life Cycle Assessment (LCA) is a methodological tool for assessing the
environmental impacts of a particular product during the whole life cycle, i.e. it
considers usually all impacts occurring from raw material acquisition, throughout
production and to end users or to waste management (ISO, 2006). LCA is
regarded as one of the most accurate and suitable approaches for the evaluation
of the environmental impact of a particular product, though it suffers of some
limitations (Crawford, 2008). The traditional process-based life cycle analysis
can usually describe the main processes and inputs in detail, but system
boundaries are mostly not well-defined. Defining boundaries in process-LCA has
been discussed in many studies (Whittaker et al., 2013) using different ending
and starting points of the analysis. In some special cases geographical and
temporal distances are considered as system boundaries as well, but traditionally
three major types of system boundaries in the life cycle inventory can be defined
(Guinée et al., 2002); the first one is between the technical system and the
environment, the second one lies between significant and insignificant processes,
and finally there is one between the technological system under study and other
technological systems. In relation to the system boundary between the technical
system and the environment, e.g. the inputs should be considered raw materials
as found in nature in unprocessed form (Finnveden et al., 2009).
The input-output analysis is a top-down technique and was first introduced by
Wassily Leontief in the 1930s for the analysis of the inter-relationship of
different economic sectors, where the sectorial transactions are based on
monetary data and calculated at national level. Then, IO models have been
extended in the course of time to measure physical units such as determining the
pollution or the environmental load of different sectors and product groups (see
Bicknell et al., 1998). IO analysis has its shortcomings as well. However, it takes
into account capital goods and provides a complete analysis without system
43
boundary issues (except for the end-of-use and end user phases are not included
in IO tables), which is an advantage over process-based LCA.
Both process-based LCA and IO methods have drawbacks and benefits, so the
combination of the two methodologies has therefore been applied in practice
successfully (Suh et al., 2004; Treloar et al., 2001). LCA-IO analysis (or hybrid
analysis) combines the traditional inventory analysis methods such as process
and input-output analysis in order to mitigate the limitations of available data
sources and the assessment methods (Crawford, 2008). In such hybrid LCA-IO,
the impact of a certain product is analysed with LCA, and the impact of process
is estimated with the help of IO. LCA-IO approach allows economic information
to be linked to environmental data of each sector and can then be used to
calculate the environmental impacts of products covering the full supply chain
(Junnila, 2008). LCA-IO method provides several favorable features over
process-LCA. Firstly, LCA-IO reconciles the system boundary issue of process-
based LCA, since LCA-IO theoretically involves all processes across the whole
supply chain. Furthermore, all inputs, materials, resources etc. have to be given
only in monetary units, which are more easily and publicly available information.
Finally, using IO tables combined with process data ease and accelerate the
calculation of processes since a lot of process data is already included in LCA-IO
tables (Junnila, 2008). The limitation of this method is that it underachieves the
detailed process analysis, because it relies on average product data (Suh et al.,
2004; Finnveden et al., 2009).
44
II. Consumer acceptance of green electricity
– Segmentation analysis based on choice
experiment in Germany
1. Introduction and Research Goal
With the liberalization of the electricity market in 1998, German residential
customers were given the opportunity to freely choose their preferred electricity
provider and electricity product from among several competitors. However, despite
the fact that recent consumer research in Germany shows that many German citizens
have strong preferences for renewable energy sources (Gerpott and Mahmudova,
2010; Kaenzig et al., 2011), the share of green electricity consumers is still in the
“single-digit percentage range” (Litvine and Wüstenhagen, 2011). In other words,
even when consumers demonstrate a strong preference for green electricity, they are
passive in their purchasing decisions to a large extent.
The residential sector accounts for almost 25% of total final electricity
consumption in Germany (BMU, 2009). Germany generated about 16 percent of this
amount from renewable sources in 2009, with the share increasing to 23 percent in
2012 (BMWI, 2013). Generating electricity from renewable energy sources is
fundamentally important in a sustainable and secure energy system (Madlener and
Stagl, 2005), and also helps reduce dependence on foreign energy sources and hedge
the risk associated with movements in oil and natural gas prices.
In this respect, consumers have the power to express their desire for a more
sustainable future by subscribing to a green electricity tariff (Diaz-Rainey and
Ashton, 2011). Identifying the consumer segments which are most receptive to
purchasing green electricity, exploring what product features those segments value
most, and analyzing what distinguishes them from consumers that have already
undertaken the switch to green electricity is fundamentally important if targeted
45
messaging is to be developed by policy makers and marketers in order to reach
consumers “beyond the eco-niche” (Villiger et al., 2000).
In order to contribute to the existing literature in this field, a novel approach by
applying a choice-based conjoint (CBC) analysis is chosen in order to indirectly
elicit preferences of a representative sample of the German population for electricity
product attributes. Based on CBC data, a latent class approach to market
segmentation is then followed through capturing market heterogeneity in attribute
preferences across a full set of attributes in order to identify segments with similar
preferences (Desarbo et al., 1995).
The first goal of this research is to estimate the proportion of the market that can
be reached with green electricity products by identifying different potential green
electricity adopter segments with varying degrees of preference for green electricity
and other attributes. These findings should help marketers to develop more effective
and focused marketing strategies and to enhance product offerings by differentiating
electricity products using features other than price, allowing marketers to more
effectively satisfy consumers’ needs.
The second goal of the research is to identify factors that differentiate between
consumers that have already subscribed to a green electricity tariff and those that
display strong preferences towards a green electricity product but have not “walked
the talk” (Litvine and Wüstenhagen, 2011). More precisely, an investigation of
socio-demographic, psychographic and behavioral variables is used to examine
whether those electricity consumers who have strong preferences for
environmentally friendly attributes of electricity mixes (Potential Adopters) are
significantly different from consumers that have already subscribed to a green
electricity tariff (Adopters). The research is thus designed to generate a more
sophisticated understanding of the main drivers of the adoption of green electricity
and to develop recommendations for green electricity marketers and policy makers
about how to better tailor their messages to different customer segments.
Whereas former research has mainly focused on the formation of purchase
intention and propensity of customers to buy green products, this research takes a
step forward by investigating customers who have already purchased a green product

46
and contrasts them with three different potential adopter segments along socio-
demographic variables, psychographic and behavioral characteristics.
2. Related research and development of hypotheses
2.1. Product differentiation of electricity products in liberalized markets
With the introduction of competition to the electricity market, consumers have
become able to exercise choice over the electricity product that best fits their
preferences, including having the option to choose energy generated from renewable
sources. As the tailoring of products in line with customer demand can create
competitive advantage, electricity companies are becoming more and more interested
in understanding what product features customers prefer, such as green electricity
(Kaenzig et al., 2013).
A very substantial stream of literature exists that shows that consumers are willing
to pay a premium for electricity generated from renewable energy sources (Amador
et al., 2013; Roe et al., 2001; Alvarez-Farizo and Hanley, 2002; Ek, 2005; Bergmann
et al., 2006; Wiser, 2007; Longo et al., 2008; Litvine and Wüstenhagen, 2011; Zhang
and Wu, 2012; Zoric and Hrovatin, 2012). In addition, different studies have shown
that consumers attribute great importance to the energy source of the electricity
product when compared to other important product attributes (e.g. price, location of
electricity provider, etc.) in their purchasing decisions. Many pieces of research have
used conjoint experiment methodology in their analyses (e.g. Cai et al., 1998; Goett
et al., 2000; Burkhalter et al., 2009). Rather than directly asking respondents which
attributes they consider most important in a product, conjoint analysis requires
respondents to evaluate different hypothetical power products. This enables the
indirect measurement of the impact of product features on consumer choices. For
instance, a recent study by Kaenzig et al. (2013) investigated the relative importance
of different product attributes in the purchasing choices of German households. They
found that price and electricity mix were the two most important attributes for the
47
average consumer, followed by the location of electricity generation, the price
guarantee, certification with an eco-label, type of power provider (e.g. municipal
utility or major national provider) and contract cancellation period. Research by
Burkhalter et al. (2009) revealed similar findings for the Swiss market. Swiss
consumers also considered the electricity mix to be the most important attribute,
followed by monthly electricity costs and the location of the electricity generation.
Other attributes, such as the electricity supplier, the pricing model, eco-certification
and the duration of the contract only played a subordinate role. Rowlands et al.
(2003) showed that price, reliability of power supply and environmental features
were the most important factors that influence choice of power supplier. Goett et al.
(2000) also found that customers were vitally concerned about the provision of
renewable energies. A recent study into preferences for electricity attributes in
Germany highlighted that the most important product attributes for German
customers, besides price and price guarantee, were that the energy provider invests in
renewable energy sources and that the power generation was regionally located
(Mattes, 2012).
Previous choice-based conjoint research designed to measure the preference for
features of electricity products has reported results at an aggregate level. However,
measuring preferences for product features at the aggregate level risks masking
important distinctions between different segments of consumers. Consumers
interested in the energy mix of electricity products generally do not consist of a
homogenous block but can be differentiated into several sub-segments. We extended
the findings of previous research by identifying, via a post-hoc segmentation
approach, three different market segments for potential green electricity consumers.
We then explored what product features those different segments consider most
desirable when choosing an electricity product.

48
2.2. Related research on potential adopters of green electricity
Many studies in green marketing attempt to define the characteristic of green
consumers for segmentation purposes. In marketing literature, these factors are often
classified into the categories of geographic characteristics (e.g. geographic region),
demographic and socio-economic characteristics (e.g. age, sex, household size, etc.),
psychographic characteristics (e.g. values, life-style and personality variables etc.)
and behavioral variables (e.g. purchase occasion) (Kotler and Keller, 2006).
With regard to socio-demographic factors, several studies have focused on
investigating the characteristics of potential consumers of green electricity that claim
to be willing to pay a premium for green electricity. For example, several authors
(Rowlands et al., 2003; Zarnikau, 2003; Ek and Soderholm, 2008; Diaz-Rainey and
Ashton, 2011) showed that a higher income tends to increase reported willingness to
pay (WTP) a premium for green electricity. Gerpott and Mahmudova (2010)
positively correlate household size with WTP for green electricity. In addition,
several authors have claimed that WTP for green electricity tends to be positively
correlated with a higher level of education (Rowlands et al., 2003; Zarnikau, 2003;
Wiser, 2007; Ek and Soderholm, 2008). Regarding other variables, Rowlands et al.
(2003) showed that gender did not significantly explain higher WTP for green
electricity. Finally, several studies have concluded that consumers who are younger
are also more willing to pay a higher premium for green electricity (Zarnikau, 2003;
Gerpott and Mahmudova, 2010). Another relevant socio-demographic factor is
whether a respondent has undergone a significant life event or change in status such
as a divorce or relocation (during relocation, power providers can seize the window
of opportunity to encourage consumers to switch energy providers or products).
Andreasen suggests that “measures of status change should be seriously considered
as predictor variables in future consumer studies in marketing, particularly those
concerned with developing market segments” (Andreasen, 1984, p. 794). Mathur et
al. (2006) also support using life events in market segmentation.
Although these briefly-summarized findings are far from conclusive they indicate
that socio-demographic variables do have an influence on WTP for green electricity

49
and offer an easy way to segment a market. However, most authors agree that
particularly psychographic and behavioral characteristics are more important in
explaining ecologically friendly behavior (Straughan and Roberts, 1999).
In this respect, Diaz-Rainey and Ashton (2011) have pointed out that knowledge
about green electricity has an important influence on preferences for green
electricity. In addition, customers with a high price tolerance for green electricity
have been characterized as having positive attitudes towards green electricity (Hansla
et al., 2008), towards environmental protection (Gerpott and Mahmudova, 2010), or
greater concern for environmental problems (Rowlands et al., 2003).
In addition, perceived consumer effectiveness in an environmental context (i.e.
the extent to which consumers think their own behavior might help to preserve the
environment) has been shown to correlate with higher preference for green
electricity. For instance, Rowlands et al. (2003) found perceived consumer
effectiveness to be a relatively strong explanatory variable for willingness to pay a
premium for green electricity. In terms of behavioral variables, both Gerpott et al.
(2001) and Wiser (2007) showed that consumers who are involved in pro-
environmental activities have a higher willingness to pay for green electricity.
Another relevant factor is whether a respondent has undergone a significant life
event or change in status such as a divorce or relocation, which is supported by
Mathur et al. (2006) in market segmentation. For instance, Arnold (2011) found out
that relocation is correlated to a readiness to pay a surcharge for sustainable products.
2.3. Related research on adopters of green electricity and hypotheses development
In contrast with research that has profiled potential adopters of green electricity,
research into the profiles of subscribers of green electricity (Adopters) is relatively
scarce; only a few studies have attempted to explore this topic so far (Rose et al.,
2002; Clark et al., 2003; Arkesteijn and Oerlemans, 2005; Kotchen and Moore,
2007).
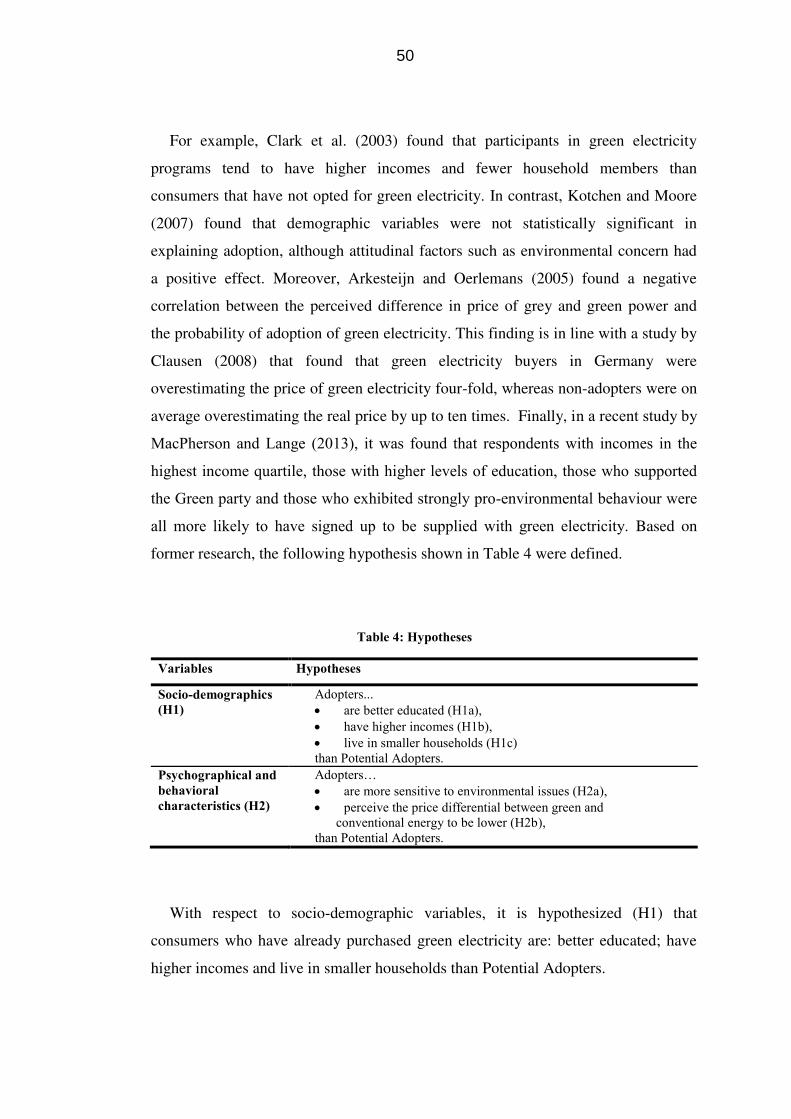
50
For example, Clark et al. (2003) found that participants in green electricity
programs tend to have higher incomes and fewer household members than
consumers that have not opted for green electricity. In contrast, Kotchen and Moore
(2007) found that demographic variables were not statistically significant in
explaining adoption, although attitudinal factors such as environmental concern had
a positive effect. Moreover, Arkesteijn and Oerlemans (2005) found a negative
correlation between the perceived difference in price of grey and green power and
the probability of adoption of green electricity. This finding is in line with a study by
Clausen (2008) that found that green electricity buyers in Germany were
overestimating the price of green electricity four-fold, whereas non-adopters were on
average overestimating the real price by up to ten times. Finally, in a recent study by
MacPherson and Lange (2013), it was found that respondents with incomes in the
highest income quartile, those with higher levels of education, those who supported
the Green party and those who exhibited strongly pro-environmental behaviour were
all more likely to have signed up to be supplied with green electricity. Based on
former research, the following hypothesis shown in Table 4 were defined.
Table 4: Hypotheses
Variables Hypotheses
Socio-demographics
(H1)
Adopters... are better educated (H1a), have higher incomes (H1b), live in smaller households (H1c) than Potential Adopters.
Psychographical and
behavioral
characteristics (H2)
Adopters… are more sensitive to environmental issues (H2a), perceive the price differential between green and
conventional energy to be lower (H2b), than Potential Adopters.
With respect to socio-demographic variables, it is hypothesized (H1) that
consumers who have already purchased green electricity are: better educated; have
higher incomes and live in smaller households than Potential Adopters.

51
With regard to psychographic and behavioural variables it is also hypothesized
that (H2) Adopters are significantly more sensitive to environmental issues and
based on former research, we also hypothesize that a lack of price awareness would
be one of the most influential psychographic characteristic that influences adoption
of green electricity.
Research has shown that the perception of the price of a certain product or service
plays a major role in making purchasing decisions (e.g. Kalwani and Yim, 1992;
Kalwani et al., 1990). Several studies have highlighted the role of the gap that may
exist between the real and the perceived prices of products (Jacoby and Olson, 1977).
Price awareness relates to the ability of the customer to recall, more or less correctly,
the price of a product (McGoldrick and Marks, 1987). A recent piece of research
regarding grocery products found that between 40% and 50% of the purchases under
study were made due to consumers’ expectations about prices rather than real, posted
prices (Murthi and Rao, 2012). Green electricity, in the past, was typically sold at a
higher price (typically from 10 - 30 percent more) than conventional energy
(Kotchen and Moore, 2003). Although the real price difference between green
electricity and conventional power has significantly decreased over the last decade in
Germany, consumers who have not opted for green electricity might still implicitly
assume that electricity generated from renewable energy sources costs significantly
more. This cost perception may be a component of the attitude-behavior gap, in that
the perceived price difference results in an obstacle to the acceptance and uptake of
the environmentally-friendly product alternative.
3. Methods
3.1. Chosen stated preference methodology: choice-based conjoint analysis
There are two main approaches of measuring consumer preferences for a certain
good or service: (a) the revealed preference and (b) the stated preference
methodology (Adamowicz et al., 1994). Revealed preferences can be observed
52
through actual choices made by individuals or households. Assuming that actions
undertaken in the past reflect consumers’ preferences, this approach is useful for
studying preferences for existing products or services. However, new product
features can be barely investigated by using historical data (van Oel and van der
Berkhof, 2013). In contrast, stated preferences are eligible for investigating both
goods available on the market and hypothetical products. The most prevalent stated
preference methods are the contingent valuation method and choice experiments.
The former approach aims to obtain an economic value for the provision of public
goods or services (Mitchell and Carson, 1989). In contrast, choice experiments are
widely used in marketing research and are characterized by multinomial discrete
choice questions in a choice set. The theoretical background of choice experiments is
derived from the classic microeconomic utility theory, which assumes that
individuals maximize their utility. This theory was advanced by Lancaster (1966)
with shifting the focus on product characteristics from the product itself (Sammer
and Wüstenhagen, 2006). This approach is a very suitable for measuring the
preferences for hypothetical products or attribute combinations, because when it is
not possible to observe the actual purchase behavior or measure preferences through
revealed preference methods (Ewing and Sarigöllü, 2000). More precisely, this
method provides a real buying situation for respondents, where one or more products
are offered to choose one of them. These products differ in their attributes and cannot
be combined by the respondents, but they need to choose one ‘package’ from the
choice set (Sammer and Wüstenhagen, 2006). Consumer preferences for product
attributes are implicitly derived from the stated choices by indirect type of
questioning.
In this study a Choice-based conjoint (CBC) analysis is applied. The CBC method
uses hierarchical Bayes (HB) estimations (Orme, 2007) that estimates the
distribution of part-worth utility values across the population and combines with the
information on individuals' choices to derive posterior or conditional estimates of the
individuals' values2. With hierarchical Bayes estimations, it is possible to determine
individual part-worth utilities to assess heterogeneity among customer segments.
This is an advantage in comparison to traditional conjoint approaches based on
53
aggregated preferences measures. The HB model is hierarchical because it applies a
lower and an upper level model to calculate the utilities of individual respondents. At
the lower level, the probability a respondent selects a particular choice option is
assumed to be governed through use of a multinomial logit model. At the upper
level, it is assumed that respondents have a single multivariate normal distribution
(Rossi and Allenby, 2003; Sawtooth Software, 2009), which can be described as
follows:
� ≈ � � ,
where βi is a vector of part-worth utility of individual i; α is a vector of means of
the distribution of individuals' part-worth utilities; and D a matrix of variances and
covariances of the distribution of part-worth utilities across individuals. The
utility (uk) function of individual i is defined as u k = x k ′ β i . The probability of the kth
alternative that individual i selects in a given choice task is:
� = ���(�′ � )∑ ���(�′ � )
where xj is a vector of attribute values describing the jth alternative in the choice
task. The parameters to be estimated are the vectors βi. The estimation of the part-
worth vector is conducted by an iterative process using Markov Chain Monte Carlo
method (Rossi et al., 2005).
3.2. Selected product attributes for choice experiment
Choice-based conjoint analysis was used by several scholars to identify which
attributes consumers considered most relevant for an electricity product (e.g.

54
Kaenzig et al., 2013; Cai et al., 1998; Goett et al., 2000; Burkhalter et al., 2009).
Research by Burkhalter et al. (2009) revealed similar findings for the Swiss market.
Swiss consumers considered the electricity mix to be the most important attribute,
followed by monthly electricity costs and the location of the electricity generation.
Other attributes, such as the electricity supplier, the pricing model, eco-certification
and the duration of the contract only played a subordinate role. Rowlands et al.
(2003) showed that price, reliability of power supply and environmental features
were the most important factors that influence choice of power supplier. Goett et al.
(2000) also found that customers were vitally concerned about the provision of
renewable energies. A recent study into preferences for electricity attributes in
Germany highlighted that the most important product attributes for German
customers, besides price and price guarantee, were that the energy provider invests in
renewable energy sources and that the power generation was regionally located
(Mattes, 2012).
This study builds on the findings of above-mentioned studies and investigates the
relative importance of different product attributes in the purchasing choices of
German households. Electricity mix, electricity cost, the location of electricity
generation, the type of power provider, price guarantee, certification with an eco-
label, (e.g. municipal utility or major national provider) and contract cancellation
period are the selected attributes for choice experiment (see Table 10 in Appendix).
Levels of Electrictiy mix are designed to demonstrate the whole offerings from
brown to pure green energies. Mix 2 represents the default electricity mix in
Germany when the study was carried out, which is dominated by non-renewable
energy sources such as coal and nuclear. Mix 3 demonstrates the nuclear phaseout
substituting it for natural gas. Mix 4 and 5 are the green mixes with different types of
renewable energy sources. Monthly electricity costs varying based on real prices in
Germany. The attribute location of electricity generation aims to measure
consumers’ preferences for domestic, regional or imported electricity. Similarly, the
type of power provider offers from small local to big national companies investigates
the importance of local energy generation. The attribute price guarantee tries to
measure preferences for price stability and attribute cancellation period assesses
55
consumers’ commitment to their providers. The attribute certification presents three
eco-labels for electricity that exist in Germany and a no certification option (Kaenzig
et al., 2013). In Germany the use of different ecol-labels for endorsing products has
become more and more popular in the last decades. Certified green electricity
products are assumed to be an important factor among customers when choosing
energy supplier. Currently, three eco-labels have emerged and become dominant
players in green power market certification; ok power, Grüner Strom Label (GSL)
and TÜV SÜD. Grüner Strom label is restricted to electricity products generated
from renewable sources and it certifies green electricity products. GSL differentiates
two levels; Gold and Silver GSL reflecting different environmental quality levels in
terms of financial support paid by supplier to eligible RES plants. GSL can only be
awarded to those plants, which generate electricity from renewable energy sources
and to those CHP plants that are fed with biomass (fossil fuelled CHP plants are
excluded). Ok power label accepts energy generation from gas-fired CHP plants as
long as the share of electricity does not exceed 50% and fulfills specific emission
limits. TÜV is an expansive umbrella organization and operated by regional
branches. In green power labeling TÜV Süddeutschland and TÜV Nord are active
and award certificates at generation and product levels as well. TÜV label also
allows electricity from fossil fuelled CHP plants (maximum of 50%). Eco-labeling is
expected to increase market transparency for green electricity products whereby
demand for green electricity can be strengthen (Truffer et al., 2001).
3.3. Market segmentation with Choice Based Conjoint analysis
The concept of segmentation, which presupposes heterogeneity in buyer
preferences, is not novel. More than three decades ago two main approaches to
market segmentation were identified (Wind, 1978; Green, 1977). With a priori
segmentation respondents are classified into groups on the basis of demographic or
socioeconomic variables; using post hoc segmentation respondents are clustered
56
according to some interrelated variables (e.g. preferences associated with a product).
With conjoint analysis such a post-hoc segmentation approach to market
segmentation can be followed by capturing market heterogeneity in attribute
preferences across a full set of attributes in order to obtain segments with similar
preferences (Desarbo et al., 1995). By knowing the socio-demographic and
psychographic and behavioral variable of a segment, marketers are better enabled to
define marketing strategies that more closely match consumers’ needs.
3.4. Design of study, dataset and method of data collection
An existing data set of a representative sample of German electricity customers
was used for the present study. The results obtained for the average electricity
customers were reported in Kaenzig et al. (2013). These data are a subsample of a
larger representative consumer survey among 1257 German households that was
carried out in June 2009 through the project seco@home. For quality and
representativity purposes, the market research company GfK was responsible for
implementing the survey that recruited along pre-defined quota the respondents via
telephone and conducted face-to-face interviews using the computer-assisted
personal interview (CAPI) method at the respondents’ homes. The interviews lasted
approximately one hour on average and contained questions about attitudes towards
the environment, questions about the household’ energy use and questions on socio-
demographic, psychographic and behavioral factors. Whereas these general survey
questions were applied to the whole sample, the survey was then split into three
different representative subsamples of approximately 400 respondents. Each sample
was asked to participate in a choice experiment that was dedicated to a specific
theme: heating systems, electricity and household appliances. More precise
information regarding the questionnaire and sampling can be found in Rennings et al.
(2012).
The research at hand makes use of the data of 414 respondents of the sub-sample
that received the choice experiment on electricity products. The data set is based on
57
4968 choice observations, based on 12 choices completed by each of the 414
respondents. The survey design, the data collection process and the sample are
described in detail in Kaenzig et al (2013). The choice experiment was set up in
such a way where respondents received a series of 12 choice tasks involving
comparisons of different electricity products with varying levels of attributes. By
making use of a full-profile design, each choice task presented three different
electricity products defined by seven attributes (see Appendix) where respondents
had to choose their preferred alternative. The choice tasks that were randomly
generated for each respondent were the inputs to a hierarchical Bayesian analysis,
which allowed the estimation of part-worth utilities at the individual level. Kaenzig
et al. (2013) show that the energy source and monthly electricity costs are the two
most important attributes in the average electricity consumer’s decision-making. In
addition, the authors reveal an implicit average willingness to pay a premium of
about 16% for electricity from renewable sources. Kaenzig et al. analyzed the dataset
for the entire sample and they mainly reported on one model of preferences that was
built for all respondents. The focus of the present study is to go a step further in the
analysis of the same data set by identifying, via a latent class approach, the
preferences and characteristics of different market segments for potential green
electricity consumers. The present study contributes to previous research by
generating a richer understanding of possible buyer segments that are likely to be
influenced by green attributes of electricity products.
3.5. Selection of variables for profiling segments
In order to explore the characteristics of different consumer segments in the green
electricity market, different socio-demographic, psychographic and behavioral
variables were selected (Table 5).
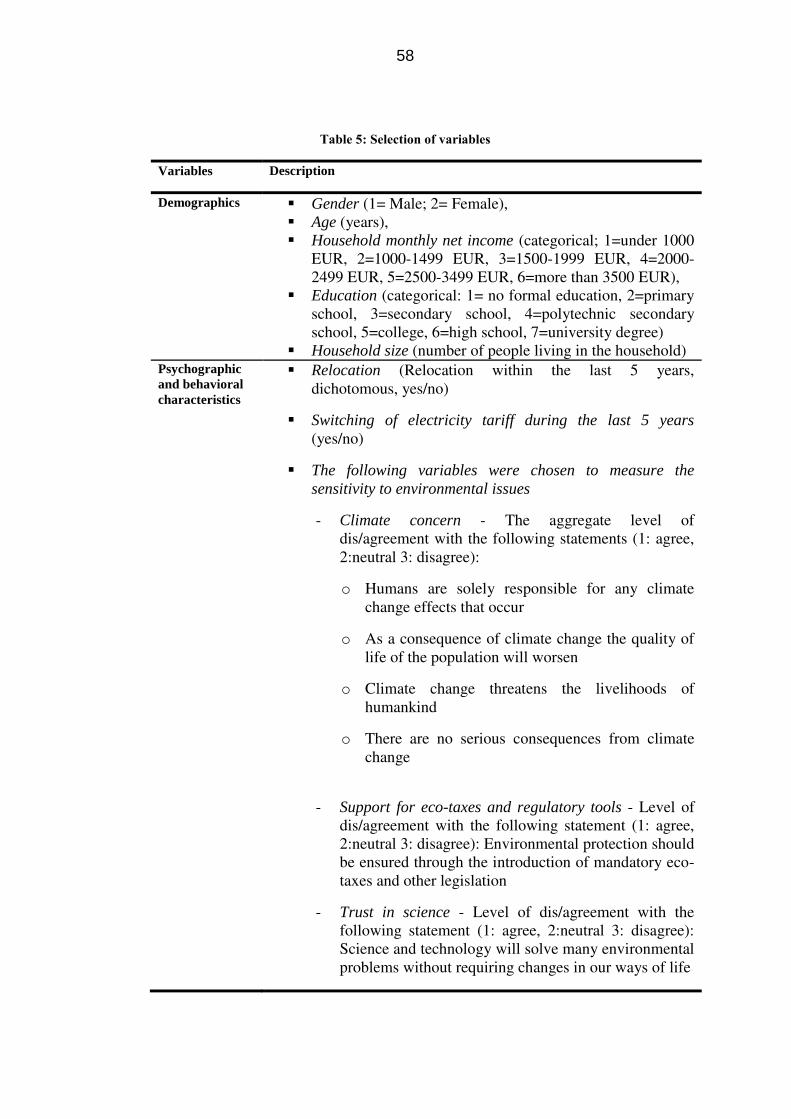
58
Table 5: Selection of variables
Variables Description
Demographics Gender (1= Male; 2= Female), Age (years), Household monthly net income (categorical; 1=under 1000
EUR, 2=1000-1499 EUR, 3=1500-1999 EUR, 4=2000-2499 EUR, 5=2500-3499 EUR, 6=more than 3500 EUR),
Education (categorical: 1= no formal education, 2=primary school, 3=secondary school, 4=polytechnic secondary school, 5=college, 6=high school, 7=university degree)
Household size (number of people living in the household) Psychographic
and behavioral
characteristics
Relocation (Relocation within the last 5 years, dichotomous, yes/no)
Switching of electricity tariff during the last 5 years
(yes/no)
The following variables were chosen to measure the
sensitivity to environmental issues
- Climate concern - The aggregate level of dis/agreement with the following statements (1: agree, 2:neutral 3: disagree):
o Humans are solely responsible for any climate change effects that occur
o As a consequence of climate change the quality of life of the population will worsen
o Climate change threatens the livelihoods of humankind
o There are no serious consequences from climate change
- Support for eco-taxes and regulatory tools - Level of
dis/agreement with the following statement (1: agree, 2:neutral 3: disagree): Environmental protection should be ensured through the introduction of mandatory eco-taxes and other legislation
- Trust in science - Level of dis/agreement with the following statement (1: agree, 2:neutral 3: disagree): Science and technology will solve many environmental problems without requiring changes in our ways of life
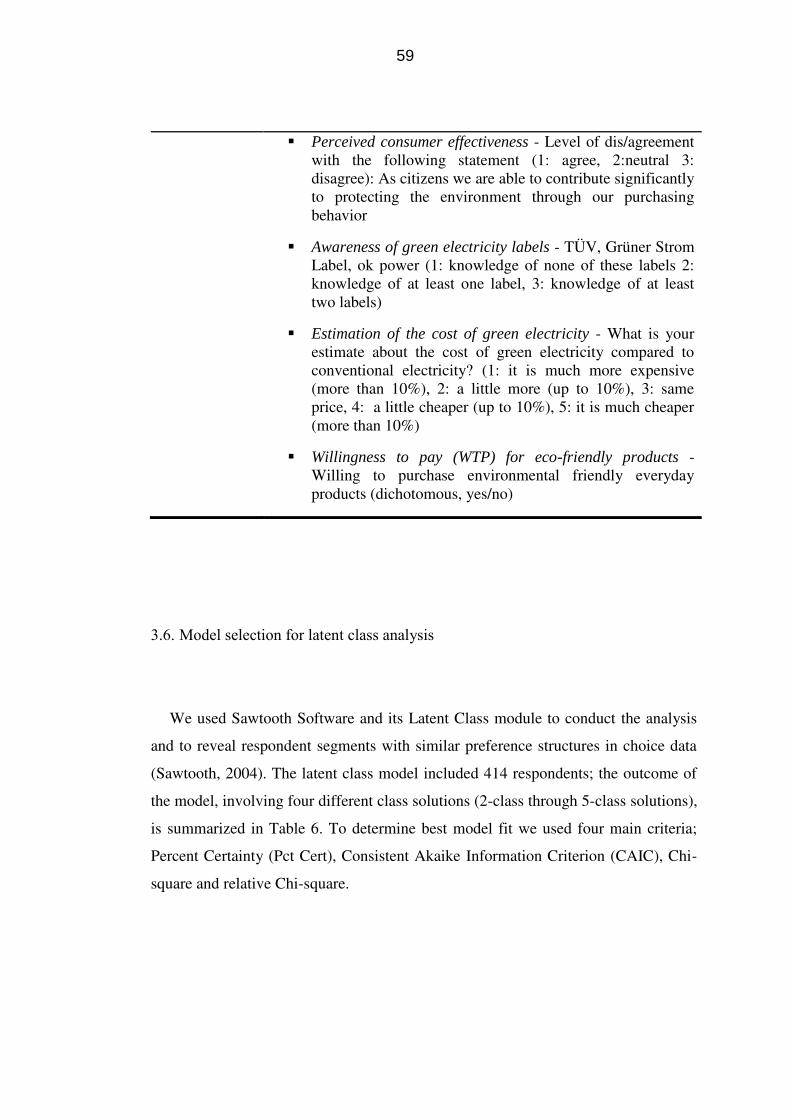
59
Perceived consumer effectiveness - Level of dis/agreement with the following statement (1: agree, 2:neutral 3: disagree): As citizens we are able to contribute significantly to protecting the environment through our purchasing behavior
Awareness of green electricity labels - TÜV, Grüner Strom Label, ok power (1: knowledge of none of these labels 2: knowledge of at least one label, 3: knowledge of at least two labels)
Estimation of the cost of green electricity - What is your estimate about the cost of green electricity compared to conventional electricity? (1: it is much more expensive (more than 10%), 2: a little more (up to 10%), 3: same price, 4: a little cheaper (up to 10%), 5: it is much cheaper (more than 10%)
Willingness to pay (WTP) for eco-friendly products - Willing to purchase environmental friendly everyday products (dichotomous, yes/no)
3.6. Model selection for latent class analysis
We used Sawtooth Software and its Latent Class module to conduct the analysis
and to reveal respondent segments with similar preference structures in choice data
(Sawtooth, 2004). The latent class model included 414 respondents; the outcome of
the model, involving four different class solutions (2-class through 5-class solutions),
is summarized in Table 6. To determine best model fit we used four main criteria;
Percent Certainty (Pct Cert), Consistent Akaike Information Criterion (CAIC), Chi-
square and relative Chi-square.

60
Table 6: Summary of best replications
Pct Cert is used to reveal how much better an identified solution is compared to
the null solution. The process identifies the difference between the final log
likelihood and the null log likelihood divided by the negative of the null log
likelihood where CAIC is the broadly prevalent variable used for determining the
number of groups. The smaller the value of CAIC, the better the solution. Chi-square
was obtained by doubling the log likelihood for the solution and subtracting twice
the log likelihood for the null solution. Best practice indicates that it is better to use
relative Chi Sq (i.e., Chi Sq divided by the number of parameters estimated) to
decide best fit because this allows for greater comparability (the higher the value, the
better the fit [Sawtooth, 2004]). In this case CAIC was smallest for the three-group
solution. However, it was also considered significant that CAIC decreased until the
three group solution, remained nearly as low for the four-group solution and
increased again in the case of the five-group solution.
The model thus finally chosen was the 4-class model with a Pct Cert of 38.67, a
CAIC of 7598.59, Chi-square of 4220.75 and relative Chi-square of 44.43.
4. Results
In this section detailed results from the hierarchical Bayes (HB) estimation for the
different segments identified via the latent class segmentation analysis are presented
first. A presentation of the socio-demographic, psychographic and behavioral
variables of the resulting segments then follows. Finally, the characteristics of
Groups Pct Cert CAIC Chi Sq Rel Chi Sq
2 34.18 7631.54 3731.28 79.39 3 37.38 7510.46 4080.62 57.47 4 38.67 7598.59 4220.75 44.43
5 39.63 7722.02 4325.57 36.35

61
Potential Adopters that were significantly different from those of consumers that had
already adopted green electricity are described.
4.1. Preferences for different product attributes
As described above, latent class analysis was conducted prior to using hierarchical
Bayes estimation to identify segments. The resulting segment membership
information was used to calculate the part-worth utilities and importance scores for
the different segments using the underlying hierarchical Bayes utility runs. HB
estimation is able to estimate part-worth utilities at the individual level (part-worth
utilities describe how much one attribute level contributes to the overall utility of a
product [Orme, 2010]).
Table 7 shows the part-worth utilities and the corresponding standard deviations
of five different market segments. As described above, four main profiles were
identified in the latent class analysis. A group of respondents (n=29) that had already
subscribed to a green power tariff were excluded from the sample and thereafter
given the name Adopters.
Part-worth utilities were re-scaled and expressed as zero-centered diffs for better
comparability between groups. Positive values represent an increase in utility relative
to the average level of that particular attribute, while negative values represent
decreasing utility. Generally, utility values are dependent on the selected range of
attribute levels and should thus primarily be used to compare the part-worth utilities
of different levels of a given attribute.
Three out of the four main profiles identified can be described as Potential
Adopters based on their clear preference for electricity products derived from a
renewable energy source. The remaining segment is the Likely non-adopters segment
that is fairly price-sensitive and places significant emphasis on the costs of the
monthly electricity product in the decision-making. Members of this group are thus
the least likely to choose to buy green electricity at the moment. However, the
current segmentation of those consumers with high price sensitivity into Likely non-
62
adopters might not be valid anymore if green electricity sources are able to generate
electricity at a cost that would be less or equal to conventional energy sources.
For the next step of the analysis we then used the individual part-worth utilities
from the HB analysis and computed attribute importance scores for each segment
(see Table 8). Importances describe how much influence each attribute has on the
purchase decision. The importance of attributes can be measured by comparing the
difference between the highest and the lowest part-worth utility of its levels (Orme,
2010). Importance scores are standardized to sum to 100% across all attributes
(Orme, 2010). Since this step is a normalization procedure that attempts to control
for scale, the procedure allows for a comparison of the importance scores across
segments.

63
Table 7: Hierarchical Bayes model estimation of mean utility values for five segments
Adopters
Potential Adopters
Likely Non-adopters
Truly Greens Price Sensitive
Greens Local patriots
Segment size 29 117 78 108 82 Re-scaled part-worth utilities by clusters
Electricity mixa
Mix 1 (60%C, 25%N, 15%U) -179.0 (51.7)b -179.8 (38.4) -135.4 (35.2) -25.9 (67.3) -26.7 (45.7) Mix 2 (60%C, 25%N, 5%H, 5%W, 5%B)
-105.69 (44.3) -114.7 (26.4) -67.6 (29.9) -3.5 (47.1) -8.7 (33.7)
Mix 3 (60%C, 25%G, 5%H, 5%W, 5%B)
-4.08 (35.2) -7.3 (34.3) 31.4 (36.9) 16.4 (45.6) 8.3 (30.6)
Mix 4 (50%W, 30%H, 15%B, 5%S) 147.79 (54.8) 141.0 (37.9) 87.0 (36.0) 10.6 (54.5) 10.5 (38.3) Mix 5 (100%W) 140.99 (70.8) 160.8 (42.9) 84.7 (33.8) 2.5 (67.9) 16.8 (49.0) Power provider Big, national provider -6.56 (10.3) -7.2 (10.8) -7.0 (12.3) -1.2 (19.7) -2.8 (12.6) Medium-sized, regional provider 3.16 (15.6) 4.0 (15.1) -0.2 (14.6) 2.4 (25.1) 0.4 (15.2) Municipal 5.27 (13.6) 4.7 (14.7) 7.8 (20.1) 3.4 (25.6) 0.7 (17.3) Specialized provider -1.87 (15.1) -1.5 (15.6) -0.6 (15.6) -4.6 (23.4) 1.6 (17.1) Location of electricity generation Local region 16.05 (17.5) 21.0 (21.8) 21.0 (22.9) 54.3 (38.3) 16.9 (18.2) Germany 19.98 (16.7) 18.7 (19.9) 21.8 (23.2) 53.4 (40.8) 14.8 (19.7) Switzerland -3.76 (17.3) -5.0 (20.6) -10.4 (24.0) -37.9 (42.0) -11.8 (20.8) Eastern Europe -32.28 (26.5) -34.7 (28.2) -32.5 (30.2) -69.8 (44.5) -19.9 (24.9) Monthly electricity costs Costs -7.98 (5.6) -6.7 (3.2) -11.1 (2.7) -7.9 (4.1) -18.83 (3.9)
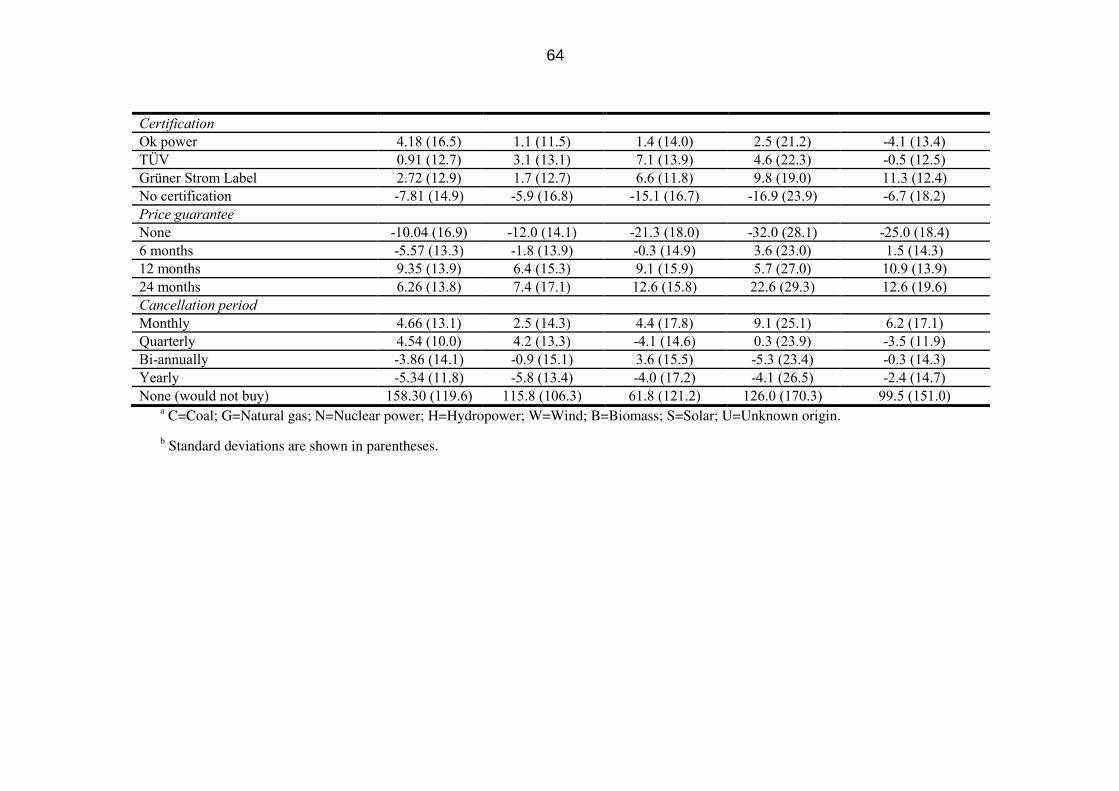
64
Certification Ok power 4.18 (16.5) 1.1 (11.5) 1.4 (14.0) 2.5 (21.2) -4.1 (13.4) TÜV 0.91 (12.7) 3.1 (13.1) 7.1 (13.9) 4.6 (22.3) -0.5 (12.5) Grüner Strom Label 2.72 (12.9) 1.7 (12.7) 6.6 (11.8) 9.8 (19.0) 11.3 (12.4) No certification -7.81 (14.9) -5.9 (16.8) -15.1 (16.7) -16.9 (23.9) -6.7 (18.2) Price guarantee None -10.04 (16.9) -12.0 (14.1) -21.3 (18.0) -32.0 (28.1) -25.0 (18.4) 6 months -5.57 (13.3) -1.8 (13.9) -0.3 (14.9) 3.6 (23.0) 1.5 (14.3) 12 months 9.35 (13.9) 6.4 (15.3) 9.1 (15.9) 5.7 (27.0) 10.9 (13.9) 24 months 6.26 (13.8) 7.4 (17.1) 12.6 (15.8) 22.6 (29.3) 12.6 (19.6) Cancellation period Monthly 4.66 (13.1) 2.5 (14.3) 4.4 (17.8) 9.1 (25.1) 6.2 (17.1) Quarterly 4.54 (10.0) 4.2 (13.3) -4.1 (14.6) 0.3 (23.9) -3.5 (11.9) Bi-annually -3.86 (14.1) -0.9 (15.1) 3.6 (15.5) -5.3 (23.4) -0.3 (14.3) Yearly -5.34 (11.8) -5.8 (13.4) -4.0 (17.2) -4.1 (26.5) -2.4 (14.7) None (would not buy) 158.30 (119.6) 115.8 (106.3) 61.8 (121.2) 126.0 (170.3) 99.5 (151.0)
a C=Coal; G=Natural gas; N=Nuclear power; H=Hydropower; W=Wind; B=Biomass; S=Solar; U=Unknown origin.
b Standard deviations are shown in parentheses.
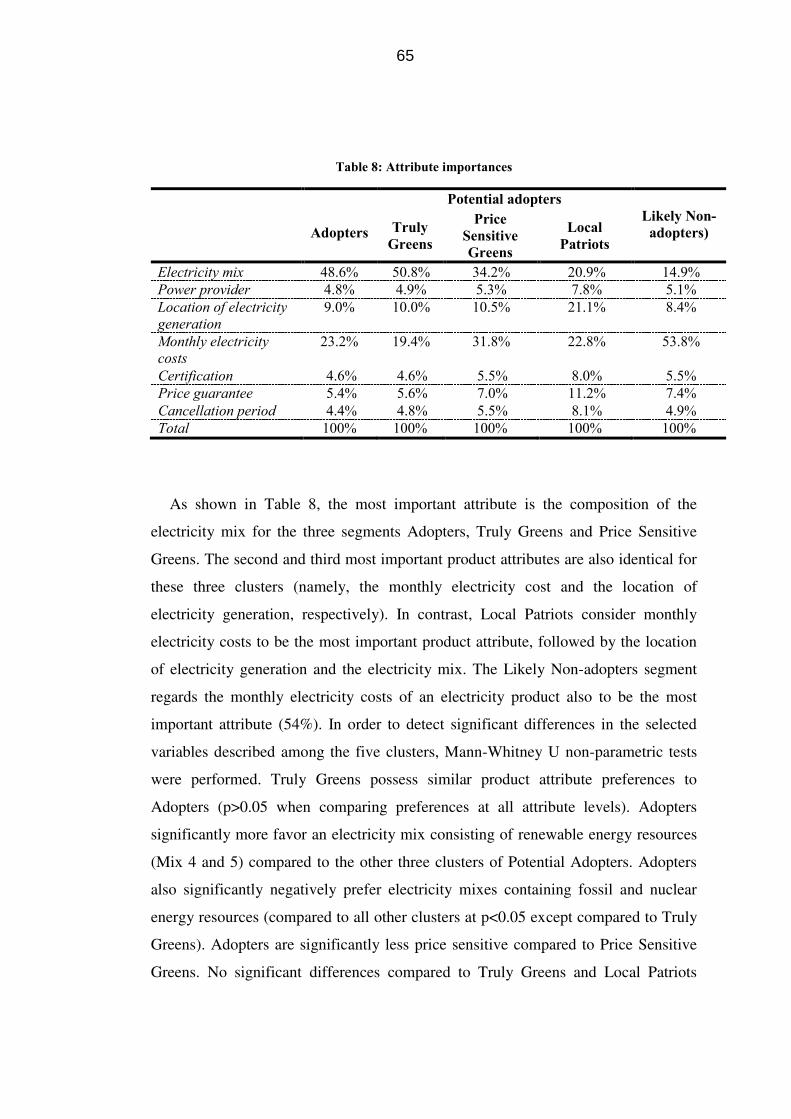
65
Table 8: Attribute importances
Adopters
Potential adopters
Likely Non-
adopters)
Truly
Greens
Price
Sensitive
Greens
Local
Patriots
Electricity mix 48.6% 50.8% 34.2% 20.9% 14.9% Power provider 4.8% 4.9% 5.3% 7.8% 5.1% Location of electricity generation
9.0% 10.0% 10.5% 21.1% 8.4%
Monthly electricity costs
23.2% 19.4% 31.8% 22.8% 53.8%
Certification 4.6% 4.6% 5.5% 8.0% 5.5% Price guarantee 5.4% 5.6% 7.0% 11.2% 7.4% Cancellation period 4.4% 4.8% 5.5% 8.1% 4.9% Total 100% 100% 100% 100% 100%
As shown in Table 8, the most important attribute is the composition of the
electricity mix for the three segments Adopters, Truly Greens and Price Sensitive
Greens. The second and third most important product attributes are also identical for
these three clusters (namely, the monthly electricity cost and the location of
electricity generation, respectively). In contrast, Local Patriots consider monthly
electricity costs to be the most important product attribute, followed by the location
of electricity generation and the electricity mix. The Likely Non-adopters segment
regards the monthly electricity costs of an electricity product also to be the most
important attribute (54%). In order to detect significant differences in the selected
variables described among the five clusters, Mann-Whitney U non-parametric tests
were performed. Truly Greens possess similar product attribute preferences to
Adopters (p>0.05 when comparing preferences at all attribute levels). Adopters
significantly more favor an electricity mix consisting of renewable energy resources
(Mix 4 and 5) compared to the other three clusters of Potential Adopters. Adopters
also significantly negatively prefer electricity mixes containing fossil and nuclear
energy resources (compared to all other clusters at p<0.05 except compared to Truly
Greens). Adopters are significantly less price sensitive compared to Price Sensitive
Greens. No significant differences compared to Truly Greens and Local Patriots
66
could be found in this respect. When comparing the differences in preferences
between the three segments of Potential Adopters, we can reveal that Price Sensitive
Greens attach less importance to the electricity mix and more importance to monthly
electricity costs compared to Local Patriots. Local Patriots show the strongest
preferences for local electricity generation (within their region or within Germany)
compared to all other clusters (p<0.001 all cases). Interestingly, the attribute
certification was valued the most by Local Patriots in comparison to the other
identified segments although it was not statistically significant. Likely non-adopters
can be distinguished from other clusters by their low interest in green electricity and
their high sensitivity to monthly electricity costs.
4.2. Market segments analyzed by socio-demographic, psychographic and behavioral characteristics
The following step is to analyze whether differences exist between Subscribers4 of
green electricity tariffs and the different segments of Potential Adopters in terms of
the characteristics analyzed. Mean values are summarized in Table 9 (in Table 23 in
Appendices details the p-levels of selected pairwise comparisons).
Socio-demographic characteristics such as gender, age, household net income and
household size were similarly distributed across the five identified clusters with the
exception of the level of education. Results show that Adopters were on average
better educated, a finding, which correspond to existing research, with one third of
the respondents of this group holding a university degree. In contrast, the share of
respondents with a university degree from the other four clusters ranged between 7
and 12 percent. Interestingly, the Truly Green segment had on average the least
formal education of all the clusters (almost 80% of these respondents had only
completed secondary education) yet enjoyed the highest average household net
4 Adopters and Subscribers are used interchangeably.
67
income of all the clusters (however, it was not significantly different compared to
Adopters). Worth mentioning here is the fact that, while in all clusters income
followed a more or less normal distribution, 30% of Adopters could be placed in the
highest and 40% in the first and second lowest income categories. This finding
should be further explored in future research in order to generate a better
understanding of the Subscribers. However, the average income of the Truly Greens
segment significantly differed from the average of the Local Patriots and the Likely
Non-adopters. Results are therefore in line with those of many other authors
(Rowlands et al., 2003; Zarnikau, 2003; Gossling et al., 2005; Wiser, 2007; Ek and
Soderholm, 2008; Diaz-Rainey and Ashton, 2011) and reinforce the evidence that
preferences for green electricity significantly differ across income groups. 66% of
Adopters live alone (i.e. have a smaller household size on average compared to
respondents from other clusters) but no statistically significant difference could be
found compared to other Potential Adopters. However, the relatively smaller
household size might explain the smaller household net income of this group.
With regard to psychographic and behavioral characteristics, segments with a high
preference for electricity mixes sourced from renewable energy could be
characterized by their higher degree of concern for climate change related issues.
Decreases in climate concern are correlated to a decrease in the preference for green
electricity. However, no significant difference could be found between Adopters and
Truly Greens. Significant differences were, on the other hand, found with variables
that measure the sensitivity to environmental issues. More precisely, Potential
Adopters agree to a higher extent that science and technology will solve many
environmental problems without requiring changes in our ways of life than Adopters
do. In addition, supporting eco-taxes is also significantly higher with Adopters than it
is with Local Patriots whereas no significant difference could be found in contrast to
Truly Greens and Price Sensitive Greens.
In line with previous research that found that perceived consumer effectiveness
plays a major role in forming pro-environmental behavior, a significant difference
was identified between Potential Adopters and Adopters with regard to the
investigated statement.
68
The perceived price level of green electricity (in contrast to conventional
electricity products) differed significantly between Adopters and all other clusters.
Only about 10% of Adopters but 25% of the Truly Greens and 43% of the Likely
Non-adopters believed that the cost of green electricity would be 10% or more than
conventional electricity products. Whereas at the beginning of the process of the
liberalization of the electricity market in Germany, green electricity was typically
sold at a significantly higher price than electricity produced from conventional
energy sources, the price difference has significantly decreased over the last decade.
At the time this research was conducted, green tariffs in Germany showed high
variability in cost depending on the provider, with some offering cheaper green
electricity than conventional electricity. Results are therefore in line with previous
research, which showed that erroneous perceptions about the price difference
between grey and green power decrease the probability of the adoption of green
electricity (Arkesteijn and Oerlemans, 2005). Consumers who have not yet opted for
green electricity may still be implicitly assuming that electricity generated from
renewable energy sources is significantly more costly, even though reality tells a
different story.
In addition, a weak (but significant at 10% significance level) difference between
Adopters and Truly Greens with regard to the share of respondents who had moved
house within the last five years was found. A more pronounced difference
(significant at 5% significance level) was found when comparing Adopters to Local
Patriots.
Awareness of green electricity labels also differed significantly between Adopters
and two segments of Potential Adopters, the Price Sensitive Greens and the Local
Patriots. No significant differences could however be found between Adopters and
Truly Greens. Finally, the general willingness-to-pay for eco-friendly products also
differed significantly between Adopters and the three segments of Potential
Adopters.

69
Table 9: Descriptive statistics by segment
Adopters
Potential Adopters Likely
Non-
adopters
Truly
Greens
Price
Sensitive
Greens
Local
Patriots
Socio-demographics
Gender (Females, %) 41.40% 51.30% 52.60% 45.40% 42.70% Age (years) 47.4 (14.1) 49.1 (12.1) 49.95 (14.5) 51.29 (14.8) 50.93 (12.9) Level of education 4.5 (2.1) 3.2 (1.5) 3.6 (1.8) 3.5 (1.7) 3.3 (1.6)
Level of income 3.5 (1.9) 3.8 (1.5) 3.5 (1.5) 3.2 (1.6) 2.9(1.4)
Household size 1.86 (0.9) 2.08 (1.1) 2.05 (1.2) 2.18 (1.2) 2.04 (1.1)
Psychographic and behavioral
characteristics
Relocation (yes, %) 45% 27% 33% 25% 25%
Switch of electricity contract (yes, %)
69% 12% 17% 20% 16%
Level of climate concern (high, %)
93% 89% 84% 75% 64%
Perceived consumer effectiveness (agreed, %)
90% 66% 69% 59% 46%
Trust in science (disagreed, %)
72% 45% 35% 35% 40%
Support for eco-taxes (agreed, %)
72% 54% 60% 46% 38%
Awareness of green electricity labels (2 or more, %)
21% 14% 12% 9% 5%
Estimated price premium for green electricity
2.3 1.9 1.9 1.9 1.7
Willingness-to-pay for eco-friendly products (yes, %)
79% 53% 42% 37% 21%
70
5. Conclusions
Many customers exhibit positive attitudes towards renewable electricity mixes but
only a small percentage of them have already opted for green electricity tariffs. The
research described in this study was designed to reveal what characteristics distinguish
subscribers of green electricity tariffs from potential green electricity adopters in order
to provide marketers and policy makers with important information, which might
encourage potential adopters to walk the talk. Based on the 4968 experimental choices
of a representative sample of 414 German consumers, different consumer segments
were identified based on their preferences for different electricity product attributes.
Results suggest that the majority of respondents (80%) clearly have a preference for
electricity mixes derived from renewable energy sources but only 7% of the sample had
already translated their preferences into the purchase of green electricity. The main goal
of the research was, correspondingly, to highlight how Adopters differ from those who
show interest in renewables but have not subscribed to a green electricity product yet
(i.e. Potential Adopters).
Demographic variables were found to play a marginal role in explaining the
difference between Adopters and Potential Adopters, which corresponds to findings that
emerged from former research (Kotchen and Moore, 2007). With regard to the
hypotheses regarding socio-demographic characteristics, the subhypotheses concerning
the higher income (H1a) and smaller households (H1c) of Adopters cannot be
confirmed by the analysis. On the other hand, results of this study show that Adopters
can be characterized by a significantly higher average level of education (i.e. H1b can
be confirmed). We can also highlight that gender and age show an equal distribution
across the sample.
Results suggest that psychographic and behavioral factors have great explanatory
power when it comes to understanding why consumers who evince strong preferences
towards electricity produced from renewable energy sources do not act according to
their preferences by opting to purchase green power. As for the subhypothesis on the
perceived price differential between electricity tariffs, Adopters estimate that the price
difference between green and standard electricity tariffs is lower than Potential
Adopters (H2b). The subhypothesis regarding Adopters’ higher sensitivity to
71
environmental issues is only partly underpinned by the findings since these
characteristics are proven to be similar when compared to Truly Greens, but
significantly different when compared to the other segments (H2a). Similarly, Adopters
show higher awareness of green electricity labels than other segments except for Truly
Greens. Adopters also change their place of residence significantly more often than two
segments of Potential Adopters and have recently switched more often their electricity
tariffs. Adopters can be further characterized by their higher level of perceived
consumer effectiveness compared to all other segments of Potential adopters. Regarding
price-related variables, Adopters, in contrast to the other segments of Potential adopters,
tend to be willing to pay significantly more for eco-friendly products.
For marketers, these findings indicate a major opportunity. Although the number of
Adopters of green electricity might still be low, reported customer preferences suggest
significant potential for the number of adopters to rise. We can underline the role of a
multitude of factors which can be exploited in order to convince consumers to seal the
green power deal. Education seems to play an utmost influential role in the purchasing
decision and may also make a strong contribution to higher perceived consumer
effectiveness. This highlights the necessity of communicating better about the actual
impacts of opting for green power. Previous research shows that increasing perceived
impact through providing information about social and private benefits can successfully
modify purchasing behavior (Litvine and Wüstenhagen, 2011). Findings also draw
attention to the existence of inaccurate perceptions about green electricity prices.
Respondents were asked about the likely price premium between conventional and
green tariffs. The majority of Potential adopters estimated a premium of more than 10%,
even though the green tariffs at the time of conducting the survey did not always exceed
prices for conventionally-derived energy on the German market. This indicates that
more accurate marketing communication about the actual price could pay off in terms of
increasing the uptake of green energy tariffs. Another interesting result for marketers is
the strong preference of Potential adopters for domestically-produced electricity. This
establishes the potential for the implementation of national or regionalized energy
policies, such as for instance setting of standards that require the declaration of origin of
the electricity source, even though trade-offs with the internal EU electricity market
need to be considered. The Local Patriots segment identified in the research places
almost the same emphasis on the location of power generation as on the cost of the

72
electricity. Accordingly, advertising the regional origins of electricity might be
particularly fruitful for this segment. The two segments Price Sensitive Greens and
Truly Greens do not differ with regards to most investigated variables, so they could be
targeted with similar messages, however, the Price Sensitive Greens are much more
sensitive to an increase in electricity costs. Power marketers could respond to these
findings by targeting this segment with lower prices and a slightly lower share of green
electricity in the mix.
For policy makers, we can highlight that raising the level of the perceived consumer
effectiveness and the feeling of being responsible for climate change can constitute the
core of environmental policies. For instance, the segment of Truly greens might be
targeted with awareness raising campaigns which draw attention to the importance of
individual actions on safeguarding the environment or the responsibility of humans on
climate change. Findings show low awareness of eco-labels among electricity
consumers that could be an issue for policy makers to elaborate on and help disseminate
information on the different certifications existing in the market.
6. Limitations
A standard limitation for any stated preference method is that there might be a gap
between stated and revealed preferences. In stated preference methods such as
contingent valuation method and discrete choice experiment, the difference of
hypothetical and actual statements of value is often wide and this phenomenon is known
as hypothetical bias. In other words, that people tend to overstate their economic
valuation especially in estimating the value of non-market goods and services. Stated
preference methods are often the only technique available for estimating the value of
ecosystem services or goods. Since these goods and services are hypothetical in
provision, hypothetical bias may often occur e.g. when individuals express how much
they would pay for them in a hypothetical market (Murphy et al., 2005). Schläpfer and
Fischhoff (2012) found that hypothetical bias can be overcome and the results of stated
preferences can be consistent with revealed preferences if the goods and the context are
familiar for respondents. This bias can also limited by using indirect questioning
73
techniques for preferences such as discrete choice experiment and designing the survey
as close as possible to real purchase situations.
With regard to preferences for product attributes, there is inconsistency detected in
people's choices that can be derived from the format of information. Evidences found that
people choose what is offered to them as the default. In other words, people’s preferences
depend mostly on the context of the choice and way it is presented (Pichert and
Katsikopoulos, 2008; Chassot et al., 2013).
Finally, it can also be noted that to the fact that this work does not consider that a
certain action (e. g. green electricity adoption) could potentially influence other
behaviours in different contexts. For instance, participating in green electricity
programs could have a knock-on or spill-over effect on other pro-environmental
behaviour and lead to a generally wider behaviour or attitude change. In a similar vein,
the first study did not consider the link between adopters’ a priori and posteriori
psychographic and behavioral characteristics e.g. adoption itself may have a
transformative effect. It would be worth investigating this phenomenon in a longitudinal
study, where the attitude change during the process could be analyzed over time.
Acknowledgements
This study is based on research funded by the German Ministry of Education and
Research within the Socio-Ecological Research (SÖF) project Social, environmental
and economic dimensions of sustainable energy consumption in residential buildings
(seco@home), Contract no. 01UV0710, coordinated by Dr. Klaus Rennings at the
Center for European Economic Research (ZEW), Mannheim. This work is also related
to the Sciex Programme (Project code: 12.163) and the Swiss Competence Centers for
Energy Research – Competence Center for Research in Energy, Society and Transition
(SCCER-CREST). This study was also supported by the TÁMOP 4.2.2/B-10/1-2010-
0023 project.

74
Appendix
Table 10: Choice experiment design: attributes and levels (Kaenzig et al., 2013)
Attribute Attribute levels
Electricity mix Mix 1 (‘Brown power’)
60% coal, 25% nuclear, 15% origin unknown
Mix 2 (‘Default’)
60% coal, 25% nuclear, 5% water, 5% wind, 5% biomass
Mix 3 (‘No nuclear’)
60% coal, 25% gas, 5% water, 5% wind, 5% biomass
Mix 4 (‘Green power mix’)
50% wind, 30% water, 15% biomass, 5% solar
Mix 5 (‘Pure wind’)
100% wind
Power provider Major national provider Medium-sized regional provider Municipal utility Independent power marketer
Location of electricity generation
Local region In Germany In Switzerland In Eastern Europe
Monthly electricity cost 50 Euros 55 Euros 60 Euros 65 Euros 70 Euros
Certification (Eco-Label) ok power TÜV Grüner Strom Label - No certification
Price guarantee None 6 months 12 months 24 months
Cancellation period Monthly Quarterly Bi-annually Yearly
Labels for electricity mixes (‘brown power’, ‘no nuclear’, etc.) are used for illustrative purposes here only and this nomenclature was not included in the original survey instrument. Instead, respondents were provided with the detailed percentages of ingredients indicated in the right-hand side column of the table
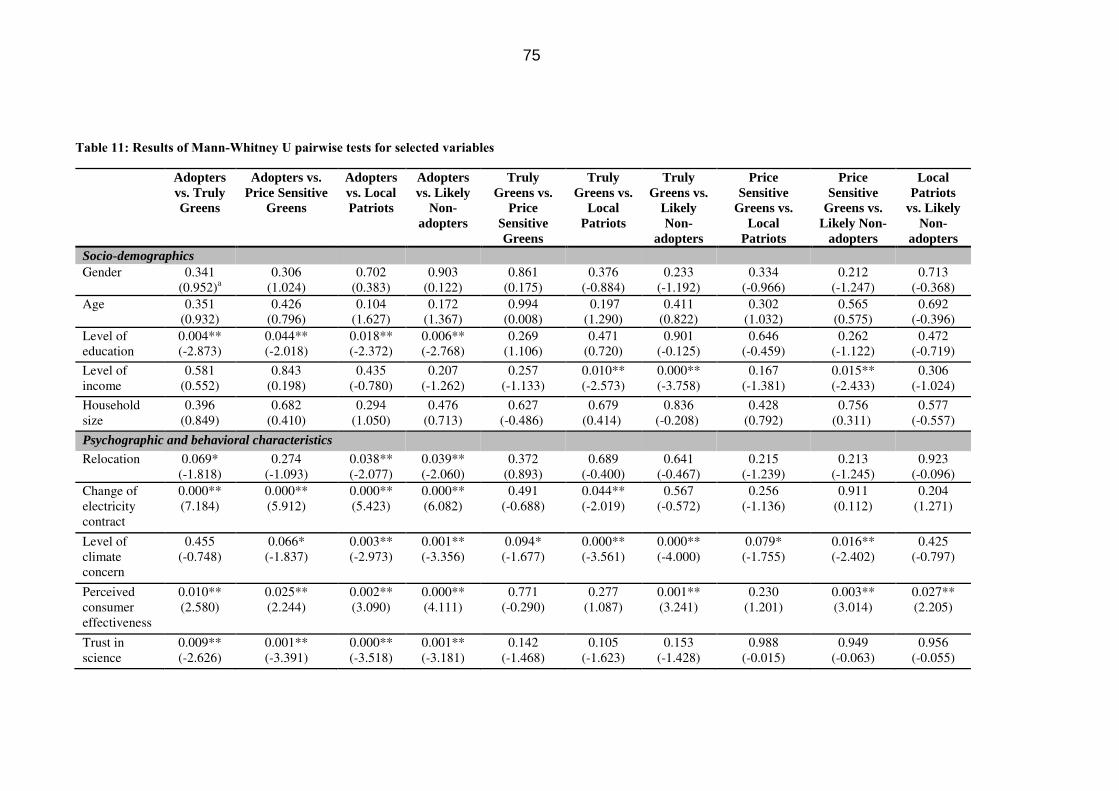
75
Table 11: Results of Mann-Whitney U pairwise tests for selected variables
Adopters
vs. Truly
Greens
Adopters vs.
Price Sensitive
Greens
Adopters
vs. Local
Patriots
Adopters
vs. Likely
Non-
adopters
Truly
Greens vs.
Price
Sensitive
Greens
Truly
Greens vs.
Local
Patriots
Truly
Greens vs.
Likely
Non-
adopters
Price
Sensitive
Greens vs.
Local
Patriots
Price
Sensitive
Greens vs.
Likely Non-
adopters
Local
Patriots
vs. Likely
Non-
adopters
Socio-demographics Gender 0.341
(0.952)a 0.306
(1.024) 0.702
(0.383) 0.903
(0.122) 0.861
(0.175) 0.376
(-0.884) 0.233
(-1.192) 0.334
(-0.966) 0.212
(-1.247) 0.713
(-0.368) Age 0.351
(0.932) 0.426
(0.796) 0.104
(1.627) 0.172
(1.367) 0.994
(0.008) 0.197 (1.290)
0.411 (0.822)
0.302 (1.032)
0.565 (0.575)
0.692 (-0.396)
Level of education
0.004** (-2.873)
0.044** (-2.018)
0.018** (-2.372)
0.006** (-2.768)
0.269 (1.106)
0.471 (0.720)
0.901 (-0.125)
0.646 (-0.459)
0.262 (-1.122)
0.472 (-0.719)
Level of income
0.581 (0.552)
0.843 (0.198)
0.435 (-0.780)
0.207 (-1.262)
0.257 (-1.133)
0.010** (-2.573)
0.000** (-3.758)
0.167 (-1.381)
0.015** (-2.433)
0.306 (-1.024)
Household size
0.396 (0.849)
0.682 (0.410)
0.294 (1.050)
0.476 (0.713)
0.627 (-0.486)
0.679 (0.414)
0.836 (-0.208)
0.428 (0.792)
0.756 (0.311)
0.577 (-0.557)
Psychographic and behavioral characteristics
Relocation 0.069* (-1.818)
0.274 (-1.093)
0.038** (-2.077)
0.039** (-2.060)
0.372 (0.893)
0.689 (-0.400)
0.641 (-0.467)
0.215 (-1.239)
0.213 (-1.245)
0.923 (-0.096)
Change of electricity contract
0.000** (7.184)
0.000** (5.912)
0.000** (5.423)
0.000** (6.082)
0.491 (-0.688)
0.044** (-2.019)
0.567 (-0.572)
0.256 (-1.136)
0.911 (0.112)
0.204 (1.271)
Level of climate concern
0.455 (-0.748)
0.066* (-1.837)
0.003** (-2.973)
0.001** (-3.356)
0.094* (-1.677)
0.000** (-3.561)
0.000** (-4.000)
0.079* (-1.755)
0.016** (-2.402)
0.425 (-0.797)
Perceived consumer effectiveness
0.010** (2.580)
0.025** (2.244)
0.002** (3.090)
0.000** (4.111)
0.771 (-0.290)
0.277 (1.087)
0.001** (3.241)
0.230 (1.201)
0.003** (3.014)
0.027** (2.205)
Trust in science
0.009** (-2.626)
0.001** (-3.391)
0.000** (-3.518)
0.001** (-3.181)
0.142 (-1.468)
0.105 (-1.623)
0.153 (-1.428)
0.988 (-0.015)
0.949 (-0.063)
0.956 (-0.055)
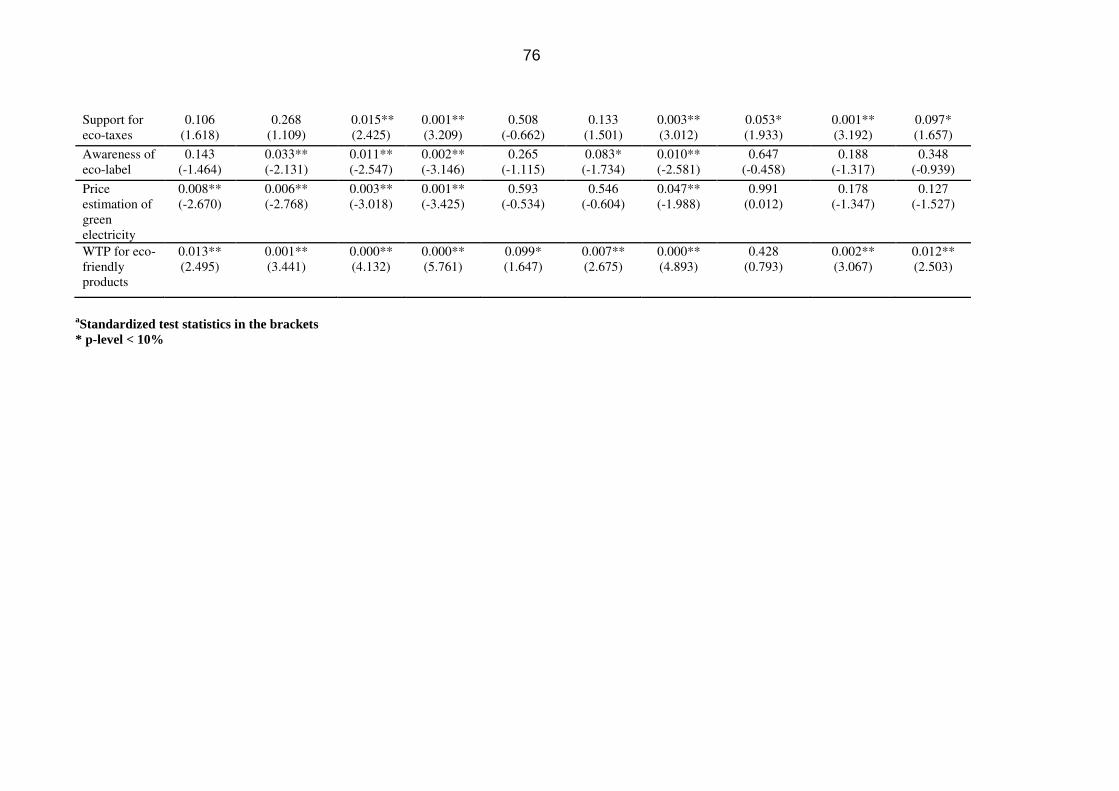
76
Support for eco-taxes
0.106 (1.618)
0.268 (1.109)
0.015** (2.425)
0.001** (3.209)
0.508 (-0.662)
0.133 (1.501)
0.003** (3.012)
0.053* (1.933)
0.001** (3.192)
0.097* (1.657)
Awareness of eco-label
0.143 (-1.464)
0.033** (-2.131)
0.011** (-2.547)
0.002** (-3.146)
0.265 (-1.115)
0.083* (-1.734)
0.010** (-2.581)
0.647 (-0.458)
0.188 (-1.317)
0.348 (-0.939)
Price estimation of green electricity
0.008** (-2.670)
0.006** (-2.768)
0.003** (-3.018)
0.001** (-3.425)
0.593 (-0.534)
0.546 (-0.604)
0.047** (-1.988)
0.991 (0.012)
0.178 (-1.347)
0.127 (-1.527)
WTP for eco-friendly products
0.013** (2.495)
0.001** (3.441)
0.000** (4.132)
0.000** (5.761)
0.099* (1.647)
0.007** (2.675)
0.000** (4.893)
0.428 (0.793)
0.002** (3.067)
0.012** (2.503)
aStandardized test statistics in the brackets
* p-level < 10%
76
III. Measuring the carbon impacts of residential
energy use linked to pro-environmental
behavior
1. Introduction
Since many European countries are heavily energy dependent and about one-
third of a country’s carbon emissions stem from transport and the energy used in
households (e.g., IEA, 2007; DEFRA, 2005), the need to encourage low-carbon
activities in everyday life and reduce demand for fossil fuels has become the focus
of energy and climate-related policies.
The success of such climate and greenhouse gas (GHG)-related policies is
found to be highly dependent on the nature of different environmental activities
and the positioning and communication of green products (Csutora and Zsóka,
2010; Litvine and Wüstenhagen, 2011). Raising awareness in the residential sector
about using renewable energies and reducing energy consumption are both
challenging goals. Energy-saving behaviour in private homes has been particularly
well-addressed by research and surveys from the field of environmental
psychology, as well as in environmental economics, with similar conclusions (e.g.
Csutora et al, 2009; Thøgersen and Gronhoj, 2010; Sanne, 2002; Kerekes and
Luda, 2011): in order for consumer behaviour to significantly change, both the
socio-economic system and sociostructural factors need also to be modified.
The primary focus of the research described was to explore patterns of CO2
emissions arising from residential energy use in Hungary, since there is
considerable potential for energy conservation in this area. This chapter presents a
latent cluster analysis of a group of Hungarian consumers in order to explore the
effect of pro-environmental behaviour on energy saving and investigates the
influence of related socio-demographic and structural characteristics.
The structure of the chapter proceeds as follows. Section 2 discusses the
theoretical background behind measuring pro-environmental behavior. In section 3
the research goals and hypothesis are described. Section 4 presents the

77
methodological approach which was used in the research to estimate the CO2
emisssions of households. Section 5 presents the results of the survey and Latent
cluster analysis. Finally, in Section 6 the discussion and main conclusions are
drawn.
2. Measuring the effect of pro-environmental behaviour
How people chose to adopt one pro-environmental behaviour but not another is
the result of a personal decision-making process with strong interference from an
individual’s attitude and values, prevailing social norms and assessment of
personal costs (Diekmann and Preisendörfer, 1992; Blake, 1999; Stern, 2000). It
was recognized even in the 1990s that there is a discrepancy between
environmental attitudes and pro-environmental behaviour which can be attributed
to the cost of a certain pro-environmental behaviour. Put simply, people usually
choose to behave in the way that is the least costly, as expressed in money, time or
effort (Diekmann and Preisendörfer, 1992). This finding was confirmed by Kaiser
and Wilson (2004) who used the theory of goal-directed performance to
characterize behaviour driven by personal effort.
Investigations into what factors trigger pro-environmental behaviour are still
underway. Much research has highlighted the failure of environmental policies
and has flagged up the idea that there is no linear correlation between reported
environmental awareness and knowledge and actual pro-environmental behaviour,
or in other words, claimed that there is a barrier between knowledge about
environmental issues and pro-environmental action. This is the so-called
‘awareness gap’ which was identified in the 1980s by many sociologists,
psychologists and environmental scientists (Rajecki, 1982; Burgess et al, 1998;
Ajzen and Fishbein, 1980) and has been examined at both the individual and
company level (Zsóka, 2008). Environmental policies usually focus on raising
awareness though environmental education but even early research clearly
indicated that education is only one single contributor to pro-environmental
behaviour, although it is a very important factor (Owens, 2000; Marjainé et al,

78
2011). Pro-environmental behaviour is rather driven by a complex system of
internal and external factors (Stern et al 1993; Kollmuss and Agyeman, 2002).
Stern (2000) identifies two types of pro-environmental behaviour which he
classifies according to the purpose of the behaviour; namely, ‘impact’ and ‘intent-
oriented’ behaviour. The first focuses on the identification of major human
activities which contribute to the human impact on environment, which are
regarded as the by-products of human lifestyles. Intent-oriented behaviour
emphasizes the importance of an individual’s beliefs and values in shaping pro-
environmental behaviour leading to the development of the so-called value-belief-
norm (VBN) theory of environmentalism. This theory suggests that values
(egoistic, altruistic and biospheric values), beliefs (NEP, adverse consequences,
acceptance of responsibility) and personal norms influence what environmental
activities a person engages in (Guagnano et al, 1995; Stern, 2000). Since then, in
environmental psychology the importance of these values for explaining pro-
environmental behaviour has been stressed and studied in depth (e.g. de Groot and
Steg, 2010; Whitmarsh and O’Neill, 2010). Stern (2000) also highlights the
necessity of research into the discrepancy between environmental intent and
impact through the following example: many people in the USA still believe that
spray cans are harmful to the ozone layer and choose not to use them, even though
such ozone layer damage-causing substances have not been used as propellants in
the spray cans for many years (Stern, 2000).
Several studies have focused on the relationship between pro-environmental
behavior and energy saving in households. Thøgersen and Gronhoj (2010) found
that neither motivational nor structural factors independently influence the
electricity saving of Danish households. However, they found that sociostructural
factors (such as home size and family composition) have a significant effect on a
household’s electricity consumption, especially through the quantity of electric
devices they own and use. Differences in electricity-saving behavior according to
gender have also been reported; women report to doing more to save electricity
than men, a situation which may be attributed to the fact that women undertake
more domestic chores. Interestingly, men are more likely to copy the behaviour of
the other members of the household than women. Motivational drivers are related
to self-efficacy and outcome expectations (Thøgersen and Gronhoj, 2010). Wang
et al. (2011) conducted empirical research in China on the relationship between
79
the willingness and actual behaviour of Beijing residents to save electricity and
concluded that economic benefits, comfort and convenience and information are
important factors which affect a household’s electricity-saving behavior, but the
role of environmental awareness in electricity saving is limited. Sardianou (2007)
came to the conclusion that income and family size are important variables for
explaining energy conservation preferences, and that age and expenditure on
energy seem to be negatively correlated to adopting energy-saving behaviours.
The authors also concluded that environmentally-conscious respondents are those
people who are likely to make efforts to save energy. Hori et al (2013) carried out
a survey of energy-saving behavior across five major Asian cities. Their results
show that awareness of global warming, environmental behavior and social
interaction had a relatively significant role in shaping behaviour, and that income
and age also had a weak positive effect.
A lot of surveys have been conducted recently about energy-saving behaviors
and regardless of the exact focus of the research they have come to similar
conclusions concerning the limited role of environmental awareness in energy-
saving behavior. Some of them also focused on the relationship between actual
energy use and pro-environmental behavior (Gatersleben et al, 2002; Poortinga et
al, 2003; Csutora, 2012). Gatersleben et al (2002) conducted a representative
survey among Dutch households which revealed that respondents who claim that
they are more pro-environmental do not use less energy. The amount of energy a
person uses seems to be more closely related to income and household size than
pro-environmental behavior, which is more connected to attitudinal factors
(Gatersleben et al, 2002). Poortinga et al (2003) investigates the relationships
between values, general environmental concerns, specific environmental beliefs
and household energy use. The authors find that environmental behaviors, as
defined from an intent-oriented perspective, were related to attitudinal variables.
In contrast, environmental behaviors defined from an impact-oriented perspective
were not related to such variables. Household energy use appeared to be especially
closely related to socio-demographic variables such as household size and income
which influence an individual’s ability to perform specific behaviors (Poortinga et
al, 2003). Csutora (2012) introduced the notion of a ‘Behaviour-Impact Gap’
(BIG) problem which appears to exist beyond the gap between pro-environmental
behavior and the actual environmental impacts of consumers. Her research
80
indicated that there were no significant differences in the ecological footprint of
green and brown consumers. This finding draws attention to the fact that
individual pro-environmental behaviour does not always reduce the environmental
impacts of consumption, which opens the way to an interesting field of research
for environmental economics (Csutora, 2012).
3. Research goal and hypothesis
This study contributes to research about the behavior-impact gap problem
(Csutora, 2012) by focusing on energy saving behavior in the residential sector.
Several studies have been designed to reveal the factors which influence the
energy saving behavior of households (Thøgersen and Gronhoj, 2010; Wang et al.,
2011; Hori et al, 2013) but only a few of them have investigated the relationship
between pro-environmental behavior and actual energy consumption (Gatersleben
et al, 2002, Poortinga et al, 2003). This study focuses on profiling consumers
according to their pro-environmental behavior and measures actual impacts on
energy use (in terms of carbon emissions) between different groups of consumers.
Csutora (2012) has also investigated the different environmental impact of green
and brown consumers based on pro-environmental behavior in terms of overall
ecological footprint. She found that there is no statistically significant difference
between the overall ecological footprint of green consumers and brown
consumers. Pro-environmental behavior was associated with only a small
reduction in ecological footprint in specific areas (Csutora, 2012). The ecological
footprint methodology provides a general overview of the environmental impact of
human consumption through aggregating different areas such as the environmental
impact of food, energy consumption and the impact of international trade etc. and
fails to assist with the setting of focused policy targets. There is therefore a need to
investigate energy consumption behavior more in detail so that it may better serve
policy goals. Although the studies of Gatersleben et al (2002) and Csutora (2012)
helped to define the gap between behavior and actual impact, this study takes a
step forward in measuring the extent of this gap by presenting the results of latent
cluster analysis based on pro-environmental behavior which is directly connected

81
to the actual impact of the energy use of households. In addition, socio-
demographic and structural attributes are also investigated based on previous
research (Thøgersen and Gronhoj, 2010). The aim of the research presented herein
is to identify social clusters whose members may be said to be acting in a (non)-
environmentally-friendly way, to investigate the environmental impact of their
energy use in terms of CO2 emissions and finally, to profile these clusters through
using their socio-demographic and structural characteristics. This allows the
testing of the following hypothesis (H3): people who consciously act in a pro-
environmental way (green consumers) are responsible for a similar level of CO2
emissions to those created by people who do not undertake environmental
activities (brown consumers). Confirmation of this hypothesis would serve to
strengthen the contention that the positive impact of motivational drivers is offset
by structural and socio-demographic factors and would have significant
implications for policy makers regarding their efforts to reduce residential energy
use. Changing attitudes is indeed a very important (but not the final) step towards
creating a low-carbon society. Linking pro-environmental behavior to the carbon
emitted through energy use enables the revision of current policy efforts and
places the emphasis on undertaking action, which has major environmental
impact.
4. Methodological approach
4.1. Pro-environmental behaviour, socio-demographic and structural variables
measured in the survey
For measuring current pro-environmental behaviour the traditional
methodology used by Eurobarometer was followed. This involves listing activities
with both lower and higher environmental impact. The existence of pro-
environmental behaviour was measured using 8 items which included all the
important environmental activities highlighted by DEFRA (2008) as headline
behaviours (energy and water use, waste behaviour, transport-related activity and
shopping choices) to which respondents could only give binary – yes/no – answers

82
(see Table 4). DEFRA (2008) has compared the environmental impacts of these
different pro-environmental behaviours (expressed in kg of CO2 emissions) and
has identified the current take up of these behaviours in the UK. Reducing
transport-related activities (especially using cars and air transport) has the most
significant impact on CO2 mitigation. Making energy savings and cutting back on
consumption of food (especially meat) are of great significance as well but have
lower impact. Recycling activities have a mid-level impact and the least effective
activities of all involve buying energy efficient products, reducing the amount of
water used and buying local food (DEFRA, 2008).
Recycling does not have a great impact on protecting the environment but is
considered to be a very important component of pro-environmental behaviour. It is
regarded as a ‘catalyst’ behaviour (Austin et al., 2011), which is assumed to
positively affect the adaptation of other pro-environmental behaviours. Thøgersen
(1999) examined the role of recycling in decreasing the amount of packaging
waste in Danish households and concluded that it had a positive influence (also
known as a positive spill over effect in the literature). On the other hand, other
authors (Wenke, 1993; Tucker and Douglas, 2006) emphasize the fact that
recycling may lead to negative spill over effects by providing people with an
excuse to avoid undertaking more impactful actions such as reducing their
household waste.
Relevant socio-demographic and structural variables were selected based on an
overview of literature. In Table 10 the variables and description selected for the
analysis are summarized.
83
Table 12: Selected socio-demographic and structural variables
Variables Description
Socio-
demographics Gender (1= Male; 2= Female), Age (years), Household monthly net income (categorical; 1 to 5 scale), Education (categorical, 1: eight years of primary school or
less, 2: technical college, skilled worker, 3: High school diploma or higher accredited qualification, 4: University degree),
Household size (number of family members including respondent)
Structural
variables Type of house (categorical; 1: apartment house, 2:new estate,
3: Terraced house, 4: Detached and Semi-detached house, 5: Farmhouse)
Number of rooms
Size of house (square meters) Energy efficiency (quantity of electrical devices, scale: 0-8
devices) Car ownership (binary, yes/no) Travel to workplace (categorical; car or other vehicle
including bicycle, public transportation, motorcycle, by foot) Free time travel (Binary; yes/no, Do you typically spend your
free time travelling?)
4.2. Survey method
To determine the total CO2 emissions of households, a survey-based approach
was utilised in which data were collected about the direct and indirect fuel
consumption of households, including their use of heating, transport activities
and electricity.
This empirical research is based on a representative survey of 1012
respondents carried out in the first half of 2010 in Hungary. Data were collected
about the expenditure, consumption patterns, environmental attitudes and life
satisfaction of consumers. Personal (face-to-face) interviewing was undertaken
by a surveying company (TARKI) which used a representative probability
sample representative of the population aged 18 or older in terms of gender,
education, type of settlement, and educational background. The random walk
84
technique was used to select the dwelling and personal interviews were
conducted with one member of each selected household using the Leslie Kish
key method.
Questions about energy consumption focused on respondents’ monthly or
annually energy expenses for heating and electricity, since it was assumed that
the respondents would identify these expenditures more accurately than they
would be able to report on physical units of energy consumed. Besides providing
details about their expenditure, the types of heating used and their share of total
energy use were also investigated (respondents could choose as many heating
sources as were relevant from the following list: LP-gas, district heating and coal
and renewable energy sources (directly produced by households, e.g. PV, solar,
geothermal)). Expenditures for heating were first converted into physical units
(GJ) using the average price for a unit of energy (KSH, 2012) and CO2 emissions
were then calculated according to IPCC (2006) estimates about stationary
combustion sources in the residential sector. Expenditure on electricity was first
converted to TWh, then disaggregated by the different source (for electricity
generation in different power plants) and finally also converted into CO2
emissions according to IPCC estimates.
For transportation, details about the distances travelled by passenger car,
coach and train and the hours spent using air transport and public transport were
collected. Transportation data were converted firstly to passenger kilometres for
vehicles. CO2 emissions are based on IPCC (2006) estimates of mobile
combustion values.
4.3. Statistical analysis
To investigate how reported environmental behaviours are connected to each
other and how they are connected to actual environmental impacts in terms of
CO2, social clusters were identified with the use of a latent class model.
Latent cluster analysis is an analytical method which can be used to determine
subgroups or classes of observations that are similar to each other along multiple
observed variables using model-based, posterior membership probabilities (in

85
opposition to traditional cluster analysis, which uses ad hoc distance definitions
to create clusters). Latent cluster analysis also includes a K-category latent
variable, with each category representing a cluster containing a homogeneous
group of persons (cases). Moreover, a latent class model enables the user to
cluster dichotomous as well as categorical and continuous variables. Model
estimations were carried out using Latent Gold 4.5 software (Vermunt and
Magidson, 2005).
In the analysis consecutive cluster models are compared on the basis of
different model parameters. The indicator variables were the eight types of
environmental activities, which respondents undertook during the last month for
environmental reasons. All eight items were coded in a binary manner: either 0
(= have not done) or 1 (= have done). Selection of the model with the best data
fit was done using the following model parameters: likelihood-ratio (L2) and its
p-value, the Bayesian Information Criterion (BIC) and the number of parameters
(Npar).
The L2 likelihood-ratio statistic shows the amount of association between the
variables that remains unexplained by the model. The p-value of L2 also
measures the fit of the model and it assumes that the L2 parameter follows a chi-
square distribution (consequently, a p-value of greater than 0.05 is desired for an
adequate fit). The Bayesian Information Criteria takes the number of parameters
into account to compare the models; a smaller BIC indicates a better fit. Finally,
the model with the fewest number of parameters (Npar) (i.e. the most
parsimonious model) is selected (Vermunt and Magidson, 2005).
Because a number of variables were modelled and the data for individual
response categories was in some cases sparse, the p-value by bootstrap of L2
(n=500 iterations) was also estimated. This relaxes the assumption that the L2
statistic should follow a chi-square distribution. Because these were nested
models we also used a conditional bootstrap option (n=500 iterations) for
computing the difference in the log-likelihood statistics between the two models
(-2LL Diff) to see if adding another cluster significantly improved the model fit.
In the final model, the bivariate residuals are examined to assess how well the
model explained the correlation between each of the variables.
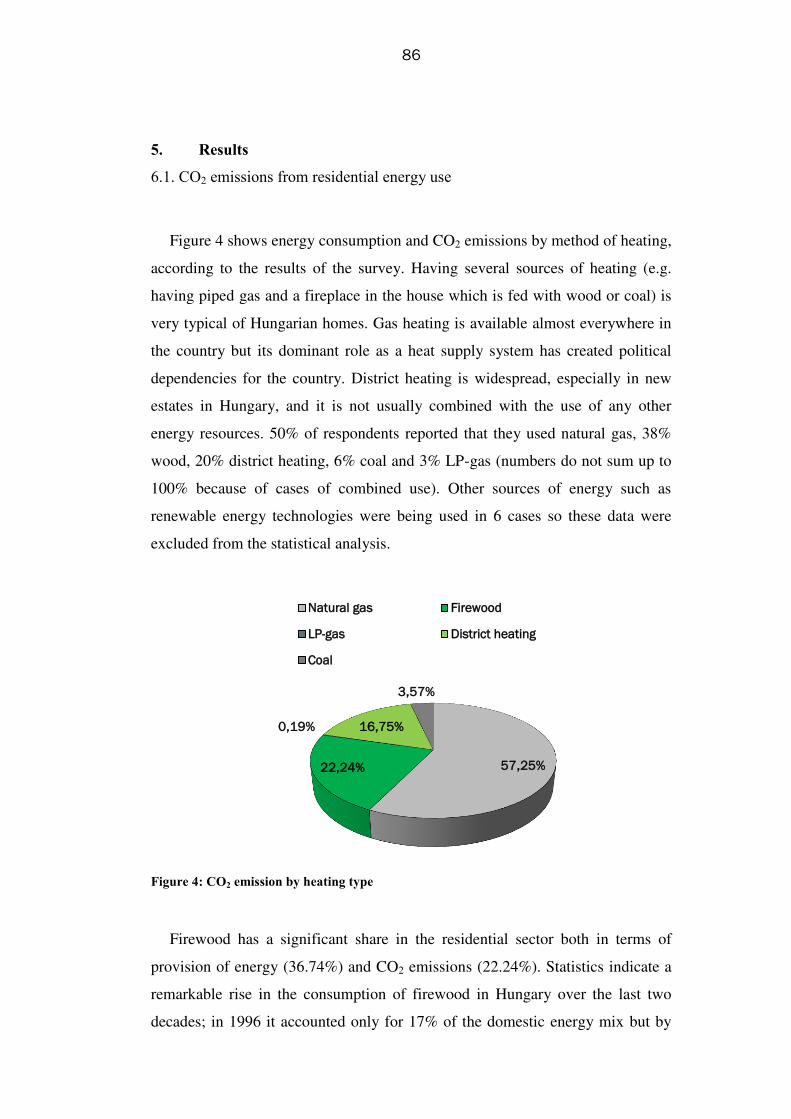
86
5. Results
6.1. CO2 emissions from residential energy use
Figure 4 shows energy consumption and CO2 emissions by method of heating,
according to the results of the survey. Having several sources of heating (e.g.
having piped gas and a fireplace in the house which is fed with wood or coal) is
very typical of Hungarian homes. Gas heating is available almost everywhere in
the country but its dominant role as a heat supply system has created political
dependencies for the country. District heating is widespread, especially in new
estates in Hungary, and it is not usually combined with the use of any other
energy resources. 50% of respondents reported that they used natural gas, 38%
wood, 20% district heating, 6% coal and 3% LP-gas (numbers do not sum up to
100% because of cases of combined use). Other sources of energy such as
renewable energy technologies were being used in 6 cases so these data were
excluded from the statistical analysis.
Figure 4: CO2 emission by heating type
Firewood has a significant share in the residential sector both in terms of
provision of energy (36.74%) and CO2 emissions (22.24%). Statistics indicate a
remarkable rise in the consumption of firewood in Hungary over the last two
decades; in 1996 it accounted only for 17% of the domestic energy mix but by
57,25% 22,24%
0,19% 16,75%
3,57%
Natural gas Firewood
LP-gas District heating
Coal
87
2008 this had risen to 27% (KSH, 2012). This trend might be an indicator of
illegal tree felling. According to estimates there is a significant difference
between officially reported statistics about sales of wood and the actual firewood
consumption of Hungarians. The actual firewood consumption as calculated by
data from household panel surveys is approximately four times higher than
reported in national statistical databases (Szajkó et al., 2009). According to EU
Directive 2009/28/EC, the emissions which stem from renewable sources such as
biomass should be accounted for at zero5. The IPCC Good Practice Guidance and
Uncertainty Management in National Greenhouse Gas Inventories report (2006)
also gives some attention to non-traded fuels, especially to firewood, and notes
how inaccurate indirect estimations of its consumption may be. During the
calculations made for this piece of research, emissions from firewood
combustion were reduced by 30% from the original level because it was assumed
that 30% of the firewood consumed is illegally-traded and is presumably not
taken from areas where sustainable forest management is practiced.
Hungary is not an electricity-intensive country on a per capita basis. For
instance, in 2008 electricity consumption per capita (all sectors included)
amounted to about 4092 kWh, which is considerably lower than the European
average of about 6000 kWh per capita (the world average is about 3000 kWh)
(IEA, 2007). The Hungarian household sector is responsible for about 25.78% of
all electricity consumed in Hungary. Using electricity for heating purposes is not
common. However, electricity consumption has also increased by 25-28% in the
residential sector over the past 15 years, mainly due to the increasing use of
electrical devices in households. The share of renewable energy resources in the
energy mix is still negligible, except for biomass which is mainly used in heat
and CHP power stations. In Hungary electricity is generated primarily from
natural gas (38%) and nuclear power (37%), and secondly from coal and oil
(18%). The share of wind power, hydropower, biomass and other renewable
energy resources is still not significant in the electrical energy mix (these sources 5 EU Directive 2009/28/EC on the promotion of the use of energy from renewable sources in Annex V: “Emissions from the fuel in use shall be taken to be zero for biofuels and bioliquids”. The manual of the EU Air Emission Account (2009) says that “Countries are requested to
separately report emissions of CO2 from biomass (wood and wood waste, charcoal, bio-alcohol,
black liquor, landfill gas, household waste, etc.) used as fuel. The emissions of CO2 from biomass
are not included in the total CO2 emissions in greenhouse gas emissions inventories reported to
the UNFCCC, they are reported only as a memo item. For the purposes of air emissions accounts
these emissions should be reported separately from non-biomass CO2”.

88
combined account for 6.51% of total energy) (MAVIR, 2008). Although the
share of coal and oil is significantly lower, nuclear energy has a relatively large
share of the energy mix and is hindering a switch to renewable energy
technologies. However, it creates the lowest specific CO2 emissions per GWh
(see Figure 5).
Figure 5: Calculated CO2 emission from electricity generation by source
In the questionnaire, household transport activities were divided into the
categories of passenger car, railway, coach and air transport and urban public
transportation (including tram, bus and underground). According to the related
responses 795 kgCO2/capita is emitted annually on average for transport, of
which almost two thirds is produced from the use of passenger cars. In Hungary,
63% of domestic passenger kms are travelled using passenger cars, 9% by
railway transport, 13% by coach, 6% by air transport, and 9% by urban public
transport (KSH, 2012). Figure 6 depicts the calculated carbon emissions of
different types of passenger transport in terms of domestic passenger kms based
on survey results.
44,45%
46,65%
6,96%
0,10% 0,18% 1,38% 0,28%
Oil & coal Natural gas Nuclear energy
Wind power Hydropower Biomass
Other renewables
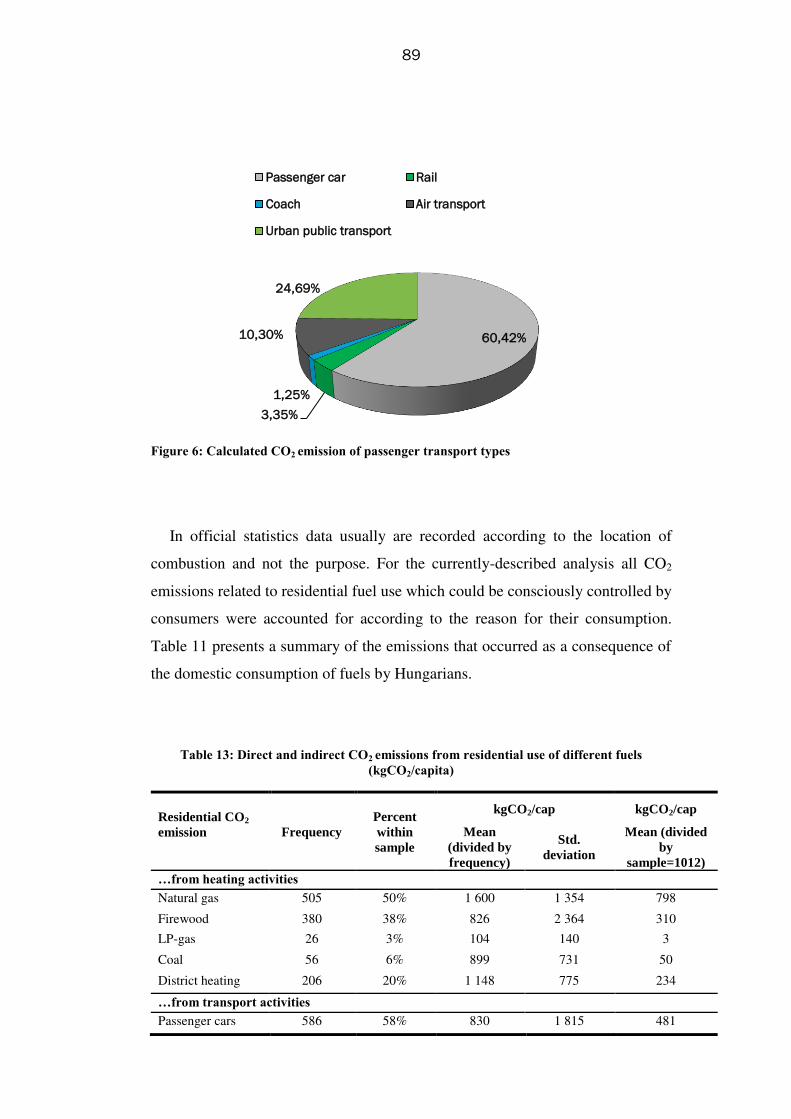
89
Figure 6: Calculated CO2 emission of passenger transport types
In official statistics data usually are recorded according to the location of
combustion and not the purpose. For the currently-described analysis all CO2
emissions related to residential fuel use which could be consciously controlled by
consumers were accounted for according to the reason for their consumption.
Table 11 presents a summary of the emissions that occurred as a consequence of
the domestic consumption of fuels by Hungarians.
Table 13: Direct and indirect CO2 emissions from residential use of different fuels
(kgCO2/capita)
Residential CO2
emission Frequency
Percent
within
sample
kgCO2/cap kgCO2/cap
Mean
(divided by
frequency)
Std.
deviation
Mean (divided
by
sample=1012)
…from heating activities
Natural gas 505 50% 1 600 1 354 798
Firewood 380 38% 826 2 364 310
LP-gas 26 3% 104 140 3
Coal 56 6% 899 731 50
District heating 206 20% 1 148 775 234
…from transport activities
Passenger cars 586 58% 830 1 815 481
60,42%
3,35%
1,25%
10,30%
24,69%
Passenger car Rail
Coach Air transport
Urban public transport
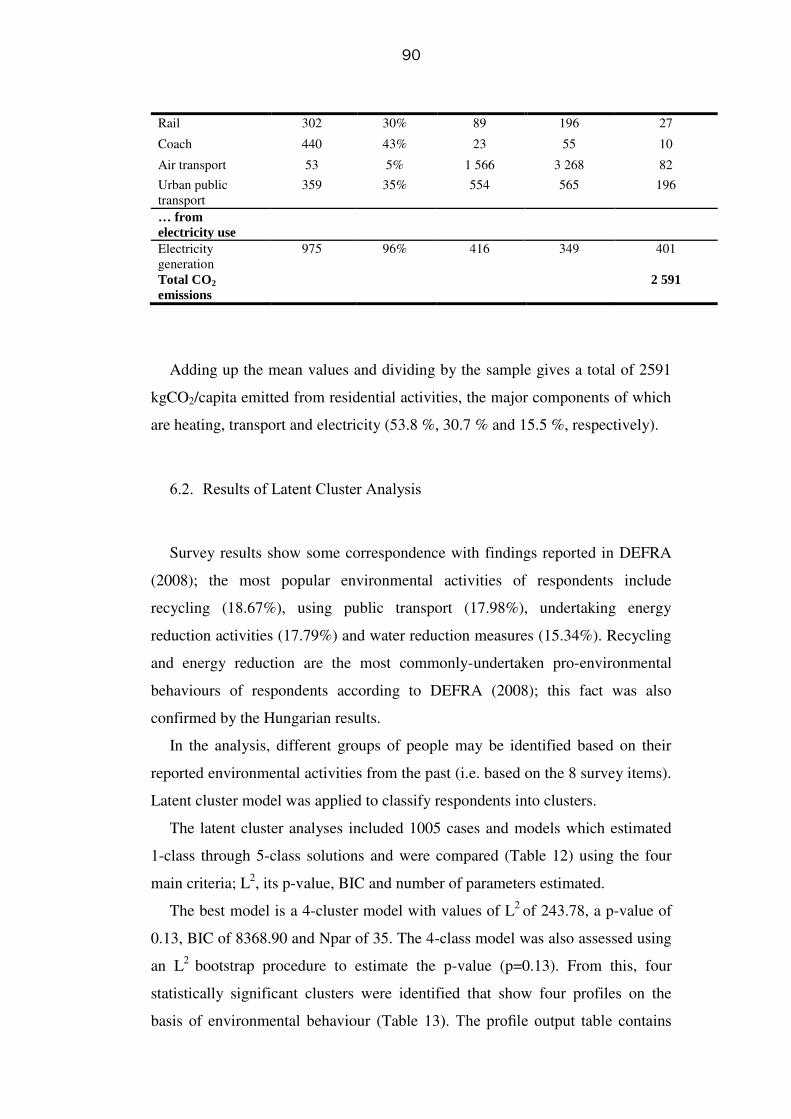
90
Rail 302 30% 89 196 27
Coach 440 43% 23 55 10
Air transport 53 5% 1 566 3 268 82
Urban public transport
359 35% 554 565 196
… from
electricity use
Electricity generation
975 96% 416 349 401
Total CO2
emissions
2 591
Adding up the mean values and dividing by the sample gives a total of 2591
kgCO2/capita emitted from residential activities, the major components of which
are heating, transport and electricity (53.8 %, 30.7 % and 15.5 %, respectively).
6.2. Results of Latent Cluster Analysis
Survey results show some correspondence with findings reported in DEFRA
(2008); the most popular environmental activities of respondents include
recycling (18.67%), using public transport (17.98%), undertaking energy
reduction activities (17.79%) and water reduction measures (15.34%). Recycling
and energy reduction are the most commonly-undertaken pro-environmental
behaviours of respondents according to DEFRA (2008); this fact was also
confirmed by the Hungarian results.
In the analysis, different groups of people may be identified based on their
reported environmental activities from the past (i.e. based on the 8 survey items).
Latent cluster model was applied to classify respondents into clusters.
The latent cluster analyses included 1005 cases and models which estimated
1-class through 5-class solutions and were compared (Table 12) using the four
main criteria; L2, its p-value, BIC and number of parameters estimated.
The best model is a 4-cluster model with values of L2 of 243.78, a p-value of
0.13, BIC of 8368.90 and Npar of 35. The 4-class model was also assessed using
an L2 bootstrap procedure to estimate the p-value (p=0.13). From this, four
statistically significant clusters were identified that show four profiles on the
basis of environmental behaviour (Table 13). The profile output table contains
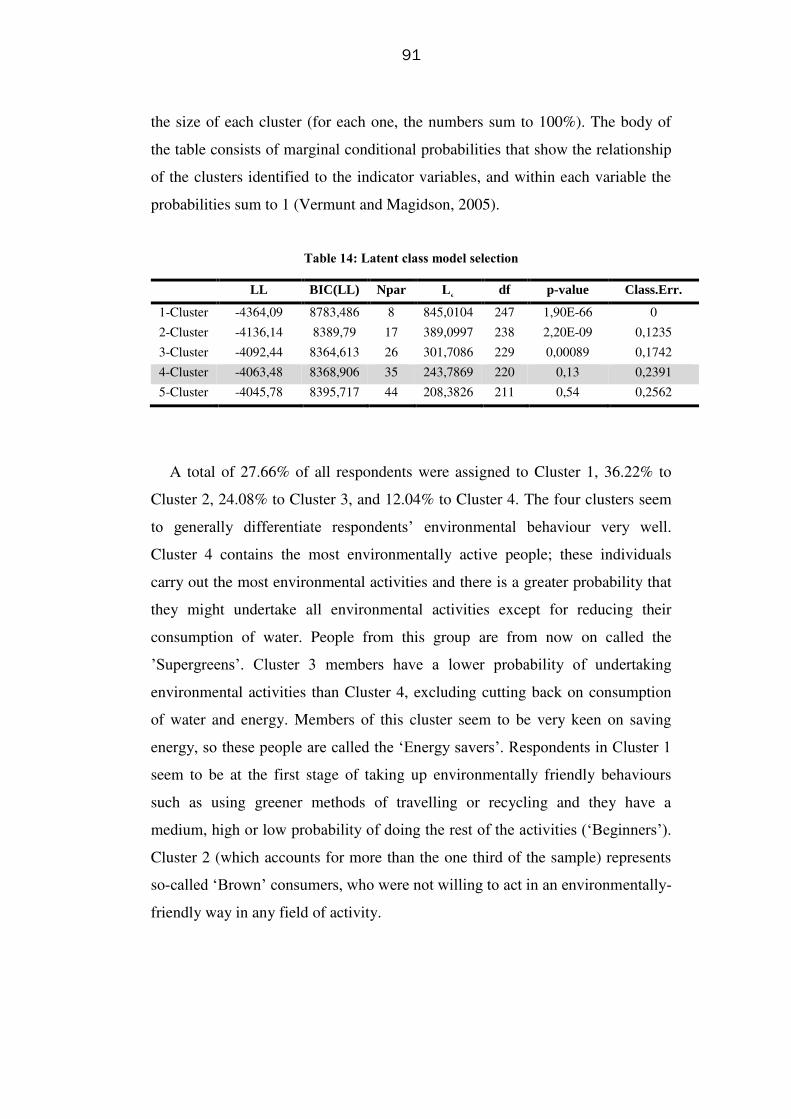
91
the size of each cluster (for each one, the numbers sum to 100%). The body of
the table consists of marginal conditional probabilities that show the relationship
of the clusters identified to the indicator variables, and within each variable the
probabilities sum to 1 (Vermunt and Magidson, 2005).
Table 14: Latent class model selection
LL BIC(LL) Npar L˛ df p-value Class.Err.
1-Cluster -4364,09 8783,486 8 845,0104 247 1,90E-66 0
2-Cluster -4136,14 8389,79 17 389,0997 238 2,20E-09 0,1235
3-Cluster -4092,44 8364,613 26 301,7086 229 0,00089 0,1742
4-Cluster -4063,48 8368,906 35 243,7869 220 0,13 0,2391
5-Cluster -4045,78 8395,717 44 208,3826 211 0,54 0,2562
A total of 27.66% of all respondents were assigned to Cluster 1, 36.22% to
Cluster 2, 24.08% to Cluster 3, and 12.04% to Cluster 4. The four clusters seem
to generally differentiate respondents’ environmental behaviour very well.
Cluster 4 contains the most environmentally active people; these individuals
carry out the most environmental activities and there is a greater probability that
they might undertake all environmental activities except for reducing their
consumption of water. People from this group are from now on called the
’Supergreens’. Cluster 3 members have a lower probability of undertaking
environmental activities than Cluster 4, excluding cutting back on consumption
of water and energy. Members of this cluster seem to be very keen on saving
energy, so these people are called the ‘Energy savers’. Respondents in Cluster 1
seem to be at the first stage of taking up environmentally friendly behaviours
such as using greener methods of travelling or recycling and they have a
medium, high or low probability of doing the rest of the activities (‘Beginners’).
Cluster 2 (which accounts for more than the one third of the sample) represents
so-called ‘Brown’ consumers, who were not willing to act in an environmentally-
friendly way in any field of activity.

92
Table 15: The size of latent clusters and the profile output
Cluster 1:
Beginners
Cluster 2:
Browns
Cluster 3:
Energy savers
Cluster 4:
Supergreens
Cluster Size 27.66% 36.22% 24.08% 12.04%
Profile
Has chosen more environmentally friendly ways of travelling (on foot, bicycle or public transport)
0 0.53 0.88 0.70 0.06
1 0.47 0.12 0.30 0.94
Has reduced their consumption of disposable items (plastic bags, certain kind of packaging, etc.)
0 0.78 1.00 0.71 0.42
1 0.22 0.00 0.29 0.58
Has separated most of their waste for recycling
0 0.51 0.82 0.67 0.21
1 0.49 0.18 0.33 0.79
Has cut down their water consumption (e. g. not leaving water running when washing the dishes or taking a shower, etc.)
0 0.90 0.97 0.19 0.30
1 0.10 0.03 0.81 0.70
Has cut down their energy consumption (e. g. turning down air conditioning or heating, not leaving appliances on stand-by, buying energy saving light bulbs, buying energy efficient appliances, etc.)
0 0.74 0.94 0.29 0.20
1 0.26 0.06 0.71 0.80
Has bought environmentally friendly products marked with an environmental label
0 0.89 1.00 0.88 0.72
1 0.11 0.00 0.12 0.28
Has chosen locally-produced products or groceries
0 0.69 1.00 0.86 0.37
1 0.31 0.00 0.14 0.63
Has used car less 0 0.91 0.99 0.92 0.64
1 0.09 0.01 0.08 0.36
As reported above, recycling is the most prevalent form of environmental
activity and it does seem to be a trigger behaviour, since it is done by many
Browns and Beginners.
Statistical relationships were investigated between the CO2 emissions of
electricity use, heating and transport activities and pro-environmental behaviours
for each of the four clusters. Figure 7 depicts the mean values for kgCO2 per
capita emissions stemming from transport, heating and electricity use of the
residential sector according to the four clusters.
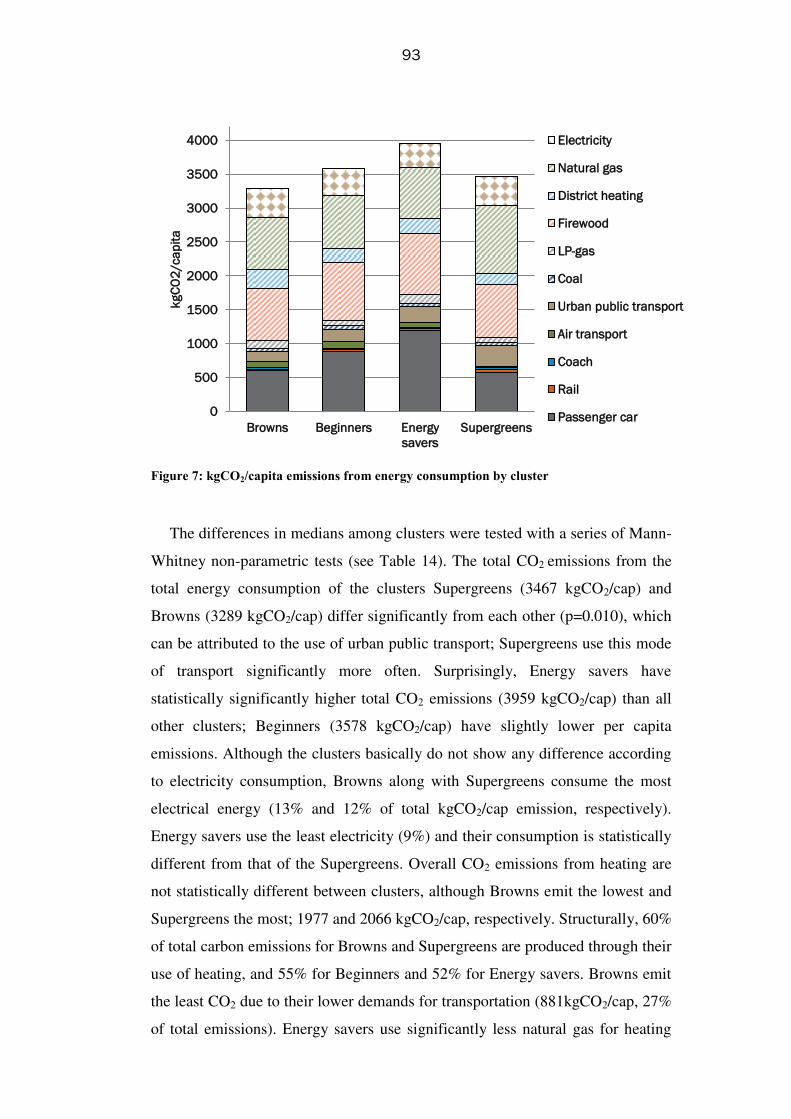
93
Figure 7: kgCO2/capita emissions from energy consumption by cluster
The differences in medians among clusters were tested with a series of Mann-
Whitney non-parametric tests (see Table 14). The total CO2 emissions from the
total energy consumption of the clusters Supergreens (3467 kgCO2/cap) and
Browns (3289 kgCO2/cap) differ significantly from each other (p=0.010), which
can be attributed to the use of urban public transport; Supergreens use this mode
of transport significantly more often. Surprisingly, Energy savers have
statistically significantly higher total CO2 emissions (3959 kgCO2/cap) than all
other clusters; Beginners (3578 kgCO2/cap) have slightly lower per capita
emissions. Although the clusters basically do not show any difference according
to electricity consumption, Browns along with Supergreens consume the most
electrical energy (13% and 12% of total kgCO2/cap emission, respectively).
Energy savers use the least electricity (9%) and their consumption is statistically
different from that of the Supergreens. Overall CO2 emissions from heating are
not statistically different between clusters, although Browns emit the lowest and
Supergreens the most; 1977 and 2066 kgCO2/cap, respectively. Structurally, 60%
of total carbon emissions for Browns and Supergreens are produced through their
use of heating, and 55% for Beginners and 52% for Energy savers. Browns emit
the least CO2 due to their lower demands for transportation (881kgCO2/cap, 27%
of total emissions). Energy savers use significantly less natural gas for heating
0
500
1000
1500
2000
2500
3000
3500
4000
Browns Beginners Energysavers
Supergreens
kg
CO
2/c
ap
ita
Electricity
Natural gas
District heating
Firewood
LP-gas
Coal
Urban public transport
Air transport
Coach
Rail
Passenger car
94
than Browns or Supergreens do. While Energy savers cut back on their use of
electricity and heating, they use cars more heavily (1190 kgCO2/cap) than other
clusters do and their carbon emissions from transportation are 1.7 times higher
(1547 kgCO2/cap) which accounts for 39% of their total emissions. Supergreens,
according to their answers to survey questions, use their cars the least and use
public transportation more (974 kgCO2/cap, 28% of total emissions).
In order to test what relationship exists between clusters and socio-
demographic and structural characteristics, Mann-Whitney non-parametric tests
were conducted. Table 14 and Table 24 in Appendices show the socio-
demographic and structural features of each cluster: gender, age, education,
monthly net household income, household size, type of house, number of rooms,
the size of the house, energy efficiency, car ownership, the method of travelling
to the workplace and free time spent travelling.
In contrast to the work of Thøgersen and Gronhoj (2010), gender, age and
household size do not seem to be related to pro-environmental behaviour or
energy use. As discussed above, education can play an influential role in forming
pro-environmental behaviour; i.e. better qualified people tend to act in a more
environmentally-friendly way, although the relationship between education and
pro-environmental behaviour should not be over-generalised and cannot be
considered linear. Almost all the clusters differ from each other according to
educational background; the most qualified people are Supergreens, of whom
about 24% hold university degrees (in this group the fewest respondents from all
the groups (14%) have had only 8 years of primary schooling). Brown consumers
are on average least educated and there is a significant difference between almost
all clusters except for Supergreens and Beginners in terms of education.
As might be expected, Supergreens have the highest average monthly net
income while Browns are the poorest, on average. Energy savers have a similar
income level to Supergreens and Beginners. The financial states of respondents
are also underpinned by other features such as the size and type of their houses
and number of rooms. ‘Supergreens’ possess the largest houses with the greatest
number of rooms and the majority of them live in detached or semi-detached
houses. Only 19% of the respondents of this cluster live in new estates where
people of lower incomes typically reside. Energy savers have similar housing
situations to Supergreens; 61% of them live in detached or semi-detached

95
houses, but the size of their homes, along with the number of rooms
differentiates them from Supergreens. Brown consumers differ significantly from
Supergreens and Energy savers regarding the features of their houses.
‘Energy efficiency’ measures the quantity of electrical devices and appliances
a respondent has (refrigerator, freezer, air-conditioner, washing machine,
computers, etc.). This factor also differentiates clusters; Supergreens tend to have
the most household devices of all clusters, which explains their higher
consumption of electricity.
The most significant difference can be observed with ownership of cars and
the way respondents travel to their places of work. Although more Supergreens
have cars than other clusters, they still prefer to use alternative ways of travelling
to work. Browns and Energy savers use their cars the most, presumably on a
daily basis, for travelling to their workplaces. Browns spend their free time
travelling the least of all clusters, but in other cases this variable does not seem to
be strongly related to pro-environmental behaviour.

96
Table 16: Results of Mann-Whitney U pairwise test by cluster
Browns vs
Supergreens
Browns vs
Energy savers
Browns vs
Beginners
Energy savers vs
Supergreens
Energy savers vs
Beginners
Supergreens
vs Beginners
CO2 emissions by electricity,
heating and transport activities
Electricity 0.200 0.291 0.693 0.034** 0.504 0.112
Natural gas 0.866 0.047** 0.203 0.060* 0.452 0.186
District heating 0.464 0.816 0.000** 0.499 0.001** 0.117
Firewood 0.711 0.322 0.941 0.744 0.471 0.805
LP-gas 0.837 0.209 0.407 0.667 0.429 1.000
Coal 0.401 0.879 0.681 0.234 0.763 0.186
Urban public transport 0.01** 0.598 0.826 0.052* 0.493 0.006**
Air transport 0.291 0.359 0.703 0.355 0.335 0.265
Coach 0.070* 0.627 0.141 0.133 0.281 0.485
Rail 0.310 0.985 0.126 0.251 0.071* 0.657
Passenger car 0.512 0.005** 0.833 0.003** 0.013** 0.364
Socio-demographic and
structural variables
Gender 0.355 0.384 0.738 0.822 0.261 0.257
Age 0.416 0.409 0.251 0.963 0.764 0.794
Education 0.000** 0.043** 0.000** 0.014** 0.088* 0.248
Household net income 0.001** 0.019** 0.014** 0.113 0.786 0.186
Household size 0.144 0.135 0.585 0.774 0.293 0.252
Type of house 0.061* 0.076* 0.140 0.620 0.730 0.464
Number of rooms 0.000** 0.075* 0.033** 0.004** 0.811 0.005**
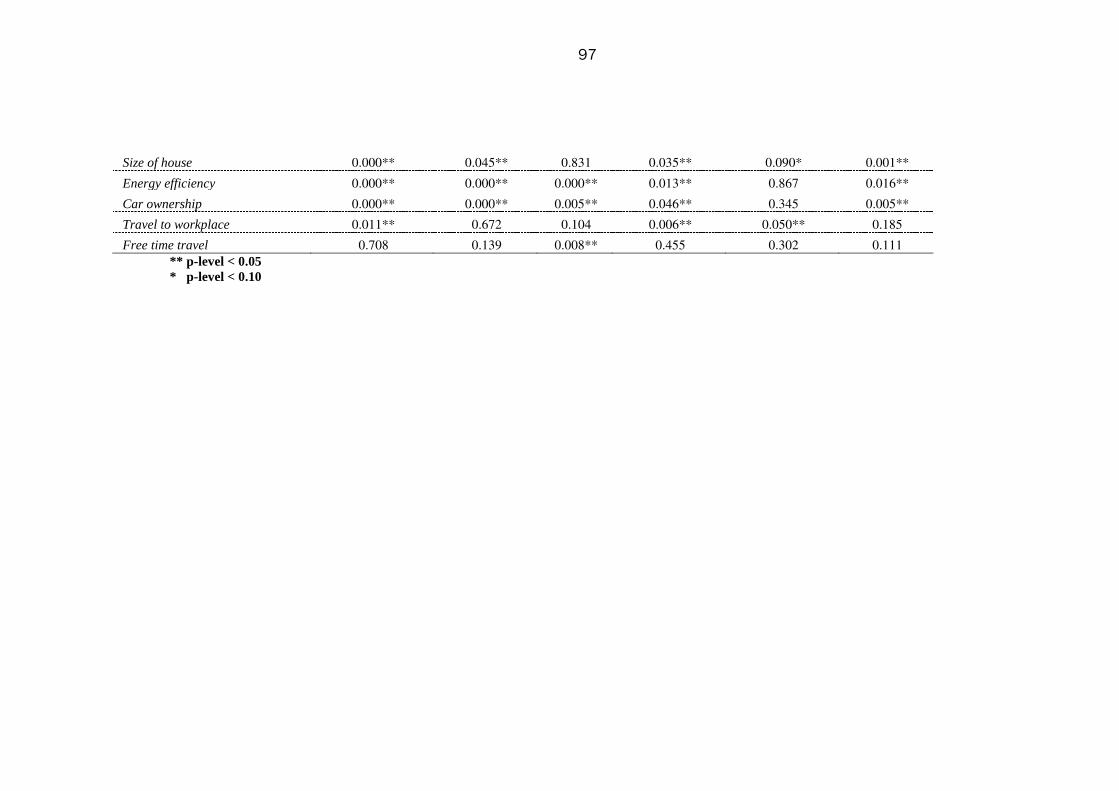
97
Size of house 0.000** 0.045** 0.831 0.035** 0.090* 0.001**
Energy efficiency 0.000** 0.000** 0.000** 0.013** 0.867 0.016**
Car ownership 0.000** 0.000** 0.005** 0.046** 0.345 0.005**
Travel to workplace 0.011** 0.672 0.104 0.006** 0.050** 0.185
Free time travel 0.708 0.139 0.008** 0.455 0.302 0.111 ** p-level < 0.05
* p-level < 0.10

98
7. Discussion and conclusions
The main finding of this study is that undertaking environmental activities
does not necessarily result in tangible overall decreases in environmental impact
or CO2 mitigation.
Four main profiles were identified on the basis of the environmental actions
taken by respondents. Two clusters describe people who undertake energy-
saving behaviour; Energy savers and Supergreens. Respondents from the latter
cluster undertake a range of environmental activities, including reducing their
energy consumption and travelling in more environmentally friendly ways
instead of using cars. In accordance with these statements, this cluster has the
lowest carbon emissions for car use. However, their emissions due to energy
consumption for heating and electricity are, on average, similar to those of
Browns. Moreover, in some cases they exceed them.
It is notable that there is a trade-off between using natural gas and firewood
for heating in Hungary. Since wood is a relatively inexpensive form of heating
and has been promoted by EU Directives as a renewable source of energy it has
become more and more popular over the last decade and now constitutes an
important heating source, which may substitute for natural gas. In some cases
respondents reported that they owned mixed-fuel boilers which can combine
wood burning with gas heating systems. Energy savers use the most firewood in
their heating mix. The use of coal and LP-gas no longer prevails in Hungary.
District heating is the only form of heating which creates indirect CO2 emissions,
since combustion occurs in heat and CHP plants and not at the location of the
end user. Having this form of heating means that a customer is locked-in from an
infrastructural perspective (i.e. these consumers are not usually able to switch to
using other energy sources, regardless of their wishes).
Energy-saving behaviour is one of the most popular environmental activities
although it is difficult to specify the reasons for this; is it driven by
environmental concern or a desire to reduce costs. This survey indicated that
Energy savers generally have lower incomes. It is also remarkable that Energy
99
savers appear willing to cut back on direct consumption of energy but they
pollute significantly more through their use of passenger cars.
The central hypothesis of this research (H3), that people who consciously act
in a pro-environmental way do not necessarily impact CO2 emissions more than
those who do not undertake environmental activities is partly confirmed; there
were no significant differences found between groups in terms of electricity use
or heating activities - only with transport activities. This finding has implications
for environmental and energy policy-making.
There are two main approaches in the literature to reducing consumption and
environmental load; voluntarism and structural approaches. Voluntarism can be
increased through awareness-raising campaigns, education-related drives and
increasing the willingness to live an environmentally-friendly lifestyle. Socio-
structural approaches address the living conditions and circumstances that lock
consumers into living unsustainable lifestyles and include factors such as
working conditions, size of homes, family sizes, etc. (Sanne, 2002; Thøgersen
and Gronhoj, 2010). Whilst studies emphasize that both approaches are needed to
increase pro-environmental behaviour, fewer studies have paid attention to
identifying how the approaches and behaviour changes actually impact the
environment. Thus, the second finding of this research is striking: that there may
actually be no difference between environmentally-conscious and
environmentally indifferent individuals in terms of their energy-related CO2
emissions. Browns and Supergreens emit almost the same amount of carbon
because the voluntarism of Supergreens is offset by structural factors which, at
the same time, reduce the consumption and carbon emissions of Browns. The
finding indicates that pro-environmental behaviours are limited in impact and
may be dominated by structural factors. Interestingly, this situation appears in the
case of heating and electricity but not with transportation. There has been a
remarkable increase in private car use in almost all European countries which is
one of the main reasons for the increase in carbon emissions due to transportation
(EUROSTAT, 2010). Supergreens appear to be using cars less, although they are
more likely to own them than respondents from other clusters, and they are more
likely to choose alternative ways of travelling to their workplaces than other
respondents. This indicates that motivational factors can make a real difference
100
in terms of CO2 emissions. The consumption of energy for heating and electricity
seem to be influenced rather by socio-structural factors, such as income, size of
home and quantity of electric devices.
These inferences are important enough to merit attention in future research
and draw the attention of policy makers and NGOs. The message is to focus on
the real environmental impact of environmentally-friendly behaviour rather than
examine the frequency of its occurrence. The cost of marginal environmental
action can overcome its benefits in the long term. There is a lack of public
understanding about the impact of environmental action which may lead to
redundant efforts being made, a limit in the environmental benefits that are
achieved and the demoralization of consumers.
The findings described have relevant implications for environmental and
energy policies. For policy makers, the findings presented in this chapter suggest
that, besides introducing policy measures that encourage environmentally
friendly and energy-saving behaviour, especially in the transport sector, there is a
need for instruments that also tackle socio-structural factors to be designed, not
only those that address the promotion of pro-environmental behaviour.
8. Acknowledgements
The survey presented in this chapter was financially supported by the
Norwegian Financial Mechanism and TÁMOP 4.2.2/B-10/1-2010-0023 project.
This work is also related to the Sciex Programme (Project code: 12.163).

101
Appendix Table 17: Socio-demographic and structural variables by cluster
Beginners Browns Energy
savers
Supergreens
Gender (woman, in %) 53% 54% 57% 59%
Age 44.33 46.24 44.64 44.39
Education
8 years of primary school or less
17% 30% 24% 14%
Technical college, skilled worker
41% 39% 43% 45%
High school diploma or higher accredited qualification
26% 20% 14% 17%
University degree 16% 11% 18% 24%
Household net income
(thousand HUF/month)
211.05
189.11
206.54
241.59
Type of settlement
Capital 17% 17% 17% 20%
Suburbia 6% 4% 11% 10%
City 52% 50% 41% 48%
Village, farm 25% 29% 30% 22%
Type of house
Apartment house 3% 8% 5% 4%
New estate 29% 26% 21% 19%
Terraced house 11% 6% 5% 7%
Detached and Semi-detached house
44% 51% 61% 61%
Farmhouse 14% 8% 8% 8%
Number of rooms 2.62 2.49 2.60 2.86
1 5% 6% 5% 1%
2 44% 53% 47% 39%
3 39% 31% 36% 36%
over 4 11% 10% 12% 24%
Size of house (m2) 75.73 76.86 78.52 84.96
Energy efficiency
0-2 9% 17% 9% 3%
3-5 56% 59% 58% 55%
6-8 35% 24% 33% 43%
Do you have a passenger
car?
Yes 55% 44% 60% 70%
Work place travel
Car 27% 35% 37% 19%
Free time spent travelling
(yes, %)
50% 39% 45% 41%
98
IV. CO2 impacts of servitization – a structural
decomposition analysis of the Hungarian
economy
1. Introduction
In this study one possible solution of changing consumption is examined
towards a less energy-intensive future; the concept of service economy. It has
been a common belief that changing consumption patterns towards bigger share of
income spent on services – on the account of less spending for intensive goods –
could help to reduce overall consumption related CO2 emissions. Looking at the
interactions between goods and services, which are regarded as the main
components of the consumption system, a widespread view claims that service
sector might displace the sector of material goods (Parrinello, 2004). This is the
so-called ‘service economy’ concept that refers to the shift from the production of
physical goods to services.
There are a plenty of papers trying to reveal the environmental impacts of
shifting to service economy on different levels of investigation, using different
assumptions and aspects. Yet, there is a lack in detailed economy-wide
investigation on the interraletions between service and non-service industries. To
measure CO2 emissions throughout intersectorial relations within the economy is
crucial for designing more effective sustainability and energy policy measures. It
is especially imperative in developed countries, where the services are the main
drivers of the economic growth both in terms of GDP and employment.
The goal of this study is to fill this research gap and to elaborate on the real
carbon impacts of different types of services and to provide environmental policy
recommendations based on empirical findings. In order to come to a deeper
understanding of the (de)carbonisation effect of services, an environmentally
extended input–output (EEIO) model and a structural decomposition analysis are
conducted on the Hungarian economy.

99
This chapter is organized as follows: Section 2 describes the current trends in
servitization and the hypotheses development. Section 3 presents the applied
methodological background for the calculation of CO2 emission generated by
service sector. Section 4 delivers the results of input-output and structural
decomposition analysis In Section 5 conclusions are drawn and in Section 6 the
discussion the results is presented.
2. Latent factors behind the trends and hypotheses
2.1. Embedded emission of services
The environmental load on economy-wide scale induced by service sector
stands only in the center of few studies (Suh, 2006; Alcàntara and Padilla, 2009;
Butnar and Llop, 2011). Services enter the production process of commodities at
several levels of supply chain, so the measurement of their impacts also needs to
be placed into a process-based angle. To simulate the processes where services
play a role, the best available method currently is the Input-Output analysis that
allows us to take advantage of its life-cycle and process-based perspectives.
Suh (2006) analyses the GHG emission of 480 goods and services in the
United States using environmental emission inventory database. He concludes
that a shift to a service economy shows a decrease in GHG emission intensity per
unit GDP but an overall increase in GHG emissions in absolute terms can be
observed at the same time.
Alcàntara and Padilla (2009) use input-output analysis to study the CO2
emissions associated with services. By means of a decomposition analysis they
identify five different CO2 components of service subsystem; own, demand
volume, feedback, internal and spill over components. According to their findings
transportation services are the main contributors to carbon emission among other
services. Input-output analysis reveals that emissions stemming from the
production of intermediate materials or services exceed the direct emissions of
services, which is captured through the spillover component that refers to the

100
demand of services from productive industries. In this respect, an outstanding role
is played by sectors such as Wholesale and retail trade, and repair of vehicles and
goods, Hotels and restaurants, Real estate, renting and business services, and
Public administration services (Alcántara and Padilla, 2009). A similar structural
decomposition analysis is applied on the Spanish service sector between 2000-
2005, which reports a general increase in CO2 emission with a strong pull effect
exerted by the service sectors on non-service sectors. Results show that services
increased their CO2 emissions mainly due to the spillover emissions generated by
non-service sector; the strongest pull effect is found in Commerce and
reparations, Transport and Post and telecommunications (Butnar and Llop, 2011).
Another study by Jansson (2009) draws the conclusion that the growing
dominance of services is only a statistical illusion arising from the traditional
definition of services used in national accounts (whether the nature of output is
tangible or intangible) and the profound industrial reorganization that has
happened in the last century (Jansson, 2009).
2.2. Structural changes in economies over the last century
Servitization and dematerialisation of economies are coupled together
according to the observed trends during the last decades (Herman et al., 1990;
Bernardini and Galli, 1993; Ruth, 1998; Fiksel, 2012). It is beyond dispute that
employment rate in the service sector has been increasing and the economic
growth in he last decades has been driven by services in many OECD countries in
terms of GDP (OECD, 2000). This remarkable growth is also linked to the decline
in energy intensity (energy/GDP, see Figure 8) in many economies (Romm et al.,
1999). Thus, a number of studies in the 1990s jumped to the conlcusion that the
current shift towards servitization is attached with less environmental load
(Fourcroy et al., 2012).
The share of service sector in GDP has been risen from the second half of the
20th century in industrialized countries; trends show that Europe has shifted
economic activities from industrial production to services (see Figure 9). In EU-
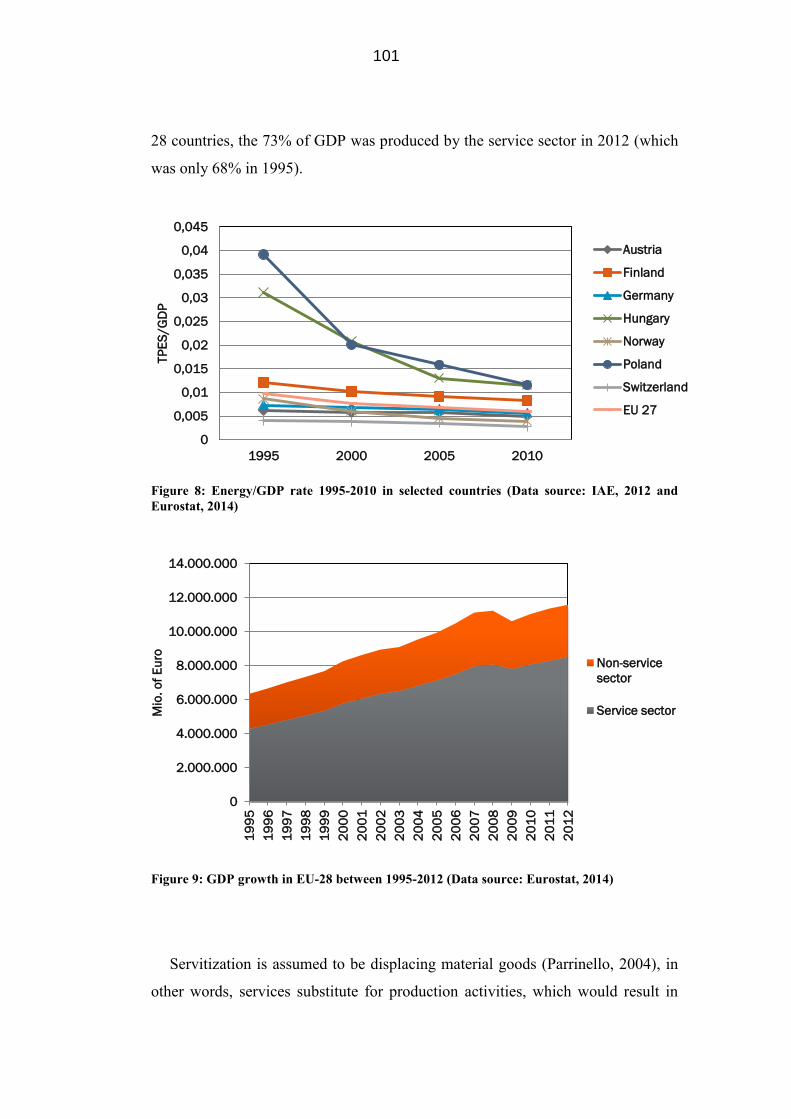
101
28 countries, the 73% of GDP was produced by the service sector in 2012 (which
was only 68% in 1995).
Figure 8: Energy/GDP rate 1995-2010 in selected countries (Data source: IAE, 2012 and
Eurostat, 2014)
Figure 9: GDP growth in EU-28 between 1995-2012 (Data source: Eurostat, 2014)
Servitization is assumed to be displacing material goods (Parrinello, 2004), in
other words, services substitute for production activities, which would result in
0
0,005
0,01
0,015
0,02
0,025
0,03
0,035
0,04
0,045
1995 2000 2005 2010
TP
ES
/G
DP
Austria
Finland
Germany
Hungary
Norway
Poland
Switzerland
EU 27
0
2.000.000
4.000.000
6.000.000
8.000.000
10.000.000
12.000.000
14.000.000
19
95
19
96
19
97
19
98
19
99
20
00
20
01
20
02
20
03
20
04
20
05
20
06
20
07
20
08
20
09
20
10
20
11
20
12
Mio
. o
f E
uro
Non-servicesector
Service sector
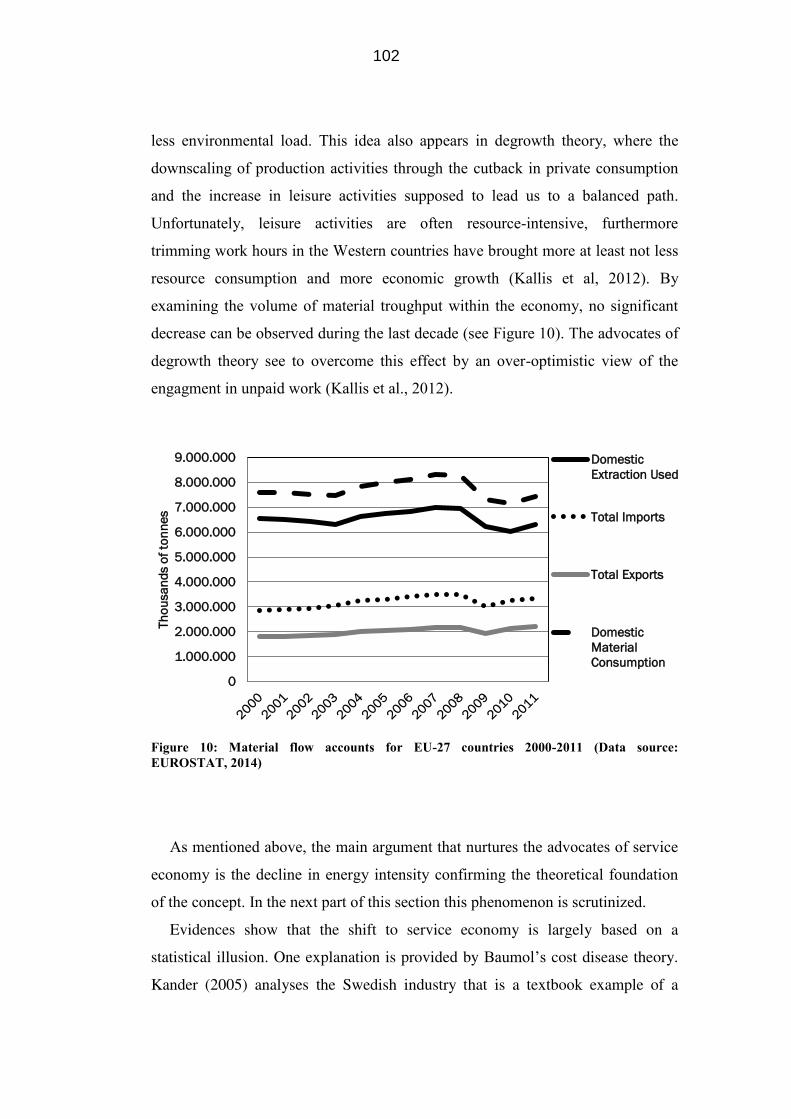
102
less environmental load. This idea also appears in degrowth theory, where the
downscaling of production activities through the cutback in private consumption
and the increase in leisure activities supposed to lead us to a balanced path.
Unfortunately, leisure activities are often resource-intensive, furthermore
trimming work hours in the Western countries have brought more at least not less
resource consumption and more economic growth (Kallis et al, 2012). By
examining the volume of material troughput within the economy, no significant
decrease can be observed during the last decade (see Figure 10). The advocates of
degrowth theory see to overcome this effect by an over-optimistic view of the
engagment in unpaid work (Kallis et al., 2012).
Figure 10: Material flow accounts for EU-27 countries 2000-2011 (Data source:
EUROSTAT, 2014)
As mentioned above, the main argument that nurtures the advocates of service
economy is the decline in energy intensity confirming the theoretical foundation
of the concept. In the next part of this section this phenomenon is scrutinized.
Evidences show that the shift to service economy is largely based on a
statistical illusion. One explanation is provided by Baumol’s cost disease theory.
Kander (2005) analyses the Swedish industry that is a textbook example of a
0
1.000.000
2.000.000
3.000.000
4.000.000
5.000.000
6.000.000
7.000.000
8.000.000
9.000.000
Th
ou
sa
nd
s o
f to
nn
es
DomesticExtraction Used
Total Imports
Total Exports
DomesticMaterialConsumption
103
typical EKC (Environmental Kuznets-curves6) slope for CO2 (that grows until
1970 then declines afterwards). He found that this phenomenon could rather be
attributed to the change in the mix of energy carriers and the stabilization of
energy consumption than the expansion of service sector (Kander, 2005). The
higher monetary output and employment in service sector can be explained by the
concept of Baumol’s cost disease theory (Henriques and Kander, 2010) that is
based on the rationalization of labor time in industry. In industrial sectors the
reduction of labor time is feasible by applying more efficient machines and
equipments leading to higher wages in the long run. Altough labor time is rather
stagnant in service sector, but the wage increase in industry triggers a demand in
service sector that results in higher salaries without real efficiency improvement.
In the long run, this leads to a relative rise in services to industrial product prices
increasing its relative share of GDP at the same time. Attractive salaries in service
sector decoy the labor resulting in growing employment rate. Consequently, the
energy/GDP ratio has been declined over time caused by a simple statistical
illusion, namely, GDP has risen faster than energy consumption over time.
Another reason for the drastic expansion of services can be attributed to the
outsourcing wave of service-related activities. In the last decades big firms
decided to improve performance through outsourcing activities that were not
related to their core competencies (OECD, 2000). Thus, a lot of activities that
were accounted for the production sector have been transferred to services
increasing its share in GDP, which has only reinforced the statistical distortion in
favour of services.
Furthermore, the delocalisation of industrial activities into emerging countries
took place that led to a virtual decrease in CO2 emission in national accounts.
Industrialised world replaced their own manufactured products by imported ones
and at the same time the pollution from production have been also delocated to
other regions. China accounts for over 70% of total USA imports in manufactured
6 The Environmental Kuznets Curve (EKC) hypothesis postulates an inverted-U-shaped relationship between different pollutants and per capita income, i.e., environmental pressure increases up to a certain level as income goes up; after that, it decreases. (Dinda, 2004, p.431.). U-shaped curve refers to the structural change over time; in the first part there is the industrialisation phase with increasing energy intensity then after the peak, the curve shows a decline attributed to the shift to service economy (Henriques and Kander, 2010).
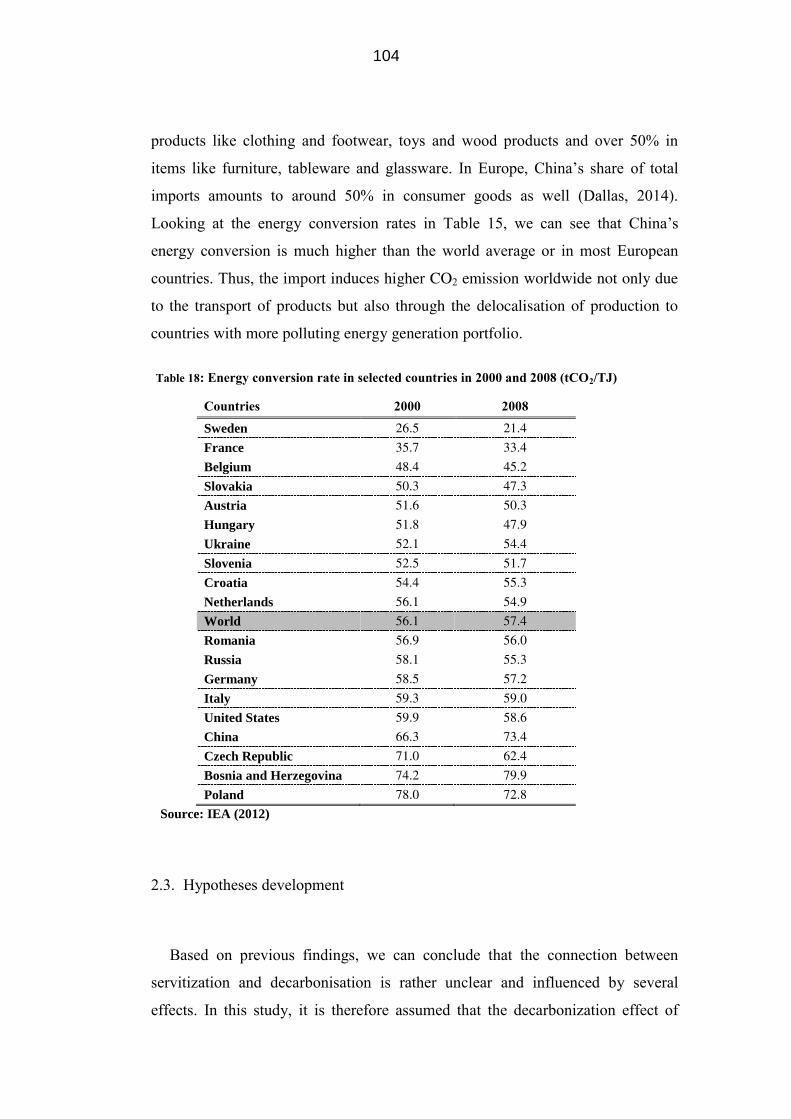
104
products like clothing and footwear, toys and wood products and over 50% in
items like furniture, tableware and glassware. In Europe, China’s share of total
imports amounts to around 50% in consumer goods as well (Dallas, 2014).
Looking at the energy conversion rates in Table 15, we can see that China’s
energy conversion is much higher than the world average or in most European
countries. Thus, the import induces higher CO2 emission worldwide not only due
to the transport of products but also through the delocalisation of production to
countries with more polluting energy generation portfolio.
Table 18: Energy conversion rate in selected countries in 2000 and 2008 (tCO2/TJ)
Countries 2000 2008
Sweden 26.5 21.4
France 35.7 33.4
Belgium 48.4 45.2
Slovakia 50.3 47.3
Austria 51.6 50.3
Hungary 51.8 47.9
Ukraine 52.1 54.4
Slovenia 52.5 51.7
Croatia 54.4 55.3
Netherlands 56.1 54.9
World 56.1 57.4
Romania 56.9 56.0
Russia 58.1 55.3
Germany 58.5 57.2
Italy 59.3 59.0
United States 59.9 58.6
China 66.3 73.4
Czech Republic 71.0 62.4
Bosnia and Herzegovina 74.2 79.9
Poland 78.0 72.8
Source: IEA (2012)
2.3. Hypotheses development
Based on previous findings, we can conclude that the connection between
servitization and decarbonisation is rather unclear and influenced by several
effects. In this study, it is therefore assumed that the decarbonization effect of
105
servitization is overrated that is governed by incomplete data that lack a
significant portion of use-related carbon emission induced by service industry.
Structural effects such as the greening of electricity generation and the growing
demand manifested in imported goods need to be seperatedly handled in order to
reveal the actual carbon impacts of service sector. Both structural changes distort
the environmental impacts of servitization that is underpinned by the constant
increase of material throughput in developed economies and CO2 emission
worldwide.
During the studied period substantial changes have occurred in electricity
generation portfolio in Hungary (see Figure 11). Liquid fuel consumption has
drastically declined in total by 91% from 2000 until 2008. Oil has a relatively
high carbon emission rate to other fuel types, thus its elimination has made an
enormous reduction in carbon emission. Similarly, coal-fired plants have been
equipped with gas turbines, which brought about a 28% decrease in total coal
consumption. At the same time, the role of natural gas in energy supply has
become more dominant and reached the level of nuclear power that has been more
or less constant during the period. Energy generated from waste and renewable
energy sources (mostly biomass) are the part of the electricity portfolio as of
2003. By 2008, the share of waste and renewables in electricity mix has reached
7%. These changes in energy mix are treated separately during the calculations.

106
Figure 11: Energy source consumption of power plants in Hungary (Source: MVM, 2012)
In Hungary, the share of Chinese products in total import is only around 11%
(KSH, 2014), but due to the inextricable trading systems of finished and
unfinished products resulting in re-imported and re-exported goods that are
difficult to be traced back. Thus, the actual volume of goods produced in China is
assumingly much higher than in the statistical database. To simplify the model
assumptions, the emission of imported goods is calculated using the energy
conversion rate for China.
The total imported volume to Hungary has multiplied during the last decade.
This can partly ascribed to the phaseout of heavy industries and manufacturing
after the transition, and partly due to the increase in consumption demand. The
delocalisation of dirty industries has substantially increased the import of
manufactured products; between 2000 and 2008 the imported volume has doubled
(from 22.43 Mt to 44.48 Mt). This indicates a substantial pull effect on imported
physical goods.
Therefore, it is hypothesized that the service sector is the major driver of total
CO2 emission (H4) and the largest share of CO2 emission generated by service
sector can be attributed to the pull effect on non-service industries (H5). These
hypotheses are tested and analysed using the dataset for the Hungarian economy.
0
20.000
40.000
60.000
80.000
100.000
120.000
140.000
160.000
180.000Te
rra
jou
le
Coal
Liquid fuel
Natural gas
Nuclear
Waste andrenewables
107
3. Methodology
3.1. Calculating the CO2 emission using Environmentally Extended Input-Output analysis
Servitization is usually measured through monetary values and not in physical
terms. Unfortunately, the availability of material flow data is very limited, which
makes the analysis of long-term structural changes impossible. Therefore, an
Environmentally Extended Input–Output (EEIO) analysis is used instead. EEIO
has become the most widely used tool in industrial ecology for conducting life
cycle assessment of different products and services (Suh and Kagawa, 2009).
Input-output model was originally introduced by Wassily Leontief in the 1930s
for the analysis of the relationship between different economic sectors based on
economic transactions. IO model has been extended in the course of time to
capture physical flows through sectorial interrelationships such as determining the
pollution or environmental load on national or regional scale (Wiedmann, 2009).
Although the model is still based on monetary units and not on actual material
flows the analysis can provide a useful estimation. In the IO approach economic
information are linked to environmental data and can then be used to calculate the
environmental impacts of products covering the whole supply chain (Junnila,
2008), which can therefore be used for life cycle assessment of a certain product.
Bicknell et al. (1998) introduced an environmentally extended input-output
(EEIO) framework for calculating the ecological footprint of economic activities
in New Zealand with adding to the conventional input–output table a vector that
expresses each sector’s impact in terms of a physical unit. They were the first to
introduce modified input–output analysis, incorporating it into the method of the
ecological footprint calculations. They proposed this method as an alternative to
calculate the ecological footprint in a consistent way using data collected as part
of the system of national accounts. The method is based on combining the
Leontief inverse with land multipliers representing the environmental input in the
system. The suggested environmentally extended input-output analysis proved to
be extremely useful for analysing a wide range of problems, achieving unexpected

108
level of popularity in environmental literature. Eurostat introduced this method
in its official reports and database proving the usefulness of the approach to
environmental policy analysis. The appeal of the method lies mainly in its ability
to go beyond producer responsibility and to capture and share the responsibility
between production and consumption in contributing to ecological problems
(Lenzen and Murray, 2001; Lenzen et al., 2007). It is also able to capture spill
over ecological impacts along the supply chain and push some responsibility from
upstream sectors to downstream industries inducing those impacts through the
multiplication effect.
Ferng (2009) argues against using land multipliers in ex ante input-output
analysis based scenario analysis. Such kind of analysis is based on two linear
assumptions, one of which does not hold: a change in sector’s output requires
proportional changes in its consumption of intermediate environmental inputs,
and also in the land providing such environmental inputs. Environmental
Leontief inverses represent the linear marginal effect of delivering one unit of
sector output to final demand on the required environmental ecological services, a
flow indicator, rather than on land, a stock indicator. This article follows
suggestions of Ferng (2009) by employing CO2 emission as an environmental
indicator rather than using carbon footprint based land multipliers.
There are conceptual and technical differences between IO models using
physical units in and monetary IO tables extended by a vector of physical factor
per unit of output. Apart from the discrepancies shown between the two concepts,
Weisz and Duchin (2006) concluded that if the two models operate with a single
price vector, they bring equivalent results. Thus, EEIO tables based on monetary
flows have been proven a very sufficient tool for analyzing environmental impacts
embedded in sectorial relationships within a country and have been used for
impact determination of different types of psychical flows (e.g. electricity use,
carbon emission, ecological footprint etc.).
According to the traditional IO analysis, the total output of an economy can be
expressed as the sum of intermediate consumption of sectors and of the final
demand (Leontief, 1970):

109
x = Ax + y or x =(I-A)-1
y=By (1)
aij = xij/Xj (2)
B = (I-A)-1
(3)
where Ax is the intermediate consumption of sectors and y represents the final
demand. A is also called transaction matrix or technical coefficient matrix
(Bicknell et al., 1998) that expresses the amount of inputs from sector i required
to increase the output of sector j by one unit of currency. The B matrix represents
the Leontief inverse matrix. The direct carbon intensity vector (DCIV) is
calculated by dividing the carbon emission data of sectors by the total output of
each sectors:
DCIV = Ej/Xj (4)
The total carbon intensity vector (TCIV) is calculated as follows:
TCIV = DCIV (I-A)-1
(5)
Total carbon intensity vector includes the embedded CO2 emission of each
economic sector. In the last step of the analysis the results of Equation (5) are
placed in a diagonal matrix and multiplied by the final demand. Final results show
the embedded carbon of each sector from life cycle assessment perspective. To
obtain the total carbon emission of sectors, the direct CO2 emission of final
demand is added to final results.
3.2. Structural Decomposition of the Input–Output Model
Structural decomposition analysis is applied in the IO framework in numerous
studies to identify different driving forces that contribute to changes in CO2
emissions over time (e.g. Peters et al., 2007; Su and Ang, 2012; Tian et al., 2013;
Brizga et al., 2014).
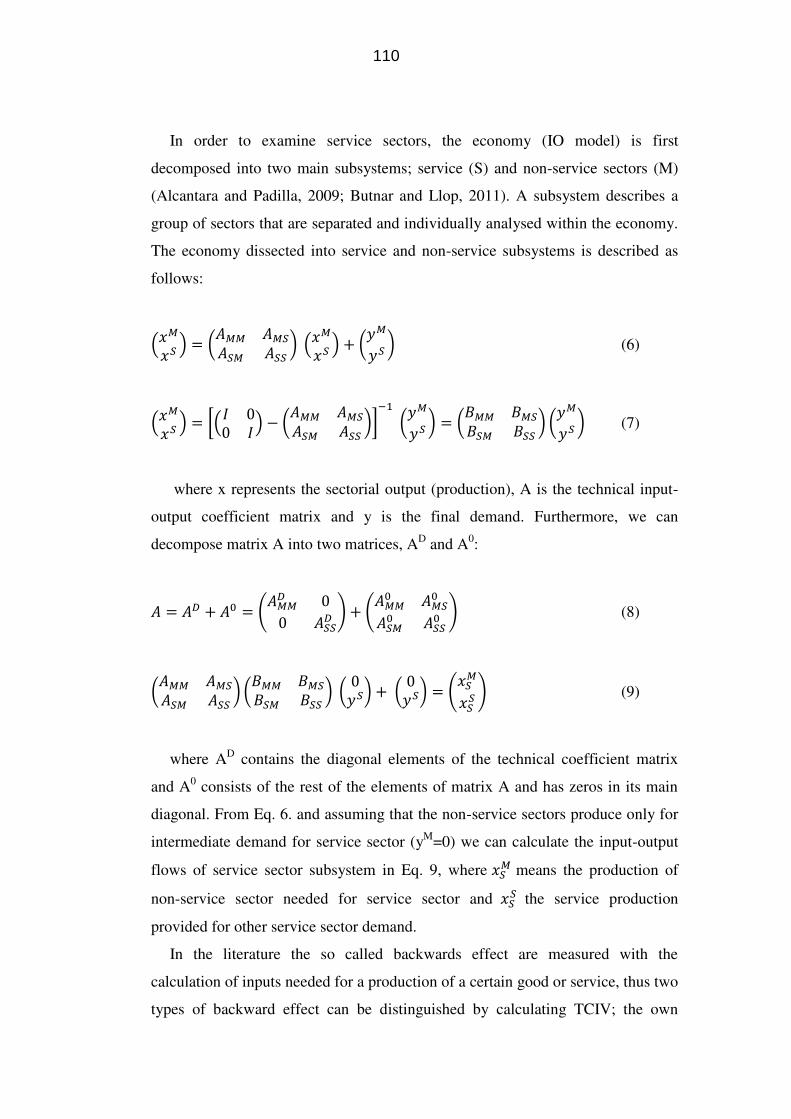
110
In order to examine service sectors, the economy (IO model) is first
decomposed into two main subsystems; service (S) and non-service sectors (M)
(Alcantara and Padilla, 2009; Butnar and Llop, 2011). A subsystem describes a
group of sectors that are separated and individually analysed within the economy.
The economy dissected into service and non-service subsystems is described as
follows:
� = ( �� �� ) � + ( �) (6)
� = [ � 00 � − ( �� �� )]− ( �) = ( �� �� ) ( �) (7)
where x represents the sectorial output (production), A is the technical input-
output coefficient matrix and y is the final demand. Furthermore, we can
decompose matrix A into two matrices, AD and A0:
= + = �� 00 + �� �� (8)
( �� �� ) ( �� �� ) ( 0 ) + ( 0 ) = � (9)
where AD contains the diagonal elements of the technical coefficient matrix
and A0 consists of the rest of the elements of matrix A and has zeros in its main
diagonal. From Eq. 6. and assuming that the non-service sectors produce only for
intermediate demand for service sector (yM=0) we can calculate the input-output
flows of service sector subsystem in Eq. 9, where � means the production of
non-service sector needed for service sector and the service production
provided for other service sector demand.
In the literature the so called backwards effect are measured with the
calculation of inputs needed for a production of a certain good or service, thus two
types of backward effect can be distinguished by calculating TCIV; the own
111
demand (OD) or own backward effect, which is characterised by the impact of
own outputs consumed in a certain industry, and the supply component (SC) or
pure backward effect, which shows the impact of all inputs taken from other
industries. Own demand share for service sector is calculated as follows:
= �� ′ (10)
and for the non-service sector
� = ���′ �� �� � (11)
Supply component (SC) can be expressed as follows:
� = ��′ �� �� �� �� ( �) (12)
The supply component of service sector can be decomposed in two main
components that allow us to examine the demand stemming from different type of
service (� ) and non-service (� �) sector. The non-service sector supply for
the production of services is also called the spill over component in the literature
(Alcantara and Padilla, 2009). The � expresses all inputs from other service
sectors except for electricity, gas, steam and air coinditioning supply that is also
known as the internal component (Butnar and Llop, 2011). To be able to seperate
the effect of changes in electricity mix, the electricity, gas, steam and air
coinditioning supply (EDS) is treated as a distinct component. In previous studies
the electricity supply has not been separated from other components, thus the
impact of change in electricity mix cannot be captured and followed up. It is
crucial to see, whether the technological change can purely be attributed to the
change in electricity mix or it is the result of a real technological development.
� = � � + � + (13)
112
� � = �� �′ �� � + � (14) � = �� ′ � � + (15)
To examine the CO2 emission from different types of services, the supply from
service sector is decomposed into five subgroups:
Supply from basic supply services (SCBSS)
Supply from transportation and trade activities (SCTTS)
Supply from entertainment and recreational services (SCRES)
Supply from knowledge-based services (SCKS)
Supply from other services (SCOS)
� = � � + � + � + � � + � � (16)
The separation of different service activities is aimed to provide a possible
channel of policy intervention. The first group of services contains basic supply
services that can be availed by everyone and serve public purposes such as
education, health care, electricity and water supply, etc. The second category
consists of all services that are related to transportation and trade. The third group
is for recreational and entertainment activities. The fourth group of services
embraces the typical knowledge-based sectors that usually create market value
without tangible outputs such as financial and banking activities. The fifth group
of activities contains all other services that cannot be classified into the above-
mentioned groups (these services are mainly related to households). The five
subgroups of service sector can be expressed as follows:
� � = ��� ′ � � + � (17) � = �� ′ � � + (18)
113
� = �� ′ � � + (19) � � = ��� ′ � � + � (20) � � = ��� ′ � � + � (21)
The third main component of the analysis is dependent on final demand of
services (y) and its degree is related to direct carbon emission intensity. It can be
calculated as:
= �� ′ (22)
The last component captures the role of service sector outputs that are utilized
as inputs for non-service sector. The feedback component is calculated as:
� = �� ′ � � (23)
Thus, the total carbon impact of services can be measured as the sum of the
above-mentioned components:
= + + � + � � + � + � (24)
114
3.3. Structural changes over time
To capture further factors that cause changes in service subsystem over time,
the structural decomposition analysis is extended as follows:
∆ = ∆ + +∆ + ∆� + ∆� � + ∆ � + ∆ � (25)
The symbol ∆ denotes the change over time that is calculated by deducting the
final value from the initial value. Applying the temporal decomposition technique
of the work by Butnar and Llop (2011), who followed Dietzenbacher and Los
(1998) suggestions, the change in final demand component is expressed as
follows:
∆ = �� ′ − �� ′ = ∆ �� ′ / + �� /′ ∆ (26)
The first term in the right-hand side of Eq. 26 shows the impact of change in
emission intensity (emission element, EE) and the second part of the equation
depicts the impact of change in final demand (demand element, DE). Similarily,
the other components can be decomposed as well. The temporal changes in supply
and feedback components are expressed as follows (Butnar and Llop, 2011):
∆� � = �� �′( �� � + � ) − �� �′( �� � + � ) =∆[ �� �′ �� � + � ] + �� /′ �� / � / + � / / ∆
(27)
∆� = �� ′( �� � + � ) − �� ′( �� � + � ) = = ∆[ �� ′ �� � + � ] / + �� /′ �� / � / + � / / ∆
(28)

115
� = �� ′ � � − �� ′ � � = ∆[ �� ′ � � ] / + �� /′ � / � / ∆ (29)
The first term on the right-hand side of Eq. 27, 28, and 29 capture the
technological changes that reflect the change in embedded emission. Hereafter it
is called the technological element (TE). The second term in the equation refers to
the change in final demand, so hereafter it is called the demand element (DE).
For measuring the carbon embodiment of services, a symmetric Input-Output
table has been used that is extracted from the EUROSTAT database (2014). Data
for 2008 have been chosen to investigate the carbon effects of servitization on the
Hungarian economy to avoid the temporary downturn caused by the economic
crisis in subsequent years. Data for sectorial carbon emissions are provided by the
Hungarian Central Statistical Office (KSH) database. Import data are extracted
from the Eurostat database (2014) and the embedded CO2 emission rates for
different products are gained from the Global Footprint Network database (GFN,
2008).
4. Results
4.1. The embedded emission of service sector in Hungary
Figure 12 depicts the summary of total carbon emission in Hungary for 2008.
The total carbon emission accounts for 113.13 MtCO2 in 2008 that is the sum of
domestic emission (51.57 MtCO2) and the embedded emission of imported goods
(61.56 MtCO2). It has to be noted that the emission of imported services are not
incorporated in the analysis due to lack of data.
The share of carbon emission generated by final demand amounts to 56.26
MtCO2 that almost covers the 50% of total carbon emission. Investment activities
are responsible for the other half of CO2 emission that cannot be analyzed in-
depth in this study due to the lack of data. Results show that non-service sector

116
accounts for only 38% of carbon emission and the rest can be attributed to service
sector. The major emitter among services is not surprisingly the Electricity, gas,
steam and air conditioning supply (11.08 MtCO2) followed by Basic supply
services (9.77 MtCO2). The share of Transportation and trade (8.47 MtCO2)
stands only on the third place, because it excludes the direct emission generated
by transport activities by households (3.33 MtCO2). Total emission can be split
into two main parts; direct and embedded emission. Direct emission shows the
amount of CO2 directly emitted by a certain sector during its core activity. The
embedded emission represents the CO2 emission occurring through the entire
industrial supply chain up to the final demand (Wiedmann et al., 2009).
Manufacturing sectors show usually high direct carbon intensity that expresses
the specific emission with respect to the total output. This is confirmed by the
average carbon multiplier (total/direct carbon intensity) that is among
manufacturing sectors is only 2.10 (see Table 25 in Appendix). The most carbon-
intensive sectors are highlighted; Forestry and logging, Manufacture of other
transport equipment, Manufacture of chemicals and chemical products, Mining
and quarrying and Manufacture of paper and paper products.
Figure 12: Total carbon emission in Hungary by sector in 2008
Non-service sector 38%
Electricity, gas, steam and air conditioning
supply 20%
Basic supply 17%
Transportation and trade
15%
Entertainment and recreation
5%
Knowledge-based
services 4%
Other services 1%
117
In contrast to non-service sector, the embedded emission of service sector
shows rather a mixed picture; while services have very low (almost zero) direct
carbon intensities, their total carbon intensities vary to a great extent (see Table
16). With respect to direct emission levels, the major carbon impact can be
attributed to the Electrcitiy, gas, steam and air conditioning supply and
transportation activities. All other sectors lag way behind regarding direct
emissions. If we only consider direct impacts, we can observe that recreational
and entertainment services as well as Knowledge-based sectors possess a close to
zero direct emission. However, if we look at embedded emissions and the carbon
multiplier of services such as Travel agency activties, Accommodation and food
services and Creative, arts and entertainment and sport activities, we can see huge
differences. Knowledge-based services are foreseen as the major drivers of
modern economies and are also regarded as potential sectors that are able to
contribute to lower CO2 emission. However, Real estate activities as well as
Publishing and advertising and market research have an enormous carbon
multiplication effect.

118
Table 19: Direct and total carbon intensities and emissions of service sectors in 2008
DCIV TCIV
Direct
emission
Embedded
emission
Total emission
by final
demand
ktCO2/ Mio. NAC
ktCO2/ Mio. NAC
ktCO2/year ktCO2/year ktCO2/year
Electricity, gas, steam and air conditioning 10.23 11.69 5,064.38 6,010.94 11,075.32 Basic supply services
Water collection, treatment and supply, sewage, waste mangement services
1.78 3.91 205.06 449.50 654.56
Sewerage; waste collection, treatment and disposal activities 1.78 3.03 192.27 326.52 518.79
Postal and courier activities 1.54 2.08 58.36 78.76 137.12
Public administration and defence 0.16 0.76 395.59 1870.56 2,266.15 Education 0.79 1.39 1,051.21 1,834.49 2,885.69 Human health and social work activities 0.68 1.64 967.66 2336.88 3,304.54 Transportation and trade
Wholesale and retail trade and repair of motor vehicles and motorcycles
0.01 1.17 13.36 2,679.17 2,692.54
Land transport and transport via pipelines 5.08 6.10 2,366.48 2,841.22 5,207.70 Water transport 0.00 0.68 0.00 2.99 2.99 Air transport 2.64 3.64 201.77 278.42 480.18
Warehousing and support activities for transportation 0.00 0.91 0.00 89.04 89.04
Recreation and entertainment Accommodation and food service activities 0.07 1.90 65.67 1,727.66 1,793.33 Travel agency, tour operator reservation service and related activities
0.01 2.12 0.53 141.44 141.98
Creative, arts and entertainment and sport activities 0.05 1.19 23.23 569.21 592.44 Motion picture, video and television programme production, sound recording and music
0.16 0.65 9.41 37.04 46.45

119
Knowledge-based services
Publishing activities 0.16 1.40 14.79 126.53 141.31 Telecommunications 0.16 0.74 84.57 383.95 468.53 Computer programming, consultancy; repair of computer and household goods
0.16 0.66 1.60 6.47 8.07
Financial service activities, insurance, reinsurance and pension funding
0.03 0.48 20.07 306.73 326.80
Real estate activities, rental and leasing 0.01 0.49 23.68 1,166.68 1,190.36 Legal and accounting activities 0.07 0.63 1.71 14.50 16.21 Architectural and engineering activities 0.07 0.85 0.77 8.83 9.60 Scientific research and development, advertising and market research
0.07 0.73 3.75 37.35 41.10
Other professional, scientific and technical activities 0.07 0.81 1.13 12.33 13.46 Other services
Security and investigation activities; services to buildings and landscape activities
0.01 0.75 0.27 24.89 25.16
Employment activities 0.01 0.42 0.00 0.05 0.05 Repair of computers and personal and household goods 0.06 1.02 1.68 28.12 29.81 Other personal service activities 0.06 0.89 20.07 291.55 311.62
Activities of households as employers 20.59 20.59 63.83 63.83 127.66
Activities of membership organisations 0.06 0.88 10.65 152.59 163.25 Total service sector 10,863.57 23,898.22 34,761.79
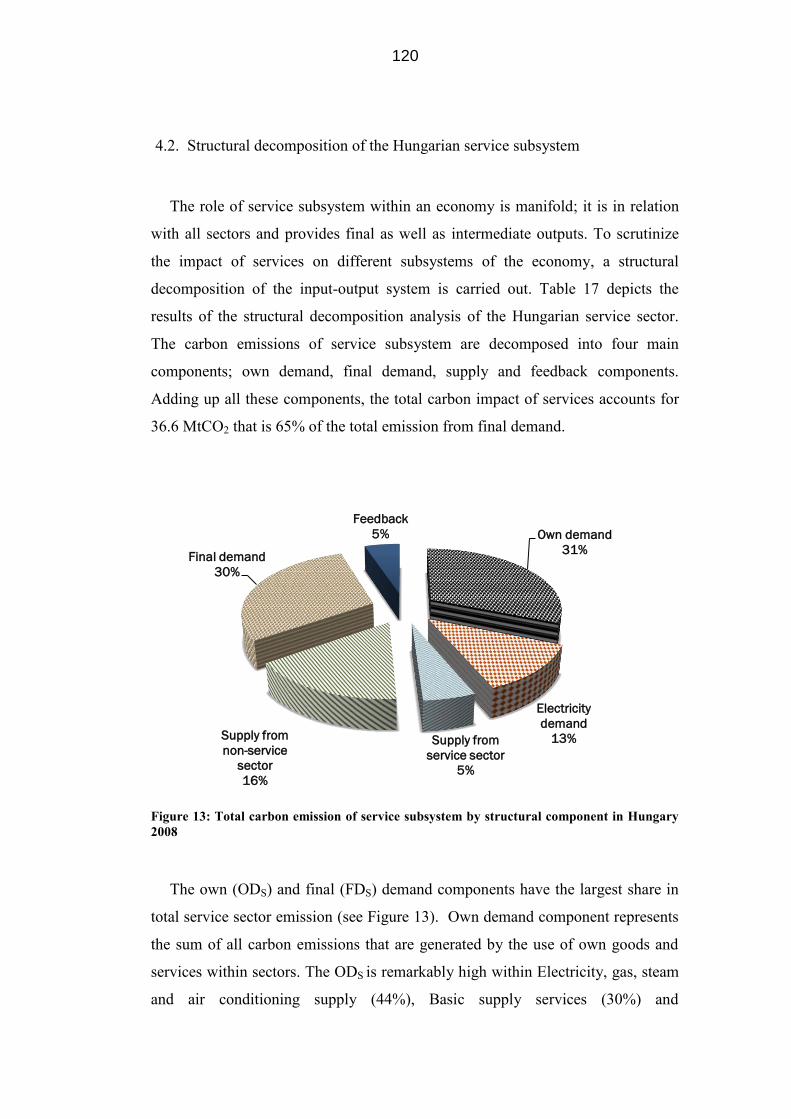
120
4.2. Structural decomposition of the Hungarian service subsystem
The role of service subsystem within an economy is manifold; it is in relation
with all sectors and provides final as well as intermediate outputs. To scrutinize
the impact of services on different subsystems of the economy, a structural
decomposition of the input-output system is carried out. Table 17 depicts the
results of the structural decomposition analysis of the Hungarian service sector.
The carbon emissions of service subsystem are decomposed into four main
components; own demand, final demand, supply and feedback components.
Adding up all these components, the total carbon impact of services accounts for
36.6 MtCO2 that is 65% of the total emission from final demand.
Figure 13: Total carbon emission of service subsystem by structural component in Hungary
2008
The own (ODS) and final (FDS) demand components have the largest share in
total service sector emission (see Figure 13). Own demand component represents
the sum of all carbon emissions that are generated by the use of own goods and
services within sectors. The ODS is remarkably high within Electricity, gas, steam
and air conditioning supply (44%), Basic supply services (30%) and
Own demand 31%
Electricity demand
13% Supply from service sector
5%
Supply from non-service
sector 16%
Final demand 30%
Feedback 5%
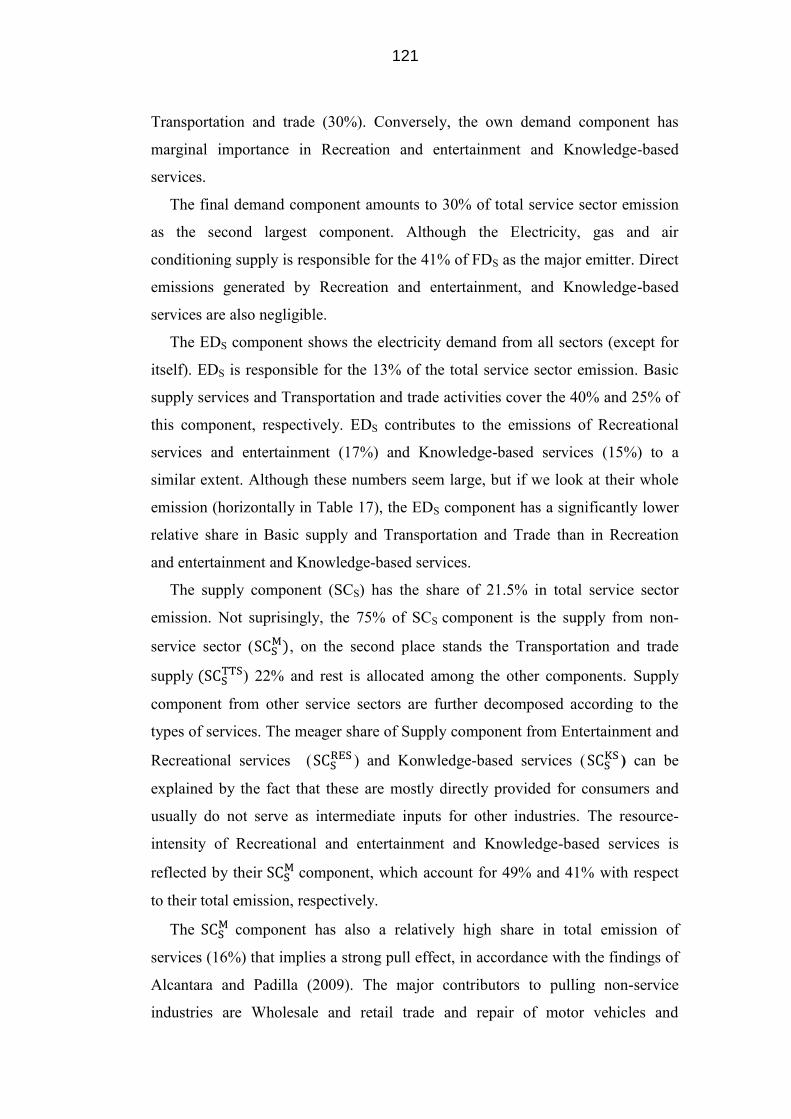
121
Transportation and trade (30%). Conversely, the own demand component has
marginal importance in Recreation and entertainment and Knowledge-based
services.
The final demand component amounts to 30% of total service sector emission
as the second largest component. Although the Electricity, gas and air
conditioning supply is responsible for the 41% of FDS as the major emitter. Direct
emissions generated by Recreation and entertainment, and Knowledge-based
services are also negligible.
The EDS component shows the electricity demand from all sectors (except for
itself). EDS is responsible for the 13% of the total service sector emission. Basic
supply services and Transportation and trade activities cover the 40% and 25% of
this component, respectively. EDS contributes to the emissions of Recreational
services and entertainment (17%) and Knowledge-based services (15%) to a
similar extent. Although these numbers seem large, but if we look at their whole
emission (horizontally in Table 17), the EDS component has a significantly lower
relative share in Basic supply and Transportation and Trade than in Recreation
and entertainment and Knowledge-based services.
The supply component (SCS) has the share of 21.5% in total service sector
emission. Not suprisingly, the 75% of SCS component is the supply from non-
service sector (SCM , on the second place stands the Transportation and trade
supply SC ) 22% and rest is allocated among the other components. Supply
component from other service sectors are further decomposed according to the
types of services. The meager share of Supply component from Entertainment and
Recreational services (SC E ) and Konwledge-based services (SCK ) can be
explained by the fact that these are mostly directly provided for consumers and
usually do not serve as intermediate inputs for other industries. The resource-
intensity of Recreational and entertainment and Knowledge-based services is
reflected by their SCM component, which account for 49% and 41% with respect
to their total emission, respectively.
The SCM component has also a relatively high share in total emission of
services (16%) that implies a strong pull effect, in accordance with the findings of
Alcantara and Padilla (2009). The major contributors to pulling non-service
industries are Wholesale and retail trade and repair of motor vehicles and

122
motorcycles and Accomodation and food service activities having the share of
19% and 17% from the component, respectively. In total, 28% of CO2 emission
from all non-service sectors is generated due to the pull effect of service activities
(and its share in total final demand is 11%). As for transportation, these sectors
have marginal importance in pull effect; Land transport amounts to only 4.6% of
the total SCM component.
The feedback component (FB refers to the supply provided by service for
non-service sector. Its significance is minor compared to the other components
accounting for 5% in total emission form service sector. Electricity, gas, steam
and air conditioning supply is responsible for the 70% of FB component. The
role of Recreation and entertainment as well as Knowledge-based services is also
negligible in providing inputs for non-service industries accounting for only 1% in
the total service sector emission.
123
Table 20: Structural decomposition of Hungarian service sector in 2008
ktCO2/year � �
�
�
Total
Electricity, gas, steam and air
conditioning supply 5,436.92 0.00 10.71 118.26 0.27 5.09 0.15 439.54 5,064.39 1,306.10 12,381.42
Basic supply services 2,984.87 1,802.64 155.62 295.26 4.74 41.93 1.35 1,610.30 2,870.15 69.87 9,836.72
Water collection, treatment and supply
208.95 151.56 5.68 9.30 0.08 1.38 0.06 72.49 205.06 13.37 667.93
Sewerage; waste collection, treatment and disposal activities
212.28 38.70 2.58 15.74 0.06 0.91 0.03 56.24 192.27 34.01 552.80
Postal and courier activities 61.31 5.47 0.33 4.41 0.03 0.30 0.01 6.92 58.36 12.80 149.92
Public administration and defence 405.63 754.72 85.10 128.13 2.04 20.75 0.46 473.72 395.59 3.00 2269.15
Education 1,082.34 419.73 23.76 56.40 0.76 9.82 0.25 241.43 1051.21 4.12 2,889.81
Human health and social work activities
1,014.37 432.46 38.17 81.30 1.78 8.78 0.54 759.50 967.66 2.57 3,307.11
Transportation and trade 2,644.44 1,140.68 79.85 503.45 4.80 37.70 1.25 1,478.67 2581.61 463.68 8,936.13
Wholesale and retail trade and repair of motor vehicles and motorcycles
13.76 995.25 68.70 491.56 4.37 32.57 1.10 1,160.91 13.36 1.65 2,783.23
Land transport and transport via pipelines
2,424.69 127.73 9.53 3.10 0.35 4.31 0.13 271.40 2,366.48 452.38 5,660.08
Water transport 0.00 0.74 0.06 0.47 0.00 0.05 0.00 1.67 0.00 0.00 2.99
Air transport 205.99 16.97 1.56 8.32 0.09 0.78 0.03 44.69 201.77 9.64 489.83
Recreation and entertainment 104.52 775.80 56.49 243.96 5.63 18.12 0.78 1,270.03 98.85 3.53 2,577.72
Accommodation and food service activities
68.37 463.67 29.54 130.49 1.23 8.87 0.52 1,024.96 65.67 0.44 1,793.77
Travel agency, tour operator reservation service and related activities
0.55 23.81 2.65 66.74 2.41 0.54 0.04 44.70 0.53 0.03 142.00
Creative, arts and entertainment and sport activities
24.74 277.73 23.49 43.27 1.96 7.66 0.20 190.15 23.23 0.18 592.62
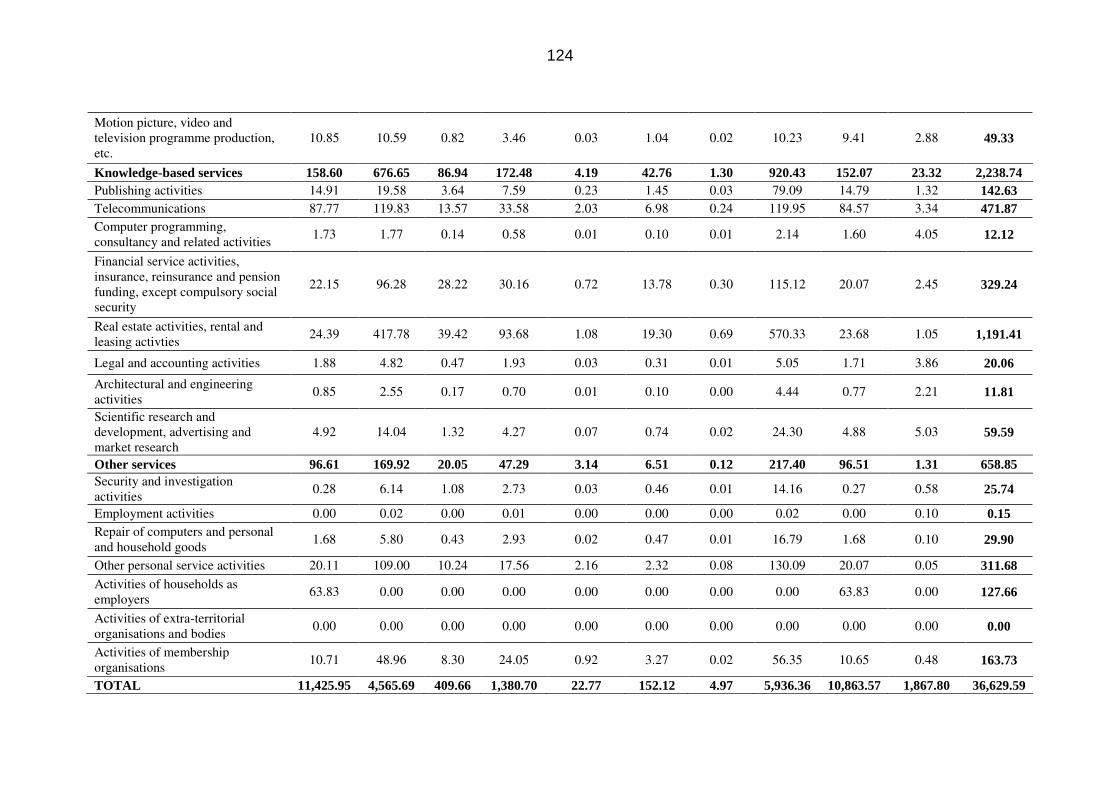
124
Motion picture, video and television programme production, etc.
10.85 10.59 0.82 3.46 0.03 1.04 0.02 10.23 9.41 2.88 49.33
Knowledge-based services 158.60 676.65 86.94 172.48 4.19 42.76 1.30 920.43 152.07 23.32 2,238.74
Publishing activities 14.91 19.58 3.64 7.59 0.23 1.45 0.03 79.09 14.79 1.32 142.63
Telecommunications 87.77 119.83 13.57 33.58 2.03 6.98 0.24 119.95 84.57 3.34 471.87
Computer programming, consultancy and related activities
1.73 1.77 0.14 0.58 0.01 0.10 0.01 2.14 1.60 4.05 12.12
Financial service activities, insurance, reinsurance and pension funding, except compulsory social security
22.15 96.28 28.22 30.16 0.72 13.78 0.30 115.12 20.07 2.45 329.24
Real estate activities, rental and leasing activties
24.39 417.78 39.42 93.68 1.08 19.30 0.69 570.33 23.68 1.05 1,191.41
Legal and accounting activities 1.88 4.82 0.47 1.93 0.03 0.31 0.01 5.05 1.71 3.86 20.06
Architectural and engineering activities
0.85 2.55 0.17 0.70 0.01 0.10 0.00 4.44 0.77 2.21 11.81
Scientific research and development, advertising and market research
4.92 14.04 1.32 4.27 0.07 0.74 0.02 24.30 4.88 5.03 59.59
Other services 96.61 169.92 20.05 47.29 3.14 6.51 0.12 217.40 96.51 1.31 658.85
Security and investigation activities
0.28 6.14 1.08 2.73 0.03 0.46 0.01 14.16 0.27 0.58 25.74
Employment activities 0.00 0.02 0.00 0.01 0.00 0.00 0.00 0.02 0.00 0.10 0.15
Repair of computers and personal and household goods
1.68 5.80 0.43 2.93 0.02 0.47 0.01 16.79 1.68 0.10 29.90
Other personal service activities 20.11 109.00 10.24 17.56 2.16 2.32 0.08 130.09 20.07 0.05 311.68
Activities of households as employers
63.83 0.00 0.00 0.00 0.00 0.00 0.00 0.00 63.83 0.00 127.66
Activities of extra-territorial organisations and bodies
0.00 0.00 0.00 0.00 0.00 0.00 0.00 0.00 0.00 0.00 0.00
Activities of membership organisations
10.71 48.96 8.30 24.05 0.92 3.27 0.02 56.35 10.65 0.48 163.73
TOTAL 11,425.95 4,565.69 409.66 1,380.70 22.77 152.12 4.97 5,936.36 10,863.57 1,867.80 36,629.59
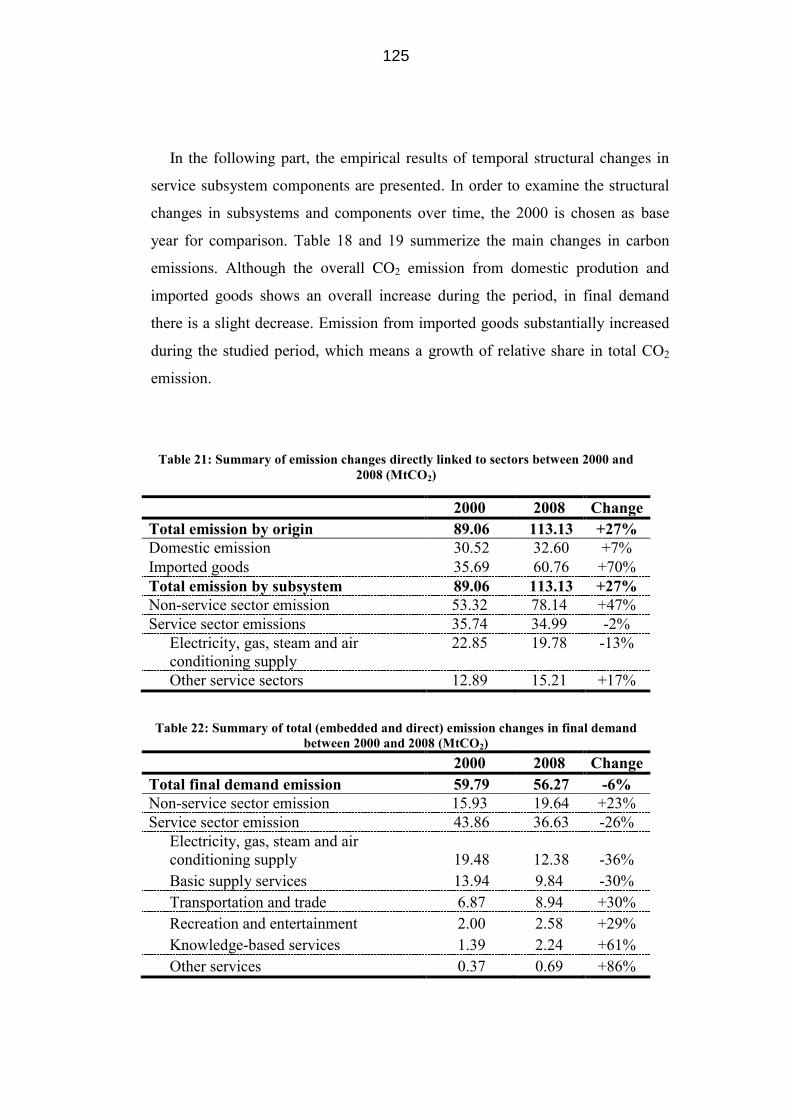
125
In the following part, the empirical results of temporal structural changes in
service subsystem components are presented. In order to examine the structural
changes in subsystems and components over time, the 2000 is chosen as base
year for comparison. Table 18 and 19 summerize the main changes in carbon
emissions. Although the overall CO2 emission from domestic prodution and
imported goods shows an overall increase during the period, in final demand
there is a slight decrease. Emission from imported goods substantially increased
during the studied period, which means a growth of relative share in total CO2
emission.
Table 21: Summary of emission changes directly linked to sectors between 2000 and
2008 (MtCO2)
2000 2008 Change
Total emission by origin 89.06 113.13 +27%
Domestic emission 30.52 32.60 +7% Imported goods 35.69 60.76 +70% Total emission by subsystem 89.06 113.13 +27%
Non-service sector emission 53.32 78.14 +47% Service sector emissions 35.74 34.99 -2%
Electricity, gas, steam and air conditioning supply
22.85 19.78 -13%
Other service sectors 12.89 15.21 +17%
Table 22: Summary of total (embedded and direct) emission changes in final demand
between 2000 and 2008 (MtCO2)
2000 2008 Change
Total final demand emission 59.79 56.27 -6%
Non-service sector emission 15.93 19.64 +23% Service sector emission 43.86 36.63 -26%
Electricity, gas, steam and air conditioning supply 19.48 12.38 -36% Basic supply services 13.94 9.84 -30% Transportation and trade 6.87 8.94 +30% Recreation and entertainment 2.00 2.58 +29% Knowledge-based services 1.39 2.24 +61% Other services 0.37 0.69 +86%
126
If we only take into account emissions directly linked to sectors, the share of
service sector has a much lower significance. In Table 19 the summary of
structural decomposition analysis are shown. The decline of service sector
emission can primarily be ascribed to the cleaning of electricity generation and
secondly to Basic supply services, whereas in all other services huge increase
can be observed.
Table 20 and 21 show the structural changes in components over time in
selected service sectors. In the European Union, the NACE classification
(Statistical classification of economic activities in the European Community) is
uniformly used. For the year 2000, the economic activities are classified
according to the first version (NACE rev.1.) that contains 59 industries, whereas
the new revised version (NACE rev. 2.) applies 64 industries (Eurostat, 2008).
Thus, only the identical industries (and some of them in aggregated form) are
compared. Table 21 shows the elements of the main components that are
identified as the major drivers of changes over time as discussed in Section 3.3.
Results indicate a major decline in Electricity, gas, steam and air conditioning
supply during these years. Altogether the overall CO2 emission generated by this
sector has been reduced by 36% from 2000 to 2008. The greening of electricity
generation can be caught in own demand component that shows the major
decline. Similarly, the final demand component significantly lowered the whole
sectorial emission that is purely the result of the change in emission element
(EE) that reflects the negative change in direct emission from electricity
generation. The demand element (DE) of final demand component indicates, on
the other hand, a significant increase in electricity consumption.
An enormous positive change in carbon emission can be detected in Land
transport during the period; its CO2 emission has been risen by 38% compared to
the level in 2000, mainly due to the increase in final demand and own demand
components. In final demand component the DE exceeds the EE almost three
times, there is a little technological improvement, but its increase can mostly be
attributed to the increasing demand. CO2 emission from air transport has risen by
75% that is also the consequence of growing demand. However, the
deregulation, market entry of low-cost carriers, increased destinations available
to consumers led to downward prices (Eurostat, 2014).
127
As for Accomodation and food services, results show that this sector has
been risen by 50% during the period. Its SCM component contributes the most to
the whole sectorial increase, whereas the DE of final demand component shows
only a little growth referring to an inefficient change in supply management of
Accomodation and food services. Recreational, cultural and sporting services
show a moderate change (+11%) during the period that can be explained by the
increased ED and SCM components. The dominant role of SCM component in
both Recreation and entertainment confirms the importance of pull effect on
productive sectors.
Basic supply services such as Public administration and defence, Education,
Health and social work activities have gone through significant changes, they
show a reduction in their total CO2 emission by 18%, 23%, 21%, respectively,
which are result of the reduction in own component and the emission and
technological elements of final demand and supply from other services.

128
Table 23: Total CO2 emission changes in the service subsystem by components between 2000 and 2008
ktCO2 ∆� ∆ ∆ ∆ ∆ � ∆ � Total Change
Electricity, gas, steam and air conditioning supply
-3,442.55 0.00 -3,144.10 14.67 93.99 -625.10 -7,103.08 -36%
Water collection, treatment and supply
-216.50 -50.29 -212.84 3.08 34.52 -23.42 -465.45 -41%
Sewerage; waste collection, treatment and disposal activities
-302.81 -41.34 -321.64 -1.93 3.34 -18.95 -683.34 -55%
Public administration and defence; compulsory social security
-151.60 -201.45 -150.43 37.99 -5.92 -3.05 -474.47 -16%
Education -363.00 -102.58 -369.80 -25.11 27.96 -7.47 -840.00 -23%
Health and social work services -360.60 -110.90 -343.57 -18.20 -34.38 -10.53 -878.19 -21%
Land transport and transport via pipelines
771.90 -111.75 750.77 -16.66 7.56 144.32 1,546.14 +38%
Water transport -0.66 -2.08 -0.65 -0.91 -2.38 -0.12 -6.79 -69%
Air transport 90.77 5.69 87.65 2.05 19.34 4.17 209.66 +75%
Wholesale and retail trade and repair of motor vehicles and motorcycles
-12.12 -10.49 -12.09 -18.24 248.33 -1.74 193.65 +11%
Accommodation and food services -9.58 42.53 -8.55 63.27 514.66 -1.23 601.10 +50%
Recreational, cultural and sporting services
0.38 40.62 0.61 -24.75 41.02 -1.32 56.55 +11%
Real estate activities -10.98 31.37 -11.43 20.23 90.82 -0.09 119.91 +12%
Scientific research and development -16.61 -22.43 -16.57 -4.59 -14.12 -2.03 -76.34 -48%
Computer programming, consultancy and related activities
1.36 1.59 1.24 0.72 1.82 -2.79 3.94 +48%
Financial service activities, insurance and pension funding
4.98 41.60 4.92 21.38 68.76 -0.59 141.05 +75%
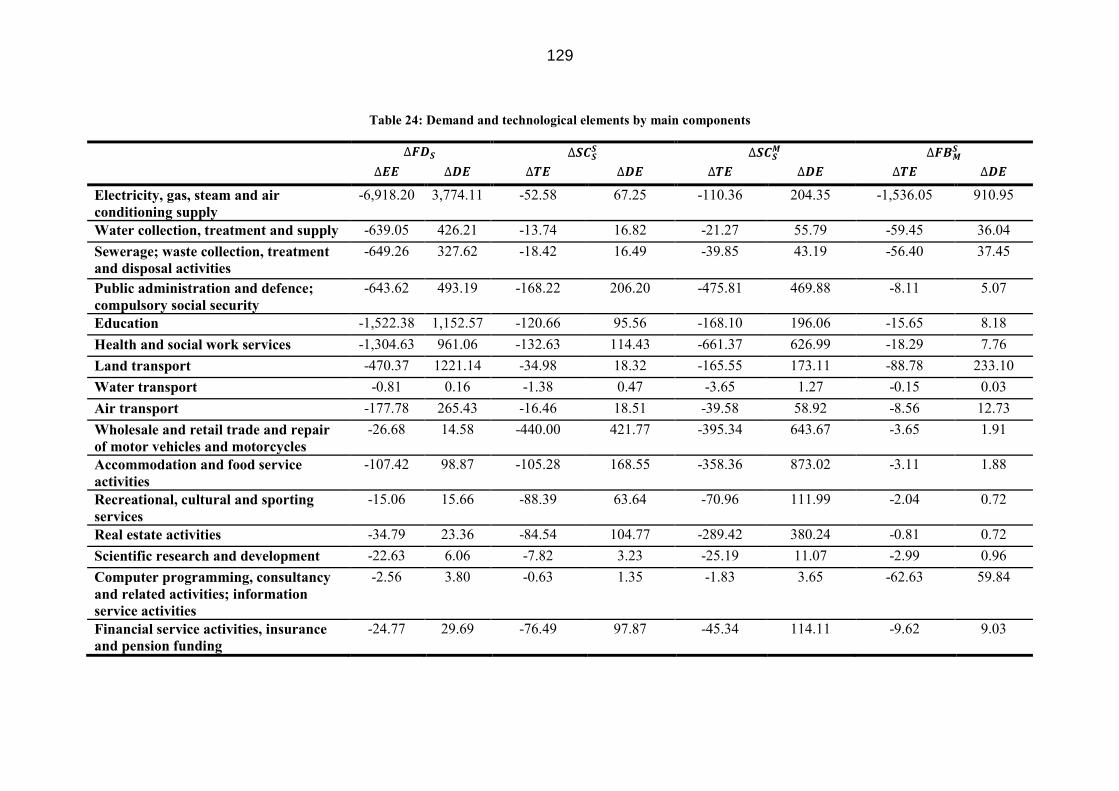
129
Table 24: Demand and technological elements by main components
∆ ∆ ∆ � ∆ �
∆ ∆ ∆ ∆ ∆ ∆ ∆ ∆
Electricity, gas, steam and air
conditioning supply
-6,918.20 3,774.11 -52.58 67.25 -110.36 204.35 -1,536.05 910.95
Water collection, treatment and supply -639.05 426.21 -13.74 16.82 -21.27 55.79 -59.45 36.04
Sewerage; waste collection, treatment
and disposal activities
-649.26 327.62 -18.42 16.49 -39.85 43.19 -56.40 37.45
Public administration and defence;
compulsory social security
-643.62 493.19 -168.22 206.20 -475.81 469.88 -8.11 5.07
Education -1,522.38 1,152.57 -120.66 95.56 -168.10 196.06 -15.65 8.18
Health and social work services -1,304.63 961.06 -132.63 114.43 -661.37 626.99 -18.29 7.76
Land transport -470.37 1221.14 -34.98 18.32 -165.55 173.11 -88.78 233.10
Water transport -0.81 0.16 -1.38 0.47 -3.65 1.27 -0.15 0.03
Air transport -177.78 265.43 -16.46 18.51 -39.58 58.92 -8.56 12.73
Wholesale and retail trade and repair
of motor vehicles and motorcycles
-26.68 14.58 -440.00 421.77 -395.34 643.67 -3.65 1.91
Accommodation and food service
activities
-107.42 98.87 -105.28 168.55 -358.36 873.02 -3.11 1.88
Recreational, cultural and sporting
services
-15.06 15.66 -88.39 63.64 -70.96 111.99 -2.04 0.72
Real estate activities -34.79 23.36 -84.54 104.77 -289.42 380.24 -0.81 0.72
Scientific research and development -22.63 6.06 -7.82 3.23 -25.19 11.07 -2.99 0.96
Computer programming, consultancy
and related activities; information
service activities
-2.56 3.80 -0.63 1.35 -1.83 3.65 -62.63 59.84
Financial service activities, insurance
and pension funding
-24.77 29.69 -76.49 97.87 -45.34 114.11 -9.62 9.03
130
5. Summary
This study applies an environmentally extended input-output model combined
with a structural decomposition analysis to examine the carbon impacts of the
Hungarian service sector. The decomposition method allows us to identify
structural effects associated with intersectorial relations to obtain a more
complex picture of the overall impact of service activities.
The EEIO revealed the total (direct and embedded) emissions of different
sectorial activities. The total emissions from non-service industries are
characterized by the dominance of direct emission. In case of services the ratio is
reversed, their direct emission has only a marginal share in total emission
(except for electricity generation and transportation). Figure 14 summerizes the
main results of EEIO analysis. Both non-service and service industries have
various total carbon intensities. Non-service sectors have a relatively small share
(<5%) in total CO2 emission (except for the Manufacture of food products, 13%)
and relatively higher carbon intensities on average compared to service sectors
(carbon intensities are more than 1.5 ktCO2/Mio.NAC in all cases). The total
carbon intensities of services have a higher deviation. Not surprisingly,
electricity generation has the biggest share in total emission and one of the
highest total carbon intensities as well among all industries. Land transport has
medium values with regard to carbon intensity and share in total CO2 emission.
The rest of services are scattered around 0-4 ktCO2/Mio.NAC and 0-6% share in
total CO2 emission. These results are in line with the findings of Suh (2006).
In order to analyse the service subsystem in-depth, six groups of services are
defined based on possible channels of policy intervention; (1) Electricity, gas,
steam and air conditioning supply (2) Basic supply services, (3) Transportation
and trade, (4) Recreation and entertainment, (5) Knowledge-based services and
(6) Other services. By means of this separation, we could obtain a more detailed
picture about the variety of carbon impacts across different type of services.
Non-service sector and Electricity generation are responsible for more than 50%
of total final demand emission.

131
Figure 14: Summary of CO2 impact of the Hungarian service and non-service sector (2008)
The structural decomposition of the EEIO model is used to identify the major
drivers of CO2 emissions across intersectorial relationships. Six main
components are taken into account during the calculations: own demand, final
demand, electricity demand, supply from service and non-service sectors and
feedback components. The reason why electricity supply is separated from basic
supply component is that electricity generation in Hungary has gone through
substantial changes between 2000-2008, thus its separation is needed to detect
real (de)carbonisation effects of the other sectors.
In total, the service sector accounts for the 65% of total final demand
emission in 2008. Figure 15 depicts the distrbution of components within the
major service groups. Emissions from Electricity supply are dominated by own
and final demand components. The proportion of components is similar in case
of Basic supply services and Transportation and trade, though final and own
demand components have still the largest share. The sector groups Recreation
and entertainment and Knowledge-based services’ major CO2 drivers are EDS
and SCM.
0%
5%
10%
15%
20%
25%
0 5 10 15
Sh
are
in t
ota
l CO
2 e
mis
sio
n
Total carbon intensity (ktCO2/Mio.NAC)
Service sector
Non-service sector

132
Figure 15: Distribution of structural components in main service groups, 2008
The own and final demand components have the largest share in total CO2
emission of service subsystem, altogether they amount to the 60% of service
sector emission. Supply from non-service sector and Electricity demand are
responsible for the 30% of service subsystem emission.
Temporal structural changes are also elaborated between 2000-2008. Results
reveal an increase (+27%) in overall CO2 emissions during the studied period,
which can mainly be attributed to the growing import share in national
consumption. A significant decrease (-26%) can be observed in service sector,
though it is primarily the consequence of greening electricity mix during the
studied period. On the other hand, an enormous emission increase can be
observed in Transportation and trade and also among Recreation and
entertainment as well as Konwledge-based services. Although latter two
sectorial groups have less significance in total CO2 emission, but their relative
growth is remarkable.
0%
10%
20%
30%
40%
50%
60%
70%
80%
90%
100%Supply from non-services
Supply from services
Feedback
Electricity demand
Final demand
Own demand
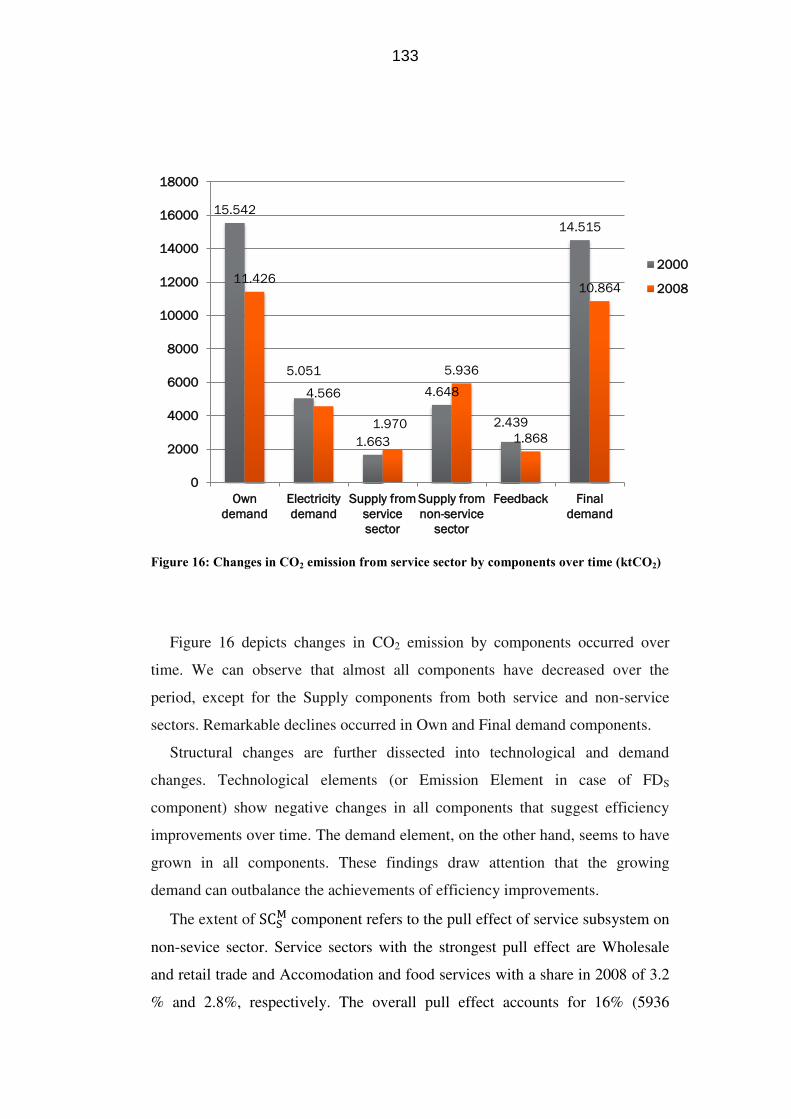
133
Figure 16: Changes in CO2 emission from service sector by components over time (ktCO2)
Figure 16 depicts changes in CO2 emission by components occurred over
time. We can observe that almost all components have decreased over the
period, except for the Supply components from both service and non-service
sectors. Remarkable declines occurred in Own and Final demand components.
Structural changes are further dissected into technological and demand
changes. Technological elements (or Emission Element in case of FDS
component) show negative changes in all components that suggest efficiency
improvements over time. The demand element, on the other hand, seems to have
grown in all components. These findings draw attention that the growing
demand can outbalance the achievements of efficiency improvements.
The extent of SCM component refers to the pull effect of service subsystem on
non-sevice sector. Service sectors with the strongest pull effect are Wholesale
and retail trade and Accomodation and food services with a share in 2008 of 3.2
% and 2.8%, respectively. The overall pull effect accounts for 16% (5936
15.542
5.051
1.663
4.648
2.439
14.515
11.426
4.566
1.970
5.936
1.868
10.864
0
2000
4000
6000
8000
10000
12000
14000
16000
18000
Owndemand
Electricitydemand
Supply fromservicesector
Supply fromnon-service
sector
Feedback Finaldemand
2000
2008
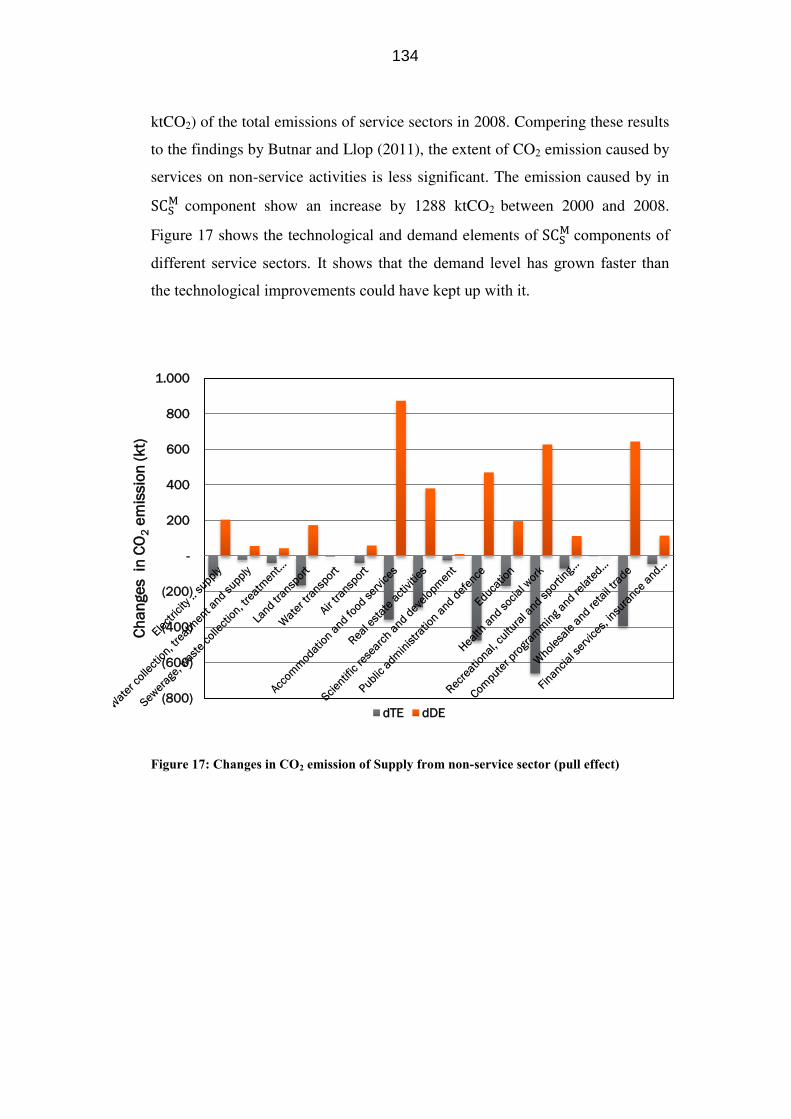
134
ktCO2) of the total emissions of service sectors in 2008. Compering these results
to the findings by Butnar and Llop (2011), the extent of CO2 emission caused by
services on non-service activities is less significant. The emission caused by in SCM component show an increase by 1288 ktCO2 between 2000 and 2008.
Figure 17 shows the technological and demand elements of SCM components of
different service sectors. It shows that the demand level has grown faster than
the technological improvements could have kept up with it.
Figure 17: Changes in CO2 emission of Supply from non-service sector (pull effect)
(800)
(600)
(400)
(200)
-
200
400
600
800
1.000
Ch
an
ge
s in
CO
2 e
mis
sio
n (
kt)
dTE dDE

135
6. Conclusion
This study identifies the major drivers of CO2 emission stemming from
service sectors that can make a contribution to have a detailed picture about the
sources of emission and also prepares the ground for policy intervention.
In total, the service sector accounts for the 65% of total final demand
emission in 2008, without the emission from electricity generation the share
decreases to 43%. From the analysis the major CO2 drivers of different service
activities can be highlighted. The main emitters in terms of direct and total
emissions are the electricity generation and land transport. The pollution of these
sectors is way more transparent than any of the other sectors, since their major
share of emission occurs directly. However, the direct emission of most services
is negligible and the major part of their emission are embedded in products and
services they purchase from other industries. The two major emission sources in
case of Recreation and entertainment activities and Knowledge-based services
are EDS and SCM components. Latter component embodies the so-called pull
effect of services on the other productive activities that shows an increasing
trend in Hungary. According to the analysis undertaken, Wholesale and retail
trade, Accommodation and food services, and Public administration and defence
services play an outstanding role in pull effect. The impact of these sectors is
overlooked and they are usually not targeted in policies as potential channels to
curb CO2 emissions. Results confirm the findings of previous studies measuring
pull effect of service sector emission conducted in Spain (Alcantara and Padilla,
2009; Butnar and Llop, 2011). They also identified Wholesale and retail trade as
the major puling service activities.
Looking at the structural changes over time, we can conclude that apart from
the greening electricity generation the aggregated technological efficiency
improvements at national level are much slower than the growth of demand for
the time being.
To sum up, the findings of this research do not underpin the concept that
servitization comes necessarily with lower carbon emission. The hypothesis
regarding the major role in total CO2 emission (H4) can be confirmed. The
136
pulling effect of services on productive sectors covers the largest part only in
cases of some services, but not in all services, thus the hypothesis concerning the
leading role of the pull effect component among services (H5) can partly be
confirmed.
The mitigation of climate change requires reduction of CO2 emissions in
absolute terms, which the present structure of economy cannot ensure. Currently,
we can experience a growing demand in services with high embodiment that
contributes to the rise in emission of productive activities. Real transition can
only be achieved if services become independent of embedded CO2-intensive
products.
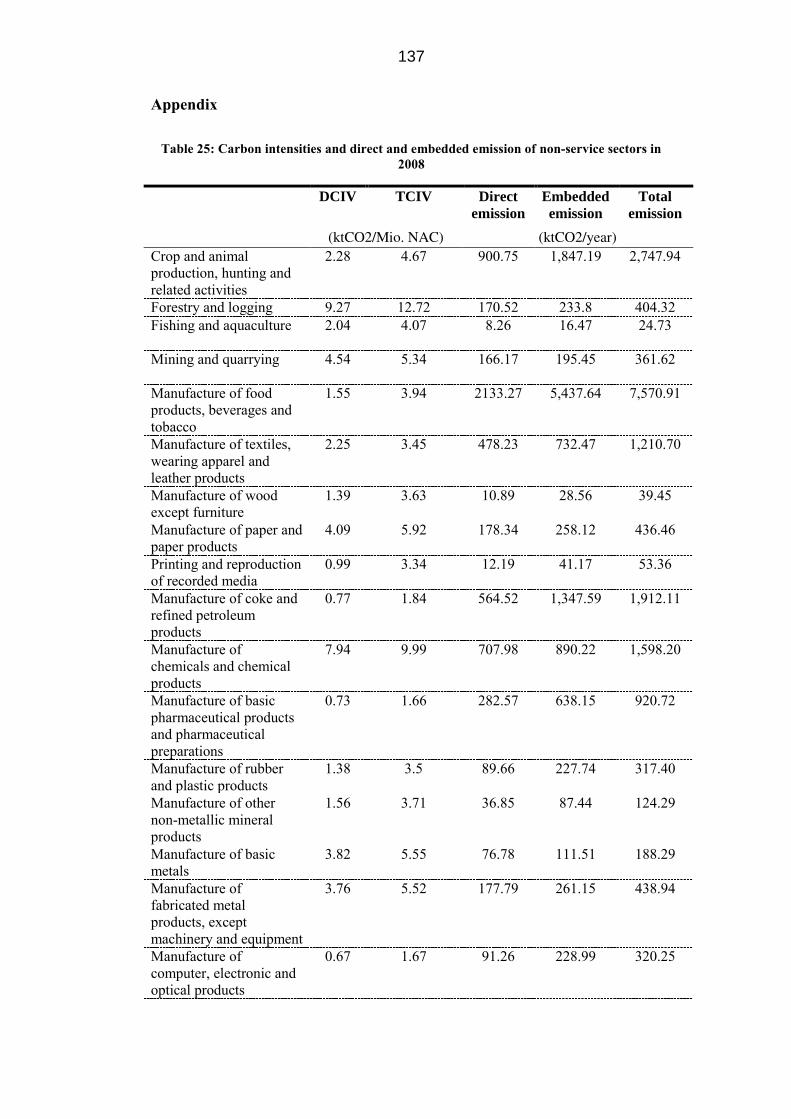
137
Appendix
Table 25: Carbon intensities and direct and embedded emission of non-service sectors in
2008
DCIV TCIV
Direct
emission
Embedded
emission
Total
emission
(ktCO2/Mio. NAC) (ktCO2/year) Crop and animal production, hunting and related activities
2.28 4.67 900.75 1,847.19 2,747.94
Forestry and logging 9.27 12.72 170.52 233.8 404.32 Fishing and aquaculture 2.04 4.07 8.26 16.47 24.73
Mining and quarrying 4.54 5.34 166.17 195.45 361.62
Manufacture of food products, beverages and tobacco
1.55 3.94 2133.27 5,437.64 7,570.91
Manufacture of textiles, wearing apparel and leather products
2.25 3.45 478.23 732.47 1,210.70
Manufacture of wood except furniture
1.39 3.63 10.89 28.56 39.45
Manufacture of paper and paper products
4.09 5.92 178.34 258.12 436.46
Printing and reproduction of recorded media
0.99 3.34 12.19 41.17 53.36
Manufacture of coke and refined petroleum products
0.77 1.84 564.52 1,347.59 1,912.11
Manufacture of chemicals and chemical products
7.94 9.99 707.98 890.22 1,598.20
Manufacture of basic pharmaceutical products and pharmaceutical preparations
0.73 1.66 282.57 638.15 920.72
Manufacture of rubber and plastic products
1.38 3.5 89.66 227.74 317.40
Manufacture of other non-metallic mineral products
1.56 3.71 36.85 87.44 124.29
Manufacture of basic metals
3.82 5.55 76.78 111.51 188.29
Manufacture of fabricated metal products, except machinery and equipment
3.76 5.52 177.79 261.15 438.94
Manufacture of computer, electronic and optical products
0.67 1.67 91.26 228.99 320.25
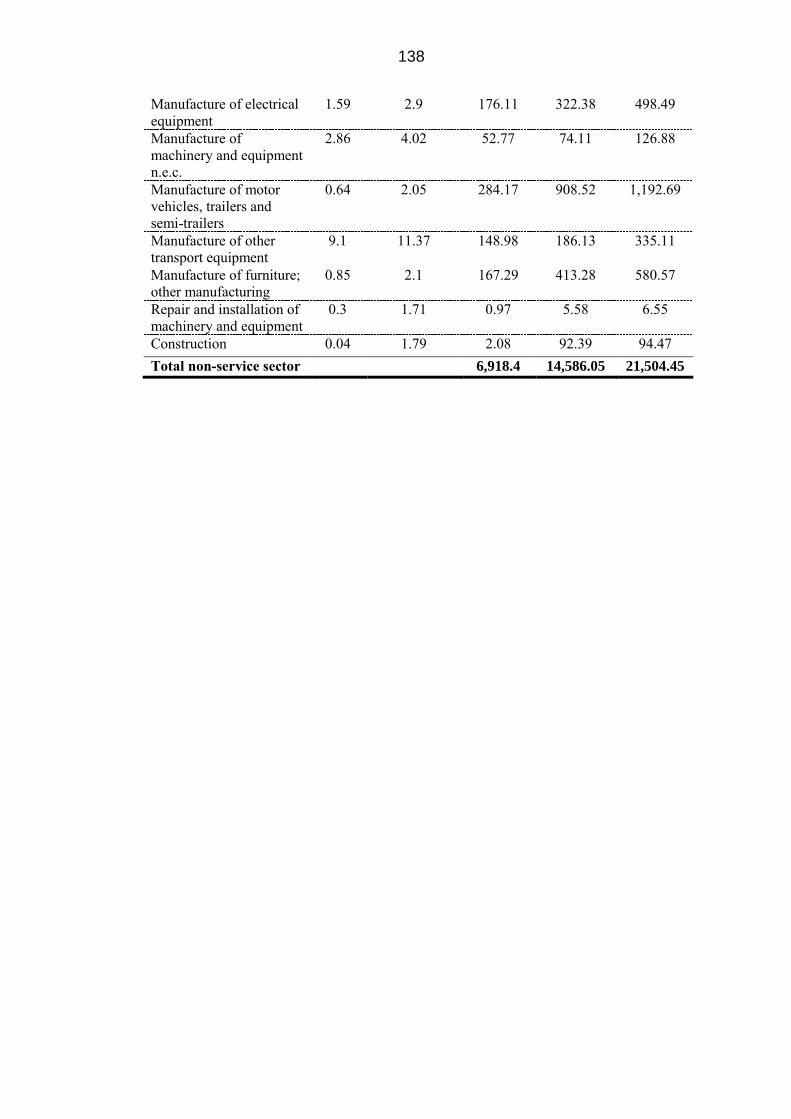
138
Manufacture of electrical equipment
1.59 2.9 176.11 322.38 498.49
Manufacture of machinery and equipment n.e.c.
2.86 4.02 52.77 74.11 126.88
Manufacture of motor vehicles, trailers and semi-trailers
0.64 2.05 284.17 908.52 1,192.69
Manufacture of other transport equipment
9.1 11.37 148.98 186.13 335.11
Manufacture of furniture; other manufacturing
0.85 2.1 167.29 413.28 580.57
Repair and installation of machinery and equipment
0.3 1.71 0.97 5.58 6.55
Construction 0.04 1.79 2.08 92.39 94.47
Total non-service sector 6,918.4 14,586.05 21,504.45

139
V. Overall conclusions and implications
This doctoral thesis embraces a variety of societal determinants that play a
role in low-carbon transition. All three studies that make up this dissertation
show that low-carbon transition is highly dependent on social response that is
subject to structural, socio-demographic and psychographic factors. The
individual findings of each chapter are summerized below.
In the first study consumer preferences are investigated for green electricity
product attributes broadening the literature on social acceptance research towards
renewable energies. The aim of the research is to reveal socio-demographic,
psyhographic and behavioural characteristics that distinguish green electricity
adopters from potential green electricity adopters relying on a representative
sample of German households. Although many customers exhibit positive
attitudes towards renewable electricity mixes, but only a small percentage of
them have already opted for green electricity tariffs. Applying a choice
experiment, different consumer segments were identified based on their
preferences for different electricity product attributes. Four non-adopter clusters
were contrasted to Adopters along two main groups of factors; (1) socio-
demographic and (2) psychographic and behavioral variables.
Demographic variables were found to play a marginal role in explaining the
difference between Adopters and Potential Adopters. With regard to the
hypotheses on socio-demographic characteristics, the subhypotheses concerning
the higher income (H1a) and smaller households (H1c) of Adopters cannot be
confirmed by the analysis. On the other hand, results of this study show that
Adopters can be characterized by a significantly higher average level of
education (i.e. H1b can be confirmed). Gender and age show an equal
distribution across the sample. Furthermore, results suggest that psychographic
and behavioral factors have a great explanatory power when it comes to
understanding why consumers who evince strong preferences towards electricity
produced from renewable energy sources do not act according to their
preferences by opting to purchase green power. As for the subhypothesis on the
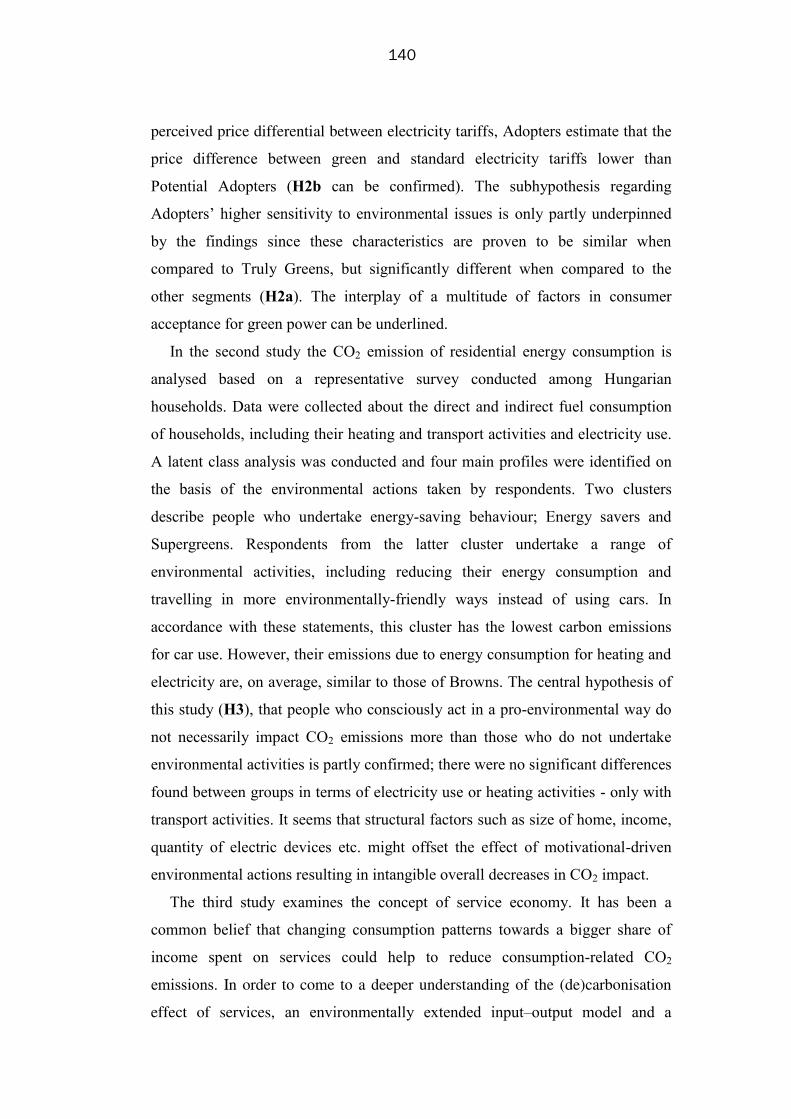
140
perceived price differential between electricity tariffs, Adopters estimate that the
price difference between green and standard electricity tariffs lower than
Potential Adopters (H2b can be confirmed). The subhypothesis regarding
Adopters’ higher sensitivity to environmental issues is only partly underpinned
by the findings since these characteristics are proven to be similar when
compared to Truly Greens, but significantly different when compared to the
other segments (H2a). The interplay of a multitude of factors in consumer
acceptance for green power can be underlined.
In the second study the CO2 emission of residential energy consumption is
analysed based on a representative survey conducted among Hungarian
households. Data were collected about the direct and indirect fuel consumption
of households, including their heating and transport activities and electricity use.
A latent class analysis was conducted and four main profiles were identified on
the basis of the environmental actions taken by respondents. Two clusters
describe people who undertake energy-saving behaviour; Energy savers and
Supergreens. Respondents from the latter cluster undertake a range of
environmental activities, including reducing their energy consumption and
travelling in more environmentally-friendly ways instead of using cars. In
accordance with these statements, this cluster has the lowest carbon emissions
for car use. However, their emissions due to energy consumption for heating and
electricity are, on average, similar to those of Browns. The central hypothesis of
this study (H3), that people who consciously act in a pro-environmental way do
not necessarily impact CO2 emissions more than those who do not undertake
environmental activities is partly confirmed; there were no significant differences
found between groups in terms of electricity use or heating activities - only with
transport activities. It seems that structural factors such as size of home, income,
quantity of electric devices etc. might offset the effect of motivational-driven
environmental actions resulting in intangible overall decreases in CO2 impact.
The third study examines the concept of service economy. It has been a
common belief that changing consumption patterns towards a bigger share of
income spent on services could help to reduce consumption-related CO2
emissions. In order to come to a deeper understanding of the (de)carbonisation
effect of services, an environmentally extended input–output model and a
141
structural decomposition analysis are conducted on the Hungarian industries
between 2000 and 2008. The EEIO revealed the total (direct and embedded)
emissions of different sectorial activities. The total emissions from non-service
industries are characterized by the dominance of direct emission. In case of
services the ratio is reversed, their direct emission has only a marginal share
(except for electricity generation and transportation). In order to obtain a more
detailed picture of the variety of carbon impacts across different type of services,
six groups of services are defined based on possible channels of policy
intervention; (1) Electricity, gas, steam and air conditioning supply (2) Basic
supply services, (3) Transportation and trade, (4) Recreation and entertainment,
(5) Knowledge-based services and (6) Other services. The structural
decomposition of the EEIO model is applied to identify the major drivers of CO2
emissions across intersectorial relationships. Six main components are taken into
account during the calculations: Own demand, Final demand, Electricity
demand, Service Supply, Non-service Supply (pull effect) and Feedback
components. The changes in components over time are dissected into
technological and demand elements. A substantial pull effect is found among
some industries such as Wholesale and retail trade, Accommodation and food
services, and Public administration and defence services. The overall pulling
effect of services accounts for 11% in total emission and 16% of total service
sector emission. Looking at the structural changes over time, we can conclude
that the aggregated technological efficiency improvements (apart from the
impacts of the greening electricity generation) at national level are much slower
than the growth of demand.
To sum up, the findings of this research do not underpin the concept that a
service economy comes necessarily with lower carbon emission. The hypothesis
regarding the major role in total CO2 emission (H4) can be confirmed. The
pulling effect of services on productive sectors covers the largest part only in
case of some services, therefore the hypothesis concerning the leading role of the
pull effect among services (H5) can partly be confirmed.
The mitigation of climate change requires reduction of CO2 emissions in
absolute terms, which the present structure of economy cannot ensure. Currently,
we can experience a growing demand in services with high embodiment that
142
contributes to the rise in emission of productive activities. Real transition can
only be achieved if services become independent from CO2-intensive products.
This thesis also aims at providing policy recommendations based on the
findings of the presented studies. For decision-makers and practitioners the
following three major policy implications can be highlighted:
1) Green electricity adoption, as the most accessible way of supporting
renewable energy production for the public, seems to be hampered more
by psychographic factors such as the lack of awareness and information
than socio-demographic factors
2) Even though consumers undertake a number of pro-environmental
behaviors, the actual CO2 impact of these actions is marginal, which can
be attributed to the structural lock-in that can offset the positive effects of
motivational-driven actions
3) Service sector shows high CO2 embodiment and pull effect on productive
activities that suggests overlooked CO2 reduction potentials
The social acceptance, as pointed out by Wüstenhagen et al. (2007), is a
keystone in promoting the technological change in energy sector. Results of the
survey presented in the first study imply that consumers are usually ill-informed
about the environmental significance of their actions. This is underpinned by the
outstanding role of perceived consumer effectiveness among green electricity
adopters and the low awareness of eco-labels among non-adopter segments. Eco-
labelling is a well-designed policy tool to spread out information on
environmentally friendly products among consumers. Recently, this policy
instrument has received growing attention among academics, policy makers and
industry professionals (e.g. Thogersen, 2000; Rubik et al., 2007). Whereas
several eco-labels exist in the German market, there is still low awareness of
energy labels detected among electricity consumers. For policy makers, the
enhancement of information channels on eco-labels and the development of their
dissemination techniques are recommended to increase transparency and
reliability. Furthermore, education seems to play an utmost important role in the

143
purchasing decision and may also make a strong contribution to higher perceived
consumer effectiveness. This highlights the necessity of communicating better
about the actual impacts of opting for green power.
The second study concludes that there may actually be no significant
difference between environmentally conscious and environmentally indifferent
individuals in terms of their energy-related CO2 emissions. This implies that pro-
environmental behaviors are limited in impact and might be dominated by
structural factors. This statement applies to heating and electricity use but not to
transportation activities. Besides the information gap between environmental
actions and their carbon impacts the findings presented in the second study
suggest that subsidies and incentives targeting structural factors such as home
size, type of house etc., can be efficient policy instruments to improve energy
efficiency of heating activities and electricity use. Transportation activities can
be targeted by awareness raising campaigns. In line with the findings of the first
study, the greenest consumers (Supergreens) have higher education level on
average compared to other segments. Therefore, we can conclude that a more
efficient way of disseminating information on CO2 impacts of environmental
actions is also needed. Misleading or inaccurate information may lead to
redundant efforts and in the long run to the demoralization of consumers.
As it is demonstrated in the third study, the major part of CO2 emission
generated by service sector is embedded in the supply chain. Results of structural
decomposition analysis show that the major share of CO2 emission generated by
services comes indirectly from the emission of non-service sector and electricity
generation. The high embodiment of services gives room for improvement in
policies targeting curbing CO2 emission. Sectors such as energy generation,
paper and pulp industry, cement, etc. are mainly associated with carbon emission
and stand in the focus of climate regulation, although downstream sectors –
mainly services – are significantly affected as well (Csutora and Dobos, 2012).
The findings of this study provide relevant inputs for improvements in the field
of carbon accounting as well as carbon pricing. Along with carbon emission,
carbon costs (e.g. taxes or market-based mechanisms such as emission trading
schemes) are accumulated in the supply chain. Downstream industries are
affected by these policy regulations through purchasing carbon-intensive

144
products such as energy, transportation and other intermediate products.
Knowledge-based services and Recreational and entertainment activities, which
have almost zero direct carbon emissions, purchase mainly electricity and
products from non-service sectors for their activities. Due to the strong
intersectorial dependency, these sectors might therefore be sensitive to changes
in energy and carbon costs. So it can be concluded that downstream service
industries such as knowledge-based and recreational services are strongly
affected by energy and carbon prices as well, which can provide a possible
channel to regulate the indirect CO2 impact of such industries.

145
Related publications
1. Peer-reviewed articles
Tabi, A., Hille, S., Wüstenhagen, R., 2014. Preferences for green electricity and
eco-labels: empirical results from a market segmentation analysis in Germany.
Working paper
Tabi, A., 2013. Does pro-environmental behavior affect CO2 emissions? Energy
Policy, Volume 63, Pages 972-981.
Tabi, A., 2013. Using the stated preference method for the calculation of social
discount rate. Society and Economy. DOI: 10.1556/SocEc.2013.0003
Mozner, Z., Tabi, A., Csutora, M., 2012. Modifying the yield factor based on
more efficient use of fertilizer—The environmental impacts of intensive and
extensive agricultural practices. Ecological Indicators 16(2012) 58–66.
Tabi, A., Csutora, M., 2011. Representing forest management dilemmas in
ecological footprint indicator. Applied Ecology and Environmental Research
10(1): 65-73.
2. Book chapters
Schaltegger, S., Harms, D., Hörisch, J., Windolph, S., Burrit, R., Carter, A.,
Truran, S., Crutzen, N., Rhouma, A., Csutora, M., Tabi, A., Kokubu, K.,
Kitada, H., Badrul Haider, M., Dae Kim, J., Lee, K., Moneva, J., Ortas, E.,
Alvarez-Etxeberria, I., Daub, C., Schmidt, J., Herzig, C., Morelli, J. 2013.
International corporate sustainability barometer: A comparative analysis of 11
146
countries. Lüneburg: Center for Sustainability Management e.V., Leuphana
University Lüneburg, 2013. 56 p. (ISBN:978-3-942638-38-8)
Tabi, A., Csutora, M., Benedek, Z., Ásványi, K., Marjainé Szerényi, Z., Molnár,
A., Szabó, Z., Eszlári, N., Kardos, M., Kozma, Z., Derts Z. 2011. Gazdasági
számítások alapjai a modellezett vízkészlet-változások mentén. In: Koncsos
László (szerk.). Jövöképtöl a vízkészlet-kockázatig. Budapest: BME
Építőmérnöki Kar Vízi Közmű és Környezetmérnöki Tanszék, 2011. pp. 95-137.
(ISBN:978 963 313 060 5)
Tabi, A., Csutora, M. 2012. A temporális diszkontálási szokások vizsgálata - a
társadalmi diszkontráta és a társadalmi preferenciák kapcsolata. In: Kerekes
Sándor, Csutora Mária (edited) Fenntartható fogyasztás?: Trendek és
lehetőségek Magyarországon. Budapest: Aula Kiadó, 2012. pp. 173-
197.(ISBN:978 963 339 042 9)
Tabi, A., 2011. A magyar háztartások energia lábnyomának vizsgálata
lakossági felmérése alapján (In: Az ökológiai lábnyom ökonómiája, 2011,
ISBN 978-963-339-028-3, 75-88 pp.)
3. Other pertinent publications
Csutora, M., Mózner, Z., Tabi, A. 2009. Sustainable consumption: From escape
strategies towards real alternatives. In: Kerekes, S., Csutora, M., Székely, M.
(edited) Sustainable Consumption 2009 Conference: Sustainable consumption,
production and communication: Proceedings: Budapest,. 63-74. (ISBN:978-963-
503-399-7)
147
References
1. Adamowicz, W., Louviere, J., Williams, M., 1994. Combining Revealed
and Stated Preference Methods for Valuing Environmental Amenities,
Journal of Environmental Economics and Management, Volume 26,
Issue 3, May 1994, Pages 271-292. DOI: 10.1006/jeem.1994.1017
2. Ajzen, I., Fishbein, M., 1980. Understanding Attitudes and Predicting
Social Behaviour. Englewood Cliffs, NJ, Prentice Hall.
3. Alcántara, V., Padilla, E., 2009. Input–output subsystems and pollution:
An application to the service sector and CO2 emissions in Spain,
Ecological Economics, Volume 68, Issue 3, 15 January 2009, Pages
905-914. DOI: 10.1016/j.ecolecon.2008.07.010
4. Ali, G., Abbas, S., Qamer, F. M., 2013. How effectively low carbon
society development models contribute to climate change mitigation and
adaptation action plans in Asia, Renewable and Sustainable Energy
Reviews, Volume 26, October 2013, Pages 632-638. DOI:
10.1016/j.rser.2013.05.042
5. Alvarez-Farizo, B., Hanley, N., 2002. Using conjoint analysis to
quantify public preferences over the environmental impacts of wind
farms. An example from Spain. Energy Policy. 30(2), 107-116. DOI:
10.1016/S0301-4215(01)00063-5
6. Amador, F. J., Gonzalez, R. M., Ramos-Real, F. J., 2013. Supplier
choice and WTP for electricity attributes in an emerging market: The
role of perceived past experience, environmental concern and energy
saving behavior. Energy Economics. 40, 953-966. DOI:
10.1016/j.eneco.2013.06.007
7. Andreasen, A. R., 1984. Life Status Changes and Changes in Consumer
Preferences and Satisfaction. Journal of Consumer Research, Vol. 11,
No. 3, pp. 784-794. DOI: 10.1086/209014
8. Arkesteijn, K., Oerlemans, L., 2005. The early adoption of green power
by Dutch households: An empirical exploration of factors influencing
148
the early adoption of green electricity for domestic purposes. Energy
Policy. 33(2), 183-196. DOI: 10.1016/S0301-4215(03)00209-X
9. Arroyo-Currás, T.,Bauer, N., Kriegler,E., Schwanitz,V. J., Luderer,G.,
Aboumahboub, T., Giannousakis, A., Hilaire,J.,2013. Carbon leakage in
a fragmented climate regime: The dynamic response of global energy
markets, Technological Forecasting and Social Change, Available
online 10 November 2013, DOI: 10.1016/j.techfore.2013.10.002
10. Austin, A., Cox, J., Barnett, J., Thomas, C., 2011. Exploring catalyst
behaviours: Full Report. A report to the Department for Environment,
Food and Rural Affairs. Brook Lyndhurst for Defra, London.
11. Batel, S., Devine-Wright, P., Tangeland, T., 2013. Social acceptance of
low carbon energy and associated infrastructures: A critical discussion,
Energy Policy, Volume 58, July 2013, Pages 1-5. DOI:
10.1016/j.enpol.2013.03.018
12. Bell, D. 1973. The Coming of the Postindustrial Society. A Venture in
Social Forecasting Basic Books, New York (1973).
13. Bergmann, A., Hanley, N., Wright, R., 2006. Valuing the attributes of
renewable energy investments. Energy Policy. 34(9), 1004-1014. DOI:
10.1016/j.enpol.2004.08.035
14. Bernardini, O., Galli, R., 1993. Dematerialization: Long-term trends in
the intensity of use of materials and energy, Futures, Volume 25, Issue
4, May 1993, Pages 431-448. DOI: 10.1016/0016-3287(93)90005-E
15. Beuren, F. H., Gomes Ferreira, M. G., Cauchick Miguel, P. A., 2013.
Product-service systems: a literature review on integrated products and
services, Journal of Cleaner Production, Volume 47, May 2013, Pages
222-231. DOI: 10.1016/j.jclepro.2012.12.028
16. Bicknell, K.B., Ball, R. J., Cullen, R., Bigsby. H. R. 1998. New
methodology for the ecological footprint with an application to the New
Zealand economy. Ecological Economics 27 (1998) 149–160. DOI:
10.1016/S0921-8009(97)00136-5
17. Blake, J., 1999. Overcoming the ‘value–action gap’ in environmental
policy: tensions between national policy and local experience, Local
Environment, 4(3), pp. 257–278. DOI:10.1080/13549839908725599

149
18. BMU (Federal Ministry for the Environment, Nature Conservation and
Nuclear Safety), 2009. Electricity from renewable energy sources –
What does it cost? http://www.bmu.de/fileadmin/bmu-
import/files/pdfs/allgemein/application/pdf/brochure_electricity_costs_b
f.pdf
19. BMWI (Federal Ministry of Economics and Technology), 2013.
http://www.bmwi.de/DE/Themen/Energie/Energietraeger/erneuerbare-
energien,did=20918.html
20. Böhringer, C., Balistreri, E. J., Rutherford, T. F., 2012. The role of
border carbon adjustment in unilateral climate policy: Overview of an
Energy Modeling Forum study (EMF 29), Energy Economics, Volume
34, Supplement 2, December 2012, Pages S97-S110, DOI:
10.1016/j.eneco.2012.10.003
21. Bosley, P., Bosley, K. 1988. Public acceptability of California's wind
energy developments: three studies. Wind Engineering, 12 (5) (1988),
pp. 311–318.
22. Branger, F., Quirion, P., 2014. Would border carbon adjustments
prevent carbon leakage and heavy industry competitiveness losses?
Insights from a meta-analysis of recent economic studies, Ecological
Economics, Volume 99, March 2014, Pages 29-39, DOI:
10.1016/j.ecolecon.2013.12.010
23. Brizga, J., Feng, K., Hubacek, K., 2014. Drivers of greenhouse gas
emissions in the Baltic States: A structural decomposition analysis,
Ecological Economics, Volume 98, February 2014, Pages 22-28, DOI:
10.1016/j.ecolecon.2013.12.001
24. Broome, J., 1992. Counting the Cost of Global Warming. Cambridge:
White Horse Press.
25. Buera, F. J., Kaboski, J. P., 2012. The Rise of the Service Economy,
American Economic Review, American Economic Association, vol.
102(6), pages 2540-69, October. DOI: 10.1257/aer.102.6.2540
26. Bürer, M. J., Wüstenhagen, R., 2008. Cleantech Venture Investors and
Energy Policy Risk: An Exploratory Analysis of Regulatory Risk
Management Strategies, in: Wüstenhagen, R., Hamschmidt, J., Sharma,
150
S., Starik, M.: Sustainable Innovation and Entrepreneurship, Edward
Elgar Publishing, pp. 290-309.
27. Bürer, M. J., Wüstenhagen, R., 2009. Which renewable energy policy is
a venture capitalist's best friend? Empirical evidence from a survey of
international cleantech investors, Energy Policy, Volume 37, Issue 12,
December 2009, Pages 4997-5006, DOI: 10.1016/j.enpol.2009.06.071
28. Burgess, J., Harrison, C. Filius, P., 1998. Environmental communication
and the cultural politics of environmental citizenship, Environment and
Planning A, 30, pp. 1445–1460. doi:10.1068/a301445
29. Burkhalter, A., Kaenzig, J., Wüstenhagen, R., 2009. Kundenpräferenzen
für leistungsrelevante Attribute von Stromprodukten. Zeitschrift für
Energiewirtschaft, 33(2), 161-172.
30. Burniaux, J. M., Oliveira Martin, J., 2000. Carbon emission leakages: A
general equilibrium view, OECD Economics Department Working
Papers No 242, OECD Paris, May 2000.
http://dx.doi.org/10.1787/410535403555
31. Butnar, I., Llop, M., 2011. Structural decomposition analysis and input–
output subsystems: Changes in CO2 emissions of Spanish service
sectors (2000–2005), Ecological Economics, Volume 70, Issue 11, 15
September 2011, Pages 2012-2019. DOI:
10.1016/j.ecolecon.2011.05.017
32. Cai, Y. X., Deilami, I., Train, K., 1998. Customer retention in a
competitive power market: Analysis of a 'double-bounded plus follow-
ups' questionnaire. Energy Journal. 19(2), 191-215. DOI:
10.5547/ISSN0195-6574-EJ-Vol19-No2-12
33. Cansino, J. M., Pablo-Romero, M. P., Román, R., Yñiguez, R., 2010.
Tax incentives to promote green electricity: An overview of EU-27
countries, Energy Policy, Volume 38, Issue 10, October 2010, Pages
6000-6008, DOI: 10.1016/j.enpol.2010.05.055
34. Cape Grim Observatory database. 2014.
http://www.csiro.au/greenhouse-gases/
35. Carlman, I., 1982. Wind energy potential in Sweden: the importance of
non-technical factors. In: Fourth International Symposium on Wind
Energy Systems. September 21–24, 1982, Stockholm, pp. 335–348.

151
36. Carlman, I., 1984. The views of politicians and decision-makers on
planning for the use of wind power in Sweden. In: European Wind
Energy Conference, 22–36 October 1984, Hamburg, pp. 339–343.
37. Cerin, P., 2006. Bringing economic opportunity into line with
environmental influence: A discussion on the Coase theorem and the
Porter and van der Linde hypothesis, Ecological Economics, Volume
56, Issue 2, 15 February 2006, Pages 209-225, DOI:
10.1016/j.ecolecon.2005.01.016
38. Chassot, S., Wüstenhagen, R., Fahr, N., Graf, P. 2013. Wenn das grüne
Produkt zum Standard wird: Wie ein Energieversorger seinen Kunden
die Verhaltensänderung einfach macht. Organisationsentwicklung,
2013(3), 80-87.
39. Chichilnisky, G., 1998. The knowledge revolution, J. Int. Trade Econ.
Dev., 7 (1998), pp. 39–54.
40. Clark, C. F., Kotchen, M. J., Moore, M. R., 2003. Internal and external
influences on pro-environmental behavior: Participation in a green
electricity program. Journal of Environmental Psychology. 23 (3), 237-
246. doi:10.1016/S0272-4944(02)00105-6
41. Clausen, J., 2008. Betrieber von Solarwärmeanlagen und
Ökostromkunden in der Klimaschutzregion Hannover. Research project
Wenke 2. http://www.borderstep.de/pdf/P-Clausen-
Betreiber_von_Solarwaermeanlagen_und_Oekostromkunden_in_der_Kl
imaschutzregion_Hannover-2008.pdf.
42. Coase, R., 1960. The problem of social cost, The Journal of Law and
Economics, 3 (1960), pp. 1–44.
43. Cogoy, M., 2004. Dematerialisation, time allocation, and the service
economy, Structural Change and Economic Dynamics, Volume 15,
Issue 2, June 2004, Pages 165-181. DOI: 10.1016/S0954-
349X(03)00025-0
44. Crawford, R., 2008. Validation of a hybrid life-cycle inventory analysis
method. Journal of Environmental Management 88 (3), 496–506. DOI:
10.1016/j.jenvman.2007.03.024
152
45. Csutora, M., 2012. One More Awareness Gap? The Behaviour–Impact
Gap Problem. Journal of Consumer Policy (2012) 35:145–163 DOI:
10.1007/s10603-012-9187-8.
46. Csutora, M., Dobos, I., 2012. Calculating carbon cost sensitivity of
companies using hybrid accounting.
15th EMAN Conference on Environmental and Sustainability Mana
gement Accounting in collaboration with the CSEAR International
Congress on Social and Environmental Accounting Research, ISBN
978-952-93-1238-2, ., Helsinki
47. Csutora, M., Mózner, Z., Tabi, A., 2009. Sustainable consumption: from
escape strategies towards real alternatives. Sustainable Consumption
Conference. Sustainable Consumption, Production, and
Communication. Conference Proceedings, Budapest, 63-74.
48. Csutora, M., Zsóka, A., 2010. Maximizing the Efficiency of Greenhouse
Gas Related Consumer Policy. Journal of Consumer Policy, Consumer
Issues in Law, Economics and Behavioral Sciences 1, 67-90. DOI:
10.1007/s10603-010-9147-0.
49. Cucek, L., Klemes, J. J., Kravanja, Z., 2012. A Review of Footprint
analysis tools for monitoring impacts on sustainability, Journal of
Cleaner Production 34 (2012) 9-20. DOI: 10.1016/j.jclepro.2012.02.036
50. Dallas, M. P., 2014. Manufacturing Paradoxes: Foreign Ownership,
Governance, and Value Chains in China’s Light Industries, World
Development, Volume 57, May 2014, Pages 47-62. DOI:
10.1016/j.worlddev.2013.11.015
51. de Groot, J.I.M., Steg, L., 2010. Relationships between value
orientations, self-determined motivational types and pro-environmental
behavioural intentions. Journal of Environmental Psychology 30 (2010)
368-378. DOI: 10.1016/j.jenvp.2010.04.002
52. DEFRA, 2005. Experimental statistics on carbon dioxide emissions at
local authority and regional level. London: Department for
Environment, Food and Rural Affairs.
53. DEFRA, 2008. A framework for pro-environmental behaviours.
London: Department for Environment, Food and Rural Affairs.

153
54. Denman, K.L., G. Brasseur, A. Chidthaisong, P. Ciais, P.M. Cox, R.E.
Dickinson, D. Hauglustaine, C. Heinze, E. Holland, D. Jacob, U.
Lohmann, S Ramachandran, P.L. da Silva Dias, S.C. Wofsy and X.
Zhang, 2007: Couplings Between Changes in the Climate System and
Biogeochemistry. In: Climate Change 2007: The Physical Science
Basis. Contribution of Working Group I to the Fourth Assessment
Report of the Intergovernmental Panel on Climate Change [Solomon,
S., D. Qin, M. Manning, Z. Chen, M. Marquis, K.B. Averyt, M.Tignor
and H.L. Miller (eds.)]. Cambridge University Press, Cambridge, United
Kingdom and New York, NY, USA.
55. Deputy Secretariat of State for Green Economy Development and
Climate Policy for the Ministry of National Development, 2010.
Republic of Hungary National Renewable Energy Action Plan 2010-
2020, ISBN 978-963-89328-0-8.
56. DeSarbo, W. S., Ramaswamy, V., Cohen, S. H., 1995. Market
segmentation with choice-based conjoint analysis. Marketing Letters.
6(2), 137-147. DOI: http://dx.doi.org/10.1007/BF00994929
57. Diaz-Rainey, I., Ashton, J. K., 2011. Profiling potential green electricity
tariff adopters: green consumerism as an environmental policy tool?
Business Strategy and the Environment. 20(7), 456-470.
DOI: 10.1002/bse.699
58. Diekmann, A., Preisendörfer, P., 1992. Persönliches Umweltverhalten:
Die Diskrepanz zwischen Anspruch und Wirklichkeit, Kölner
Zeitschrift für Soziologie und Sozialpsychologie, 44, pp. 226–251.
59. Dinda, S., 2004. Environmental Kuznets Curve Hypothesis: A Survey,
Ecological Economics, Volume 49, Issue 4, 1 August 2004, Pages 431-
455. DOI: 10.1016/j.ecolecon.2004.02.011
60. Dong, H., Geng, Y., Xi, F., Fujita, T., 2013. Carbon footprint evaluation
at industrial park level: A hybrid life cycle assessment approach, Energy
Policy 57 (2013) 298–307. DOI: 10.1016/j.enpol.2013.01.057
61. Easterlin, R., 1974. Does Economic Growth Improve the Human Lot?
Some Empirical Evidence. In Paul A. David and Melvin W. Reder, eds.,
Nations and Households in Economic Growth: Essays in Honor of
Moses Abramovitz, New York: Academic Press,

154
62. EEA (European Environemnt Agency), 2013. Technical report No
8/2013: Annual European Union greenhouse gas inventory 1990–2011
and inventory report 2013.
63. Ehrlich, P. R., Wolff, G., Daily, G. C., Hughes, J. B., Daily, S., Dalton,
M., Goulder, L., 1999. Knowledge and the environment, Ecological
Economics, Volume 30, Issue 2, August 1999, Pages 267-284, DOI:
10.1016/S0921-8009(98)00130-X
64. Ek, K., 2005. Public and private attitudes towards "green" electricity:
the case of Swedish wind power. Energy Policy. 33(13), 1677-1689.
DOI: 10.1016/j.enpol.2004.02.005
65. Ek, K., Soderholm, P., 2008. Norms and economic motivation in the
Swedish green electricity market. Ecological Economics. 68(1-2), 169-
182. DOI: 10.1016/j.ecolecon.2008.02.013
66. EU Progress Report, 2013. http://ec.europa.eu/clima/policies/g-
gas/docs/com_2013_698_en.pdf
67. EU, 2008. Sustainable Consumption and Production and Sustainable
Industrial Policy Action Plan,
http://ec.europa.eu/environment/eussd/pdf/com_2008_397.pdf
68. European Commission, 2011. A Roadmap for moving to a competitive
low carbon economy in 2050,
http://ec.europa.eu/clima/policies/roadmap/index_en.htm
69. European Commission, 2011. Energy Efficiency Plan, http://eur-
lex.europa.eu/LexUriServ/LexUriServ.do?uri=COM:2011:0109:FIN:EN
70. European Union, 2013, The EU Emissions Trading System (ETS), doi:
10.2834/55480
71. EUROSTAT database, 2014.
72. Eurostat, 2008. NACE Rev. 2 - Statistical classification of economic
activities in the European Community, Methodologies and working
papers, ISSN 1977-0375.
73. Eurostat, 2014. Air transport services statistics,
http://epp.eurostat.ec.europa.eu/statistics_explained/index.php/Air_trans
port_services_statistics_-_NACE_Rev._2

155
74. EUROSTAT., 2010. Environmental statistics and accounts in Europe
http://epp.eurostat.ec.europa.eu/cache/ITY_OFFPUB/KS-32-10-
283/EN/KS-32-10-283-EN.PDF
75. Ewing, G., Sarigöllü, E., 2000. Assessing Consumer Preferences for
Clean-Fuel Vehicles: A Discrete Choice Experiment, Journal of Public
Policy & Marketing, Vol. 19, No. 1, Privacy and Ethical Issues in
Database/Interactive Marketing and Public Policy (Spring, 2000), pp.
106-118. doi: http://dx.doi.org/10.1509/jppm.19.1.106.16946
76. Farago, T., Lang, I., Csete, L., 2010. VAHAVA Report: Climate
Change and Hungary: Mitigating the Hazard and Preparing for the
Impacts; VAHAVA: Budapest, Hungary, 2010; p. 124.
77. Ferng, JJ., 2009. Applying input–output analysis to scenario analysis of
ecological footprints, Ecological Economics, Volume 69, Issue 2, 15
December 2009, Pages 345-354. DOI: 10.1016/j.ecolecon.2009.08.006
78. Ferrer-i-Carbonell, A., 2005. Income and well-being: An empirical
analysis of the comparison income effect. Journal of Public Economics,
89, 997–1019. DOI: 10.1016/j.jpubeco.2004.06.003
79. Fiksel, J., 2012. A systems view of sustainability: The triple value
model, Environmental Development, Volume 2, April 2012, Pages 138-
141. DOI: 10.1016/j.envdev.2012.03.015
80. Finnveden, G., Hauschild, M.Z., Ekvall, T., Guinée, J., Heijungs, R.,
Hellweg, S., Koehler, A., Pennington, D., Suh, S., 2009. Recent
developments in life cycle assessment. Journal of Environmental
Management 91, 1e21. DOI: 10.1016/j.jenvman.2009.06.018
81. Fourcroy, C., Gallouj, F., Decellas, F., 2012. Energy consumption in
service industries: Challenging the myth of non-materiality, Ecological
Economics, Volume 81, September 2012, Pages 155-164, DOI:
10.1016/j.ecolecon.2012.07.003
82. Freire-González, J. 2010. Empirical evidence of direct rebound effect in
Catalonia. Energy Policy 38 (2010) 2309–2314. DOI:
10.1016/j.enpol.2009.12.018
83. Galli, A., Wiedmann, T., Ercin, E., Knoblauch, D., Ewing, B., Giljum,
S., 2012. Integrating Ecological, Carbon and Water footprint into a
“Footprint Family” of indicators: Definition and role in tracking human
156
pressure on the planet. Ecological Indicators, 16 (2012) 100–112. DOI:
10.1016/j.ecolind.2011.06.017
84. Gardner G.T., Stern, P.C., 2008. The short list: The most effective
actions US households can take to curb climate change, Environment:
Science and Policy for Sustainable Development, 50, 12–25 pp.
85. Gatersleben, B., Steg, L., Vlek, C., 2002. Measurement and
determinants of environmentally significant consumer behaviour.
Environment and Behaviour, 34, 335–362. doi:
10.1177/0013916502034003004
86. Gerpott, T. J., Mahmudova, I. 2010. Determinants of green electricity
adoption among residential customers in Germany. International Journal
of Consumer Studies. 34(4), 464-473. DOI: 10.1111/j.1470-
6431.2010.00896.x
87. Gerpott, T. J., Rams, W., Schindler, A., 2001. Customer retention,
loyalty and satisfaction in the German mobile cellular
telecommunications market. Telecommunications Policy, (25): 249-69.
DOI: 10.1016/S0308-5961(00)00097-5
88. GFN, 2008. National Footprint Accounts: Hungary. 2008 Edition for
Year 2005., Global Footprint Network, Oakland, CA, USA.
89. Goett, A., Hudson, K., Train K., 2000. Customers' choice among retail
energy suppliers: The willingness-to-pay for service attributes. Energy
Journal. 21(4), 1-28. DOI: 10.5547/ISSN0195-6574-EJ-Vol21-No4-1
90. Gonzales, A., Dorwin, D., Gupta, D., Kalyan, K., Schimler, S., 2001.
Outsourcing: Past, Present and Future, IT and Public Policy, Factor,
Analyzing Application Service Providers. Prentice Hall, New York,
2001
91. Gossling, S., Kunkel, T., Schumacher, K., Heck, N., Birkemeyer, J.,
Froese, J., Naber, N., Schliermann, E., 2005. A target group-specific
approach to “green” power retailing: students as consumers of
renewable energy. Renewable and Sustainable Energy Reviews. 9(1),
69-83. DOI: 10.1016/j.rser.2004.01.005
92. Green P. E., Srinivasan V., 1990. Conjoint analysis in marketing: new
developments with implications for research and practice. Journal of
Marketing 54(4): 3-19. DOI: 10.2307/1251756
157
93. Green, P. E., Srinivasan, V., 1978. Conjoint Analysis in Consumer
Research: issues and Outlook. Journal of Consumer Research, 5, 103-
123. DOI: 10.1086/208721
94. Green, P.E., 1977. A new approach to market segmentation, Business
Horizons, Vol. 20 pp. 61-73. DOI: 10.1016/0007-6813(77)90088-X
95. Greening, L. A., Greene, D. L., Difiglio, C., 2000. Energy efficiency
and consumption — the rebound effect — a survey, Energy Policy,
Volume 28, Issues 6–7, June 2000, Pages 389-401. DOI:
10.1016/S0301-4215(00)00021-5
96. Gross, C. 2007. Community perspectives of wind energy in Australia:
The application of a justice and community fairness framework to
increase social acceptance, Energy Policy, Volume 35, Issue 5, Pages
2727-2736. DOI: 10.1016/j.enpol.2006.12.013
97. Grubb, M., Neuhoff, K., 2006. Allocation and competitiveness in the
EU emissions trading scheme: policy overview, Climate Policy, 6 (1)
(2006), pp. 137–160. DOI: 10.3763/cpol.2006.0602
98. Guagnano, G. A., Stern, P. C., Dietz, T., 1995. Influences on attitude–
behavior relationships: A natural experiment with curbside recycling.
Environment and Behavior, 27, 699–718.
doi:10.1177/0013916595275005.
99. Guillen-Royo, M., 2011. Reference group consumption and the
subjective wellbeing of the poor in Peru, Journal of Economic
Psychology, Volume 32, Issue 2, March 2011, Pages 259-272. DOI:
10.1016/j.joep.2009.12.001
100. Guinée, J.B., Gorrée, M., Heijungs, R., Huppes, G., Kleijn, R., de
Koning, A., van Oers, L., Wegener Sleeswijk, A., Suh, S., de Haes,
H.A.U., de Bruijn, H., van Duin, R., Huijbregts, M.A.J., Lindeijer, E.,
Roorda, A.A.H., van der Ven, B.L., Weidema, P.P., 2002. Handbook on
Life Cycle Assessment, Operational Guide to the ISO Standards.
Kluwer Academic Publishers, Dordrecht, The Netherlands.
101. Hampl, N., 2012. Energy investment decision-making under
uncertainty: The influence of behavioural and social effects. Doctoral
dissertation, No. 4083, D-Druck Spescha, St. Gallen 2012.
158
102. Hansen, J., Sato, M., Kharecha, P., Beerling, D., Masson-Delmotte, V.,
Pagani, M., Raymo, M., Royer, D.L., Zachos, J.C., 2008. Target
atmospheric CO2: where should humanity aim? Open Atmospheric
Science Journal 2, 217–231, doi:10.2174/1874282300802010217.
103. Hansla, A., Gamble, A., Juliusson, A., Gärling, T., 2008. Psychological
determinants of attitude towards and willingness to pay for green
electricity, Energy Policy, Volume 36, Issue 2, Pages 768-774. DOI:
10.1016/j.enpol.2007.10.027
104. Harangozo, G., 2009. Fighting the rebound effect in energy
consumption: doubts and opportunities. Sustainable Consumption 2009
Conference. 2009, Budapest.
105. Hardisty, D., Weber, E., 2009. Discounting Future Green: Money
Versus the Environment. Journal of Experimental Psychology: General
Volume 138(3): 329-340. doi: 10.1037/a0016433
106. Hartikainen, H., Roininen, T., Katajajuuri, JM., Pulkkinen, H., 2013.
Finnish consumer perceptions of carbon footprints and carbon labelling
of food products, Journal of Cleaner Production, Available online 24
September 2013, DOI: 10.1016/j.jclepro.2013.09.018
107. Hätönen, J., Eriksson, T., 2009. 30+ years of research and practice of
outsourcing – Exploring the past and anticipating the future, Journal of
International Management, Volume 15, Issue 2, June 2009, Pages 142-
155, ISSN 1075-4253, http://dx.doi.org/10.1016/j.intman.2008.07.002.
108. Hawken, P., Lovins, A., Lovins, L. H., 1999. Natural Capitalism,
Creating the Next Industrial Revolution.Boston, New York, London:
Little, Brown and Company
109. Heinzle, S., Wüstenhagen, R., 2012. Dynamic Adjustment of Eco-
labeling Schemes and Consumer Choice – the Revision of the EU
Energy Label as a Missed Opportunity?, Business Strategy and the
Environment, 21(1), 60-70, DOI:10.1002/bse.722.
110. Hens, H., Parijs, W., Deurinck. M., 2010. Energy consumption for
heating and rebound effects. Energy and Buildings 42 (2010) 105–110.
DOI: 10.1016/j.enbuild.2009.07.017

159
111. Herman, R., Ardekani, S. A., Ausubel, J. H., 1990. Dematerialization,
Technological Forecasting and Social Change, Volume 38, Issue 4,
December 1990, Pages 333-347. DOI: 10.1016/0040-1625(90)90003-E
112. Hill, T. P., 1977. On goods and services. Review of Income and Wealth,
23 (4) (1977), pp. 315–338. DOI: 10.1111/j.1475-4991.1977.tb00021.x
113. HM Government, 2009. The UK Low Carbon Transition Plan, ISBN:
9780108508394
114. Hoekstra, A.Y., Hung, P.Q., 2002. Virtual water trade: a quantification
of virtual water flows between nations in relation to international crop
trade. Value of Water Research Report Series No. 11. UNESCO-IHE.
Delft, The Netherlands.
115. Höjer, M., Ahlroth, S., Dreborg, K., Ekvall, T., Finnveden, G., Hjelm,
O., Hochschorner, E., Nilsson, M., Palm, V., 2008. Scenarios in selected
tools for environmental systems analysis. Journal of Cleaner
Production 16(18): 1958-1970. DOI: 10.1016/j.jclepro.2008.01.008
116. Hori, S., Kondo, K., Nogata, D., Ben, H., 2013. The determinants of
household energy-saving behaviour: Survey and comparison in five
major Asian cities. Energy Policy 52 (2013) 354–362. DOI:
10.1016/j.enpol.2012.09.043
117. Howells, M., Jeong, K., Langlois, L., Lee, M. K., Nama, K., Rogner,
H.H., 2010. Incorporating macroeconomic feedback into an energy
systems model using an IO approach: Evaluating the rebound effect in
the Korean electricity system. Energy Policy 38 (2010) 2700–2728.
DOI: 10.1016/j.enpol.2008.10.054
118. Hungarian Ministry for Environment and Water, 2007. National Climate
Change Strategy 2008–2025.
http://klima.kvvm.hu/documents/14/National_Climate_Change_Strateg
y_of_Hungary_2008.pdf
119. IEA (International Energy Agency), 2007. Energy Balances of OECD
Countries 2008 Edition OECD, Paris.
120. IEA, 2012. CO2 emissions from fuel combustion.
https://www.iea.org/co2highlights/co2highlights.pdf
121. IEA, 2013. Trends 2013 in photovoltaic applications, ISBN 978-3-
906042-14-5
160
122. IPCC (International Panel on Climate Change). 2006, Guidelines for
National Greenhouse Gas Inventories, Prepared by the National
Greenhouse Gas Inventories Programme, Eggleston H.S., Buendia L.,
Miwa K., Ngara T. and Tanabe K. (eds). Published: IGES, Japan.
123. IPCC, 2013. Climate Change 2014: Mitigation of Climate Change.
IPCC Working Group III Contribution to AR5,
http://mitigation2014.org/
124. ISO, 2006. ISO14064-1:2006. Greenhouse Gases Part 1: Specification
with Guidance at the Organization Level for Quantification and
Reporting of Greenhouse Gas Emissions and Removals. Switzerland,
International Organization for Standardization (ISO), Geneva 1-20.
125. Izvercianu, M., Seran, S. A., Branea, AM., 2014. Prosumer-oriented
Value Co-creation Strategies for Tomorrow's Urban Management,
Procedia - Social and Behavioral Sciences, Volume 124, 20 March
2014, Pages 149-156, http://dx.doi.org/10.1016/j.sbspro.2014.02.471.
126. Jacoby, J., Olson, J. C., 1977. Consumer response to price: an
attitudinal, information processing perspective. in Moving Ahead With
Attitude Research, Y. Wind and M. Greenberg, eds., Chicago. American
Marketing Association, 73-86.
127. Jansson, J. O., 2009. The myth of the service economy—An update,
Futures, Volume 41, Issue 3, April 2009, Pages 182-189. DOI:
10.1016/j.futures.2008.09.018
128. Jin, S., 2007. The effectiveness of energy efficiency improvement in a
developing country: Rebound effect of residential electricity use in
South Korea. Energy Policy 35 (2007) 5622–5629. DOI:
10.1016/j.enpol.2007.05.028
129. Junnila, S. 2008. Life cycle management of energy-consuming products
in companies using IO-LCA. The International Journal of Life Cycle
Assessment, 13(5): 432-439. DOI: 10.1007/s11367-008-0015-y
130. Kaenzig, J., Friot, D., Saade, M., Margni, M., Jolliet, O., 2011. Using
Life Cycle Approaches to Enhance the Value of Corporate
Environmental Disclosures. Business Strategy and the Environment.
1(20), 38-54. DOI: 10.1002/bse.667

161
131. Kaenzig, J., Heinzle, S. L., Wüstenhagen. R., 2013. Whatever the
customer wants, the customer gets? Exploring the gap between
consumer preferences and default electricity products in Germany.
Energy Policy. 53(0), 311-322. DOI: 10.1016/j.enpol.2012.10.061
132. Kaiser, F. G., Wilson, M., 2004. Goal-directed conservation behaviour:
the specific composition of a general performance. Personality and
Individual Differences, 36, 1531-1544. DOI:
10.1016/j.paid.2003.06.003
133. Kallis, G., Kerschner, C., Martinez-Alier, J., 2012. The economics of
degrowth, Ecological Economics, Volume 84, December 2012, Pages
172-180, ISSN 0921-8009,
http://dx.doi.org/10.1016/j.ecolecon.2012.08.017.
134. Kalwani, M. U., Yim, C. K., 1992. Consumer price and promotion
expectations: an experimental study, Journal of Marketing Research, 29,
90-100. DOI: 10.2307/3172495
135. Kalwani, M. U., Yim, C. K., Rinne, H. J., Sugita, Y., 1990. A Price
Expectation Model of Customer Brand Choice. Journal of Marketing
Research. 27(August), 251-62.
136. Kander, A., 2005. Baumol's disease and dematerialization of the
economy, Ecological Economics, Volume 55, Issue 1, 5 October 2005,
Pages 119-130. DOI: 10.2307/3172584
137. Kerekes, S., 2012, A fenntartható fejlődésről válság idején. In: Kerekes,
S., Jámbor, I., (edt.): Fenntartható fejlődés, élhető régió, élhető
települési táj, Volume 1., Budapesti Corvinus Egyetem, Pages 15-36.
138. Kerekes, S., Luda, S., 2011. Climate or Rural Development Policy?
Society and Economy in Central and Eastern Europe 1, 145-159. DOI:
10.1556/SocEc.33.2011.1.11
139. Kerekes, S., Szlávik J., 2001. Economic tools for environmental
management (A környezeti menedzsment közgazdasági eszközei),
Kerszöv, Budapest
140. Koch, N., Fuss, S., Grosjean, G., Edenhofer, O., 2014. Causes of the EU
ETS price drop: Recession, CDM, renewable policies or a bit of
everything?—New evidence, Energy Policy, Available online 11 July
2014, ISSN 0301-4215, http://dx.doi.org/10.1016/j.enpol.2014.06.024.
162
141. Kollmuss, A., Agyeman, J., 2002. Mind the gap: why do people act
environmentally and what are the barriers to pro-environmental
behaviour? Environmental Education Research, 8 (2002), pp. 239–260.
DOI: 10.1080/13504620220145401
142. Kotchen, M. J., Moore, M. R., 2007. Private provision of environmental
public goods: Household participation in green-electricity programs,
Journal of Environmental Economics and Management, Volume 53,
Issue 1, Pages 1-16. DOI: 10.1016/j.jeem.2006.06.003
143. Kotler, P., Keller, K. L., 2006. Marketing management, 12th edition,
Prentice Hall, Upper Saddle River, NJ.
144. KSH (Hungarian Statistical Office) database, 2011.
(http://portal.ksh.hu/pls/ksh/docs/hun/xstadat/xstadat_eves/i_qpt001.htm
l, downloaded on 10. 06.2011)
145. KSH (Hungarian Statistical Office), 2012. Online database.
146. KSH (Hungarian Statistical Office), 2014. Online database.
147. Kuik, O., Hofkes, M., 2010. Border adjustment for European emissions
trading: Competitiveness and carbon leakage, Energy Policy, Volume
38, Issue 4, April 2010, Pages 1741-1748, ISSN 0301-4215,
http://dx.doi.org/10.1016/j.enpol.2009.11.048.
148. Lancaster, K. 1966. A new approach to consumer theory. Journal of
Political Economy 74: 132–157.
149. Lazaro, A., Barberan, R., Rubio, E., 2002. The discounted utility model
and social preferences: Some alternative formulations to conventional
discounting. Journal of Economic Psychology 23(3): 317- 337. DOI:
10.1016/S0167-4870(02)00079-X
150. Lenzen, M., Wiedmann, T., Foran, B., Dey, C., Widmer-Cooper, A.,
Williams, M., Ohlemüller, R., 2007. Forecasting the Ecological
Footprint of Nations: A Blueprint for a Dynamic Approach. ISA
Research Report 07-01
151. Lenzen. M., Murray. S. A., 2001. A Modified Ecological Footprint
Method and Its Application to Australia. Ecological Economics 37(2):
229−55. DOI: 10.1016/S0921-8009(00)00275-5
163
152. Leontief, W.W., 1970. Environmental repercussions and the economic
structure: an input–output approach. Review of Economics and
Statistics LII (3), 261–271. DOI: 10.2307/1926294
153. Litvine, D., Wüstenhagen, R., 2011. Helping "light green" consumers
walk the talk: Results of a behavioural intervention survey in the Swiss
electricity market. Ecological Economics, Volume 70, Issue 3, 15
January 2011, Pages 462-474. DOI: 10.1016/j.ecolecon.2010.10.005
154. Longo, A., Markandya, A., Petrucci, M., 2008. The internalization of
externalities in the production of electricity: Willingness to pay for the
attributes of a policy for renewable energy. Ecological Economics.
67(1), 140-152. DOI: 10.1016/j.ecolecon.2007.12.006
155. Loock, M., 2012. Going beyond best technology and lowest price: on
renewable energy investors’ preference for service-driven business
models. Energy Policy 40 (2012) 21–27. DOI:
10.1016/j.enpol.2010.06.059
156. Lorek, S., Spangenberg, J. H., 2014. Sustainable consumption within a
sustainable economy – beyond green growth and green economies,
Journal of Cleaner Production, 63 (2014), Pages 33-44. DOI:
10.1016/j.jclepro.2013.08.045
157. Lucas, K., Brooks, M., Darnton, A., Jones, J. E., 2008. Promoting pro-
environmental behaviour: existing evidence and policy implications,
Environmental Science & Policy, Volume 11, Issue 5, August 2008,
Pages 456-466, http://dx.doi.org/10.1016/j.envsci.2008.03.001.
158. Lyon, T.P., Maxwell, J.W., 1999. Voluntary approaches to
environmental regulations: a survey, M. Franzini, A. Nicita (Eds.),
Environmental Economics: Past, Present and Future, Ashgate
Publishing, Hampshire (1999)
159. MacPherson R., Lange I., 2013, Determinants of green electricity tariff
uptake in the UK. Energy Policy, Volume 62, November 2013, Pages
920-933. DOI: 10.1016/j.enpol.2013.07.089
160. Madlener, R., Stagl, S., 2005. Sustainability-guided promotion of
renewable electricity generation, Ecological Economics, Volume 53,
Issue 2, Pages 147-167. DOI: 10.1016/j.ecolecon.2004.12.016

164
161. Manaster, K., 1995. Environmental Protection and Justice: Readings
and Commentary on Environmental Law and Practice Anderson
Publishing Co, Cincinnati (1995)
162. Marjainé Szerényi, Z., Zsóka, Á., Széchy, A., 2011. Consumer
behaviour and lifestyle patterns of Hungarian students with regard to
environmental awareness. Society and Economy, 33, 89–110. DOI:
10.1556/SocEc.33.2011.1.8
163. Martin, R., de Preux, L. B., Wagner, U. J., 2014a. The impact of a
carbon tax on manufacturing: Evidence from microdata, Journal of
Public Economics, Volume 117, September 2014, Pages 1-14.
http://dx.doi.org/10.1016/j.jpubeco.2014.04.016.
164. Martin, R., Muûls, M., de Preux, L. B., Wagner, U. J., 2014b. On the
empirical content of carbon leakage criteria in the EU Emissions
Trading Scheme, Ecological Economics, Volume 105, September 2014,
Pages 78-88, http://dx.doi.org/10.1016/j.ecolecon.2014.05.010.
165. Mathur, A., Lee, E., Moschis, G. P., 2006. Life-Changing Events and
Marketing Opportunities. Journal of Targeting, Measurement and
Analysis for Marketing, 14(2), 115-128.
DOI: 10.1057/palgrave.jt.5740174
166. Matiaske, W., Menges, R., Spiess, M. 2012. Modifying the rebound: It
depends! Explaining mobility behavior on the basis of the German
socio-economic panel. Energy Policy 41 (2012) 29–35. DOI:
10.1016/j.enpol.2010.11.044
167. Mattes, A., 2012. Potentiale für Ökostrom in Deutschland –
Verbraucherpräferenzen und Investitionsverhalten der Energieversorger.
http://www.diw-econ.de/de/downloads/DIWecon_HSE_Oekostrom.pdf
168. Mauna Loa Observatory database. 2014.
169. MAVIR, 2012. A Magyar villamosenergia-rendszer 2012. évi
statisztikai adatai.
170. MAVIR., 2008. A Magyar villamosenergia-rendszer 2008. évi
statisztikai adatai.
171. McGoldrick, P. J., Marks, H. J., 1987. Shoppers Awareness of Retail
Grocery Prices. European Journal of Marketing. 21(3), 63-76.
http://dx.doi.org/10.1108/EUM0000000004687

165
172. Meunier, G., Ponssard, JP., Quirion, P., 2014. Carbon leakage and
capacity-based allocations. Is the EU right?, Journal of Environmental
Economics and Management, Available online 17 July 2014, ISSN
0095-0696, http://dx.doi.org/10.1016/j.jeem.2014.07.002.
173. Miller, L., Meyer, D. E., Lanzetta, J. T., 1969. Choice Among Equal
Expected Value Alternatives: Sequential Effects of Winning Probability
Level on Risk Preferences, Journal of Experimental Psychology, 79(3),
1969, 419-423.
174. Ministry of National Development, Hungarian Government, 2011.
National Energy Strategy 2030, Hungary, 2011.
175. Mitchell, R. C., Carson, R. T., 1989. Using Surveys to Value Public
Goods: The Contingent Valuation Method, Resources for the Future,
Washington, DC (1989) DOI: 10.2307/3146688
176. Monjon, S., Quirion, P., 2011. Addressing leakage in the EU ETS:
Border adjustment or output-based allocation?, Ecological Economics,
Volume 70, Issue 11, 15 September 2011, Pages 1957-1971, ISSN
0921-8009, http://dx.doi.org/10.1016/j.ecolecon.2011.04.020.
177. Mont, O. K., 2002. Clarifying the concept of product–service system,
Journal of Cleaner Production, Volume 10, Issue 3, June 2002, Pages
237-245. http://dx.doi.org/10.1016/S0959-6526(01)00039-7
178. Moore, B., Wüstenhagen, R., 2004. Innovative and sustainable energy
technologies: the role of venture capital, Business Strategy and the
Environment, 13 (2004), pp. 235–245, DOI: 10.1002/bse.413
179. Mulugetta, Y., Urban, F., 2010. Deliberating on low carbon
development, Energy Policy, Volume 38, Issue 12, December 2010,
Pages 7546-7549. DOI: 10.1016/j.enpol.2010.05.049
180. Murphy, J. J., Allen, P. G., Stevens, T. H., Weatherhead, D., 2005. A
Meta-analysis of Hypothetical Bias in Stated Preference Valuation,
Environmental and Resource Economics, March 2005, Volume 30,
Issue 3, pp 313-325. DOI: 10.1007/s10640-004-3332-z
181. Murthi, B. P. S., Rao, R. C., 2012. Price Awareness and Consumers’
Use of Deals in Brand Choice. Journal of Retailing. 88(1), 34-46. DOI:
10.1016/j.jretai.2011.07.001

166
182. Nakata, T., Silva, D., Rodionov, M., 2011. Application of energy
system models for designing a low-carbon society, Progress in Energy
and Combustion Science, Volume 37, Issue 4, August 2011, Pages 462-
502. DOI: 10.1016/j.pecs.2010.08.001
183. NOAA (National Oceanic and Atmospheric Administration), 2013
http://www.esrl.noaa.gov/gmd/news/pdfs/7074.pdf
184. OECD, 1996. The Knowledge-Based Economy
185. OECD, 2000. The service economy. OECD Publications, Paris.
186. Orme, B. K., 2007. Software for Hierarchical Bayes Estimation for CBC
Data, CBC/HB v4 Sawtooth Software Inc., Sequim, WA (2007)
187. Orme, B., 2010. Getting Started with Conjoint Analysis: Strategies for
Product Design and Pricing Research. Second Edition, Madison.
188. Owens, S., 2000. Engaging the public: information and deliberation in
environmental policy, Environment and Planning A, 32, pp. 1141–1148.
doi:10.1068/a3330
189. Parrinello, S., 2003. The myth of the service economy. MPRA Paper
No. 30829.
190. Parrinello, S., 2004. The service economy revisited, Structural Change
and Economic Dynamics, Volume 15, Issue 4, December 2004, Pages
381-400, http://dx.doi.org/10.1016/j.strueco.2004.01.001.
191. Peters, G. P., Weber, C. L., Guan, D., Hubacek, K., 2007. China's
growing CO2 emissions—a race between increasing consumption and
efficiency gains, Environmental Science and Technology, 41 (2007), pp.
5939–5944. DOI: 10.1021/es070108f
192. Pichert, D., Katsikopoulos, K.V., 2008. Green defaults: Information
presentation and pro-environmental behavior. Journal of Environmental
Psychology, 28 (1), pp. 63-73. DOI: 10.1016/j.jenvp.2007.09.004
193. Pigou, A., The economics of welfare, (4th edition) Macmillan & Co,
London, UK (1920/1938)
194. Poortinga, W., Steg, L., Vlek, C., Wiersma, G., 2003. Household
preferences for energy-saving measures: A conjoint analysis. Journal of
Economic Psychology 24 (2003) 49–64. DOI: 10.1016/S0167-
4870(02)00154-X

167
195. Rajecki, D.W., 1982. Attitudes: themes and advances. Sunderland, MA,
Sinauer.
196. Ramajo-Hernández, J., del Saz-Salazar, S., 2012. Estimating the non-
market benefits of water quality improvement for a case study in Spain:
A contingent valuation approach, Environmental Science & Policy,
Volume 22, October 2012, Pages 47-59. DOI:
10.1016/j.envsci.2012.05.006
197. Ravallion, M., Lokshin, M., 2005. Who cares about relative
deprivation? Washington DC: Development Research Group, The
World Bank. DOI: 10.1016/j.jebo.2009.08.008
198. Roe, B., Teisl, M. F., Levy, A., Russell, M., 2001. US consumers’
willingness to pay for green electricity. Energy Policy. 29(11), 917-925.
DOI: 10.1016/S0301-4215(01)00006-4
199. Romm, J., Rosenfeld, A., Herrman, S., 1999. The internet economy and
global warming. Tech. rep. The Center for Energy and Climate
Solutions.
200. Rossi, P., Allenby, G., McCulloch, R., 2005. Bayesian Statistics and
Marketing, Wiley, New York (2005)
201. Rossi, P.E., Allenby, G. M., 2003. Bayesian statistics and marketing.
Marketing Science, 22 (2003), pp. 304–328.
202. Rowlands, I. H., Scott, D., Parker, P., 2003. Consumers and green
electricity: profiling potential purchasers. Business Strategy and the
Environment. 12(1), 36-48. DOI: 10.1002/bse.346
203. Rubik F, Frankl P, Pietroni L, Scheer D. 2007. Eco‐labelling and
consumers: towards a re-focus and integrated approaches. International
Journal of Innovation and Sustainable Development 2(2): 175–
191. DOI: 10.1504/IJISD.2007.016932
204. Ruderman, H., Levine, M. D., Mcmahon, J. E., 1987. The Behavior of
the Market for Energy Efficiency in Residential Appliances Including
Heating and Cooling Equipment, Energy J. 8:1, p p 101-24.
205. Ruth, M., 1998. Dematerialization in five US metals sectors:
implications for energy use and CO2 emissions, Resources Policy,
168
Volume 24, Issue 1, March 1998, Pages 1-18. DOI: 10.1016/S0301-
4207(98)00003-8
206. Sagoff, M., 1997. Do we consume too much? The Atlantic Monthly,
80–96.
207. Sammer, K., Wüstenhagen, R., 2006. The Influence of Eco-Labelling on
Consumer Behaviour – Results of a Discrete Choice Analysis for
Washing Machines, Business Strategy and the Environment, 15, Pages
185-199. DOI: 10.1002/bse.522
208. Sanne, C., 2002. Willing consumers—Or locked-in? Policies for a
sustainable consumption. Ecological Economics, 42, 273–287.
doi:10.1016/S0921-8009(02)00086-1. DOI: 10.1016/S0921-
8009(02)00086-1
209. Sardianou, E., 2007. Estimating energy conservation patterns of Greek
households. Energy Policy 35, 3778–3791. DOI:
10.1016/j.enpol.2007.01.020
210. Sawtooth Software, 2004. The CBC Latent Class: Version 3.0.
Technical Paper. Sequim, WA.
211. Sawtooth Software, 2009. The CBC/HB System for Hierarchical Bayes:
Version 5.0. Technical Paper. Sequim, WA.
212. Sawtooth, 2007. The ACA/Web v6.0 – Technical Paper Series, 2007.
213. Schaltegger, S., Csutora, M., 2012. Carbon accounting for sustainability
and management. Status quo and challenges, Journal of Cleaner
Production, Volume 36, November 2012, Pages 1-16. DOI:
10.1016/j.jclepro.2012.06.024
214. Schinko, T., Bednar-Friedl, B., Steininger, K. W., Grossmann, W. D.,
2014. Switching to carbon-free production processes: Implications for
carbon leakage and border carbon adjustment, Energy Policy, Volume
67, April 2014, Pages 818-831, ISSN 0301-4215,
http://dx.doi.org/10.1016/j.enpol.2013.11.077.
215. Schläpfer, F., Fischhoff, B., 2012. Task familiarity and contextual cues
predict hypothetical bias in a meta-analysis of stated preference studies,
Ecological Economics, Volume 81, September 2012, Pages 44-47. DOI:
10.1016/j.ecolecon.2012.06.016

169
216. Shove, E., 2004. Changing human behaviour and lifestyle: a challenge
for sustainable consumption?. In: L. Reisch and I. Ropke. Editors. The
Ecological Economics of Consumption. Edward Elgar. Cheltenham
(2004).
217. Siegrist, M., Visschers, V. H. M., 2013. Acceptance of nuclear power:
The Fukushima effect, Energy Policy, Volume 59, August 2013, Pages
112-119. DOI: 10.1016/j.enpol.2012.07.051
218. Simpson, J. A., Griskevicius, V., Rothman, A. J., 2012. Consumer
decisions in relationships, Journal of Consumer Psychology, Volume
22, Issue 3, July 2012, Pages 304-314. DOI: 10.1016/j.jcps.2011.09.007
219. Skea, J., Nishioka, S., 2008. Policies and practices for a low carbon
society, Climate Policy, 8, s5-s16. doi:10.3763/cpol.2008.0487
220. Sterman J.D., Sweeney, L.B., 2007. Understanding public complacency
about climate change: Adults’ mental models of climate change violate
conservation of matter, Climatic Change, 80, 213–238 pp. DOI
10.1007/s10584-006-9107-5
221. Stern, P. C., 2000. Toward a coherent theory of environmentally
significant behaviour. Journal of Social Issues, 56, 407e424.
DOI: 10.1111/0022-4537.00175
222. Stern, P. C., Dietz, T. Karlof, L., 1993. Values orientation, gender, and
environmental concern, Environment and Behavior, 25(3), pp. 322–348.
doi: 10.1177/0013916593255002
223. Stocker, T.F., D. Qin, G.-K. Plattner, L.V. Alexander, S.K. Allen, N.L.
Bindoff, F.-M. Bréon, J.A. Church, U. Cubasch, S. Emori, P. Forster, P.
Friedlingstein, N. Gillett, J.M. Gregory, D.L. Hartmann, E. Jansen, B.
Kirtman, R. Knutti, K. Krishna Kumar, P. Lemke, J. Marotzke, V.
Masson-Delmotte, G.A. Meehl, I.I. Mokhov, S. Piao, V. Ramaswamy,
D. Randall, M. Rhein, M. Rojas, C. Sabine, D. Shindell, L.D. Talley,
D.G. Vaughan and S.-P. Xie, 2013: Technical Summary. In: Climate
Change 2013: The Physical Science Basis. Contribution of Working
Group I to the Fifth Assessment Report of the Intergovernmental Panel
on Climate Change [Stocker, T.F., D. Qin, G.-K. Plattner, M. Tignor,
S.K. Allen, J. Boschung, A. Nauels, Y. Xia, V. Bex and P.M. Midgley
170
(eds.)]. Cambridge University Press, Cambridge, United Kingdom and
New York, NY, USA
224. Stram, B. N., 2014. A new strategic plan for a carbon tax, Energy
Policy, Available online 11 June 2014,
http://dx.doi.org/10.1016/j.enpol.2014.05.023.
225. Su, B., Ang, B.W., 2012. Structural decomposition analysis applied to
energy and emissions: Some methodological developments, Energy
Economics, Volume 34, Issue 1, January 2012, Pages 177-188,
http://dx.doi.org/10.1016/j.eneco.2011.10.009.
226. Suh, S., 2006. Are services better for climate change?. Environmental
Science and Technology 40 (21), 6555–6560. DOI: 10.1021/es0609351
227. Suh, S., Kagawa S., 2009. Industrial ecology and input–output
economics: a brief history. In: Suh S, editor. Handbook of input–output
economics in industrial ecology. 2009. p. 43–58. ISSN 1389-6970,
ISBN 978-1-4020-4083-2.
228. Suh, S., Lenzen, M., Treloar, G.J., Hondo, H., Horvath, A., Huppes, G.,
Jolliet, O., Klann, U., Krewitt, W., Moriguchi, Y., Munksgaard, J. and
Norris, G. 2004. System boundary selection in life-cycle inventories
using hybrid approaches. Environmental Science & Technology 38(3):
657-664. DOI: 10.1021/es0263745
229. Szajkó, G., 2009. Erdészeti és ültetvény eredetű fás szárú energetikai
biomassza Magyarországon. Working paper, 2009-5, Regionális
Energiagazdasági Kutatóközpont, Budapesti Corvinus Egyetem.
230. Szlávik, J., Csete, M., 2011. Climate and Energy Policy in Hungary,
Energies 5: (2) pp. 494-517. doi:10.3390/en5020494
231. Thayer, R.L., 1988. The aesthetics of wind energy in the United States:
case studies in public perception. European Community Wind Energy
Conference, Herning, DK, June 6–8. pp. 470–476.
232. Thogersen J. 2000. Psychological determinants of paying attention to
eco-labels in purchase decisions: model development and multinational
validation. Journal of Consumer Policy 23(3): 285–313. DOI:
10.1023/A:1007122319675
171
233. Thøgersen, J., 1999. Spillover processes in the development of a
sustainable consumption pattern. Journal of Economic Psychology, 20,
53-81. DOI: 10.1016/S0167-4870(98)00043-9
234. Thøgersen, J., Gronhoj, A., 2010. Electricity saving in households—A
social cognitive approach. Energy Policy 38 (2010) 7732–7743. DOI:
10.1016/j.enpol.2010.08.025
235. Tian, X., Chang, M., Tanikawa, H., Shi, F., Imura, H., 2013. Structural
decomposition analysis of the carbonization process in Beijing: A
regional explanation of rapid increasing carbon dioxide emission in
China, Energy Policy, Volume 53, February 2013, Pages 279-286,
http://dx.doi.org/10.1016/j.enpol.2012.10.054.
236. Toffler, A. (1980), The Third Wave, William Morrow.
237. Tóth, G., Szigeti, C., 2013. The Historical Ecological Footprint of
Mankind from 10,000 B.C. to Today, Georgikon Conference, 2013,
ISBN 978-963-9639-53-9.
238. Treloar, G. J., Love, P. E. D., Holt, G. D., 2001. Using national
input/output data for embodied energy analysis of individual residential
buildings, Construction Management and Economics, Vol. 19, Iss. 1,
pages 49-61. DOI: 10.1080/014461901452076
239. Tucker, P., Douglas, P., 2006. Understanding Waste Reduction
Attitudes and Behaviours. Proc. WASTE 2006, Stratford Upon Avon,
September 2006.
240. Tukker, A., 2013. Product services for a resource-efficient and circular
economy – a review, Journal of Cleaner Production, Available online 7
December 2013, http://dx.doi.org/10.1016/j.jclepro.2013.11.049.
241. Tukker, A., Tischner, U., 2006. Product-services as a research field:
past, present and future. Reflections from a decade of research. J. Clean.
Prod. 14 (17), 1552e1556. DOI: 10.1016/j.jclepro.2006.01.022
242. UNEP, 2000. Product-Service Systems and Sustainability, ISBN:92-
807-2206-9
243. UNFCCC, 2009a. Fact sheet: The need for mitigation.
https://unfccc.int/files/press/backgrounders/application/pdf/press_factsh
_mitigation.pdf
172
244. UNFCCC, 2009b. Report of the Conference of the Parties on its
fifteenth session, held in Copenhagen
http://unfccc.int/resource/docs/2009/cop15/eng/11a01.pdf
245. UNFCCC, 2010. Report of the Conference of the Parties on its sixteenth
session, held in Cancun from 29 November to 10 December 2010 -
Decisions adopted by the Conference of the Parties
http://unfccc.int/resource/docs/2010/cop16/eng/07a01.pdf#page=2
246. Upham, P., Dendler, L., Bleda, M., 2011. Carbon labelling of grocery
products: public perceptions and potential emissions reductions, Journal
of Cleaner Production, Volume 19, Issue 4, March 2011, Pages 348-
355. DOI: 10.1016/j.jclepro.2010.05.014
247. Urge-Vorsatz, D., Petrichenko, K., Staniec, M., Eom, J., 2013. Energy
use in buildings in a long-term perspective, Current Opinion in
Environmental Sustainability, Volume 5, Issue 2, June 2013, Pages 141-
151. DOI: 10.1016/j.cosust.2013.05.004
248. van Oel, C. J., van den Berkhof, F. W., 2013. Consumer preferences in
the design of airport passenger areas, Journal of Environmental
Psychology, Volume 36, December 2013, Pages 280-290. DOI:
10.1016/j.jenvp.2013.08.005
249. Vermunt, J. K., Magidson, J., 2005. Latent GOLD 4.0 User's Guide.
Belmont, Massachusetts: Statistical Innovations Inc.
250. Wackernagel. M., Rees. W. E., 1996. Our Ecological Footprint-
Reducing Human Impact on the Earth. New Society Publishers.
Gabriola Island. B.C.
251. Wang, Z., Zhang, B., Yin, J., Zhang, Y., 2011. Determinants and policy
implications for household electricity- saving behaviour: evidence from
Beijing, China. Energy Policy, 39, 3550–3557. DOI:
10.1016/j.enpol.2011.03.055
252. WCED (World Commission on Environment and Development), 1987.
Our Common Future, Oxford University Press, Oxford.
253. Weisz, H., Duchin, F. 2006. Physical and monetary input–output
analysis: What makes the difference?. Ecological Economics 57 (2006)
534– 541. DOI: 10.1016/j.ecolecon.2005.05.011
173
254. Wenke, M., 1993. Konsumstruktur, Umweltbewusstsein und
Umweltpolitik. Eine makroökonomische Analyse des Zusammenhanges
in ausgewählten Konsumbereichen. Berlin: Duncker & Humblot.
255. Whitmarsh, L., O’Neill, S., 2010. Green identity, green living? The role
of pro-environmental self-identity in determining consistency across
diverse pro-environmental behaviours. Journal of Environmental
Psychology 30 (2010) 305–314. DOI: 10.1016/j.jenvp.2010.01.003
256. Whittaker, C., McManus, M. C., Smith, P., 2013. A comparison of
carbon accounting tools for arable crops in the United Kingdom,
Environmental Modelling & Software, Volume 46, August 2013, Pages
228-239. DOI: 10.1016/j.envsoft.2013.03.015
257. Wiedmann, T. 2009. A review of recent multi-region input–output
models used for consumption-based emission and resource accounting.
Ecological Economics 69 (2009) 211–222.
258. Wind, Y., 1978. Issue and advances in segmentation research, Journal of
Marketing Research, Vol. 15 pp.317-37. DOI: 10.2307/3150580
259. Wiser, R. H., 2007. Using contingent valuation to explore willingness to
pay for renewable energy: A comparison of collective and voluntary
payment vehicles. Ecological Economics. 62(3-4), 419-432. DOI:
10.1016/j.ecolecon.2006.07.003
260. Wolsink, M. 1987. Wind power for the electricity supply of houses.
Netherlands Journal of Housing and Environmental Research, 2 (3)
(1987), pp. 195–214. DOI: 10.1007/BF02497872
261. Wüstenhagen, R., Wolsink, M., Bürer, M. J., 2007. Social acceptance of
renewable energyinnovation: An introduction to the concept. Energy
Policy 35 (5): 2683-2691. DOI: 10.1016/j.enpol.2006.12.001
262. WWF (World Wild Fund), 2011. Planning development in a carbon
constrained world.
http://www.wwfblogs.org/climate/sites/default/files/WWFBinaryitem25
183.pdf
263. Zacharakis, A. L., Meyer, G. D., 1998. A lack of insight: do venture
capitalists really understand their own decision process? Journal of
Business Venturing 13(1): 57- 76. DOI: 10.1016/S0883-
9026(97)00004-9
174
264. Zarnikau, J., 2003. Consumer demand for ‘green power’ and energy
efficiency. Energy Policy. 31(15), 1661-1672. DOI: 10.1016/S0301-
4215(02)00232-X
265. Zhai, P., Williams, E.D., 2012. Analyzing consumer acceptance of
photovoltaics (PV) using fuzzy logic model, Renewable Energy,
Volume 41, May 2012, Pages 350-357.
http://dx.doi.org/10.1016/j.renene.2011.11.041.
266. Zhang, L., Wu, Y., 2012. Market segmentation and willingness to pay
for green electricity among urban residents in China: The case of
Jiangsu Province. Energy Policy. 51(0), 514-523. DOI:
10.1016/j.enpol.2012.08.053
267. Zoric, J., Hrovatin, N., 2012. Household willingness to pay for green
electricity in Slovenia. Energy Policy. 47, 180-187. DOI:
10.1016/j.enpol.2012.04.055
268. Zsóka, A., 2008. Consistency and “awareness gaps” in the
environmental behaviour of Hungarian companies, Journal of Cleaner
Production, Volume 16, Issue 3, February 2008, Pages 322-329,
DOI: 10.1016/j.jclepro.2006.07.044