Embed Size (px)
Citation preview
Embracing the Ecommerce Revolution in Asia and the Pacific
Jong Woo KangPrincipal Economist
Economic Research and Regional Cooperation Department
Asian Development Bank
Key messages▪ E-commerce revolution in Asia and the Pacific presents
vast economic potential
▪ E-commerce market in the region remains highly
heterogeneous in (i) economic factors and conditions, (ii)
legal and institutional environment and (iii) social
acceptance
▪ The emergence of new technologies will shape the e-
commerce landscape
▪ Developing a viable e-commerce ecosystem requires a
holistic approach and concerted efforts by all stakeholders
▪ Complex border procedures and regulatory burdens need
easing to foster cross-border e-commerce
2
Evolution of E-commerce in Asia and the Pacific
3
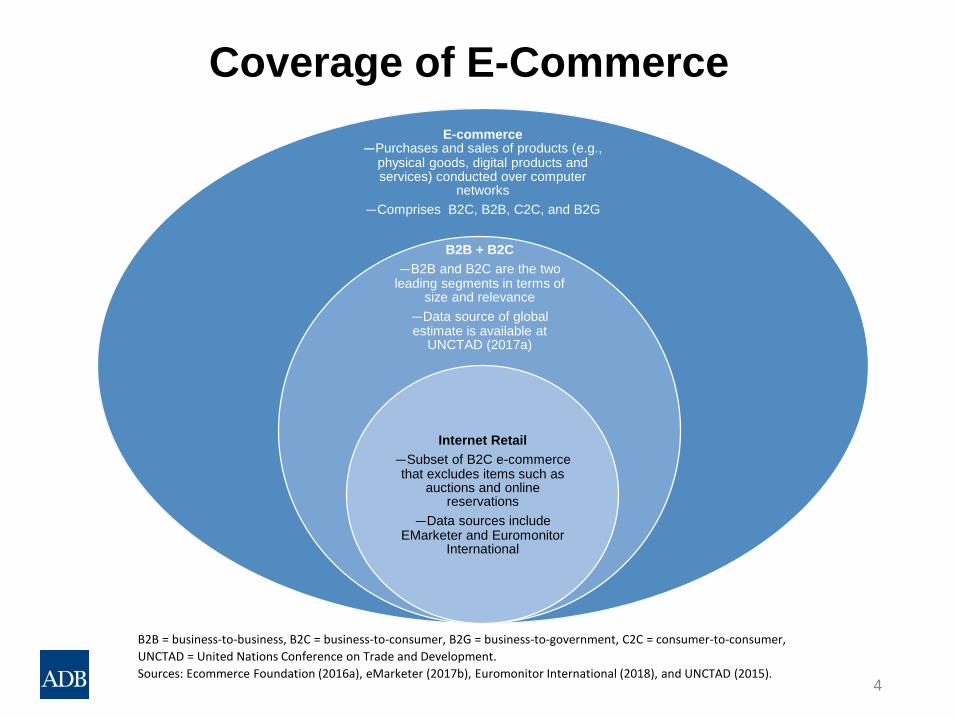
Coverage of E-Commerce
4
E-commerce—Purchases and sales of products (e.g.,
physical goods, digital products and services) conducted over computer
networks
—Comprises B2C, B2B, C2C, and B2G
B2B + B2C
—B2B and B2C are the two leading segments in terms of
size and relevance
—Data source of global estimate is available at
UNCTAD (2017a)
Internet Retail
—Subset of B2C e-commerce that excludes items such as
auctions and online reservations
—Data sources include EMarketer and Euromonitor
International
B2B = business-to-business, B2C = business-to-consumer, B2G = business-to-government, C2C = consumer-to-consumer,
UNCTAD = United Nations Conference on Trade and Development.
Sources: Ecommerce Foundation (2016a), eMarketer (2017b), Euromonitor International (2018), and UNCTAD (2015).
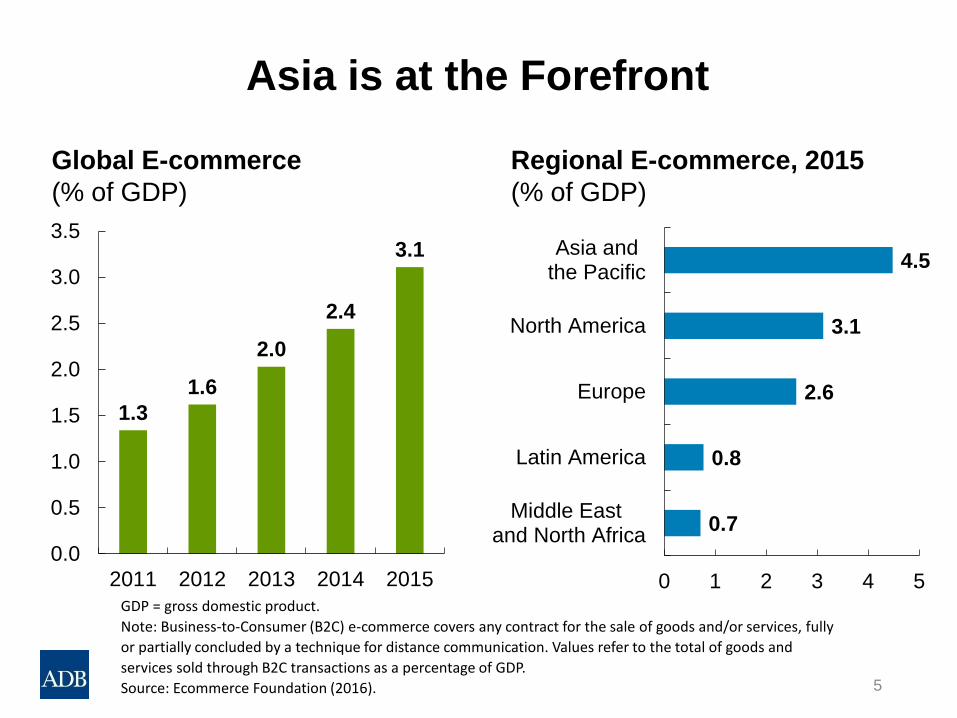
Asia is at the Forefront
5
GDP = gross domestic product.
Note: Business-to-Consumer (B2C) e-commerce covers any contract for the sale of goods and/or services, fully
or partially concluded by a technique for distance communication. Values refer to the total of goods and
services sold through B2C transactions as a percentage of GDP.
Source: Ecommerce Foundation (2016).
0.7
0.8
2.6
3.1
4.5
0 1 2 3 4 5
Middle East and North Africa
Latin America
Europe
North America
Asia andthe Pacific
Global E-commerce
(% of GDP)
Regional E-commerce, 2015
(% of GDP)
1.3
1.6
2.0
2.4
3.1
0.0
0.5
1.0
1.5
2.0
2.5
3.0
3.5
2011 2012 2013 2014 2015
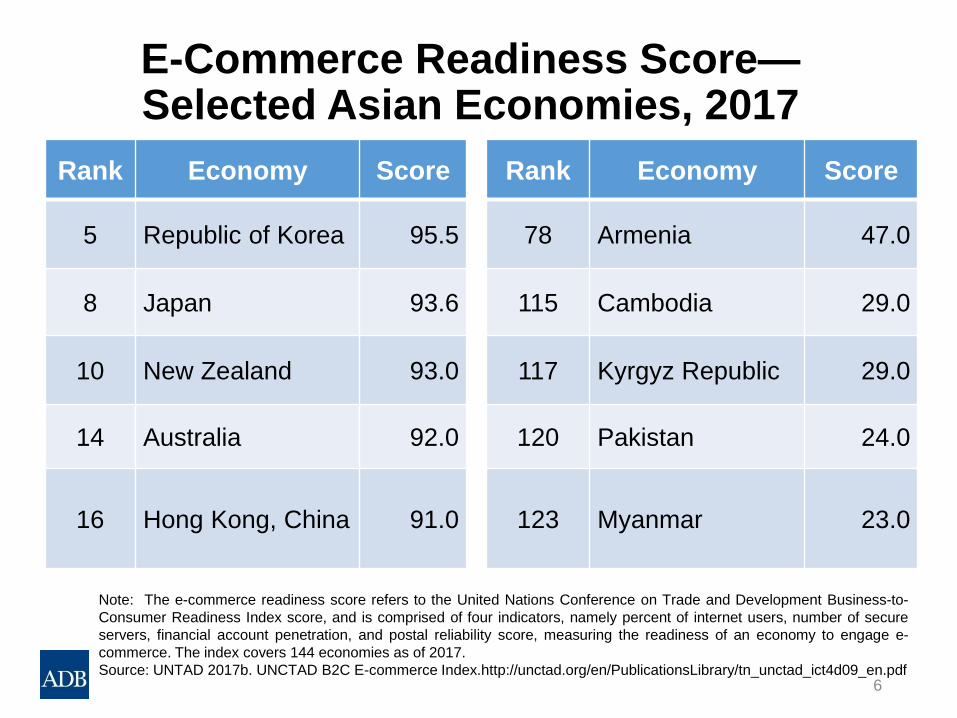
E-Commerce Readiness Score—Selected Asian Economies, 2017
6
Rank Economy Score Rank Economy Score
5 Republic of Korea 95.5 78 Armenia 47.0
8 Japan 93.6 115 Cambodia 29.0
10 New Zealand 93.0 117 Kyrgyz Republic 29.0
14 Australia 92.0 120 Pakistan 24.0
16 Hong Kong, China 91.0 123 Myanmar 23.0
Note: The e-commerce readiness score refers to the United Nations Conference on Trade and Development Business-to-
Consumer Readiness Index score, and is comprised of four indicators, namely percent of internet users, number of secure
servers, financial account penetration, and postal reliability score, measuring the readiness of an economy to engage e-
commerce. The index covers 144 economies as of 2017.
Source: UNTAD 2017b. UNCTAD B2C E-commerce Index.http://unctad.org/en/PublicationsLibrary/tn_unctad_ict4d09_en.pdf
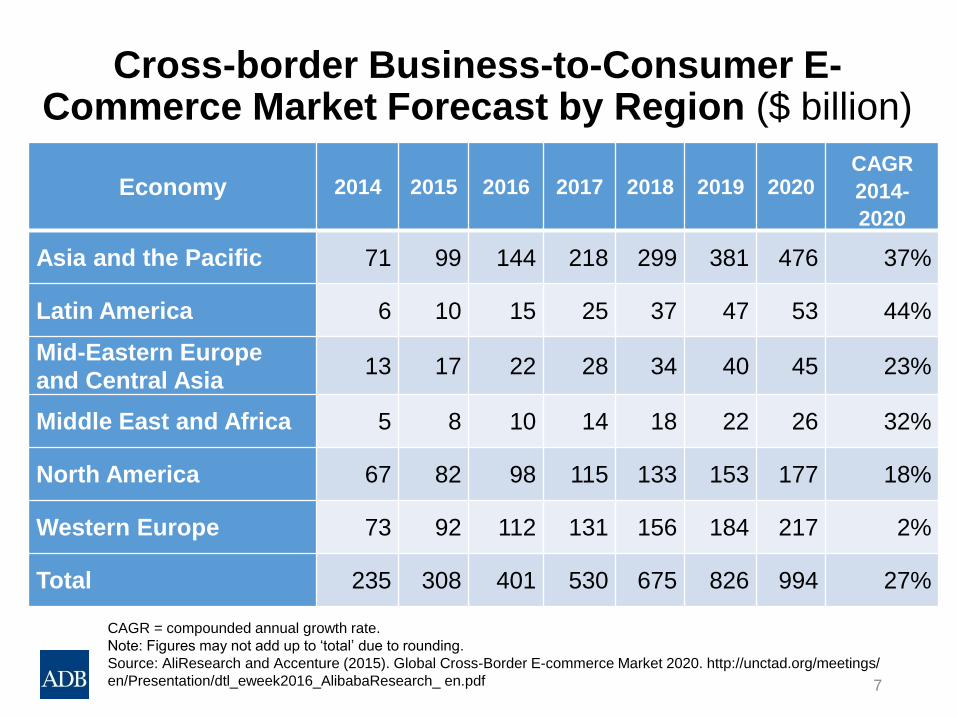
Cross-border Business-to-Consumer E-Commerce Market Forecast by Region ($ billion)
7
CAGR = compounded annual growth rate.
Note: Figures may not add up to ‘total’ due to rounding.
Source: AliResearch and Accenture (2015). Global Cross-Border E-commerce Market 2020. http://unctad.org/meetings/
en/Presentation/dtl_eweek2016_AlibabaResearch_ en.pdf
Economy 2014 2015 2016 2017 2018 2019 2020CAGR
2014-
2020
Asia and the Pacific 71 99 144 218 299 381 476 37%
Latin America 6 10 15 25 37 47 53 44%
Mid-Eastern Europe
and Central Asia13 17 22 28 34 40 45 23%
Middle East and Africa 5 8 10 14 18 22 26 32%
North America 67 82 98 115 133 153 177 18%
Western Europe 73 92 112 131 156 184 217 2%
Total 235 308 401 530 675 826 994 27%
Analytical Framework
8
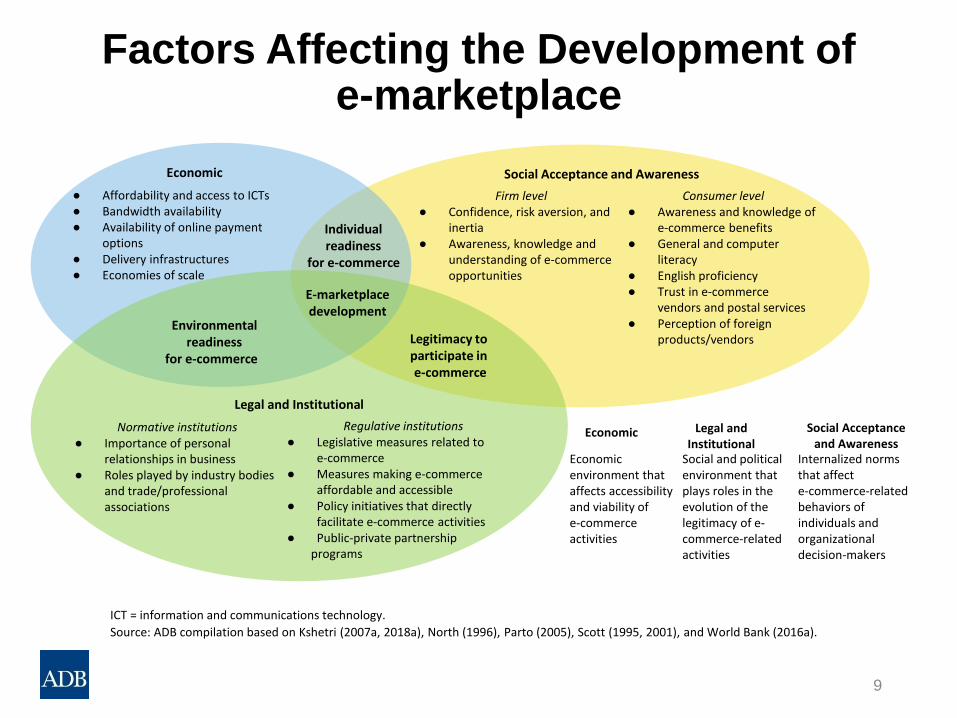
Factors Affecting the Development of e-marketplace
9
ICT = information and communications technology.
Source: ADB compilation based on Kshetri (2007a, 2018a), North (1996), Parto (2005), Scott (1995, 2001), and World Bank (2016a).
● Affordability and access to ICTs ● Bandwidth availability ● Availability of online payment
options● Delivery infrastructures ● Economies of scale
Economic Social Acceptance and Awareness
Firm level● Confidence, risk aversion, and
inertia● Awareness, knowledge and
understanding of e-commerce opportunities
Consumer level● Awareness and knowledge of
e-commerce benefits● General and computer
literacy● English proficiency● Trust in e-commerce
vendors and postal services● Perception of foreign
products/vendorsEnvironmental
readiness for e-commerce
E-marketplace development
Legal and Institutional
Normative institutions● Importance of personal
relationships in business● Roles played by industry bodies
and trade/professional associations
Economic Legal and Institutional
Social Acceptance and Awareness
Regulative institutions● Legislative measures related to
e-commerce● Measures making e-commerce
affordable and accessible● Policy initiatives that directly
facilitate e-commerce activities● Public-private partnership
programs
Economic environment that affects accessibility and viability of e-commerce activities
Internalized norms that affect e-commerce-related behaviors of individuals and organizational decision-makers
Social and political environment that plays roles in the evolution of the legitimacy of e-commerce-related activities
Legitimacy to participate in e-commerce
Individual readiness
for e-commerce
Current Status and Challenges
10
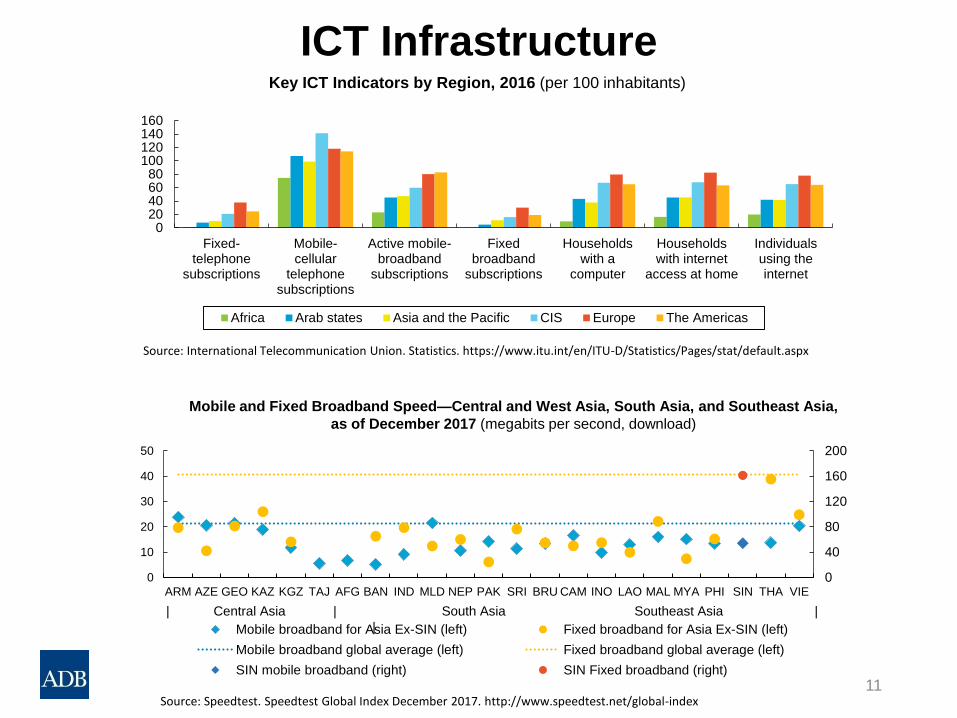
ICT Infrastructure
11
020406080
100120140160
Fixed-telephone
subscriptions
Mobile-cellular
telephonesubscriptions
Active mobile-broadband
subscriptions
Fixedbroadband
subscriptions
Householdswith a
computer
Householdswith internet
access at home
Individualsusing theinternet
Africa Arab states Asia and the Pacific CIS Europe The Americas
Source: International Telecommunication Union. Statistics. https://www.itu.int/en/ITU-D/Statistics/Pages/stat/default.aspx
Mobile and Fixed Broadband Speed—Central and West Asia, South Asia, and Southeast Asia,
as of December 2017 (megabits per second, download)
Key ICT Indicators by Region, 2016 (per 100 inhabitants)
Source: Speedtest. Speedtest Global Index December 2017. http://www.speedtest.net/global-index
0
40
80
120
160
200
0
10
20
30
40
50
ARM AZE GEO KAZ KGZ TAJ AFG BAN IND MLD NEP PAK SRI BRU CAM INO LAO MAL MYA PHI SIN THA VIE
Mobile broadband for Asia Ex-SIN (left) Fixed broadband for Asia Ex-SIN (left)
Mobile broadband global average (left) Fixed broadband global average (left)
SIN mobile broadband (right) SIN Fixed broadband (right)
| Central Asia | South Asia
|
Southeast Asia |
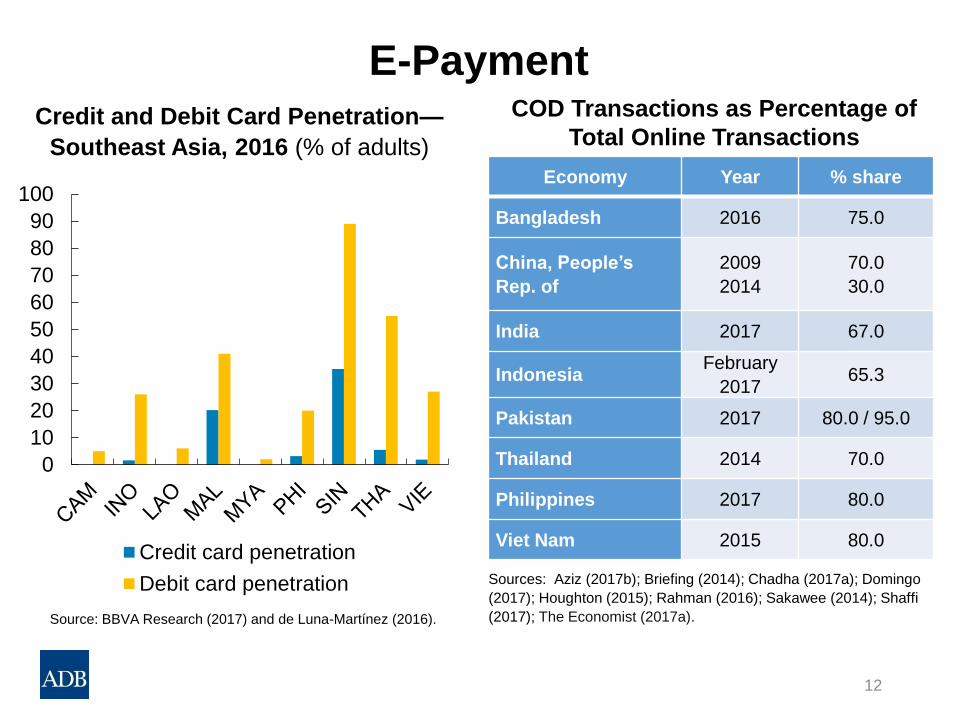
E-Payment
12
0
10
20
30
40
50
60
70
80
90
100
Credit card penetration
Debit card penetration
Economy Year % share
Bangladesh 2016 75.0
China, People’s
Rep. of
2009
2014
70.0
30.0
India 2017 67.0
Indonesia February
2017 65.3
Pakistan 2017 80.0 / 95.0
Thailand 2014 70.0
Philippines 2017 80.0
Viet Nam 2015 80.0
COD Transactions as Percentage of
Total Online TransactionsCredit and Debit Card Penetration—
Southeast Asia, 2016 (% of adults)
Sources: Aziz (2017b); Briefing (2014); Chadha (2017a); Domingo
(2017); Houghton (2015); Rahman (2016); Sakawee (2014); Shaffi
(2017); The Economist (2017a).Source: BBVA Research (2017) and de Luna-Martínez (2016).
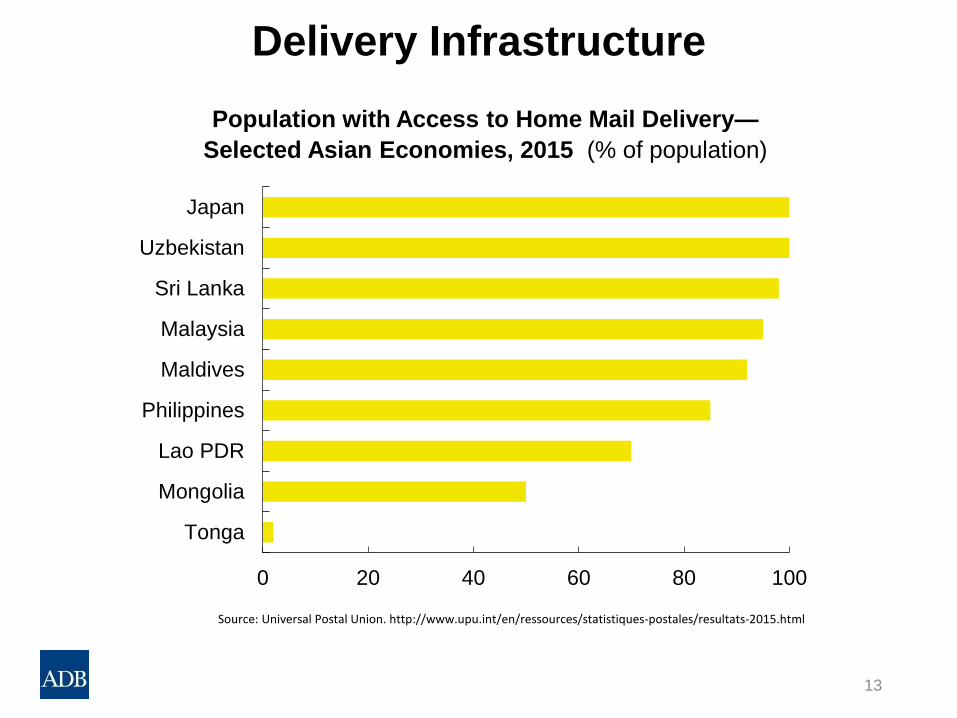
Delivery Infrastructure
13
0 20 40 60 80 100
Tonga
Mongolia
Lao PDR
Philippines
Maldives
Malaysia
Sri Lanka
Uzbekistan
Japan
Population with Access to Home Mail Delivery—
Selected Asian Economies, 2015 (% of population)
Source: Universal Postal Union. http://www.upu.int/en/ressources/statistiques-postales/resultats-2015.html
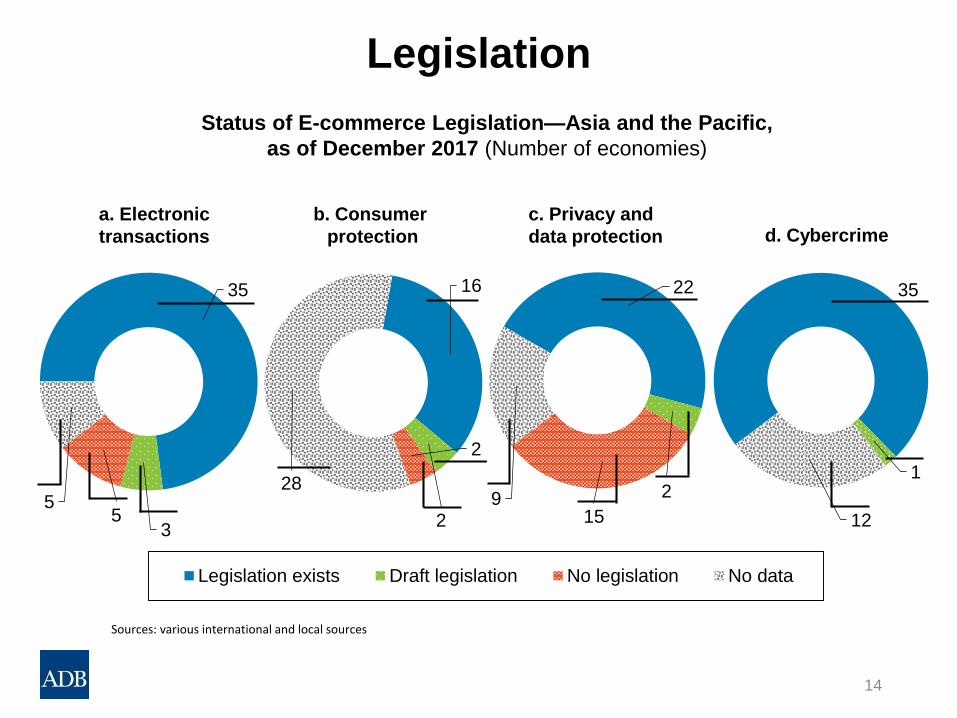
Legislation
Status of E-commerce Legislation—Asia and the Pacific,
as of December 2017 (Number of economies)
Legislation exists Draft legislation No legislation No data
35
35
5
16
2
2
28
22
2
159
35
1
12
b. Consumer
protection
c. Privacy and
data protection d. Cybercrimea. Electronic
transactions
Sources: various international and local sources
14
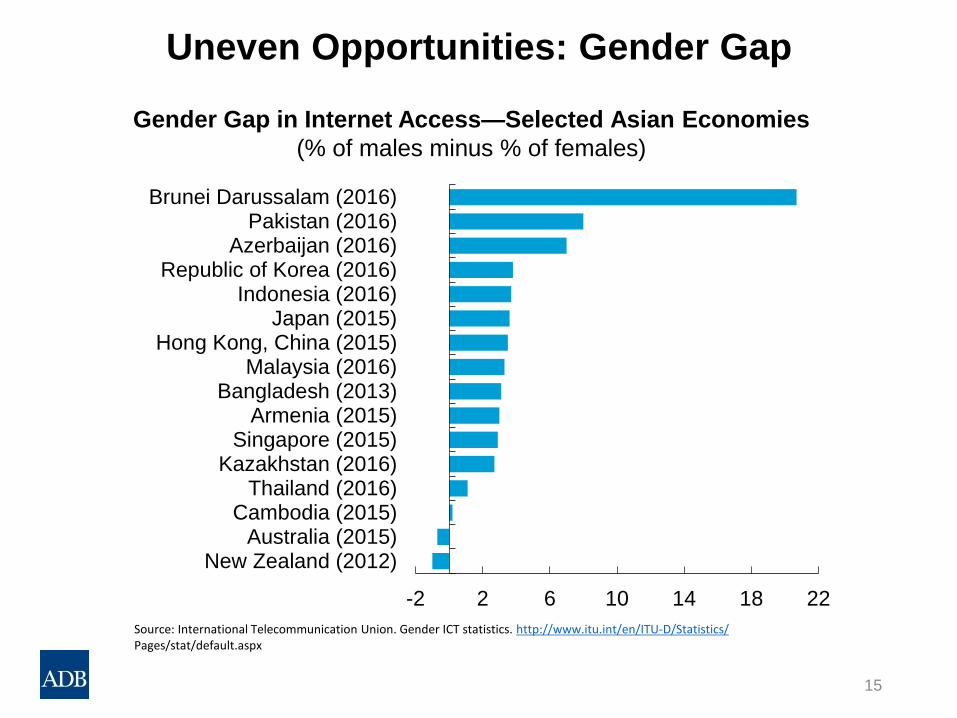
Uneven Opportunities: Gender Gap
15
Gender Gap in Internet Access—Selected Asian Economies
(% of males minus % of females)
-2 2 6 10 14 18 22
New Zealand (2012)Australia (2015)
Cambodia (2015)Thailand (2016)
Kazakhstan (2016)Singapore (2015)
Armenia (2015)Bangladesh (2013)
Malaysia (2016)Hong Kong, China (2015)
Japan (2015)Indonesia (2016)
Republic of Korea (2016)Azerbaijan (2016)
Pakistan (2016)Brunei Darussalam (2016)
Source: International Telecommunication Union. Gender ICT statistics. http://www.itu.int/en/ITU-D/Statistics/Pages/stat/default.aspx
Key Opportunities
16
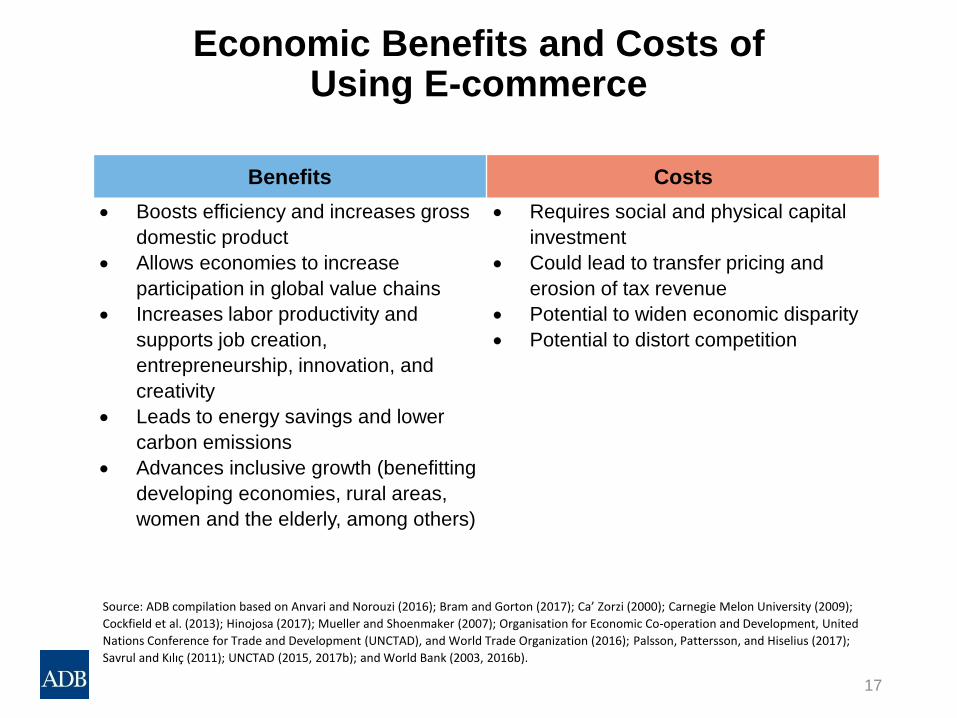
Economic Benefits and Costs of Using E-commerce
17
Benefits Costs
• Boosts efficiency and increases gross
domestic product
• Allows economies to increase
participation in global value chains
• Increases labor productivity and
supports job creation,
entrepreneurship, innovation, and
creativity
• Leads to energy savings and lower
carbon emissions
• Advances inclusive growth (benefitting
developing economies, rural areas,
women and the elderly, among others)
• Requires social and physical capital
investment
• Could lead to transfer pricing and
erosion of tax revenue
• Potential to widen economic disparity
• Potential to distort competition
Source: ADB compilation based on Anvari and Norouzi (2016); Bram and Gorton (2017); Ca’ Zorzi (2000); Carnegie Melon University (2009);
Cockfield et al. (2013); Hinojosa (2017); Mueller and Shoenmaker (2007); Organisation for Economic Co-operation and Development, United
Nations Conference for Trade and Development (UNCTAD), and World Trade Organization (2016); Palsson, Pattersson, and Hiselius (2017);
Savrul and Kılıç (2011); UNCTAD (2015, 2017b); and World Bank (2003, 2016b).
Enhancing Inclusiveness
18
▪ Rapid growth in internet and mobile phone access
▪ Developments in e-payment
▪ Improving logistics-related technologies and infrastructure
to benefit the disadvantaged
▪ Improved access to e-commerce-enabling technologies in
developing countries and LDCs
▪ Improved access to advanced e-commerce-enabling
technologies for SMEs
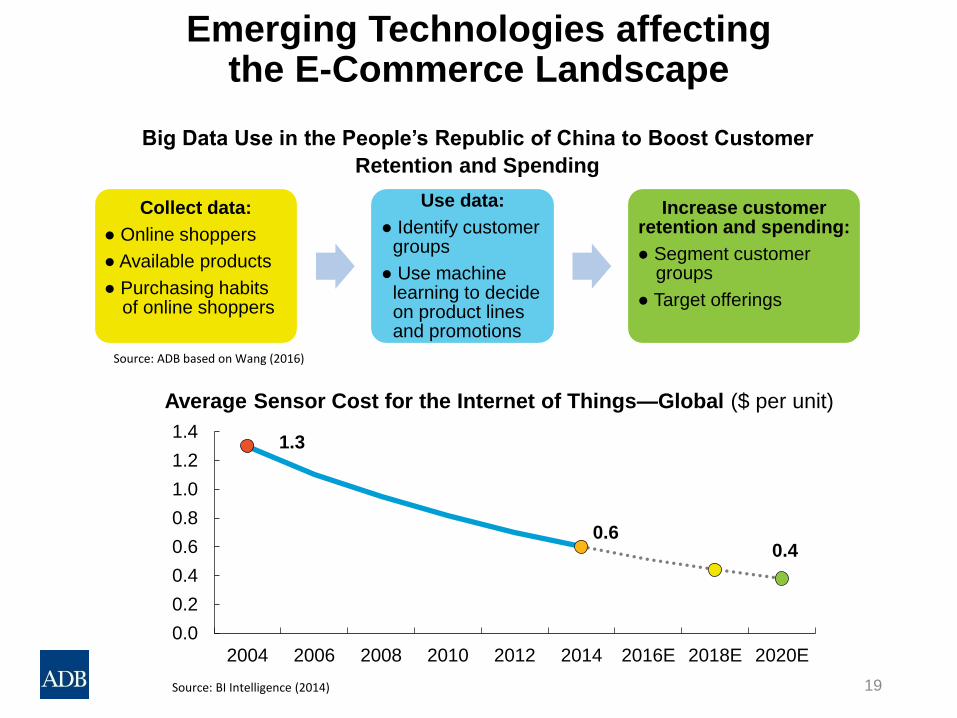
Emerging Technologies affecting the E-Commerce Landscape
19
Big Data Use in the People’s Republic of China to Boost Customer
Retention and Spending
Collect data:
● Online shoppers
● Available products
● Purchasing habits of online shoppers
Use data:
● Identify customer groups
● Use machine learning to decide on product lines and promotions
Increase customer retention and spending:
● Segment customer groups
● Target offerings
Source: ADB based on Wang (2016)
1.3
0.60.4
0.0
0.2
0.4
0.6
0.8
1.0
1.2
1.4
2004 2006 2008 2010 2012 2014 2016E 2018E 2020E
Average Sensor Cost for the Internet of Things—Global ($ per unit)
Source: BI Intelligence (2014)
20
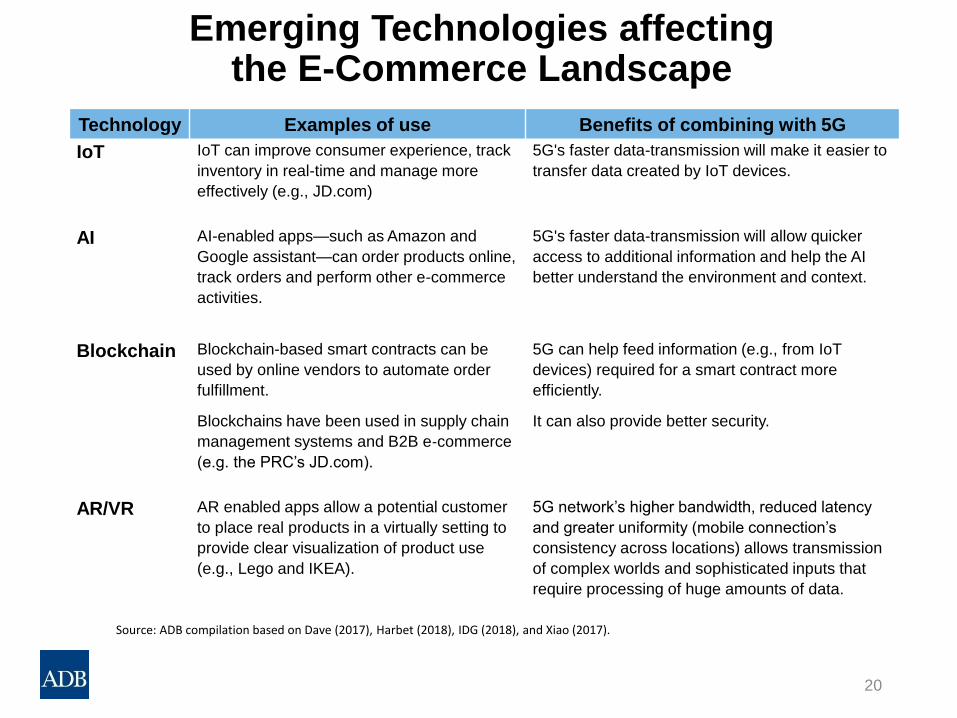
Technology Examples of use Benefits of combining with 5G
IoT IoT can improve consumer experience, track
inventory in real-time and manage more
effectively (e.g., JD.com)
5G's faster data-transmission will make it easier to
transfer data created by IoT devices.
AI AI-enabled apps—such as Amazon and
Google assistant—can order products online,
track orders and perform other e-commerce
activities.
5G's faster data-transmission will allow quicker
access to additional information and help the AI
better understand the environment and context.
Blockchain Blockchain-based smart contracts can be
used by online vendors to automate order
fulfillment.
Blockchains have been used in supply chain
management systems and B2B e‐commerce
(e.g. the PRC’s JD.com).
5G can help feed information (e.g., from IoT
devices) required for a smart contract more
efficiently.
It can also provide better security.
AR/VR AR enabled apps allow a potential customer
to place real products in a virtually setting to
provide clear visualization of product use
(e.g., Lego and IKEA).
5G network’s higher bandwidth, reduced latency
and greater uniformity (mobile connection’s
consistency across locations) allows transmission
of complex worlds and sophisticated inputs that
require processing of huge amounts of data.
Emerging Technologies affecting the E-Commerce Landscape
Source: ADB compilation based on Dave (2017), Harbet (2018), IDG (2018), and Xiao (2017).
Way Forward
21
22
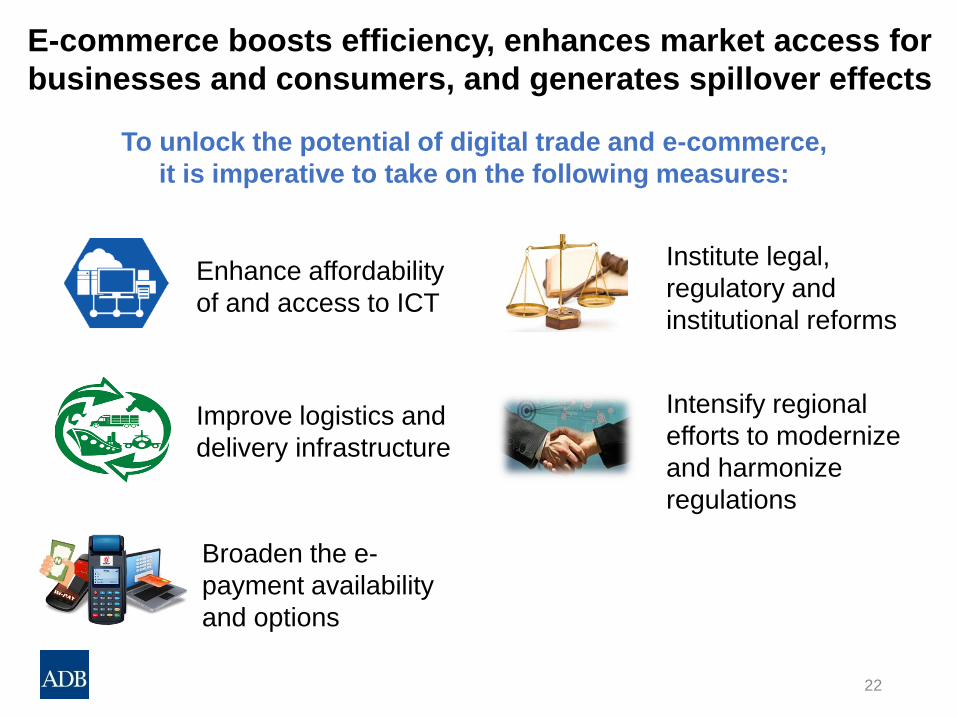
To unlock the potential of digital trade and e-commerce,
it is imperative to take on the following measures:
Institute legal,
regulatory and
institutional reforms
Intensify regional
efforts to modernize
and harmonize
regulations
Enhance affordability
of and access to ICT
E-commerce boosts efficiency, enhances market access for
businesses and consumers, and generates spillover effects
Improve logistics and
delivery infrastructure
Broaden the e-
payment availability
and options
Fostering Cross-Border E-Commerce
23
▪ Global cross-border B2C e-commerce to grow at 27% from
2014 to 2020 to reach almost $1 trillion.
▪ Various efforts underway to reduce complex border crossing
procedures and regulatory burdens
- National Single Window (NSW)—a one stop-shop to speed up customs
clearances
- Automated System for Customs Data (ASYCUDA) system developed by
UNCTAD
- new Framework Agreement on the Facilitation of Cross-Border Paperless
Trade in Asia and the Pacific
- international customs rules for cross-border e-commerce being developed
by WCO
▪ Securing tax revenues while minimizing taxation costs are
crucial
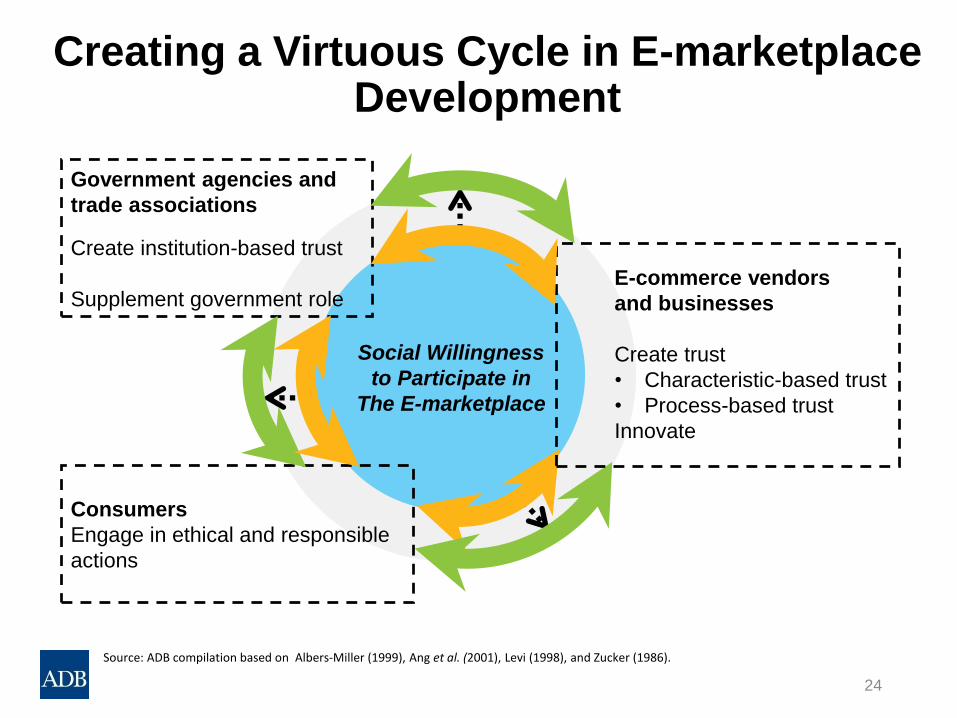
Creating a Virtuous Cycle in E-marketplace Development
24
Source: ADB compilation based on Albers‐Miller (1999), Ang et al. (2001), Levi (1998), and Zucker (1986).
Consumers
Engage in ethical and responsible
actions
Government agencies and
trade associations
Create institution-based trust
Supplement government roleE-commerce vendors
and businesses
Create trust
• Characteristic-based trust
• Process-based trust
Innovate
Social Willingness
to Participate in
The E-marketplace
Thank you!
25