Embed Size (px)
Citation preview
Fondazione Eni Enrico Mattei
Embodied Pollution in Trade:Estimating the “Environmental
Load Displacement” ofIndustrialised Countries
Roldan Muradian*, Martin O’Connor** andJoan Martinez-Aler*
NOTA DI LAVORO 57.2001
JULY 2001SUST – Sustainability Indicators and Environmental
Evaluation
*Universitat Autònoma de Barcelona, Dpt. D’Economia i Història Economica**C3ED, Université de Versailles-St Quentin en Yvelines, France
This paper can be downloaded without charge at:
The Fondazione Eni Enrico Mattei Note di Lavoro Series Index:http://www.feem.it/web/activ/_activ.html
Social Science Research Network Electronic Paper Collection:http://papers.ssrn.com/paper.taf?abstract_id
Fondazione Eni Enrico MatteiCorso Magenta, 63, 20123 Milano, tel. +39/02/52036934 – fax +39/02/52036946
E-mail: [email protected]. 97080600154
Cahier du C3ED n° 01-02
1
Embodied Pollution in Trade: Estimating the ‘Environmental LoadDisplacement’ of Industrialised Countries
Cahier du C3ED n° 01-02
Roldan Muradiana*, Martin O'Connorb, Joan Martinez-Alierc.a,c Universitat Autònoma de Barcelona. Dpt. d’Economia i d’Història Econòmica. 08193. Bellaterra (Barcelona). Spain.
b C3ED, Université de Versailles-St Quentin en Yvelines. 47 boulevard Vauban, 78047 Guyancourt cedex. France.
*Corresponding author. E-mail: [email protected]
Abstract
The present paper sets out to aid in the development of "environmental loaddisplacement" indicators. Developing the notion of the "environmental memory" ofphysical flows, we estimated embodied pollution in trade of 18 industrialized countrieswith a) the rest of the world and b) developing countries, from 1976 to 1994. Wefound that in the last years of analysis, total imports of Japan, USA and WesternEurope have entailed, in general, larger air pollutant emissions than local exports. Thebalance of embodied emissions in trade (BEET) seems follow an inverted-U shapeacross time in Japan and Western Europe, and an N-shape in the US. In the period ofanalysis, Japanese and European environmental terms of trade with developingcountries have "improved", whereas American environmental terms of trade withdeveloping countries tended to "deteriorate" over time. Although there is no statisticaltrend between income and embodied emissions in imports in a cross-section analysis,there does seem to be a positive relationship between both variables at a national level.The results suggest that, despite many shortcomings, this type of assessment ofembodied environmental pressures in inter-country physical flows may shed usefulinsights on the international aspects of sustainable development. Particularly, on thedistribution of the environmental costs of trade and the relationship between economicgrowth and environmental degradation.
Keywords: Environmental terms of trade; Embodied Pollution, Ecologically unequalexchange; Environmental Kuznets Curve; International trade; BEET.
Cahier du C3ED n° 01-02
2
1. IntroductionThe assessment of the environmental performance of any selected economic system requires
us to specify the relevant spatial scales of analysis. This choice will depend on the
assumptions adopted about (a) the interrelationship between the different ecological systems
transformed by the economic activity; (b) the agents and institutions where environmental
liability has to be assigned; (c) the economic driving forces of environmental transformation;
and (d) the envisaged mechanisms of environmental policy (Grainger, 1999).
Undoubtedly, from an ecological point of view, the global scale would often be the most
suitable level to address sustainability. However, since the planet is divided into political
entities, environmental accounting is mostly referred to political (not ecological) territories,
particularly to the country-level. National indicators of sustainability may have large leverage
in guiding the environmental performance of societies because the country-level is still the
scale where most of the environmental policies are implemented. Nevertheless, due to the
existence of international environmental interrelationships, sustainability evaluations at a
national level may face significant caveats in establishing ultimate causes of environmental
transformation. Thus, to weigh up foreign environmental repercussions of local economic
activities is crucial for understanding in a comprehensive way the economy-environment
relationship. As well, local environmental changes caused abroad have to be considered in
any integral sustainability assessment.
The present paper tries to aid in the development of indicators of inter-country environmental
load displacement, estimating embodied pollution in physical flows in industrialised
countries. Section One summarises the theoretical framework that justifies the assessment of
the foreign environmental effects of a national economy, and then reviews some indicators of
environmental load displacement already developed in the literature, thus introducing the
concept of environmental terms of trade. Section Two describes data sources and analysis.
Section Three summarises the most relevant results, followed by a discussion in section Four.
Section Five is a short note on shortcomings and difficulties of the analysis. The paper ends
with some brief concluding remarks.
Cahier du C3ED n° 01-02
3
1.1 Extending the framework: from production to consumptionEconomy-environment interactions are mediated by land transformations and energetic-
materials flows involved in the metabolism of the production process, as well by the final
disposition of wastes and heat after consumption. In this sense, the scale and “quality” of the
throughput are the main forces determining environmental change. In a free market economy,
production is conditioned and determined by consumption patterns. Consequently,
consumption is the “final cause” of human-induced environmental transformations.
Consumption is perhaps not the driving force of the capitalist system, but it is (as Keynes
diagnosed in the 1930s) a structurally necessary part of its dynamism. Increasing human
inclination for diverse consumable goods and services seems to be a keystone requirement for
innovation and economic growth. Inexhaustible willingness to consume is perhaps the most
characteristic feature of current western civilisation.
Psychological reasons behind expenditures behaviour are complex and multiple. Explanations
for rising consumption in industrialised societies are many and diverse, going from the
"insatiable wants" to advertising manipulation (Røpke, 1999a). The environmental impacts of
private expenditures are not necessarily related to their magnitude in monetary terms, but
instead will depend on the size and quality of throughput. These features are determined by
the level of consumption, the composition of the different categories of consumed
commodities and by a technological factor. Even though technology can modify the
relationship between a certain level of material consumption and its environmental pressures,
there are constraints to reducing effluents, imposed by thermodynamic considerations.
Material outputs must be always equal in mass to material inputs. What can be changed is the
disposition of the output and its “quality” (toxicity for example). Equally, there are
restrictions to recycling, imposed basically by energy availability and feasible pathways of
transformation under terrestrial conditions (O’Connor, 1994; Craig, 2001). Hence, in the long
term, it is practically impossible to de-link rising material use from environmental loads.
In the long run, sustainable increasing monetary consumption is only possible if resources
substitutability or material stocks tend to infinite. In the short term, swelling private
expenditures are compatible with improving environmental conditions if (1) resources-
utilisation efficiency by unit of expenditure increases at least as much as the level of total
Cahier du C3ED n° 01-02
4
consumption, or (2) technology allows to dispose of effluents in a more environmentally
friendly way and to decrease environmental impacts in the different steps of the material
extraction-processing-consumption chains. Given their power in guiding the economic
system, consumers are supposed to play a key role in deciding between alternative production
processes. Demanding a certain environmental quality of products, consumers may induce a
particular development pathway.
Following the same line of reasoning, assuming consumers as agents where environmental
liability has to be assigned, and therefore as a central target of sustainable development
policies, can be justified with the Polluter Pay principle. If the costs of environmental
externalities are incorporated into prices, as the polluter pay principle advises, final
consumers will pay the ultimate environmental consequences of sustainable production of
goods and services. Thus, the polluter pay principle can be equated to the “consumer or user
pay principle” (Kox, 1993).
Sustainability issues have, in public policy, traditionally been appraised at a national level,
evaluating the environmental performance associated with domestic production. However, if
consumption is assumed as an important economic force “steering” environmental
transformation, the assessment of the environmental performance of a national economy
requires us to make the distinction between environmental costs-borne and costs-caused by a
nation, and therefore, to expand the scale of analysis beyond the national political frontiers.
From a consumption-centered perspective, local consumption is linked, through international
production chains, to foreign environmental pressures. Similarly, local environmental
transformations can be associated with foreign consumption patterns. Inter-country flows of
good and services (trade) and transboundary flows of pollutants are the two main ways that
international links can be established between local consumption and foreign environmental
degradation, or vice-versa. Under this perspective, environmental loads related to
consumption in the importing country, but suffered in the exporting country, can be conceived
as displaced environmental loads. The next part of this section reviews some indicators
dealing with the international aspects of sustainable development, from this consumption-
centered viewpoint.
Cahier du C3ED n° 01-02
5
1.2 Indicators of environmental load displacement A number of environmental indicators have been developed to estimate different sorts of
supra-national environmental-pressures-transference of national economies. Muradian and
O'Connor (2001) discuss the policy relevance of "environmental load displacement"
adjustments to national aggregate (macro-economic) indicators for taking account of openness
to the rest of the world. In general, inter-country environmental load displacement indicators
can be classified in two categories:
a) Those that adopt a “weak sustainability” standpoint. These indexes intend to calculate
(in monetary terms) the natural capital depletion caused by national resources imports.
b) Those adopting a biophysical or “strong sustainability” perspective. In this case, the
strategy is rather to estimate foreign environmental physical pressures associated with
national consumption.
An example of the first kind of approach is the indicator of weak sustainability for an open
economy presented by Proops, Atkinson and others (see Proops and Atkinson, 1998; Proops
et al., 1999). Using international input-output analysis, these analysts extended the indicator
of weak sustainability for a closed economy introduced by Pearce and Atkinson (1993) to
include foreign depletion of non-renewable energy and mineral resources caused by national
imports. In this approach, the value of natural capital depletion occurring within a territory is
accounted in the country where final consumption of these resources takes place. They found
that in the period 1980-1990, global net capital savings are positive, and moreover, the capital
stock has improved by an average of 8.5 % per year. In this study, all industrialized countries
are sustainable in the “weak” sense.
Despite the fact that weak-sustainability indicators are easy to interpret for policymaking,
they suffer major methodological and conceptual difficulties (see Fauchaux and O’Connor,
2001). First, not all environmental values are measurable with a unique unit of value (O’Neill,
1997). Second, "monetization" of environmental externalities is a hard task when there is a
high degree of uncertainty (Funtowicz and Ravetz, 1994). Third, prices are unable to reflect
the long-term effects of critical natural capital depletion (Rees and Wackernagel, 1999).
Fourth, evaluation of environmental externalities depends on the distribution of power and
Cahier du C3ED n° 01-02
6
income (Røpke, 1999b). Hence, when environmental damage occur in poor and powerless
areas, the costs tend to be lower by definition (Martinez-Alier and O’Connor, 1999).
A range of researchers, aware of the above-indicated problems with the weak sustainability
viewpoint, have adopted a biophysical stance to evaluate the supranational environmental
effects of local consumption. The best known of these biophysical approaches is the
ecological footprint (EF). Using this index, Wackernagel et. al.(1999) arrived at an opposite
conclusion about the degree of sustainability of the global economy. They estimated that the
global ecological footprint (2.8 ha/cap) overshoots global biocapacity (2.0 ha/cap). They show
also that most developed countries have an "ecological deficit", in the sense that national
appropriation of land productive area is larger than local available biocapacity.
The major advantage of the EF approach is that it is relatively easy to understand and to
implement. However, it has many shortcomings. First, no distinction between different
quality of land uses is made and the possibility of multifunctionality (multiple potential uses)
of the same land is not considered (van den Bergh and Verbruggen, 1999). Second, as it
depends on biological productivity, some pollutant emissions may actually increase
biocapacity. Third, the conversion scheme of energy consumption to land use is very
controversial because the suggested sustainable energy scenario is not technically or
environmentally feasible (Ayres, 2000). Fourth, the amount of land necessary for reforestation
(to absorb CO2 emissions) is calculated under a static perspective, which does not take into
account neither time scales of forests growth dynamics nor final uses for the hypothetically
produced wood (van Kooten and Bulte, 2000). Fifth, from an ecological point of view, the
national borders are arbitrary as a spatial scale of analysis for the EF. These limitations mean
that a substantial amount of pertinent information is lost (Costanza, 2000). Consequently, for
some authors, it should be used to rank social alternatives or as a meaningful guideline for
achieving sustainability (Opschoor, 2000).
The “environmental space” is a similar indicator to the EF. This concept is built on the notion
that there are limits to the amount of environmental pressure that Earth’s ecological systems
can handle without suffering irreversible damage. The environmental services provided by
these systems, for which there is a limited space, include both stocks (of renewable and non-
Cahier du C3ED n° 01-02
7
renewable resources) and sinks to absorb wastes and pollution (Hille, 1997). This concept is
related to equity issues because it is essentially concerned with the fairness of resource use in
any one country, as measured relative to world average use. The ethical principle easily linked
to this approach is “equality” understood as an equal global share of resources and pollution
per capita (Moffat, 1999). The method used to implement the environmental space involves
comparing global mean use of a given resource, expressed in per capita units, with national
per capita consumption. Items of consideration include non-renewable raw resources, land,
wood, water and energy (Hanley et al., 1999). According to the “Towards Sustainable
Europe” report (Friends of the Earth, 1995), the European Union as a whole has raw materials
(wood and non-renewable) consumption rates considerably higher than the world average.
Europe is also a net importer of agricultural land and it has CO2 emission levels by far larger
than global average. Thus, according to this view, Europe occupies a disproportionate part of
the available environmental space at a global level.
The general idea of the environmental space approach is to exemplify that the opportunity to
expand resource use in countries occupying environmental space below world average is
restricted by regions with high rates of stocks depletion and sinks utilization, such as Europe.
This is clear for the case of greenhouse gases emissions. The environmental space has been
used to set targets for resource reduction. However, this procedure has been criticized because
global average of resource consumption is rather an arbitrary reference, given that actual
stocks or sinks capacities are not being evaluated. The equality principle has been also
criticized due to its political unfeasibility and difficult justification (Moffat, 1996).
Like the environmental space approach, the “material flow analysis” is mainly concerned with
national physical flows. It is a relatively new technique (although the underlying concepts of
mass accounting have a long history), that provides a numeraire that may be used to estimate
indirect foreign environmental pressures linked to local consumption. It intends to
characterize major resource flows at different scales of the society’s metabolism (Fischer-
Kowalski and Hutler, 1999; Haberl and Schandl, 1999). This approach allows estimating how
dependent is a national economy on foreign resources. It takes into account not only direct
material inputs to the economic systems, but also hidden flows, viz., the proportion of the total
material requirement that does not enter the economy, but it is necessary for the production of
Cahier du C3ED n° 01-02
8
goods and services. Adriaanse et al. (1997) found that direct and hidden foreign inputs have,
in general, increased in industrialized countries in the last decades. In the case of minerals,
direct flows are related to pollutant emissions and hidden flows are usually associated with
deforestation and habitat degradation. Therefore, they are indirect measures of environmental
pressures. Nonetheless, in the material flow analysis no direct links between physical flows
and specific environmental loads are established. Furthermore, very often materials flows are
assessed in a unidimensional way, considering only the weight of the overall materials
involved, not their qualitative differences.
Adopting a consumption-centred perspective, some authors argue that it is relevant for
national environmental policy to examine the effect of the cross-country movement of goods
that embody pollution (Suri and Chapman, 1998). One of the attempts to develop this
approach is the work of Wyckoff and Roop (1994). They used a monetary input-output
analysis and emissions data to estimate the amount of carbon dioxide emissions embodied in
the imports of manufactured goods in six of the largest OECD countries. Their findings reveal
that a significant amount, about 13 %, of total carbon emissions, is “embodied” in
manufactured imports. They point out that this result suggests that standard measures of
carbon emissions relying solely on domestic sources, such as annual carbon produced per unit
of GDP or per capita, will be misleading if a real reduction of emissions is intended. This
indicator is interesting because it is based on the measurement of specific environmental
pressures (pollutant emissions). The main limitation of this method is that, due to prices
variation, it is hard to link monetary values of imports to actual emissions.
Lee and Holand-Host (1993) have developed an indicator called the embodied effluent trade
(EET), which is based on the idea that traded commodities embody an environmental service:
the amount of pollution produced domestically when goods are produced for exports. This
method generates an index of weighted aggregate effluent levels for a given composition of
domestic production (in monetary terms), which is calculated using the Linear Acute Human
Health index of the Industrial Pollution Projection System database (see below). The EET
index measures the effluent potential of domestic output in units relative to the United States
and it can be used to evaluate the implicit effluent content of trade. They use this indicator to
study the "ecological terms of trade" between Japan and Indonesia. They found that, in 1990,
Cahier du C3ED n° 01-02
9
Japanese imports from Indonesia are six times more effluent intensive than Indonesian
imports from Japan. This approach is attractive because it emphasises explicitly the notion of
"transfer of environmental costs". Nevertheless, its interpretation is not easy because no
reference to actual emissions is made.
The next part of this section makes a brief development of the "ecological" or
"environmental" terms of trade idea.
1.3 Environmental terms of trade Monetary terms of trade assess the relationship between price indexes for imports and price
indexes for exports, and its variation over time. It is a statistical tool for estimating the
distribution of trade’s profits. The notion of terms of trade has received a lot of attention
during many years in the twentieth century. It constituted the central concept of the Singer-
Prebisch thesis (Prebisch, 1950; Singer, 1950), which had a world-wide influence in
development policies. This thesis postulates that there is a structural trend towards the decline
of primary commodities prices relative to manufactures prices. They argued that this
phenomenon lead to continuous terms of trade deterioration in developing countries, due to
their specialisation in primary exports. According to this point of view, specialisation through
comparative advantages could work as a poverty trap in the long term.
Studies testing empirically the Singer-Prebisch hypothesis arrive at mixed results, depending
on data and the econometric model utilised (Athukorala, 2000; Bloch and Sapsford, 2000;
Lutz, 1999; Muñoz and Sosvilla, 1993). So the debate is still open. Today, this question could
be complemented with attention to environmental issues. Many developing countries are still
specialised in primary and environment-intensive sectors, especially in Africa and Latin
America. Non-renewable natural resources exploitation and processing head the list of the
most polluting sectors (World Bank, 1998). Moreover, increasing exported volumes of
renewable resources are usually associated with the expansion of the agriculture frontier in
developing countries, which often affect very bio-diverse and valuable natural habitats.
Finally, core-periphery displacement of pollution-intensive activities is likely because
accounted environmental costs tend to be lower in the periphery. Environmental costs are
lower in poor countries relative to richer areas because (1) the possibility for major producers
Cahier du C3ED n° 01-02
10
and consumers to offload or ignore environmental damages is higher due to weaker
institutions; (2) health-impairing pollution has a lower effect on the performance of poor
economic agents (as measured in monetary terms, such as loss of earning capacity); and (3)
Environmental externalities tend, when assessed in terms of monetary WTP, to have a lower
value because income actually influences environmental valuation.
Starting from the idea that a country gains environmentally from trade in relative terms
whenever its imported goods have larger pollution content than its exported goods, Antweiler
(1996) introduced the notion of "pollution terms of trade". He designed an index to evaluate
the environmental gains a country receives from engaging in international trade. This index
measures the ratio of the pollution content by unit of monetary exports relative to the
pollution content by unit of imports. Using input-output analysis, industry-level pollution data
for the US, monetary trade flows, and a weighting procedure, he tested the index for 1987. He
concluded that exports of highly industrialised countries appear to be more environment-
intensive than are their imports, while the opposite holds for developing countries. Thus,
according to these results, the environmental-periphery would not correspond to the income-
periphery. The environmental loads of trade are larger in developed than in developing
countries.
In the present work, we rather define environmental terms of trade in the simplest way. That
is, as the total entailed environmental pressures in exports in relation to total entailed
environmental pressures in imports. Our index of environmental terms of trade can be
formalised as: ETT= (EEPx/EEPm) x 100, where EEPx is a measure of the embodied
environmental pressures (pollution) in exports and EEPm the same measure for imports.
In order to avoid errors caused by prices variation, we prefer to use physical instead of
monetary flows to estimate pollution content in international trade. If peripheralisation of
environment-intensive activities from rich to poor regions of the world is occurring, this index
should show a dropping trend across time in high-income countries trade with developing
areas. If region "A" faces "deteriorating" ETT over time in trade with region "B", we can talk
about ecologically unequal exchange between both areas (Andersson and Lindroth, 2001;
Cabeza-Gutés and Martinez-Alier, 2001; Martinez-Alier and O'Connor, 1996), in the sense
Cahier du C3ED n° 01-02
11
that the environmental effects of consumption in region "B" are consistently displaced
towards its trade-partner.
2. Data source and analysisThe analysis of the terms of ecological exchange between different regions or countries can
be very complex because international production-commercialisation-consumption chains are
usually extremely intricate. Tracking environmental impacts in this kind of chains requires
delimiting the number and sort of economic transactions to be considered. This implies
always to lose information. Moreover, in these cases, data availability is an important source
of constraints. Aware of these limitations, we decided to use existing pollution intensity
factors for production outputs, in order to calculate embodied emissions in trade of the most
polluting economic sectors.
The Industrial Pollution Projection System (IPPS) is a database developed by the World Bank
(Hettige et al., 1994), which combines data from industrial activity with data on pollution
emissions to calculate pollution intensity factors for many economic sectors. The IPPS has
been used for a variety of research themes, including environmental assessments in
developing countries (Dessus et al, 1994), estimation of abatement costs (Hartman et al.,
1994), global patterns of industrial pollution (Hettige et al., 1992) and estimation of toxic
pollution production in diverse countries (World Resources Institute, 1994). As regard air
pollutants, pollution intensity indexes of the IPPS are published in terms of weight of
emissions by unit of total value of output, value added or number of employees. These
coefficients are based on U.S. production and pollution data from different years, up to 1989.
Since prices, values added or labour intensities are highly variable from one country to
another, as well as through time, we considered that pollution intensities expressed in terms of
pollutant emissions by unit of production, both in weight units would be more reliable. In
order to obtain this kind of factors, we transformed IPPS lower bounds air pollution intensity
estimates from Kg of emissions by unit of total value ($ 1987) into kg of emissions per
thousand metric tons of output.
For converting pollution intensities from monetary to physical terms, we used production data
in weight outputs from the Industrial Commodity Statistical Yearbook (U.N.) and production
Cahier du C3ED n° 01-02
12
data in monetary units from the International Yearbook of Industrial Statistics (U.N.). The
transformation was made for each of the 11 most polluting economic sectors: Oils and fats,
leather finishing, footwear, pulp, paper and paperboard, industrial chemicals, petroleum
refineries, paints, varnishes & lacquers, iron and steel, non-ferrous metals, soap, cleaning
preparations, perfumes & toilet preparations, and synthetic resins & plastic materials. This
procedure was followed for 1985 and 1990. For each air pollutant, the new pollution intensity
coefficient was calculated as the average value of the pollution intensities of US, Japan and
Western Europe for these two years. With this method, we estimated emissions intensities of
five air pollutants: SO2, NO2, CO, volatile organic compounds, fine particulates and total
suspended particulates.
Embodied pollution in trade was calculated using the converted pollution intensity factors
and trade data in weight units from the Commodity Trade Statistics (U.N.) for the above-
mentioned economic sectors and the following countries: US, Japan, Belgium, Denmark,
France, Germany, Greece, Ireland, Italy, Netherlands, Portugal, Spain, United Kingdom,
Austria, Finland, Norway, Sweden and Switzerland. Calculations of embodied pollution were
carried out for 1976, 1979, 1984, 1987, 1990 and 1994. Data was digitalised manually.
Developing countries are defined here as low and middle income countries according to the
World Bank classification (1998).
3. Results
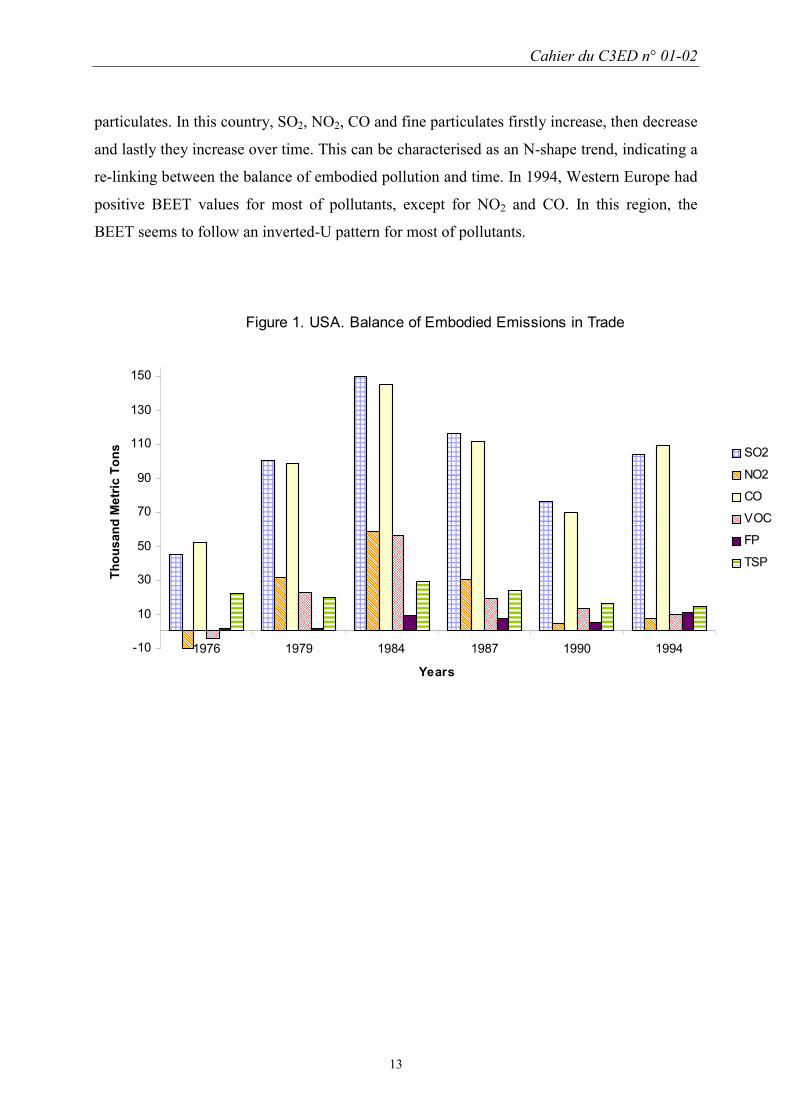
3.1 Balance of embodied emissions in tradeWe introduce here the concept of balance of embodied emissions in trade (BEET), which is
defined as embodied emissions (EE) in imports minus EE in exports. Hence, a positive value
means that entailed pollution in imports exceeds local emissions associated with exports. This
could be seen as a measurement of "environmental deficit" or "environmental load
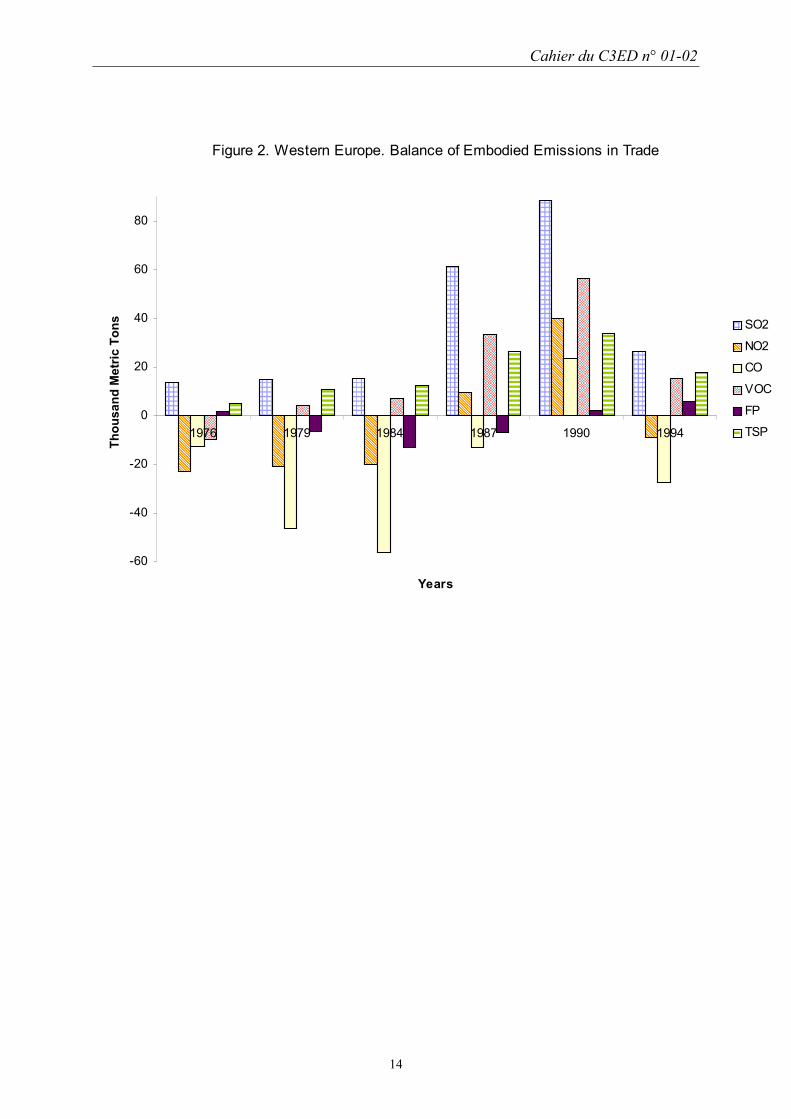
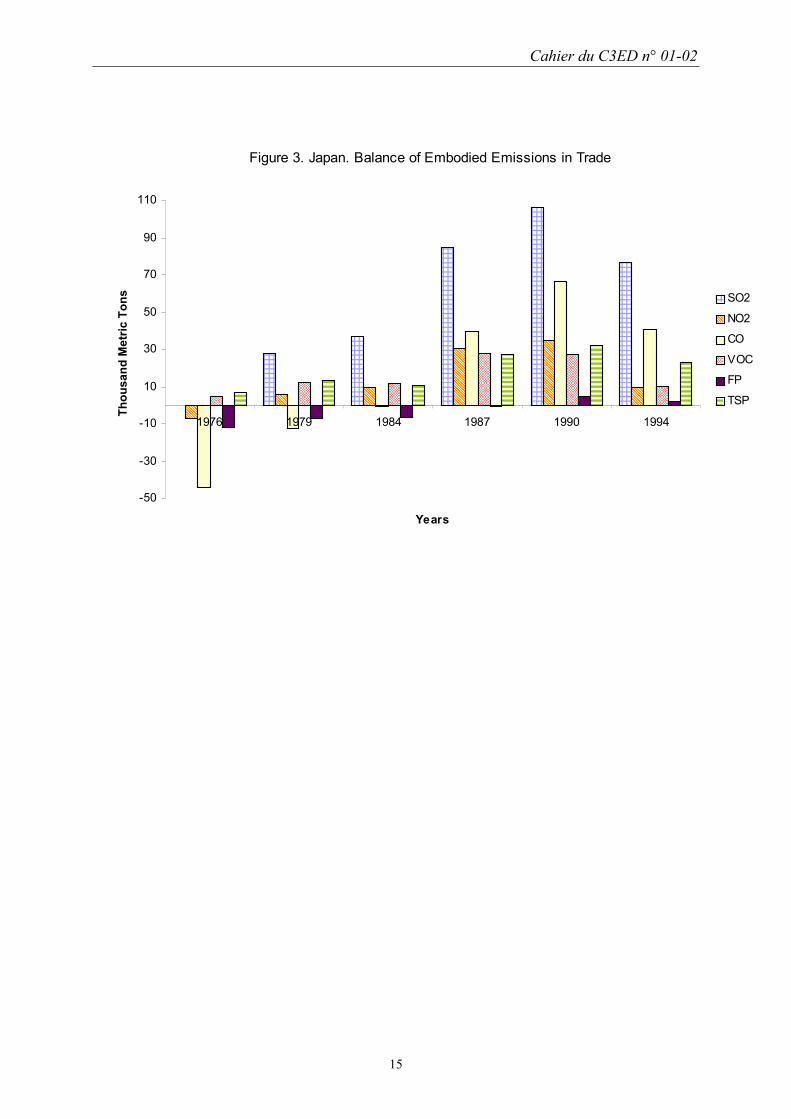
displacement". Figures 1, 2 and 3 show the BEET for different air pollutants in the US,
Western Europe and Japan respectively. In 1994, last year of analysis, Japan and the United
States had positive values of BEET for all the considered pollutants. In the case of Japan,
BEETs for all pollutants seem to follow the same trend over time, they increase until certain
value and then they decrease. This can be described as an inverted-U trajectory through time.
The US shows the same trend for BEETs of volatile organic compounds and total suspended
Cahier du C3ED n° 01-02
13
particulates. In this country, SO2, NO2, CO and fine particulates firstly increase, then decrease
and lastly they increase over time. This can be characterised as an N-shape trend, indicating a
re-linking between the balance of embodied pollution and time. In 1994, Western Europe had
positive BEET values for most of pollutants, except for NO2 and CO. In this region, the
BEET seems to follow an inverted-U pattern for most of pollutants.
������������������������������������������������
������������������������������������������������������������������������������������������������
������������������������������������������������������������������������������������������������������������������������������������������������
������������������������������������������������������������������������������������������������������������������������������
������������������������������������������������������������������������������������������
�����������������������������������������������������������������������������������������������������������������������������
��������
���������������������������������������������
������������������������������������������������������������������������
�������������������������
����������
������������������
����������������������������
��������������������������������������������������������
���������������������
���������������������
����������������
��������������������������������
��������������������������������
���������������������������������������������
������������������������������������
���������������������������
���������������������������
Figure 1. USA. Balance of Embodied Emissions in Trade
-10
10
30
50
70
90
110
130
150
1976 1979 1984 1987 1990 1994
Years
Thou
sand
Met
ric T
ons ������
SO2������������ NO2
CO������������ VOC
FP������
TSP
Cahier du C3ED n° 01-02
14
������������������������
����������������������������
����������������������������
����������������������������������������������������������������������������������������
������������������������������������������������������������������������������������������������������������������������
�������������������������������������������������������������
���������������������
��������������������������������
��������������������������������
���������������������������
������������������������������������������������������������������������ ������
������������������������
������������
������������������
�������������������������������������������������
��������������������������������������������������������������������������������
��������������������������������
��������������
���������������������
������������������������
������������������������������������������������������
���������������������������������������������������������������
������������������������
Figure 2. Western Europe. Balance of Embodied Emissions in Trade
-60
-40
-20
0
20
40
60
80
1976 1979 1984 1987 1990 1994
Years
Thou
sand
Met
ric T
ons
������������ SO2������
NO2
CO������
VOC
FP������������ TSP
Cahier du C3ED n° 01-02
15
��������������������������������
������������������������������������������
������������������������������������������������������������������
������������������������������������������������������������������������������������������������������������������������������
��������������������������������������������������������������������������������������
������
������������������
����������������
�����������������������������������
������������������������������
����������������
����������������
������������������
����������
��������������������������������
����������������������������
������������
������������������
������������������������
��������������
������������������������
����������������������������������������
����������������������������
Figure 3. Japan. Balance of Embodied Emissions in Trade
-50
-30
-10
10
30
50
70
90
110
1976 1979 1984 1987 1990 1994
Years
Thou
sand
Met
ric T
ons ����
SO2�������� NO2
CO����
VOC
FP�������� TSP
Cahier du C3ED n° 01-02
16
Changes in trade flows of petroleum, iron-steel and non-ferrous metal products are the main
factors responsible for large variations in the balance of SO2 EE in the US and Japan.
Significant shifts in the balance of SO2 EE in Western Europe are rather linked to industrial
chemicals and plastics trade. Trade variations in iron-steel products account for most of CO
EE balance in Japan and the US. As regard Western Europe, BEETs of CO are rather
associated with trade of paper and petroleum products. Paper, petroleum and plastic products
trade accounts for most of the large changes in the BEETs of NO2 in this region.
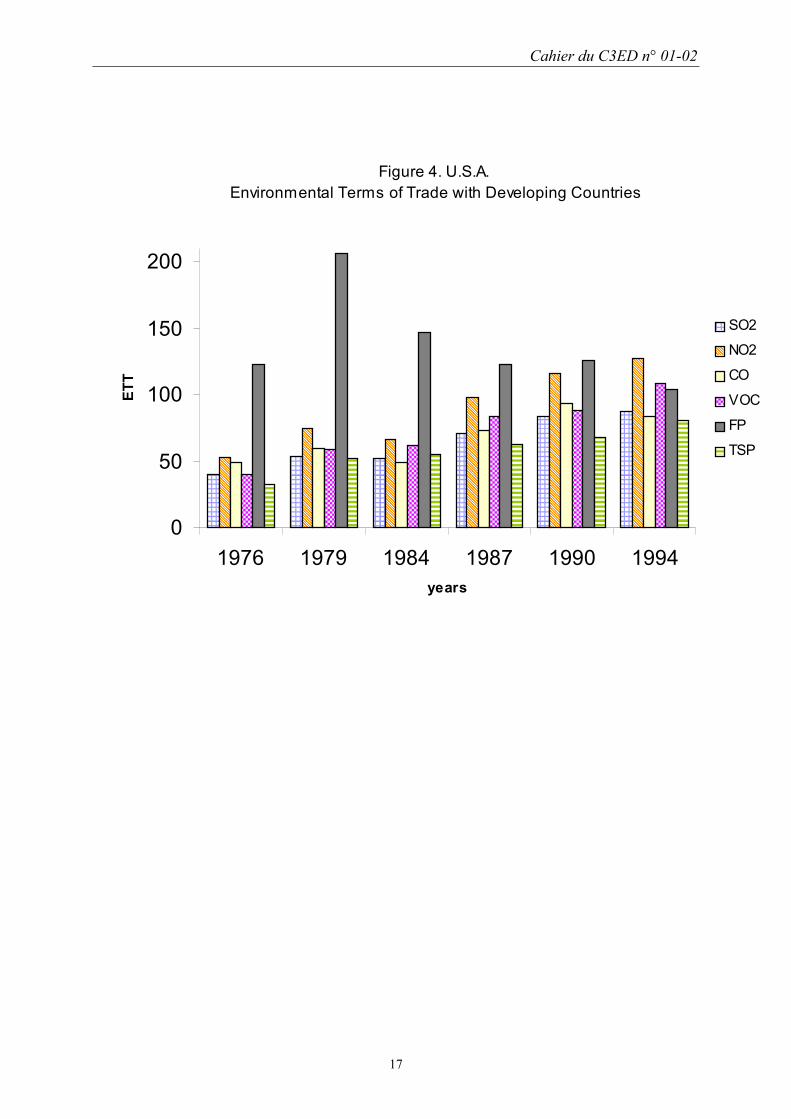
3.2 Environmental terms of tradeIn the present work, we define environmental terms of trade as ETT= (EEPx/EEPm) x 100
(see section 1.3). We say that the ETT "deteriorate" when EE in exports of a country or region
increases more than EE in imports over time. We say that, on the contrary, the ETT "improve"
when embodied pollution in imports increases more than EE in exports across time. If the
ETT are lower than 100, embodied pollution of national imports from the specified countries
is larger than entailed pollution in exports to the same countries.
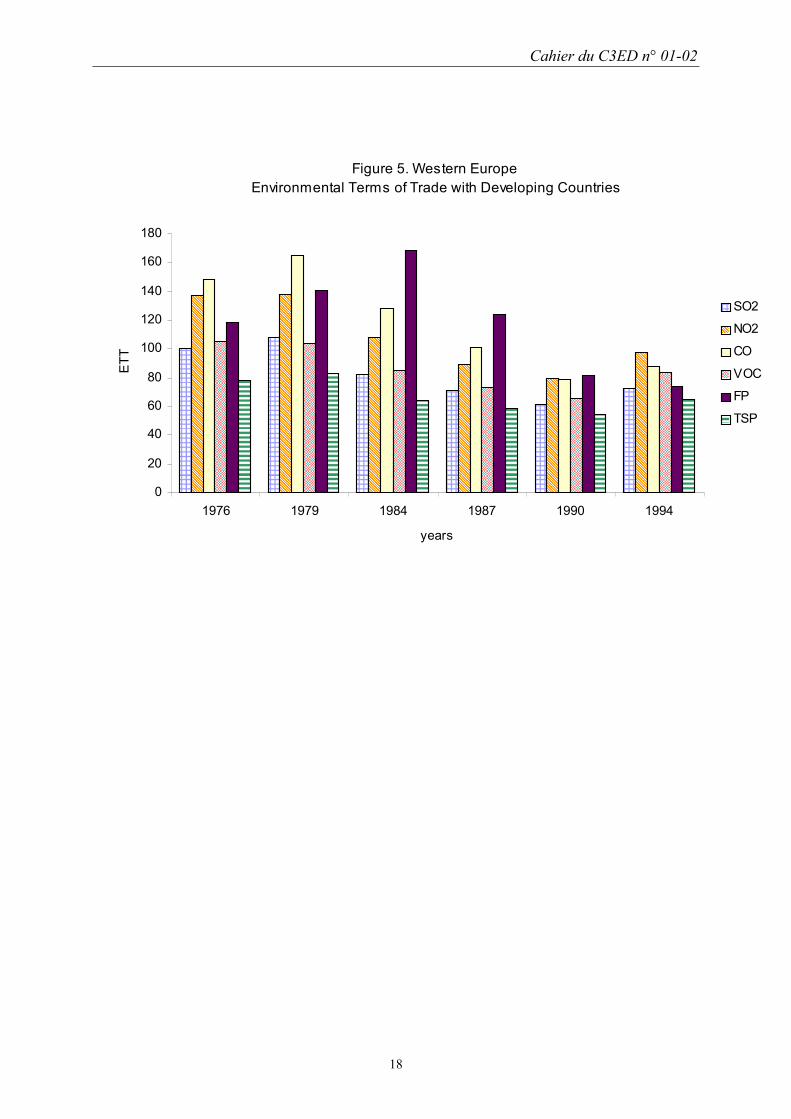
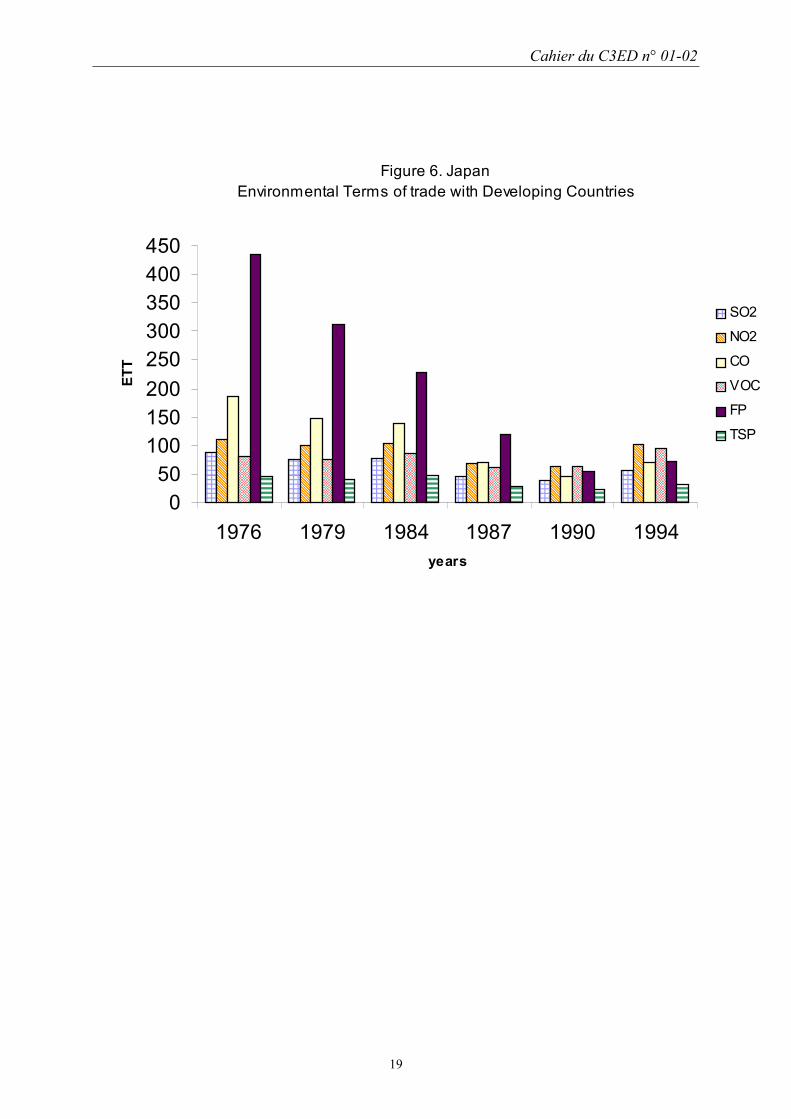
Figures 4, 5 and 6 show the environmental terms of trade with developing countries for six air
pollutants in the US, Western Europe and Japan respectively. With the exemption of fine
particulates, there is a general trend towards "deteriorating" environmental terms of trade with
developing countries for the US. However, in 1994, the American ETT for total suspended
particulates, CO and SO2 were still lower than 100. Western Europe shows an opposite trend.
In this region, environmental terms of trade have "improved" from 1976 to 1990. In 1994,
ETT were larger than in 1990 for all pollutants, although all of them were still below 100.
Japan shows the same pattern as Europe: a general "improvement" in ETT with developing
countries until 1990. In 1994, ETT were larger than in 1990 for all pollutants, but only ETT
for NO2 attained a value higher than 100.
Cahier du C3ED n° 01-02
17
������������������������������
������������������������������������������
������������������������������������������
�������������������������������������������������
����������������������������������������������������������������
������������������������������������������������������������������������
������������������������������������������
��������������������������������������������������������
��������������������������������������������������������
��������������������������������������������������������������������������������
����������������������������������������������������������������������������������������
������������������������������������������������������������������������������������������������
�����������������������������������
������������������������������������������������
������������������������������������������������
����������������������������������������������������������������
���������������������������������������������
��������������������������������������������������
��������������������������������
������������������������������������������������������
������������������������������
�����������������������������������
�����������������������������������
������������������������������������������������
Figure 4. U.S.A. Environmental Terms of Trade with Developing Countries
0
50
100
150
200
1976 1979 1984 1987 1990 1994years
ETT
�������� SO2�������� NO2
CO�������� VOC
FP����
TSP
Cahier du C3ED n° 01-02
18
�����������������������������������������������������������������������������
������������������������������������������������������������������
���������������������������������������������������������������������������������
����������������������������������������������������������������
�������������������������������������������������
����������������������������������������
����������������������������������������������������������������������������������������������������������������
��������������������������������������������������������������������������������������������������
�������������������������������������������������������
������������������������������������������������������������������������������������������
���������������������������������������������������������������
������������������������������������������������������������������
�������������������������������������������������������
����������������������������������������������������������������������������������������
���������������������������������������������������������������
������������������������������������������������
������������������������������������������������������������������������
���������������������������������������������������������������
���������������������������������������������������������������
���������������������������������������������
��������������������������������������������������������
�������������������������������������������������
������������������������������������
���������������������������������������������������������������
Figure 5. Western Europe Environmental Terms of Trade with Developing Countries
0
20
40
60
80
100
120
140
160
180
1976 1979 1984 1987 1990 1994
years
ETT
������������ SO2������
NO2
CO������
VOC
FP������ TSP
Cahier du C3ED n° 01-02
19
��������������������
������������������������
����������������������������
��������������
����������������
������������������������
�������������������������
������������������������
�����������������������������������
���������������������
������������������������
����������������������������������������
����������������������������
����������������������������
��������������������������������
������������������������
���������������
������������������������
��������������
��������������
������������������������
������������������
����������
������������
Figure 6. Japan Environmental Terms of trade with Developing Countries
050
100150200250300350400450
1976 1979 1984 1987 1990 1994years
ETT
����SO2����
���� NO2
CO�������� VOC
FP���� TSP
Cahier du C3ED n° 01-02
20
Iron-steel products trade with developing countries is responsible for most of the large
variations in fine particulates ETT in the US and Japan. In the case of Western Europe, oils-
fats and iron-steel products trade with developing countries accounts for most of the changes
in ETT for fine particulates. Variations in the European ETT for CO is also mainly associated
with iron-steel and petroleum products trade changes.
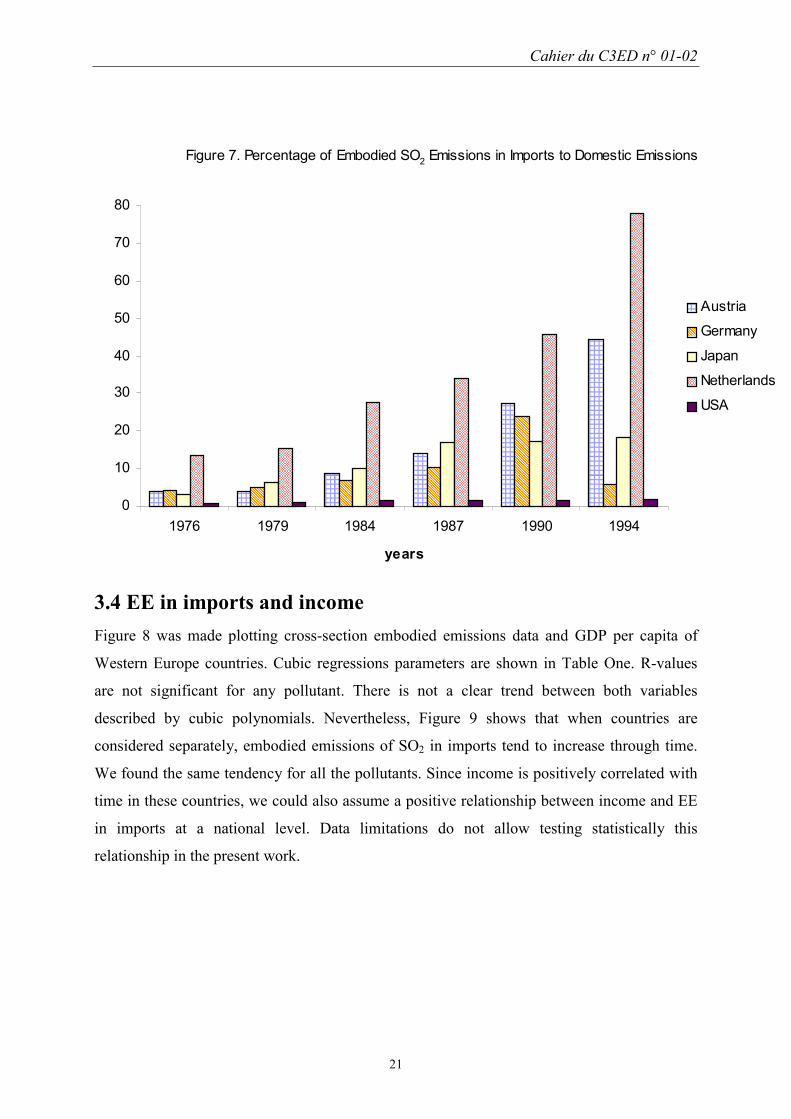
3.3 Foreign and local emissionsFigure 7 shows the percentage of SO2 EE in imports to total domestic emissions of the same
pollutant. National aggregated emissions data was taken from Matthews et al. (2000). The
percentage of foreign to local emissions varies greatly across time and among countries.
Whilst in the US it changed from 0.78 to 1.77 from 1976 to 1994, in the same period it shifted
from 14 to 78 in the Netherlands. The percentage of embodied emissions in imports tends to
increase in all the countries, except Germany. In this country, foreign emissions tended to rise
relatively to domestic emissions until 1990. In 1994 it dropped, reaching less than a third of
its value in 1990. This is probably a consequence of reunification.
Cahier du C3ED n° 01-02
21
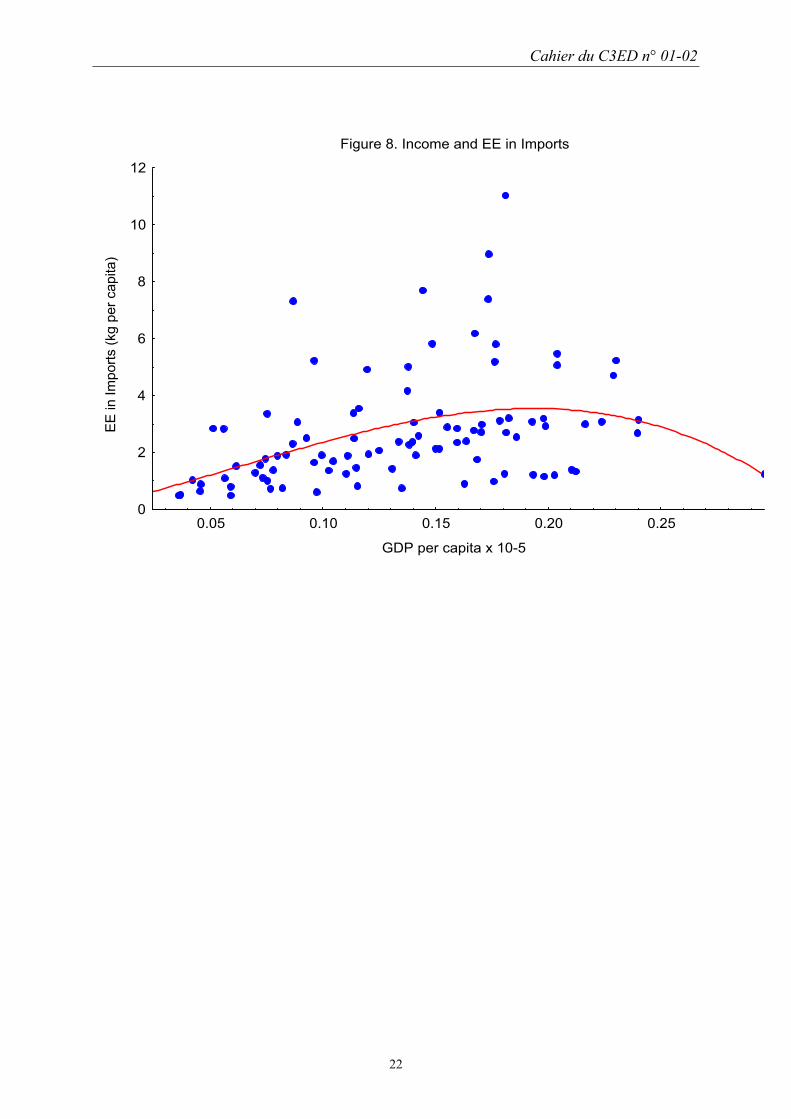
3.4 EE in imports and incomeFigure 8 was made plotting cross-section embodied emissions data and GDP per capita of
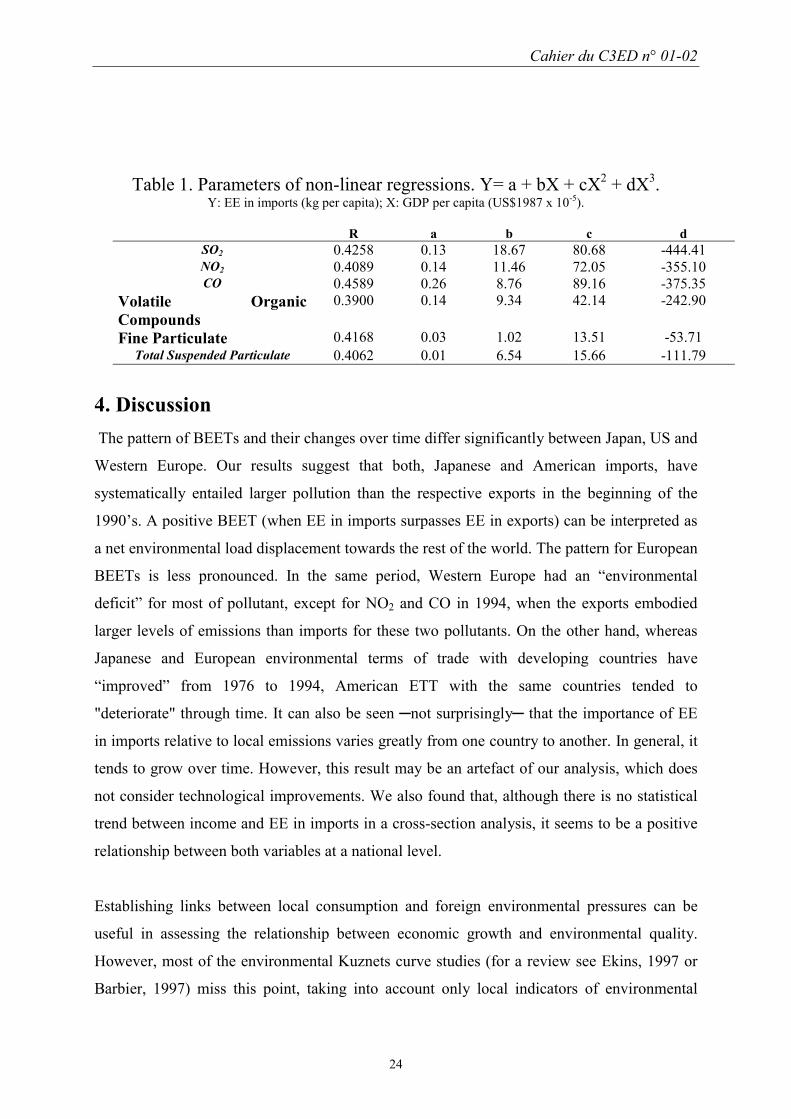
Western Europe countries. Cubic regressions parameters are shown in Table One. R-values
are not significant for any pollutant. There is not a clear trend between both variables
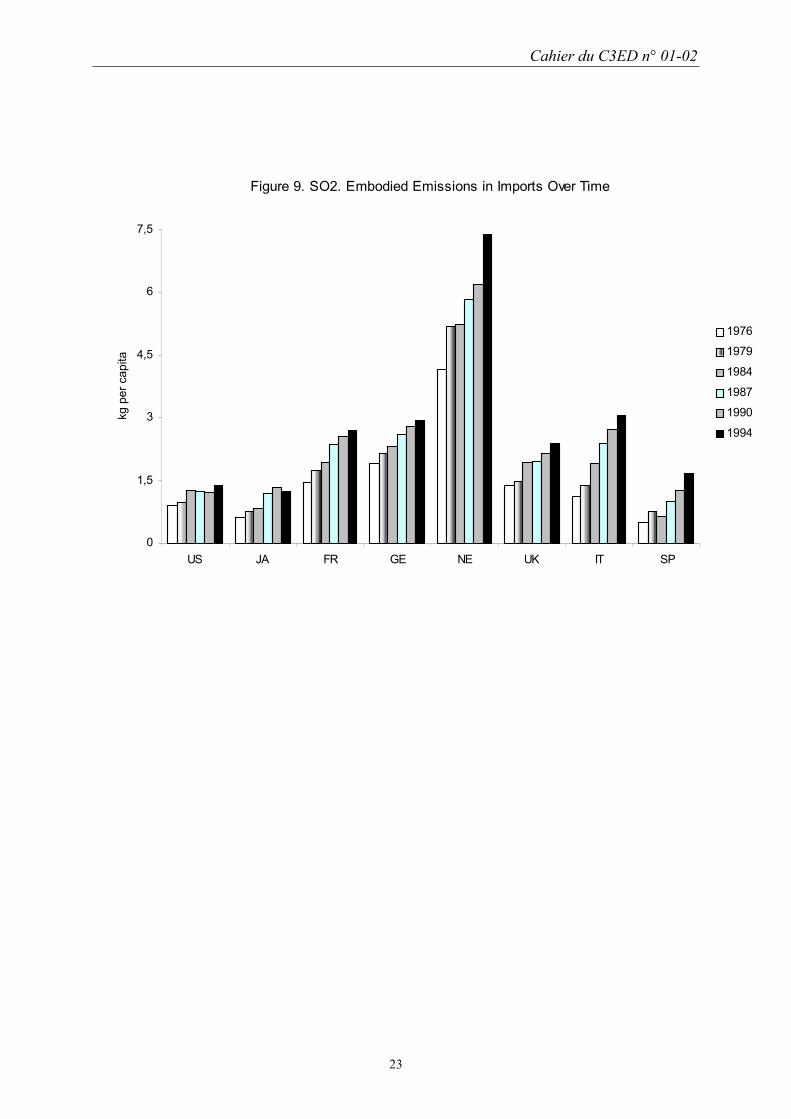
described by cubic polynomials. Nevertheless, Figure 9 shows that when countries are
considered separately, embodied emissions of SO2 in imports tend to increase through time.
We found the same tendency for all the pollutants. Since income is positively correlated with
time in these countries, we could also assume a positive relationship between income and EE
in imports at a national level. Data limitations do not allow testing statistically this
relationship in the present work.
��������� �������
���������������������������
��������������������������������
������������������������������������������
���������������������������������������������������������������������������������������������������
������������
����������������
������������
���������������������������
������������������������������������������������
������������
��������������������������������
����������������������������
���������������������������������������������������������������
������������������������������������������������������������������������
������������������������������������������������������������������������
������������������������������������������������������������������������������������������������������������������������������������������������������������������������������������
Figure 7. Percentage of Embodied SO2 Emissions in Imports to Domestic Emissions
0
10
20
30
40
50
60
70
80
1976 1979 1984 1987 1990 1994
years
���������� Austria�����
Germany
Japan���������� Netherlands
USA
Cahier du C3ED n° 01-02
22
Figure 8. Income and EE in Imports
GDP per capita x 10-5
EE
in Im
ports
(kg
per c
apita
)
0
2
4
6
8
10
12
0.05 0.10 0.15 0.20 0.25
Cahier du C3ED n° 01-02
23
Figure 9. SO2. Embodied Emissions in Imports Over Time
0
1,5
3
4,5
6
7,5
US JA FR GE NE UK IT SP
kg p
er c
apita
1976
1979
1984
1987
1990
1994
Cahier du C3ED n° 01-02
24
Table 1. Parameters of non-linear regressions. Y= a + bX + cX2 + dX3.Y: EE in imports (kg per capita); X: GDP per capita (US$1987 x 10-5).
R a b c dSO2 0.4258 0.13 18.67 80.68 -444.41NO2 0.4089 0.14 11.46 72.05 -355.10CO 0.4589 0.26 8.76 89.16 -375.35
Volatile OrganicCompounds
0.3900 0.14 9.34 42.14 -242.90
Fine Particulate 0.4168 0.03 1.02 13.51 -53.71Total Suspended Particulate 0.4062 0.01 6.54 15.66 -111.79
4. Discussion The pattern of BEETs and their changes over time differ significantly between Japan, US and
Western Europe. Our results suggest that both, Japanese and American imports, have
systematically entailed larger pollution than the respective exports in the beginning of the
1990’s. A positive BEET (when EE in imports surpasses EE in exports) can be interpreted as
a net environmental load displacement towards the rest of the world. The pattern for European
BEETs is less pronounced. In the same period, Western Europe had an “environmental
deficit” for most of pollutant, except for NO2 and CO in 1994, when the exports embodied
larger levels of emissions than imports for these two pollutants. On the other hand, whereas
Japanese and European environmental terms of trade with developing countries have
“improved” from 1976 to 1994, American ETT with the same countries tended to
"deteriorate" through time. It can also be seen ─not surprisingly─ that the importance of EE
in imports relative to local emissions varies greatly from one country to another. In general, it
tends to grow over time. However, this result may be an artefact of our analysis, which does
not consider technological improvements. We also found that, although there is no statistical
trend between income and EE in imports in a cross-section analysis, it seems to be a positive
relationship between both variables at a national level.
Establishing links between local consumption and foreign environmental pressures can be
useful in assessing the relationship between economic growth and environmental quality.
However, most of the environmental Kuznets curve studies (for a review see Ekins, 1997 or
Barbier, 1997) miss this point, taking into account only local indicators of environmental
Cahier du C3ED n° 01-02
25
performance (Rothman, 1998). The lack of a clear cross-section trend between embodied
pollution in imports and income probably is due to differences in the composition of
production among countries. Increasing embodied emissions in imports over time at a
national level shows that the consumption-centred approach here adopted may shed some new
light on the relationship between economic growth and environmental pressures. If embodied
pollution in imports overcomes local emissions drop, the environmental Kuznets curve would
not reveal a real de-coupling between economic growth and environmental degradation, but
instead it would be the outcome of increasing transfer of environmental loads abroad as
countries become richer. The magnitude of entailed emissions in imports relative to local
emissions can be very important in some countries but irrelevant in others, as Figure 7 shows.
Further research is needed in testing the extent to which local emission reductions can be
achievable in part due to international environmental loads reallocation through trade.
When embodied pollution in exports is taken into consideration, an inverted-U evolution of
BEET across time in Japan and Western Europe is found. This may suggest that local
economic growth may be de-coupled from environmental load displacement. However, in the
last year of analysis, local consumption in both regions still entailed a net environmental load
(measured in terms of embodied emissions) on the rest of the world (except for NO2 and CO
in Europe in 1994). A re-linking between income and abroad environmental pressures
"transference" is also possible, as seems to have occurred in the US.
The balance of “embodied emissions” in trade, by stressing the idea of “environmental
memory” of traded products, could be a good metaphor for dealing with the international
aspects of sustainable development, especially the assessment of the spatial distribution of
environmental loads. Estimations of embodied pollution in physical flows can shed some
doubts on the common assumptions about the environmental effects of international division
of production. For example, analysing monetary exports-imports ratios for the most polluting
sectors in low, middle and high income countries, the World Bank (1998) found that
industrialised countries are net exporters of pollution-intensive products, while developing
countries tend to be net importers for this kind of products. According to these results,
international specialisation of production concentrates environmental loads, in high-income
Cahier du C3ED n° 01-02
26
countries. However, our findings suggest instead that affluent countries consumption implies
a net "transfer" of pollution to the rest of the world.
We think that the environmental effects of trade specialisation are most meaningfully
addressed through evaluating the “environmental rucksack” of physical flows. Nonetheless,
while embodied pollution assessments are very relevant for the above-mentioned issues, their
use in environmental policy is not straightforward. Targets or compensatory measures do not
arise automatically from a BEET analysis. In this kind of approach, there is not an a priori
sustainability benchmark to be accomplished. Embodied emissions in trade are only an
indirect and very rough index of environmental pressures because no reference to actual
impact on ecosystem or human health is made. Given the difficulties in evaluating concrete
environmental transformations along complex and long international production-consumption
chains, the BEET analysis can,however, be an appealing tool to make people aware that their
consumption behaviour has environmental consequences beyond the national level. From a
consumption-centred environmental policy perspective, it is then also pertinent to study
particular international product chains, in order to 1) inform consumers about the
environmental consequences of alternative production chains for the same product and 2)
envisage possible institutional frameworks for setting compensatory measures between
consumers and those populations who suffer the environmental loads of consumed goods.
The "improving" European and Japanese environmental terms of trade with developing
countries are mainly explainable by non-renewable resources trade. In Japan and Western
Europe, the weight of iron-steel imports from developing countries increased 11 times and
twice respectively from 1976 to 1994. In these regions, non-ferrous metals imports from
developing areas increased also substantially in this period (4 times in Japan and twice in
Europe). "Deteriorating" environmental terms of trade with developing countries in the US
are mostly explained by American increasing weight of exports of non-ferrous metals,
petroleum products and plastics, which increased by 4,56 and 5 times respectively.
The notion of environmental terms of trade is a key for understanding the distribution of
trade benefits. There can be a feedback between monetary and environmental terms of trade.
Deteriorating monetary terms of trade may force countries specialised in non-dynamic and
Cahier du C3ED n° 01-02
27
pollution-intensive products to export ever-increasing volumes in order to maintain revenues.
Rising volumes of exports likely entails enlarging local environmental impacts and
deteriorating environmental terms of trade. As it was stated before, non-renewable resources
extraction and processing are typically among the most polluting sectors and the agricultural
frontier expansion usually involves lost of bio-diversity. Hence, if there are actually structural
conditions keeping natural resources prices relatively low across time, countries specialised in
natural resources exports may face both monetary and environmental terms of trade
deterioration in the long run. This is especially pertinent for those developing countries,
notably in Latin America and Africa, where exports are still very resource-intensive. If
increasing resources exploitation means rising environmental pressures, a poverty-
environmental-degradation trap can be created.
Based on monetary terms of trade considerations, Prebisch and Singer argued that
international division of production might lead to maintaining development gaps between
different regions of the world. We can now add that it may also produce and preserve uneven
distribution of environmental loads at a global level. It could create a new dimension of the
old core-periphery division. If some countries specialise in low dynamic and environment-
intensive sectors, the income and environmental peripheries may coincide geographically.
However, our data indicates that there is no a single pattern of environmental exchange
between industrialised and developing regions of the world. Whereas Japan and Western
Europe have increasingly ecologically unequal exchange with developing countries
(unfavourable for the latter), the US tends rather to suffer "deteriorating" ETT with
developing areas. As it was pointed out before, these results are explained by differences in
non-renewable resources trade, especially of ferrous and non-ferrous metals and petroleum
products. Japan and Europe are highly dependent on foreign natural capital due to relative
local lack of non-renewable resources.
5. Limitations of the present analysisThe results here presented have to be taken carefully. They have to be considered as a first
approximation on the subject. There are many steps of measurement, aggregation and
statistical averaging along the way to the estimation of embodied emissions in trade.
Cahier du C3ED n° 01-02
28
Therefore, several issues associated with data availability and the statistical conventions for
attributing emissions determine the quality of the results. Some of them are:
(1) The IPPS database has been adopted here as a blackbox. There could be substantial
errors in the pollution intensity coefficients developed by the World Bank.
(2) The IPPS database was made using production and pollution data collected in the
1980’s. Therefore, the technological component (very important in determining
pollution intensities) is not considered in the current study. Pollution intensity factors
may be underestimating actual emissions before the 1980’s and overestimating
emissions in the 1990’s. This is a major shortcoming of our analysis.
(3) Trade and production data are not published using the same classification codes. Trade
flows are classified according to the Industrial Standard Trade Classification (SITC),
whilst production data is categorised following the International Standard Industrial
Classification (ISIC). Even though conversion between the two schemes is possible, it
is probable that trade and production sectors do not correspond exactly. This could
introduce some errors in converting pollution intensities from production to trade
categories.
(4) Classification codes for trade have changed slightly in the period of analysis. Thus,
trade categories were not exactly the same for all the years for which calculations have
been made.
(5) Only the 11 most polluting sectors were considered in the analysis.
(6) US pollution intensity factors may be underestimating actual emissions in developing
countries.
6. Concluding remarksOur results show that, in the 1990s, the industrialised world has had an “ecological deficit”, in
the sense that embodied emissions in imports tend to be larger than EE in exports. What we
have reported can be considered an empirical estimation of environmental load displacement
from Japan, USA and Western Europe to the rest of the world. Our results also reveal a
positive relationship between EE in imports and time at a national level. This suggests that
estimating the “environmental memory” (embodied emissions) of imported products provide
appealing insights for re-evaluating the environmental Kuznets Curve hypothesis ― that is, of
decreasing pollution intensity as income per capita increases. Furthermore, we found that
Cahier du C3ED n° 01-02
29
Europe, Japan and the US differ in their environmental terms of trade with developing
countries. In the period of analysis, American EE in imports from developing countries have
increased more than American EE in exports to the same areas, whereas the opposite holds for
Japan and Europe. This means that there is not a single pattern describing the evolution of
environmental terms of trade between industrialised and developing areas of the world.
Notwithstanding certain limitations of our analysis due to the quality and availability of data,
we think that the approach here has a strong heuristic value. It stresses the importance of
taking into consideration the "entailed" pollution associated with inter-country trade when the
environmental performance of a national economic system is to be evaluated. However, if this
sort of analysis is to be made the basis for calculation of "trade-adjusted" indicators of
national economic and environmental performance, much more research is still needed in
ameliorating and expanding data collection and analysis1.
1 Some perspectives for future research are developed in Muradian and O'Connor (2001).
Cahier du C3ED n° 01-02
30
References
Adriaanse, A., Bringezu, S., Hammond, H, Moriguchi, Y., Rodenburg, E., Rogich, D., Schutz,H., 1997. Resources Flows: The Material Basis of Industrial Economies. WorldResources Institute et al., Washington D.C.
Andersson, J.O., Lindroth, M., 2001. Ecologically unsustainable trade. Ecol. Econ. 37, 113-122.
Antweiler, W. 1996. The pollution terms of trade. Economic Systems Research 8(4), 361-365.Athukorala, P., 2000. Manufactured exports and terms of trade of developing countries:
evidence from Sri Lanka. J. Develop. Stud. 36 (5), 89-104.Ayres, R., 2000. Commentary on the utility of the ecological footprint concept. Ecol. Econ.
32, 347-349.Barbier, E., 1997. Introduction to the environmental Kuznets curve special issue. Environ.
Develop. Econ. 2(4), 369-388.van den Bergh, J., Verbruggen, H., 1999. Spatial sustainability, trade and indicators: an
evaluation of the "ecological footprint". Ecol. Econ. 29 (1), 61-72.Bloch, H., Sapsford, D., 2000. Whither the terms of trade? An elaboration of the Prebisch-
Singer hypothesis. Cambridge J. Econ. 24, 461-481.Cabeza-Gutés, M., Martinez-Alier, J., 2001. L'echange Ecologiquement Inegal. In: Damian,
M., Graz, J.C., (Eds.), Commerce International et Développement Soutenable,Economica, Paris.
Costanza, R., 2000. The dynamics of the ecological footprint concept. Ecol. Econ. 32, 341-345.
Craig, P., 2001. Energy limits on recycling. Ecol. Econ. 36, 373-384.Dessus, S., Roland-Holst, D., van den Mensbrugghe D., 1994. Input-based pollution estimates
for environmental assessment in developing countries. OECD Development Centre.Technical paper No.101.
Ekins, P., 1997. The Kuznets curve for the environment and economic growth: examining theevidence. Environ. Planning 29, 805-830.
Faucheux, S, O’Connor, M., 2001. Natural Capital, The Greened National Product and theMonetization Frontier. In: van Ierland, E., van der Straaten, Vollebergh, H. (Eds.),Economic Growth and Valuation of the Environment, Edward Elgard, Cheltenham.
Fischer-Kowalski, M., Huttler, W., 1999. Society’s metabolism: the intellectual history ofmaterials flow analysis, part II, 1970-1998. J. Industrial Ecol. 2 (4), 107-136.
Friends of Earth Europe, 1995. Towards Sustainable Europe: the Study, Friends of the Earth,Brussels.
Funtowicz, S., Ravetz, J., 1994. The worth of a songbird: ecological economics as a post-normal science. Ecol. Econ. 10, 197-207.
Grainger, A., 1999. The role of spatial scale in sustainable development. Int. J. Sust. Develop.& World Ecol. 6, 251-264.
Haberl, H., Schandl, H., 1999. Indicators of sustainable land use: concepts for the analysis ofsociety-nature interrelations and implications for sustainable development. Environ.Mgmt. Health 10 (3), 177-190.
Hanley, N., Moffat, I., Faichney, R., Wilson, M., 1998. Measuring sustainability: a time seriesof alternative indicators for Scotland. Ecol. Econ. 28, 55-73.
Hartman, R., Wheeler, D., Singh, M., 1994. The cost of air pollution abatement. World BankPolicy Research Working Paper No. 1398.
Cahier du C3ED n° 01-02
31
Hettige, H., Lucas, R., Wheeler, D., 1992. The toxic intensity of industrial pollution: globalpatterns, trends, and trade policy. Economics of the Environment, AEA Papers andProceeding 82 (2).
Hettige, H., Martin, P., Singh, M., Wheeler, D., 1994. The industrial pollution projectionsystem. World Bank policy research working paper No. 1431.
Hille, J., 1997. The concept of environmental space: implications for policies, environmentalreporting and assessments. Experts’ Corner Report for the European EnvironmentalAgency No 1997/2.
van Kooten, C., Bulte, E., 2000. The ecological footprint: useful science or politics?. Ecol.Econ. 32, 385-389.
Kox, H., 1993. International agreements to deal with environmental externalities of primarycommodity exports. Paper presented at the international conference “Striking a greendeal: Europe’s role in environment and South-North trade relations”. The EuropeanParliament, Brussels, 7-9 November.
Lee, H., Roland-Host, D., 1993. International trade and the transfer of environmental costsand benefits. OECD Development Centre, Technical Papers # 91, Paris.
Lutz, M., 1999. A general test of the Prebisch-Singer hypothesis’. Rev. Develop. Econ. 3(1):44-57.
Martinez-Alier, J., O´Connor, M., 1996. Ecological Economics and Distributional Conflics,in: R. Costanza, O. Segura, Martinez-Alier, J., (Eds.), Getting Down to Earth. PracticalApplications of Ecological Economics, ISEE/Island Press, Washington.
Martinez-Alier, J., O´Connor, M., 1999. Distributional Issues: An Overview, in: van denBergh, J. (Ed.) Handbook of Environmental and Resource Economics, Edward Elgar,U.K.
Matthews, E. et. al., 2000. The Weight of Nations: Material Outflows From IndustrialEconomies, World Resources Institute, Washington D.C.
Moffat, I., 1996. An evaluation of environmental space as the basis for sustainable Europe.Int. J. Sust. Develop. & World Ecol. 3, 49-69.
Moffat, I., 1999. Is Scotland sustainable? A time series of indicators of sustainabledevelopment. Int. J. Sust. Develop. & World Ecol. 6, 242-250.
Muñoz, C., Sosvilla, S., 1993. La polémica sobre la evolución de la relación real deintercambio de los países subdesarrollados. Revista de Economía Aplicada 1(1), 165-186.
Muradian, R., O'Connor, M. 2001. Inter-country environmental load displacement andadjusted national sustainability indicators: concepts and they policy applications. Int.J. Sust. Develop. 4(1).
O’Connor, M., 1998. Entropy, Liberty and Catastrophe: On the Physics and Metaphysics ofWaste Disposal. In: Burley, P., Foster, J. (Eds.), Economics and Thermodynamics:New Perspectives on Economic Analysis, Kluwer, Dordrect/Boston/London.
O´Neill, J., 1997. Value Pluralism, Inconmmensurability and Institutions. In: Foster, J. (Ed.)Valuing Nature?, Routledge, U.K.
Opschoor, H., 2000. The ecological footprint: measuring rod or metaphor? Ecol. Econ. 32,363-365.
Pearce, D., Atkinson, G., 1993. Capital theory and the measurement of sustainabledevelopment: an indicator of "weak" sustainability. Ecol. Econ. 8, 103-108.
Prebisch, R., 1950. The Economic Development of Latin America and its Principal Problems,UNCLA, New York.
Cahier du C3ED n° 01-02
32
Proops, J., Atkinson, G. 1998. A Practical Sustainability Criterion When There IsInternational Trade. In: Faucheux, S., O’Connor, M., van der Straaten, J. (Eds.),Sustainable Development: Concepts, rationalities and strategies, Kluwer, Netherlands.
Proops, J., Atkinson, G., Schlotheim, B., Simon S., 1999. International trade andsustainability footprint: a practical criterion for its assessment. Ecol. Econ. 28, 75-97.
Rees, W., Wackernagel, M., 1999. Monetary analysis: turning a blind eye on sustainability.Ecol. Econ. 29, 47-52.
Røpke, I., 1999a. The dynamics of willingness to consume. Ecol. Econ. 28, 399-420.Røpke, I., 1999b. Prices are not worth much. Ecol. Econ. 29, 45-46.Rothman, D., 1998. Environmental Kuznets Curves ― real progress or passing the buck? A
case for consumption-based approaches. Ecol. Econ. 25, 177-794.Singer, H. W., 1950. The distribution of gains between investing and borrowing countries.
Amer. Econ. Rev. 40 (2), 473-85.Suri, V., Chapman, D., 1998. Economic growth, trade and energy: implications for the
environmental Kuznets curve. Ecol. Econ. 25, 195-208.Wackernagel, M., Onisto, L., Bello, P., Callejas, A., Lopez, I., Mendez, J., Suarez, A., Suarez,
G., 1999. National natural capital accounting with the ecological footprint concept.Ecol. Econ. 29: 375-390.
World Bank. 1998. World Development Indicators, Washington.World Resources Institute. 1994. A Guide to the Global Environment, People and the
Environment, World Resources Institute, 217 pp.Wyckoff, A., Roop, J., 1994. The embodiment of carbon in imports of manufactured
products. Energy Pol. 22 (3), 187-194.