Embed Size (px)
Citation preview
Embedding Patient Costing as a Management Tool
Ms Jennifer Browne Finance Director, Northern Adelaide Local Health Network
Public-I2-A1
Activity Based Funding Conference 2015 Friday 29 May
Casemix in SA Health and Transition into national ABF
SA Health

SA Health
Casemix Funding in SA
> Dabbled in early 1990’s with precursors to a fully functional casemix funding model
> Casemix funding introduced in 1994/95 > Vibrant casemix scene during mid to late
1990’s > Casemix remained but used mainly as a
funding tool until ABF implementation > SA Health have implemented the acute
component of the national ABF model in 2014-15
SA Health
National ABF Program Benefits for SA Health > Harmonisation in classification of hospital
based services beyond acute inpatients > Revitalising casemix and rebirth of the
casemix industry > More rigid adherence to costing
standards and allocation processes > More reliable benchmarking data across
jurisdiction > Major health reform initiatives underway
and strong focus on performance management and monitoring

SA Health
Challenges
> ‘Blending’ our Casemix Funding Model processes and outputs with national model
> Issues of running and educating clinicians on two funding models concurrently
> Managing benchmarking issues associated with the National Efficient Price
> Updating IT systems to manage new data collection requirements
SA Health
Patient Costing
> A new state-wide patient costing system was implemented (PowerPerformance Manager) • Initially there were different systems in use
across sites; • Implementation for the metropolitan sites and
6 major country sites
> Processing of costing data is undertaken centrally which enables a consistent methodology across sites
> LHNs own and retain responsibility for all their data

SA Health
Patient Costing Data Quality > Started with one site patient costed and the
other with no costing • Acute only and bronze costing standard • Now both sites are patient costed (all admitted and
non-admitted) and gold costing standard
> Incorporated feedback and datasets from clinicians to make improvements with data quality, this has led to positive impacts within: • Resuscitation Team • MET Team (Code Blue) • Work in Progress (Stomal Therapists, Code
Blacks, Sub-Acute and Mental Health Community Teams, Bad Debts, Quality and Safety, High Cost Consumable/Prosthetic Feeder System)
SA Health
Uses of Patient Costing Data
> Key focus was to make patient level costing available to managers and clinicians • Brings finance and activity together
> Ability to review data in new and improved ways. • Patient level review (end-to-end patient journey) • Benchmark across hospitals within SA • Benchmark against peer hospitals
> Understanding variations in work practices and the impact on costs and outcomes for ‘like’ patients.
> Cost data becoming part of the toolkit for clinical management and planning.
SA Health
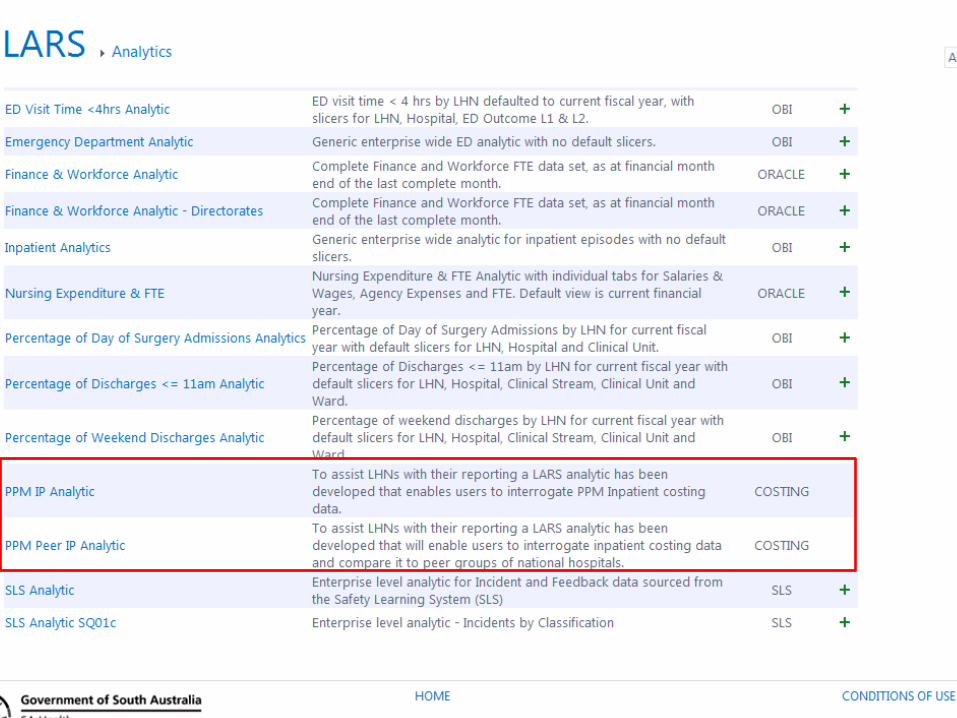
Reporting
> The LHN Analytics and Reporting Service (LARS) portal delivers local and corporate reporting from a range of SA Health data warehouses that hold data from a number of administrative, financial and clinical systems across SA Health
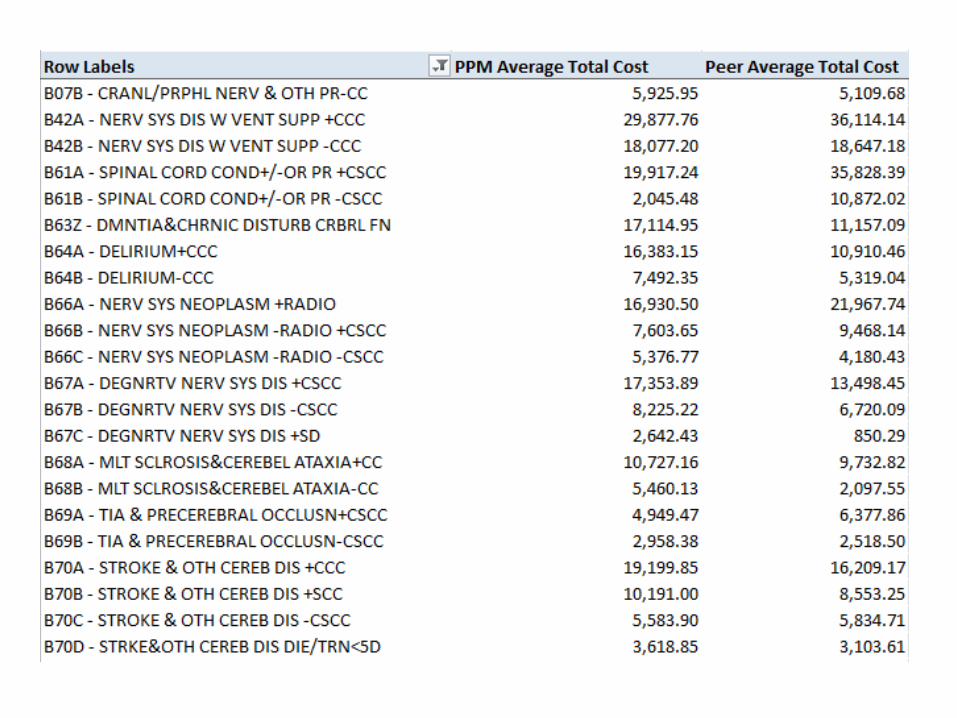
> LARS now has patient costing benchmarking capabilities • SA patient costed sites can compare against
other SA hospitals or aggregated peer hospitals
> Customised local reporting

SA Health
Northern Adelaide LHN Progress
SA Health

SA Health
NALHN Improvements
> Participating in Health Round Table > Moving to monthly costing > Clinician interest leading to data
improvements > Benchmarking
• Understanding what we do well and where there is opportunities to improve
• Business Case assessments • Savings and Improvement Opportunities • Identify, track and monitor service redesign
and productivity improvements
> Research > Activity Based Budgets > Over charging by suppliers

SA Health
How to Engage Clinicians
SA Health
How to Engage Clinicians
> Be honest about what is possible and ensure they understand the limitations
> Tailor the message to fit the audience • One-on-one informal discussions • Attend staff meetings • Present to large groups
> Make reports of interest to clinicians • Show surgeons information of theatre times
> No question is a stupid question
SA Health
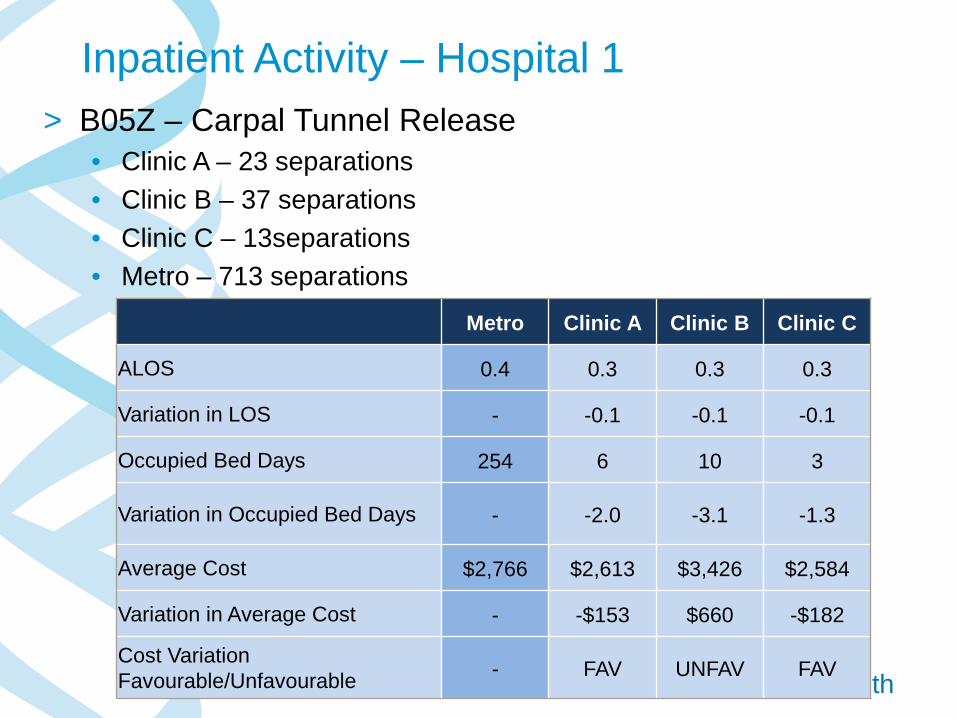
Inpatient Activity – Hospital 1 > B05Z – Carpal Tunnel Release
• Clinic A – 23 separations • Clinic B – 37 separations • Clinic C – 13separations • Metro – 713 separations Metro Clinic A Clinic B Clinic C
ALOS 0.4 0.3 0.3 0.3
Variation in LOS - -0.1 -0.1 -0.1
Occupied Bed Days 254 6 10 3
Variation in Occupied Bed Days - -2.0 -3.1 -1.3
Average Cost $2,766 $2,613 $3,426 $2,584
Variation in Average Cost - -$153 $660 -$182
Cost Variation Favourable/Unfavourable - FAV UNFAV FAV
SA Health
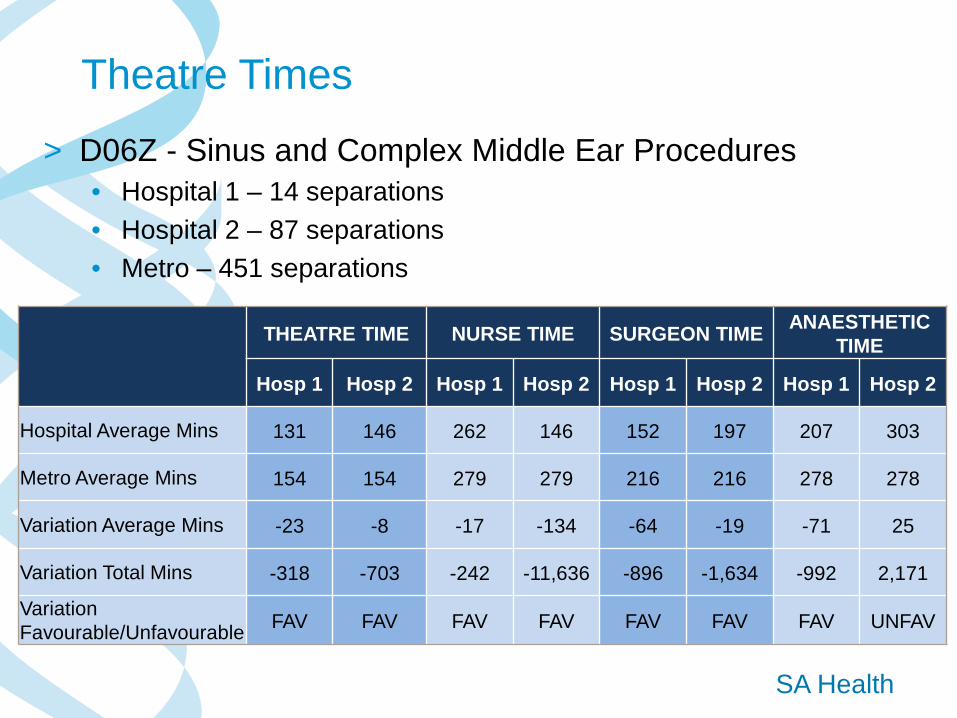
Theatre Times
> D06Z - Sinus and Complex Middle Ear Procedures • Hospital 1 – 14 separations • Hospital 2 – 87 separations • Metro – 451 separations
THEATRE TIME NURSE TIME SURGEON TIME ANAESTHETIC
TIME
Hosp 1 Hosp 2 Hosp 1 Hosp 2 Hosp 1 Hosp 2 Hosp 1 Hosp 2
Hospital Average Mins 131 146 262 146 152 197 207 303
Metro Average Mins 154 154 279 279 216 216 278 278
Variation Average Mins -23 -8 -17 -134 -64 -19 -71 25
Variation Total Mins -318 -703 -242 -11,636 -896 -1,634 -992 2,171
Variation Favourable/Unfavourable FAV FAV FAV FAV FAV FAV FAV UNFAV
SA Health
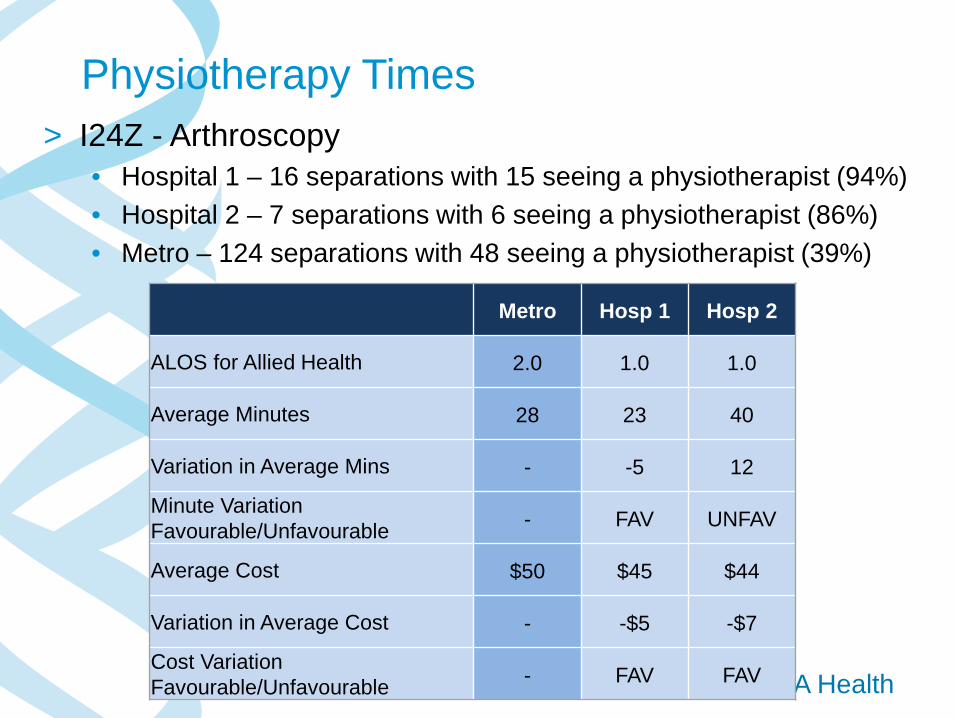
Physiotherapy Times > I24Z - Arthroscopy
• Hospital 1 – 16 separations with 15 seeing a physiotherapist (94%) • Hospital 2 – 7 separations with 6 seeing a physiotherapist (86%) • Metro – 124 separations with 48 seeing a physiotherapist (39%)
Metro Hosp 1 Hosp 2
ALOS for Allied Health 2.0 1.0 1.0
Average Minutes 28 23 40
Variation in Average Mins - -5 12
Minute Variation Favourable/Unfavourable - FAV UNFAV
Average Cost $50 $45 $44
Variation in Average Cost - -$5 -$7
Cost Variation Favourable/Unfavourable - FAV FAV
SA Health
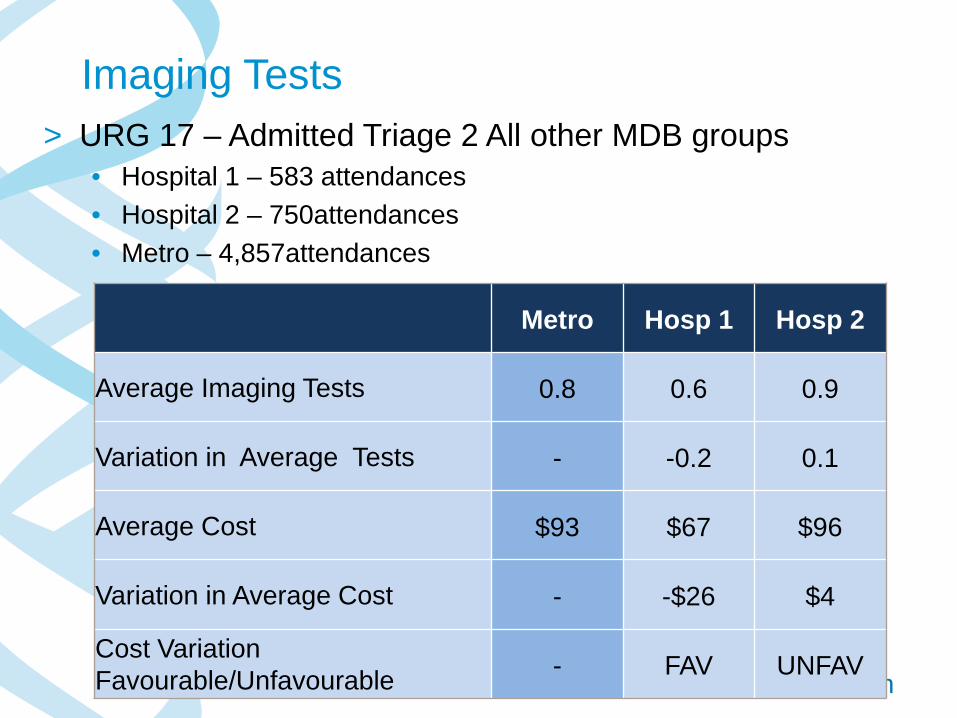
Imaging Tests > URG 17 – Admitted Triage 2 All other MDB groups
• Hospital 1 – 583 attendances • Hospital 2 – 750attendances • Metro – 4,857attendances
Metro Hosp 1 Hosp 2
Average Imaging Tests 0.8 0.6 0.9
Variation in Average Tests - -0.2 0.1
Average Cost $93 $67 $96
Variation in Average Cost - -$26 $4
Cost Variation Favourable/Unfavourable - FAV UNFAV

SA Health
What the future holds
SA Health

Critical Factors Moving Forward
Real Time Reporting Performance Frameworks Finance and Activity Efficiency
Improvements
More Timely Data
Ongoing System Refinements
SA Health
How Far Can We Go???
> Continual improvement of data quality > Costing a patient over their lifetime > Increased data linkage in particular
aligning with outcomes • Cost of an illness not an
attendance/separation • Look at how to improve patient outcomes