Embed Size (px)
Citation preview
Embedding Energy Management– Carbon introduction
Insert site / company name and logo here
Insert presenter/s names here
This publication was funded by the Australian Government through the Workforce Innovation Program under the title 'Carbonproof for Foundries'.
The material provided in this presentation has been produced in conjunction with our partner Energetics Pty Ltd.
Embedding Energy Management is available from www.sustainabilityskills.net.au
Manufacturing Skills Australia1800 358 458
© 2013 Manufacturing Skills Australia. All rights reserved
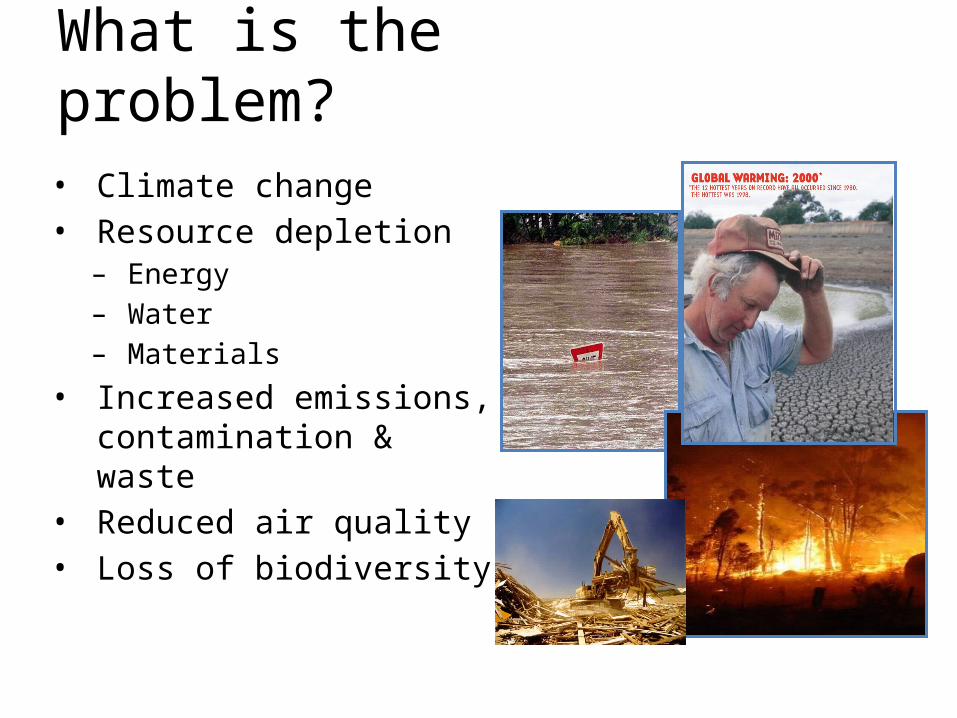
• Climate change • Resource depletion
– Energy– Water– Materials
• Increased emissions, contamination & waste
• Reduced air quality • Loss of biodiversity
What is the problem?
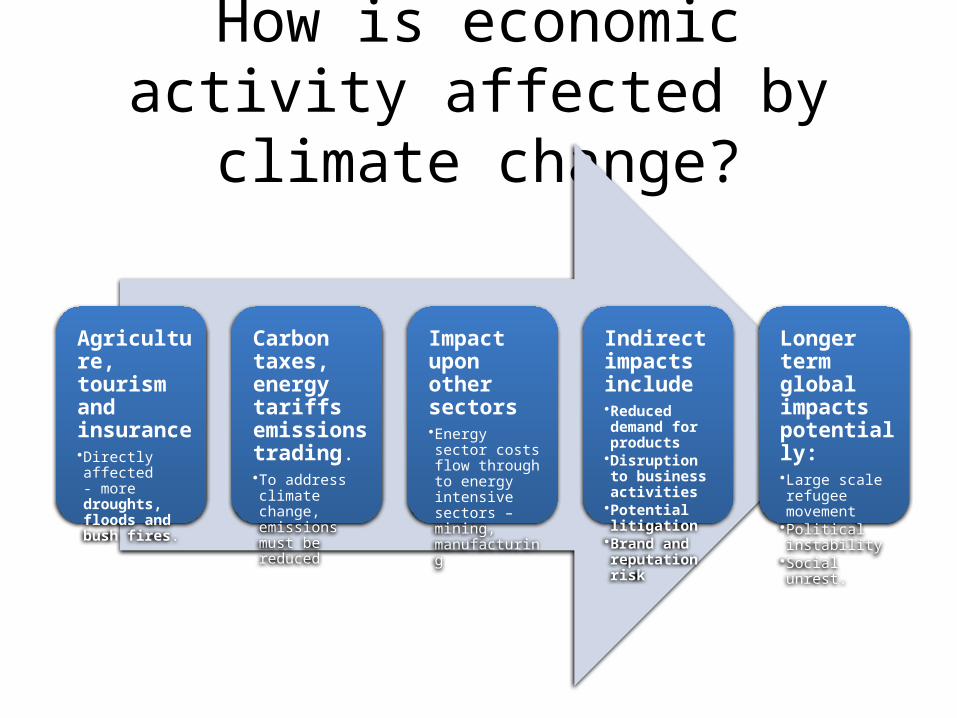
How is economic activity affected by climate change?
Agriculture, tourism and insurance•Directly affected - more droughts, floods and bush fires.
Carbon taxes, energy tariffs emissions trading.•To address climate change, emissions must be reduced
Impact upon other sectors•Energy sector costs flow through to energy intensive sectors – mining, manufacturing
Indirect impacts include •Reduced demand for products
•Disruption to business activities
•Potential litigation
•Brand and reputation risk
Longer term global impacts potentially:•Large scale refugee movement
•Political instability •Social unrest.
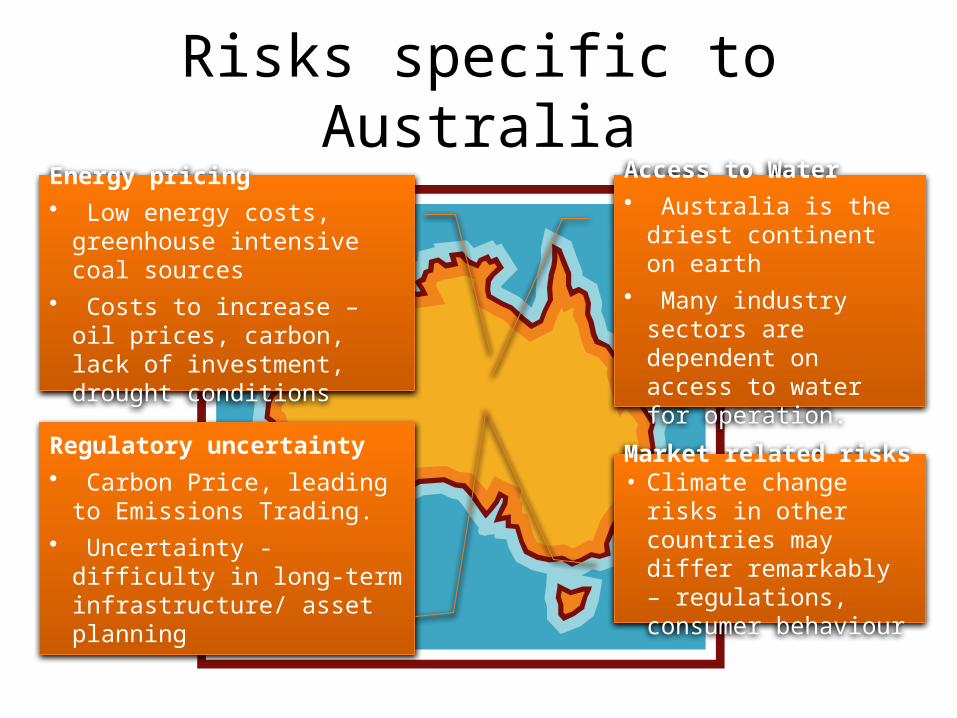
Risks specific to Australia
Access to Water • Australia is the driest
continent on earth • Many industry sectors
are dependent on access to water for operation.
Market related risks• Climate change risks in
other countries may differ remarkably – regulations, consumer behaviour
Energy pricing• Low energy costs, greenhouse
intensive coal sources• Costs to increase – oil prices,
carbon, lack of investment, drought conditions
Regulatory uncertainty• Carbon Price, leading to
Emissions Trading.• Uncertainty - difficulty in long-
term infrastructure/ asset planning
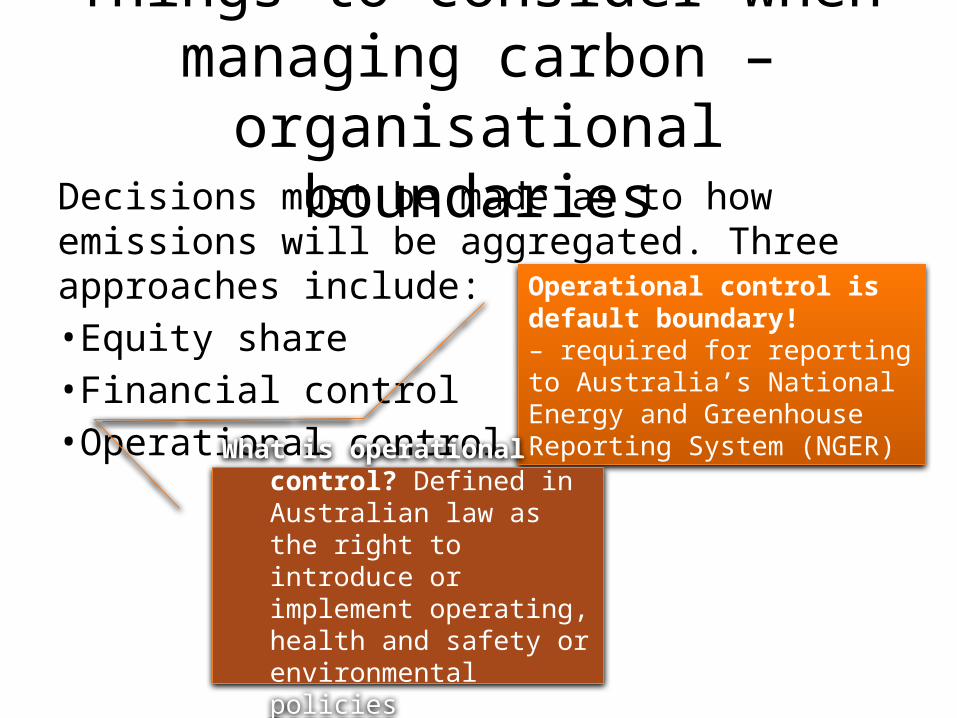
Things to consider when managing carbon – organisational boundariesDecisions must be made as to how emissions will be aggregated. Three approaches include:•Equity share•Financial control•Operational control
Operational control is default boundary! – required for reporting to Australia’s National Energy and Greenhouse Reporting System (NGER)
What is operational control? Defined in Australian law as the right to introduce or implement operating, health and safety or environmental policies
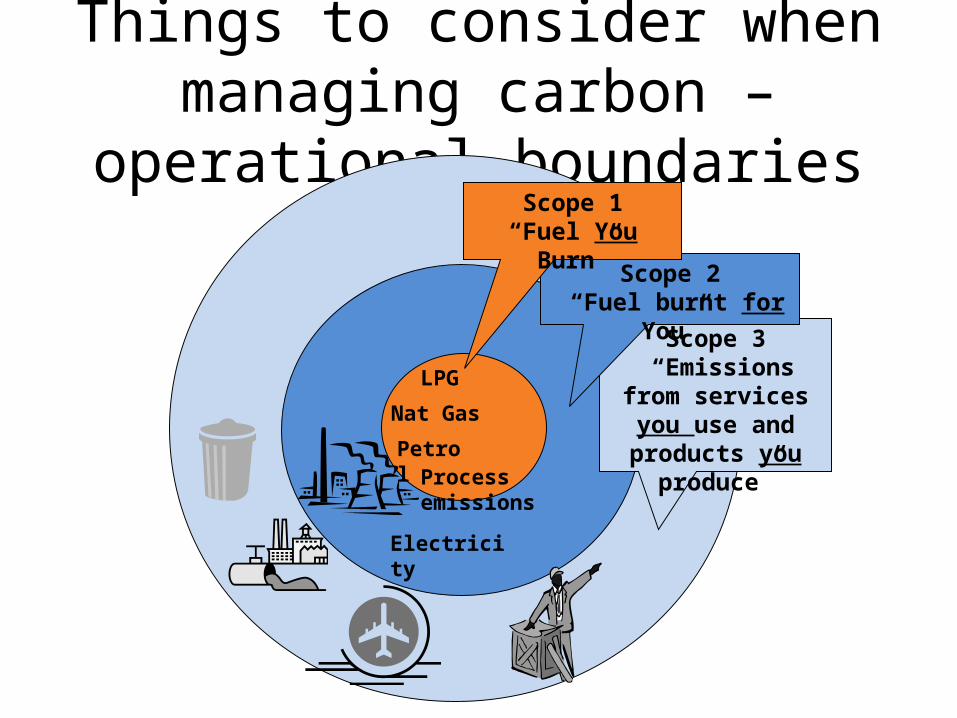
Things to consider when managing carbon – operational boundaries
Scope 3 “Emissions from services you use and products you
produce”
Nat Gas
PetrolProcess emissions
LPG
Scope 2 “Fuel burnt for You”
Scope 1“Fuel You Burn”
Electricity
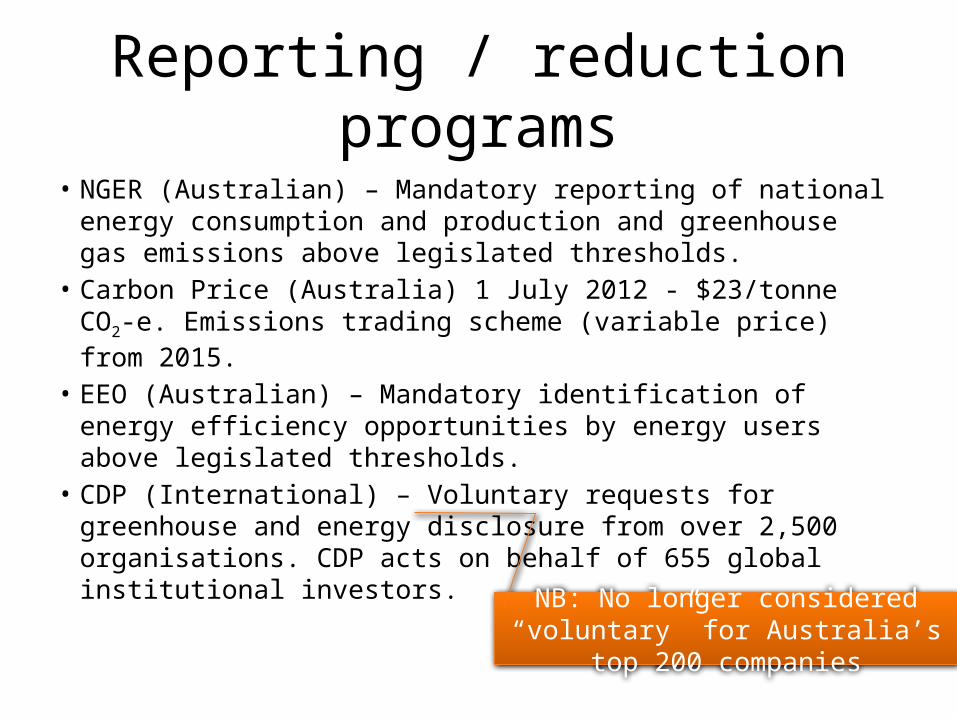
Reporting / reduction programs
• NGER (Australian) – Mandatory reporting of national energy consumption and production and greenhouse gas emissions above legislated thresholds.
• Carbon Price (Australia) 1 July 2012 - $23/tonne CO2-e. Emissions trading scheme (variable price) from 2015.
• EEO (Australian) – Mandatory identification of energy efficiency opportunities by energy users above legislated thresholds.
• CDP (International) – Voluntary requests for greenhouse and energy disclosure from over 2,500 organisations. CDP acts on behalf of 655 global institutional investors.NB: No longer considered “voluntary”
for Australia’s top 200 companies
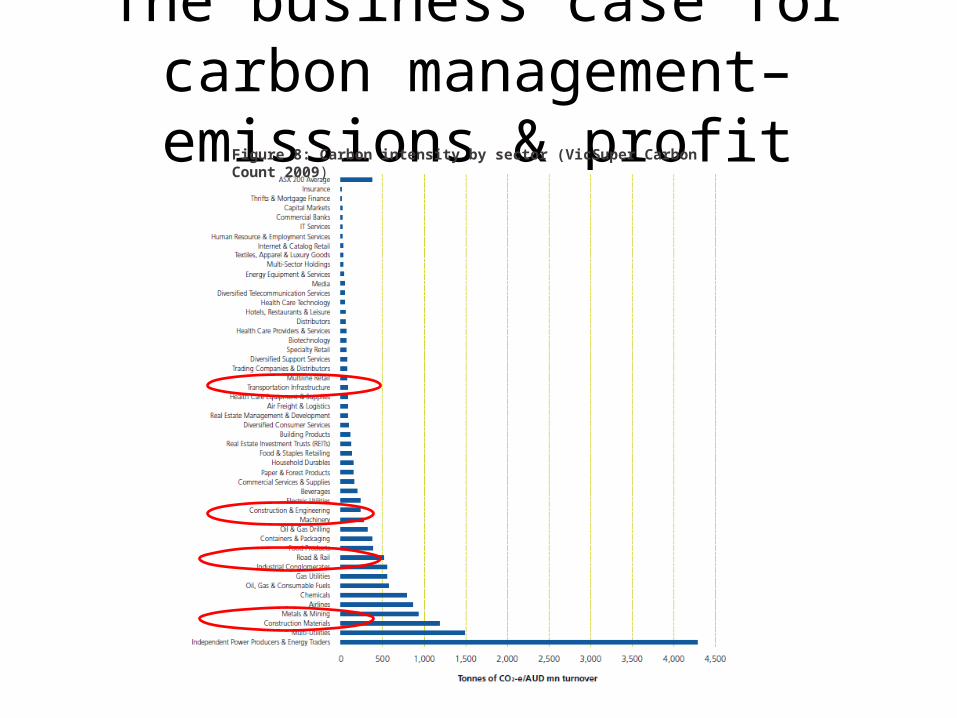
The business case for carbon management– emissions & profit
Figure 8: Carbon intensity by sector (VicSuper Carbon Count 2009)
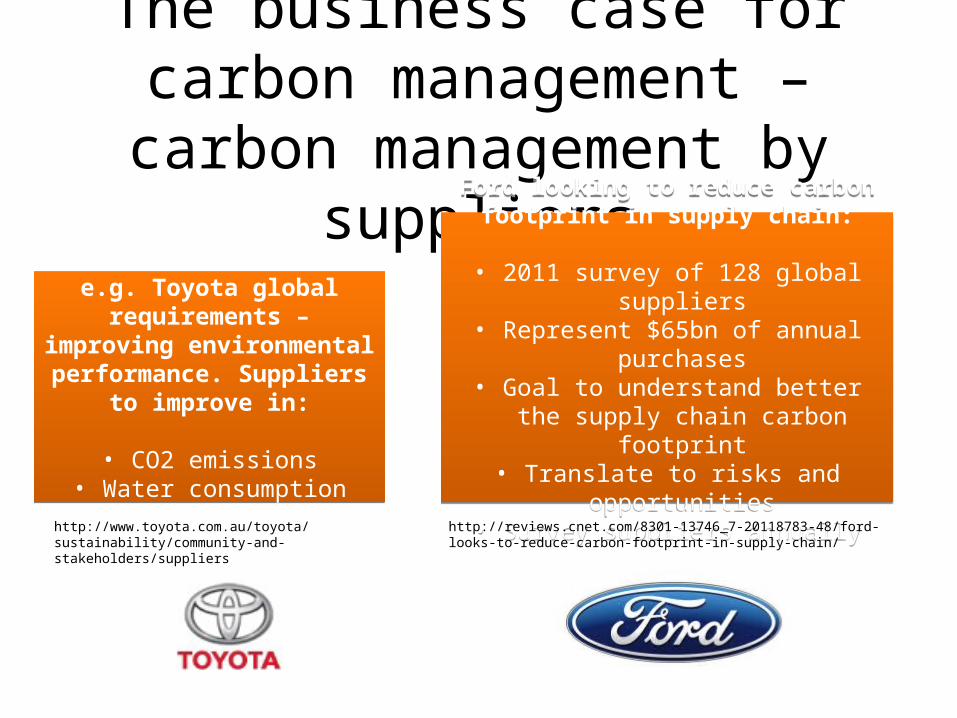
The business case for carbon management – carbon
management by suppliers
e.g. Toyota global requirements – improving
environmental performance. Suppliers to improve in:
• CO2 emissions
• Water consumption
e.g. Toyota global requirements – improving
environmental performance. Suppliers to improve in:
• CO2 emissions
• Water consumption
Ford looking to reduce carbon footprint in supply chain:
• 2011 survey of 128 global suppliers
• Represent $65bn of annual purchases
• Goal to understand better the supply chain carbon footprint
• Translate to risks and opportunities• Survey suppliers annually
Ford looking to reduce carbon footprint in supply chain:
• 2011 survey of 128 global suppliers
• Represent $65bn of annual purchases
• Goal to understand better the supply chain carbon footprint
• Translate to risks and opportunities• Survey suppliers annually
http://reviews.cnet.com/8301-13746_7-20118783-48/ford-looks-to-reduce-carbon-footprint-in-supply-chain/
http://www.toyota.com.au/toyota/sustainability/community-and-stakeholders/suppliers
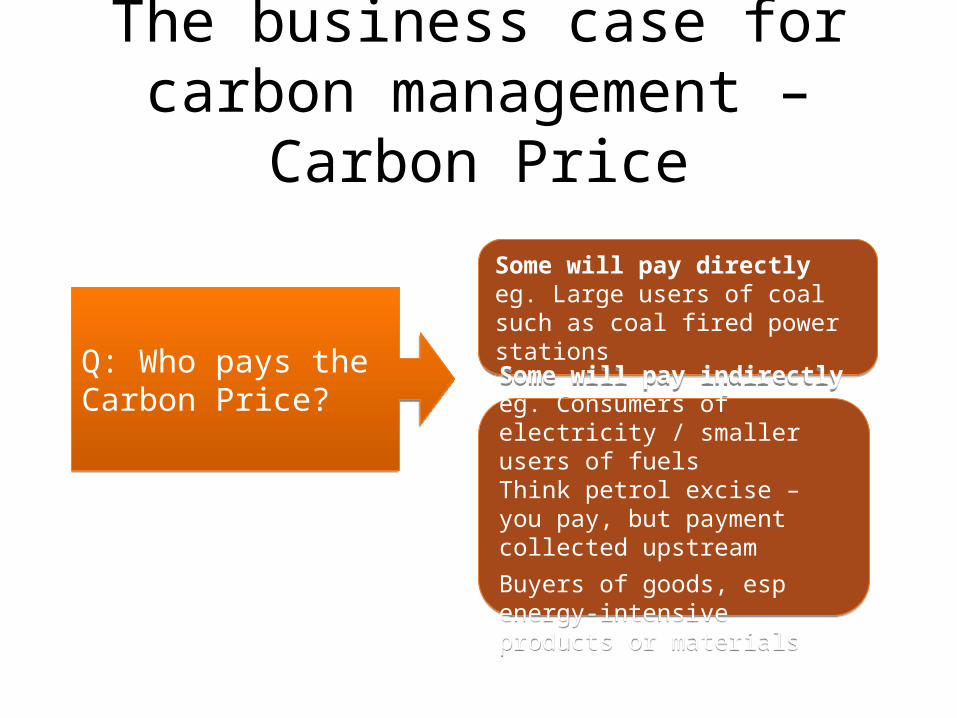
The business case for carbon management – Carbon Price
Q: Who pays the Carbon Price?Q: Who pays the Carbon Price?
Some will pay directly eg. Large users of coal such as coal fired power stations
Some will pay directly eg. Large users of coal such as coal fired power stations
Some will pay indirectly eg. Consumers of electricity / smaller users of fuelsThink petrol excise – you pay, but payment collected upstream
Buyers of goods, esp energy-intensive products or materials
Some will pay indirectly eg. Consumers of electricity / smaller users of fuelsThink petrol excise – you pay, but payment collected upstream
Buyers of goods, esp energy-intensive products or materials
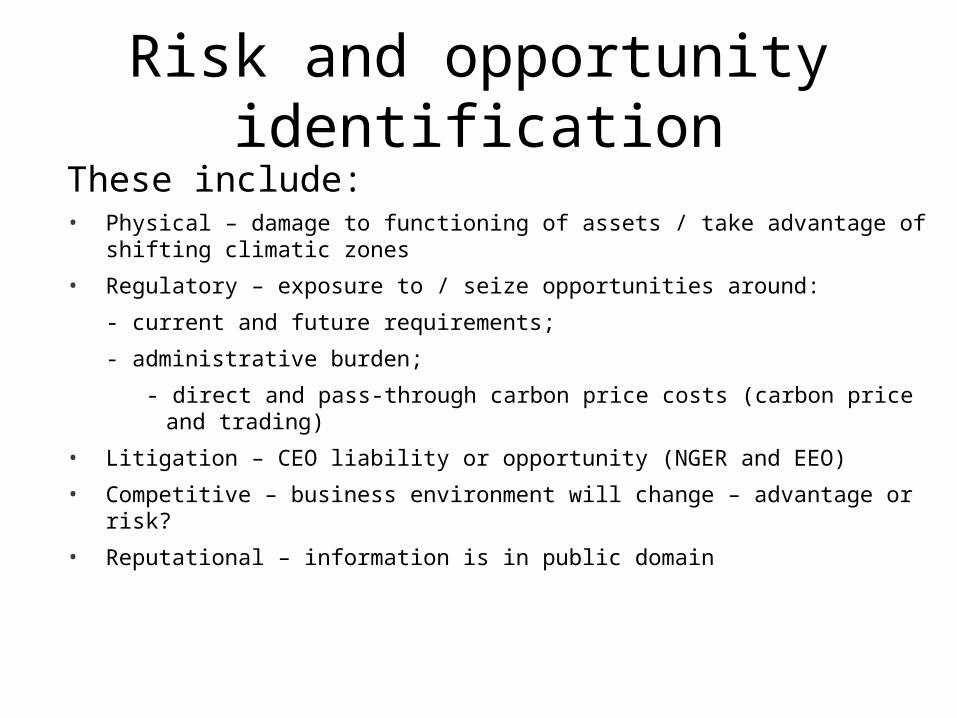
Risk and opportunity identificationThese include:• Physical – damage to functioning of assets / take advantage of shifting climatic
zones
• Regulatory – exposure to / seize opportunities around:
- current and future requirements;
- administrative burden;
- direct and pass-through carbon price costs (carbon price and trading)
• Litigation – CEO liability or opportunity (NGER and EEO)
• Competitive – business environment will change – advantage or risk?
• Reputational – information is in public domain
The business case for carbon management
Experience shows that sustainability makes good business sense • Embedding sustainability within an organisation’s broader business strategies
frequently results in organisational and technical innovations that generate both top- and bottom-line returns.
• Reducing inputs to a business, due to a carbon-constrained economy, reduces costs.
• Reducing inputs requires new or improved products or even new business lines.
Additional slides for management presentation
Insert following slides as required using data from “What's my footprint “ tool
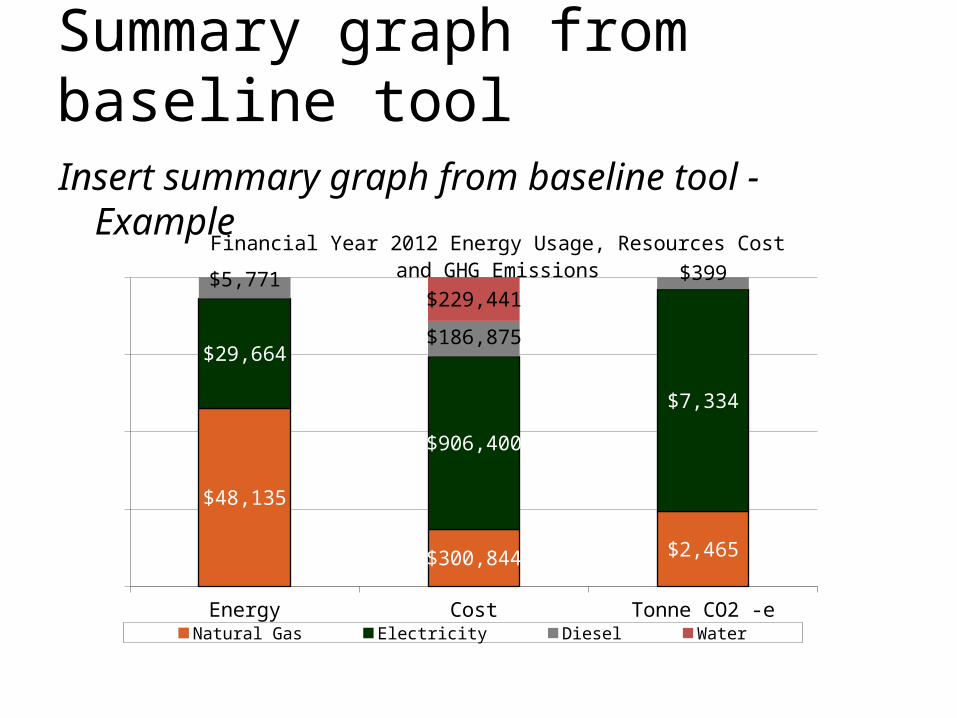
Summary graph from baseline toolInsert summary graph from baseline tool - Example
Energy Cost Tonne CO2 -e
$48,135
$300,844 $2,465
$29,664
$906,400
$7,334
$5,771
$186,875
$399$229,441
Financial Year 2012 Energy Usage, Resources Cost and GHG Emissions
Natural Gas Electricity Diesel Water
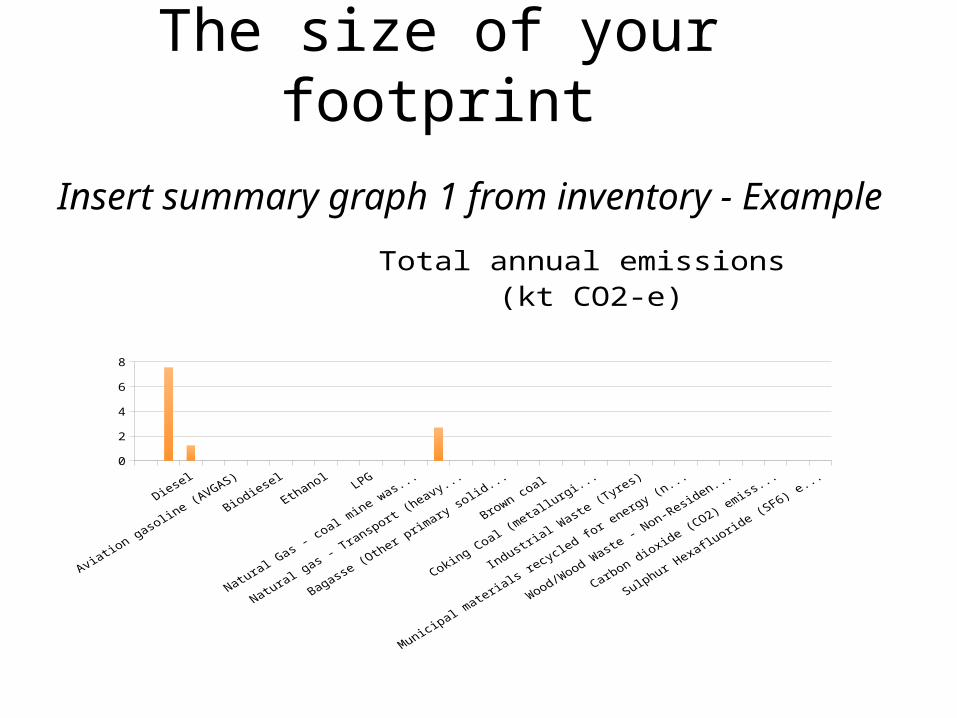
The size of your footprintInsert summary graph 1 from inventory - Example
012345678
Total annual emissions (kt CO2-e)
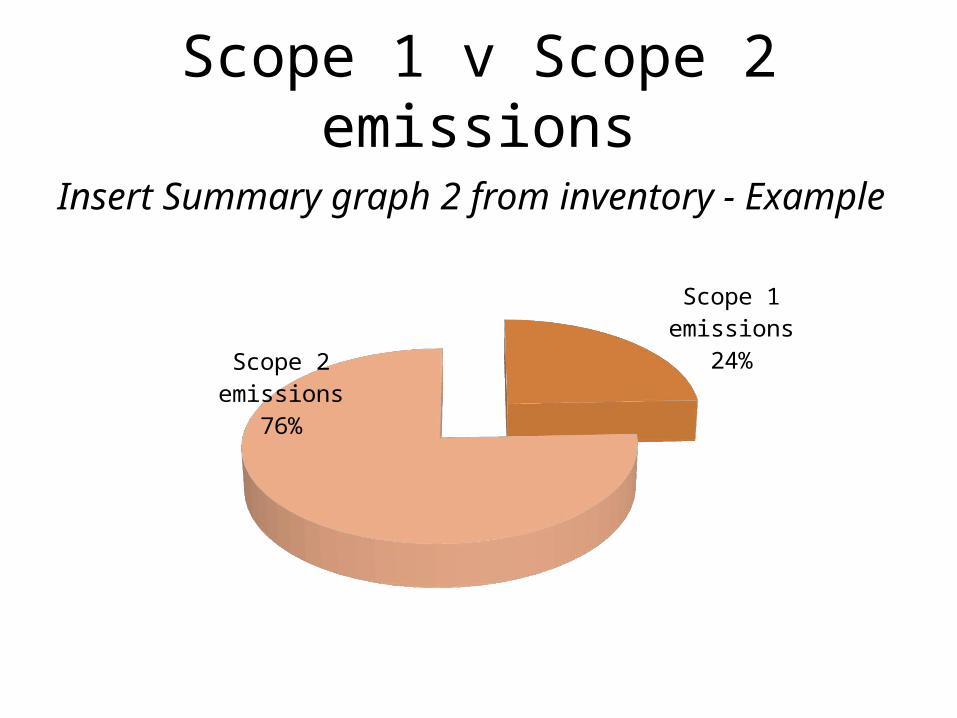
Scope 1 v Scope 2 emissions
Insert Summary graph 2 from inventory - Example
Scope 1 emissions
24%Scope 2 emissions
76%
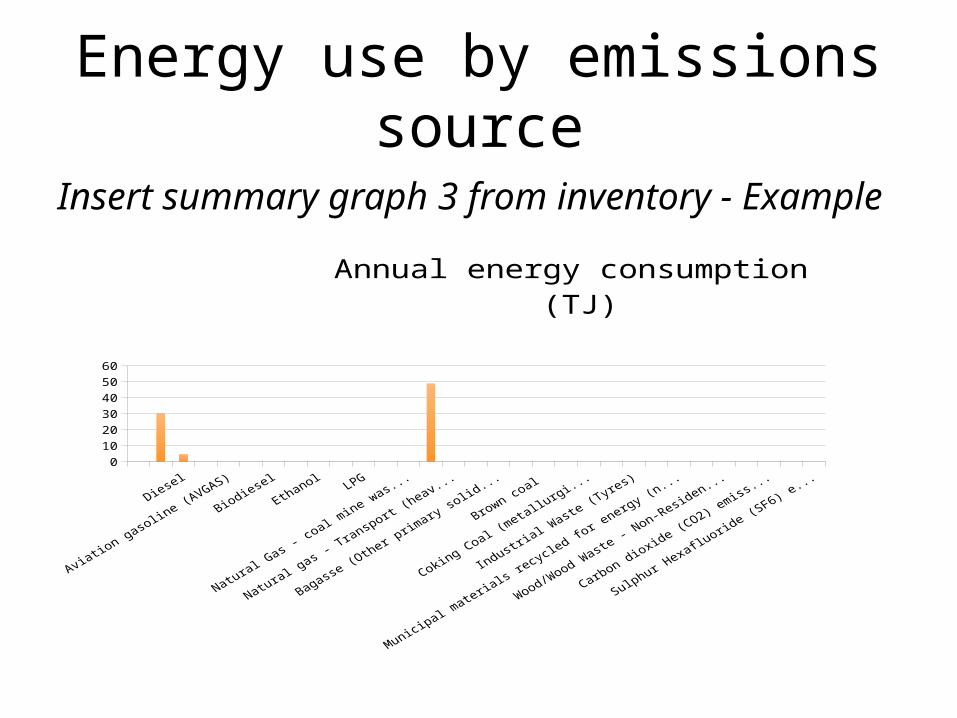
Energy use by emissions source
Insert summary graph 3 from inventory - Example
0102030405060
Annual energy consumption (TJ)
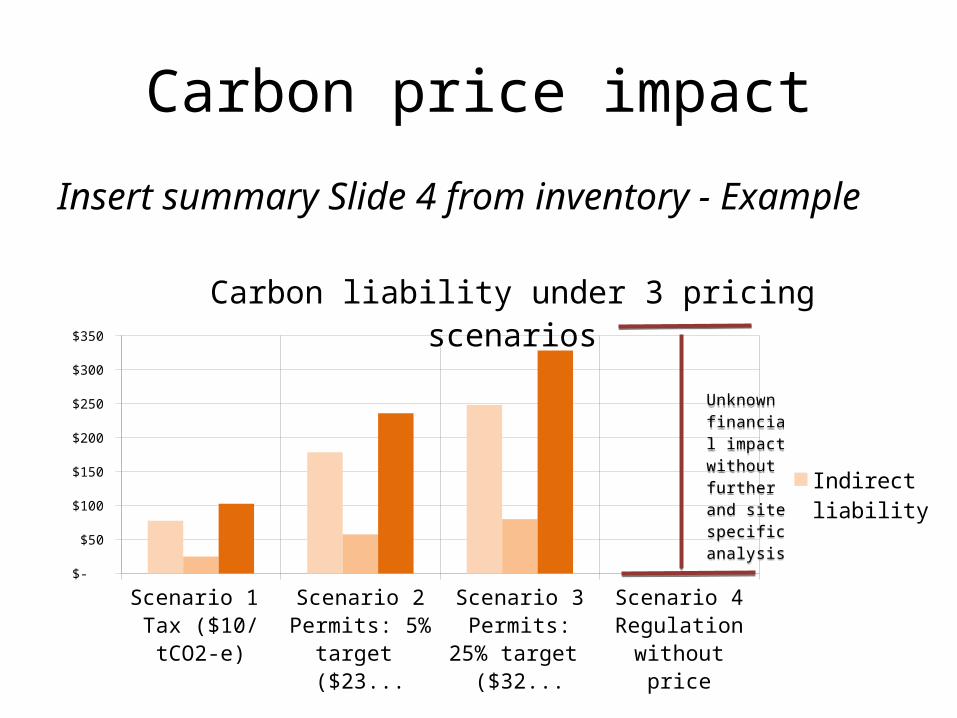
Carbon price impact
Insert summary Slide 4 from inventory - Example
$-
$50
$100
$150
$200
$250
$300
$350
Carbon liability under 3 pricing scenarios
Indirect liabilityDirect liabilityTotal
Unknown fin-ancial impact without further and site spe-cific analysis
Unknown fin-ancial impact without further and site spe-cific analysis
![Lecture 1: Unit 1 [Insert Course Reference Here] [Insert Facilitator Reference Here] [Insert Contact Details Here] [Insert Contact Web address Here]](https://img.pdfslide.us/doc/110x75/551488d5550346d36e8b4d98/lecture-1-unit-1-insert-course-reference-here-insert-facilitator-reference-here-insert-contact-details-here-insert-contact-web-address-here-wwwnaturaledgeprojectnet.jpg)
![BRINGING WELLNESS TO [INSERT NAME OF COMMUNITY HERE] [INSERT YOUR NAME OR YOUR ORGANIZATION NAME HERE] [INSERT PRESENTATION DATE HERE]](https://img.pdfslide.us/doc/110x75/56649eab5503460f94bb0f09/bringing-wellness-to-insert-name-of-community-here-insert-your-name-or-your.jpg)
![[insert briefing type here] [insert program name here] for [insert name and organization of person(s) to be briefed here] [insert “month day, year” of](https://img.pdfslide.us/doc/110x75/56649ed15503460f94bdfd72/insert-briefing-type-here-insert-program-name-here-for-insert-name-and.jpg)


![Evidence-Based Medicine Presentation [Insert your name here] [Insert your designation here] [Insert your institutional affiliation here] Department of](https://img.pdfslide.us/doc/110x75/56649efd5503460f94c109e1/evidence-based-medicine-presentation-insert-your-name-here-insert-your-designation.jpg)


![[ Insert Firm Here ]](https://img.pdfslide.us/doc/110x75/61e09142b36b6b48621f7c26/-insert-firm-here-.jpg)
![Briefed by: [insert briefer’s name here] [insert briefer’s organization code here]](https://img.pdfslide.us/doc/110x75/56814fca550346895dbd895b/briefed-by-insert-briefers-name-here-insert-briefers-organization.jpg)