Embed Size (px)
Citation preview

Embedding a carbon price into business strategy
September 2016

02
1,200+ companiesdisclose to CDP their plans or current practice of placing a price on their carbon emissions as an approach to managing carbon risk.
140+ of these companiesare taking this approach further, by embedding a carbon price deeper within business strategies and operations to help take tangible action on climate change.

03
Contents
Important NoticeThe contents of this report may be used by anyone providing acknowledgment is given to CDP. This does not represent a license to repackage or resell any of thedata reported to CDP and presented in this report. If you intend to repackage or resell any of the contents of this report, you need to obtain express permission fromCDP before doing so.
CDP has prepared the data and analysis in this report based on responses to the CDP 2016 climate change and supply chain information requests. No representation or warranty (express or implied) is given by CDP as to the accuracy or completeness of the information and opinions contained in this report. You should not act upon the information contained in this publication without obtaining specific professional advice. To the extent permitted by law, CDP do not accept or assume any liability, responsibility or duty of care for any consequences of you or anyone else acting, or refraining to act, in reliance on the information contained in this report or for any decision based on it.
CDP North America, Inc, is a not–for-profit organization with 501(c)3 charitable status in the U.S.© 2016 CDP. All rights reserved.
04 Executive summary
05 Foreword
05 Message from investors
08 Latest trends
10 Sector trends
11 Regional trends
12 Policy and carbon pricing: Who prices carbon around the world?
14 Disclosed prices by region: Internalizing policy prices
16 A maturing practice
16 Embedding an internal price on carbon into business strategy
18 Carbon pricing is already delivering change
20 Case studies
20 Novartis
21 SUEZ
22 Saint-Gobain
23 Nissan Motor Co. Limited
24 Arçelik A.S.
25 Harmony Gold Mining Company Limited
26 Royal DSM
27 Appendix
27 CDP Climate Change Questionnaire Guidance: effectively answering the internal price on carbon question
28 Full list of companies using and planning to use an internal price on carbon
In this report, all price values are in USD unless otherwise stated (see currency conversion rates on page 28). All emissions are reported in metric tons. All data is based on the responses of CDP 2016 climate change and supply chain information requests (only responses submitted prior to September 5, 2016).

04
Executive summary
More than ever, investors are demanding comprehensive climate disclosure.
This includes assurance that companies are lowering their risk exposure to policies that place a price on carbon and reallocating capital to deliver higher returns in a low-carbon economy. This report provides investors, companies and governments with an overview of how companies are responding to carbon pricing signals within the global economy.
Key findings:
1. 23% more companies disclose the adoption of a price on carbon.
1,249 companies disclosed their practice of pricing carbon emissions, or their plans to soon do so. This represents a 23% increase from 2015. Companies use this approach to prepare for a carbon-constrained future by building prudent buffers into their business models today.
2. A carbon price is being embedded deeper into business strategy compared to 2015.
147 companies are taking this approach further, by embedding a carbon price deeper within business strategies and operations. They have identified it as a mechanism that can help systematically achieve emissions reductions and related targets. Companies report that an internal price helps by providing an incentive or added reason to reallocate resources toward low-carbon activities; as a factor in the business case for R&D investments; and as a way to reveal hidden risks and opportunities in a company’s operations and in its supply chains.
Examples of companies who highlight one or more of these reasons are Anglo American Platinum, Arçelik A.S., Autodesk Inc., Bouygues, Cummins Inc., ENGIE, Harmony Gold Mining Company Limited, Kering, Microsoft Corporation, Nissan Motor Co. Ltd, Novartis, Royal DSM, Saint-Gobain, Sky Plc, Societe Generale, SUEZ, TD Bank Group, and Vina Concha y Toro SA.
3. Companies using an internal carbon price are seeing tangible impacts.
37 companies have disclosed a tangible impact as a result of internalizing a cost on carbon. They describe a variety of ways in which this tool has directly shifted investments toward energy efficiency measures, low-carbon initiatives, energy purchases, and the development of low-carbon product offerings.
4. Large numbers of companies may be at risk.
While 370 companies in 14 high-emitting industries say they are adopting carbon pricing, over 500 say they do not plan to do so. Approximately 400 of these are headquartered in countries who are considering, are currently or have already implemented a price on carbon. The number of companies potentially at risk is likely to be even larger given the multinational nature of many of these companies and the wider sectoral coverage of some carbon taxes. As data around carbon exposure continues to improve, investors
may question the risk-preparedness of these companies for climate regulations.
5. Corporate carbon pricing has increased noticeably in some regions.
This year’s reported increase is prevalent in all regions. Notable increases were from companies headquartered in Brazil, China, India, Japan, Mexico, the Republic of Korea, and the U.S. Some of these countries have carbon pricing policies in operation or policy proposals under consideration. Others do not. It is too early to tell whether these increases come as a result of corporate reactions to the Paris Agreement, price signals from national polices, or are indicative of a new corporate norm.
6. Price levels vary by region.
Only 30% of companies disclosed the price(s) they use, ranging from <$1 to >$800.
Typically, if clear regulatory carbon price signals exist, the bulk of disclosed corporate price levels will follow the policy price. For example, many companies in Canada and the Republic of Korea disclosed price levels consistent with the prevailing carbon price levels due to regulation. In contrast, corporate price levels varied significantly across European companies, which could be due to the variety of carbon pricing policies operating in the region. U.S. companies also disclosed a big price range—and many signals that factored into price calculations, including the EU’s and California’s emissions trading systems and the U.S. Environmental Protection Agency’s social cost of carbon.
7. Pricing practices vary by sector.
Of all the companies that responded to CDP’s internal carbon pricing question, the Utilities and Energy GICS sectors had the highest proportion of companies reporting that they currently price or plan to price carbon—63% of Utilities disclosers and 52% of Energy disclosers.
This compares with 30–40% of disclosing companies in the Financials, Telecommunication Services and Materials Sectors, and 19–25% in Health Care, Consumer Discretionary, Information Technology, Consumer Staples and Industrials. {
This report’s findings are based on disclosures of 5,759 companies who responded to CDP’s 2016 climate change and supply chain information requests, made on behalf of investors with $100 trillion in assets, and purchasing organizations with over $2 trillion in spending power.
05
I am delighted to launch this report on the eve of Climate Week in New York. The results reported in this release of annual CDP data are a sign of increasingly concerted action by business to deal with the risk of a changing climate.
As co-Chair of the business engagement working group of the World Bank’s Carbon Pricing Leadership Coalition, I have witnessed some of this progress up close as the private sector continues to increase its vocal support for, and implementation of, carbon pricing. We believe the progress seen here represents another milestone in a historic year of international agreements and action on climate change. Additionally, we anticipate the first release of guidance by the Task Force on Climate-related Financial Disclosures, as well as the potentially early entry into force of the Paris Agreement. Both are significant milestones.
While the cumulative impact of these developments has yet to be fully measured, the responses to CDP’s 2016 disclosure request indicates that the move toward carbon pricing we reported last year continues apace. This report highlights a continuing trend that companies are relying on low-carbon activities in their corporate strategies as a response to changing price signals within the economy.
Our data show a 23% increase in the number of major companies using, or planning to use, an internal price on carbon as an approach to managing carbon risk. It is particularly exciting to note that companies are beginning to report tangible impacts as a result of using an internal carbon price within their business planning processes. Carbon pricing schemes are driving change in corporate behavior –not yet, however, at the rate and scale necessary to keep global temperature rise to well below 2°C.
When companies and investors internalize the cost of carbon by attaching a monetary value to each unit of CO²e, it enables them to account for and manage carbon risk throughout their operations and supply chains, or their portfolios. Companies do this when they realize they are exposed to various forms of systemic risk and seek to manage it through pricing their climate-related emissions. Business decision makers may use carbon pricing as a tool to
test their strategy against future scenarios or to help drive investment towards climate-aligned corporate goals, be it an emissions reduction target, an energy related challenge, or the creation of a new low-carbon product line.
This latter approach is an exciting new development, as this report discusses. A group of companies are now reporting plans to take their use of an internal price on carbon to the next level: using it to help execute a corporate climate target. Saint-Gobain and SUEZ, for example, have assigned a higher price for investing in low-carbon R&D, while Nissan applies it when choosing between investments that will help achieve their emission reduction targets.
Readers will note that we have included a message from investors in this year’s report. There is a seachange happening in the investment world on this issue and demand for CDP data has dramatically increased on the part of investors who are reading the ‘writing on the wall’ as they seek to identify high-carbon activities in their portfolios. Investors and owners are looking for clear signs that companies are managing risk and seizing opportunities, demonstrating that they can successfully chart a course into the economy of the future. Showing you are embedding climate change into the heart of your business strategy is a critical part of this process. Internalizing a price on carbon and disclosing when and how you use it can demonstrate preparedness for future climate-related challenges and opportunities.
We hope you find this report useful for your own planning activities, and we look forward to helping companies and investors to lower their carbon footprint, and their carbon risk. {
ForewordLance Pierce, President, CDP North America

06
This report comes at a critical time in the global journey to tackle the risk that climate change represents.
While this material risk is something that pension funds such as CalSTRS and AP4 have been focused on for many years now, it is clear that we are seeing a progressive shift in how much attention the investment community at large is placing on climate change. This will have a significant impact on how capital is allocated in the future.
For CalSTRS, AP4 and other long-term investors and shareholders, climate change represents a potential permanent capital loss and consequently a significant drag on investment returns. As public pension funds, CalSTRS and AP4 have hundreds of thousands of members and stakeholders relying on the secure retirement future that we are here to provide in perpetuity—it is absolutely critical that we take action to guard against this risk.
The momentum and surrounding awareness around the impacts of climate change triggered by the Paris Agreement is only one of the signs of change felt by the financial community. 2016 is a big year for our sector as well, with green finance featured as a major focus at the recent G20 meeting in China, followed by the Task Force on Climate-related Financial Disclosures publishing its main report before the end of this year. The latter refers to the task force established by the G20’s Financial Stability Board to develop consistent, voluntary climate-related risk disclosures that companies can use when providing information to investors, lenders, insurers, and other stakeholders. Transparency is even more vital than ever before.
This increasing focus on risk disclosures signifies that the industry will be seeking firm assurance that the companies they invest in have recognized climate risk and are properly managing it. For companies, this means not only managing their exposure to climate impacts but also increasing climate regulation and related economic policies being put into place globally. To deliver on their goals, governments are hard at work implementing policies that incentivize low-carbon and discourage high-carbon activities. Ultimately, these policies will elicit a change in price signals in the economy, with high-carbon activities becoming cost-prohibitive.
More importantly, these activities cost the economy much more in terms of the increased risk they bring, which is why governments increasingly turn to carbon pricing as an effective economic tool for driving down emissions. It is not a question of whether or not companies will be required to pay a price on carbon (either in the form of a tax or within a cap-and-trade system)—in fact, they are already required to do so in many places, and it will not be long before these prices will escalate across many of the world’s markets.
In our funds, we have already begun to identify the worst performers—the worst polluters in each sector—to mitigate risk in our portfolio. We believe that these companies will be doubly hit in the economy of the future—not only will their P&L be damaged, but they will also be significantly devalued over the long-term, which greatly concerns us as shareholders.
Additionally, we are actively engaging with various companies to ensure our capital is allocated to lower-risk, higher-return activities. Because pension funds are not only investors but owners too, we play active roles on selection committees for major companies which we own and can therefore bring a significant voice as part of the discussion in the life of a company and its overall governance and performance. And no CFO wants to tell their board that pension funds will no longer be investing in them as they are deemed unsustainable over the long-term.
This is why it is critical that companies are able to demonstrate how they are taking climate change seriously and are properly managing it. As the momentum for full disclosure in this area increases, we will not only be looking at company emissions but also analyzing how climate risk mitigation is embedded within their corporate strategies. Those companies who show investors and owners that they take this issue seriously and have a plan in place to tackle it will enjoy a lower cost of capital in the future against those that don’t.
It is critical that companies demonstrate how they are taking climate change seriously and are properly managing it.
Message from investorsJack Ehnes, CEO, CalSTRS Mats Andersson, Former CEO of AP4 and Vice-Chairman of the Global Challenges Foundation

07
This is why we are pleased to see the growing trend of companies internalizing the cost of carbon. CDP’s report documents the growing trend of companies disclosing that they are pricing carbon into their investment decision-making processes. This is simple risk management and in some sectors should be the norm. What is even more interesting to see is the growing group of companies who set a corporate carbon price and use it to deliberately achieve a strategic goal—whether to drive down emissions, increase low-carbon assets or stimulate a new climate-friendly line of products. This clearly signals to us an important change is underway and the momentum is growing at a global scale.
Companies that set a meaningful emissions reduction target and clearly price carbon into their corporate decision making process
are demonstrating to shareholders that they are gradually maturing in their approach to climate change and their knowledge-base and understanding of the impacts of lack of action. This is why this report and the work that CDP is undertaking to increase corporate engagement and disclosure in this area is so very important. We look forward to seeing more companies measuring their carbon, pricing it, delivering reductions and reporting on it in the coming years. {
Jack Ehnes
CEO CalSTRS
Mats Andersson
Former CEO of AP4
Vice-Chairman of the Global Challenges Foundation

08
1,249 companies are disclosing to CDP their plans or current practice of putting a price on carbon emissions because they understand that carbon risk management is a business imperative. This represents a 23% increase from 2015.
More than ever, investors are demanding comprehensive climate disclosure—including assurance that companies are adequately lowering their risk exposure to policies that place a price on carbon and reallocating capital toward areas of their business that will see a higher return in a low-carbon economy. Disclosures to CDP in 2016 capture the corporate response: 517 companies are already using internal carbon pricing as an accounting and risk management tool (19% increase from 2015), and an additional 732 disclose plans to implement one by 2018 (26% increase from 2015).
These companies, across all industries and geographies, have identified internal carbon pricing as an approach to building prudent buffers into their business models to prepare for a carbon-constrained future. They have told CDP that embedding the cost of carbon into operations and economic forecasts can help them better mitigate the risks posed by existing or emerging carbon pricing regulations, prioritize energy efficiency, and drive investments in renewable energy purchases and other GHG emissions reduction activities.
This year’s data demonstrates that the use of internal carbon pricing among corporations is also maturing and establishing itself as a driver of real change in business practices.
147 companies are embedding an internal carbon price ever deeper within business strategies and across operations in order to take tangible action on climate change. These companies have identified carbon pricing as a mechanism to systematically achieve emissions reductions and related targets mandated by management.
A sub-set of 37 companies describe a variety of ways in which this tool has directly impacted budget allocations or investment decisions, which has re-sulted in tangible changes. Examples include shift-ing investments toward energy efficiency measures, low-carbon initiatives, energy purchases, and the development of low-carbon product offerings.
Some companies cite the usefulness of an internal price on carbon in making the business case for low-carbon investments, as it can improve the return on investment (ROI) or an investment’s ‘payback period’. This signifies a distinct shift in the use of internal carbon pricing: from an input in investment decisions to one that directly supports the execution of climate targets. {
The use of internal carbon pricing is maturing and establishing itself as a driver of real change.
Latest trends
1 Another 1,223 companies did not respond to the internal carbon pricing question (CC2.2c/S2.2c).

09
1,223not diclosing their practice
3,234not pricing
1,249 total
732planning
517pricingnow
500+potentially atregulatory risk
500+potentially atregulatory risk
147embedding inclimate strategy
37disclosing impact
23%increasefrom previousyear
Corporate carbon pricing: 2016 in numbers
Internal carbon pricing: driving change in business practices
The image to the left illustrates the breakdown of CDP’s global sample of companies into stages of the internal carbon pricing process: In the planning stage, 732 companies are considering whether an internal carbon price can assist the business’s strategic approach or operations, or how their business should use a price on carbon. 517 companies are already utilizing an internal price as an accounting and risk management tool. Of these, 147 companies are taking this approach a step further to actually embed the price as part of a strategy to achieve an established climate target. 37 companies are reporting tangible results against targets.
Companies not pricing
Over 3,200 companies disclosed to CDP that they do not use an internal price on carbon and do not plan to adopt this approach in the next two years.¹ Over 500 of these are in high-emitting industries (as opposed to the 370 in the same industries who are adopting a price) with approximately 400 being headquartered in countries who are either considering, are currently implementing, or have already implemented, a price on carbon. The number of companies potentially at risk is likely to be even larger given the multinational nature of many of these companies and the wider sectoral coverage of some carbon taxes. As data around carbon exposure continues to improve, investors may question the risk-preparedness of these companies for climate regulations.
10
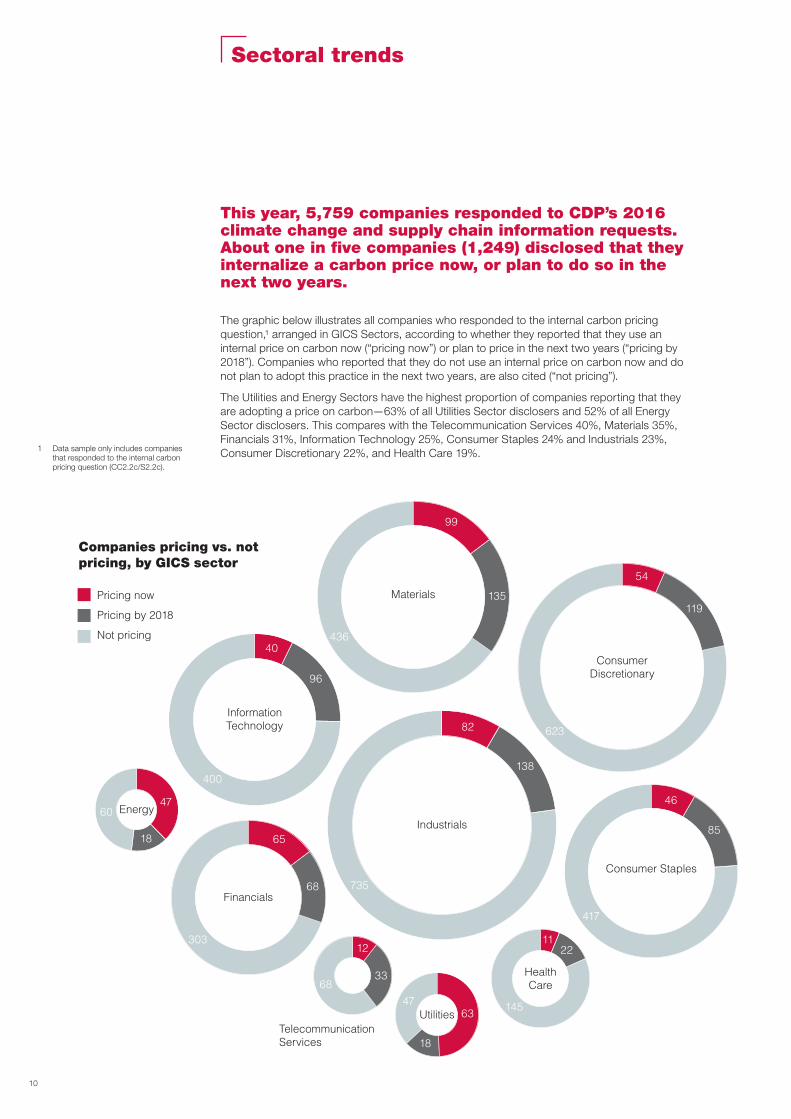
This year, 5,759 companies responded to CDP’s 2016 climate change and supply chain information requests. About one in five companies (1,249) disclosed that they internalize a carbon price now, or plan to do so in the next two years.
The graphic below illustrates all companies who responded to the internal carbon pricing question,¹ arranged in GICS Sectors, according to whether they reported that they use an internal price on carbon now (“pricing now”) or plan to price in the next two years (“pricing by 2018”). Companies who reported that they do not use an internal price on carbon now and do not plan to adopt this practice in the next two years, are also cited (“not pricing”).
The Utilities and Energy Sectors have the highest proportion of companies reporting that they are adopting a price on carbon—63% of all Utilities Sector disclosers and 52% of all Energy Sector disclosers. This compares with the Telecommunication Services 40%, Materials 35%, Financials 31%, Information Technology 25%, Consumer Staples 24% and Industrials 23%, Consumer Discretionary 22%, and Health Care 19%.
UtilitiesTelecommunicationServices
Materials
InformationTechnology
Industrials
HealthCare
Financials
Energy
Consumer Staples
ConsumerDiscretionary
Pricing now
Pricing by 2018
Not pricing
623
119
54
47
99
135
436
400
65
68
30312
63
18
47
1122
145
46
85
417
3368
82
138
735
96
40
18
60
Sectoral trends
1 Data sample only includes companies that responded to the internal carbon pricing question (CC2.2c/S2.2c).
Companies pricing vs. not pricing, by GICS sector
11
As the international community moves towards implementing the Paris Agreement, carbon pricing is seen by many as a key mechanism driving emissions reductions in the private and public sector.2
To date, 180 nations have signed the Paris Agreement, agreeing to limit global average temperature rise to well below 2°C compared with pre-industrial levels. Over half of those national governments plan to use carbon pricing and other market mechanisms to achieve their emissions reduction goals, as stated in their ‘nationally determined contributions’ (NDCs).3
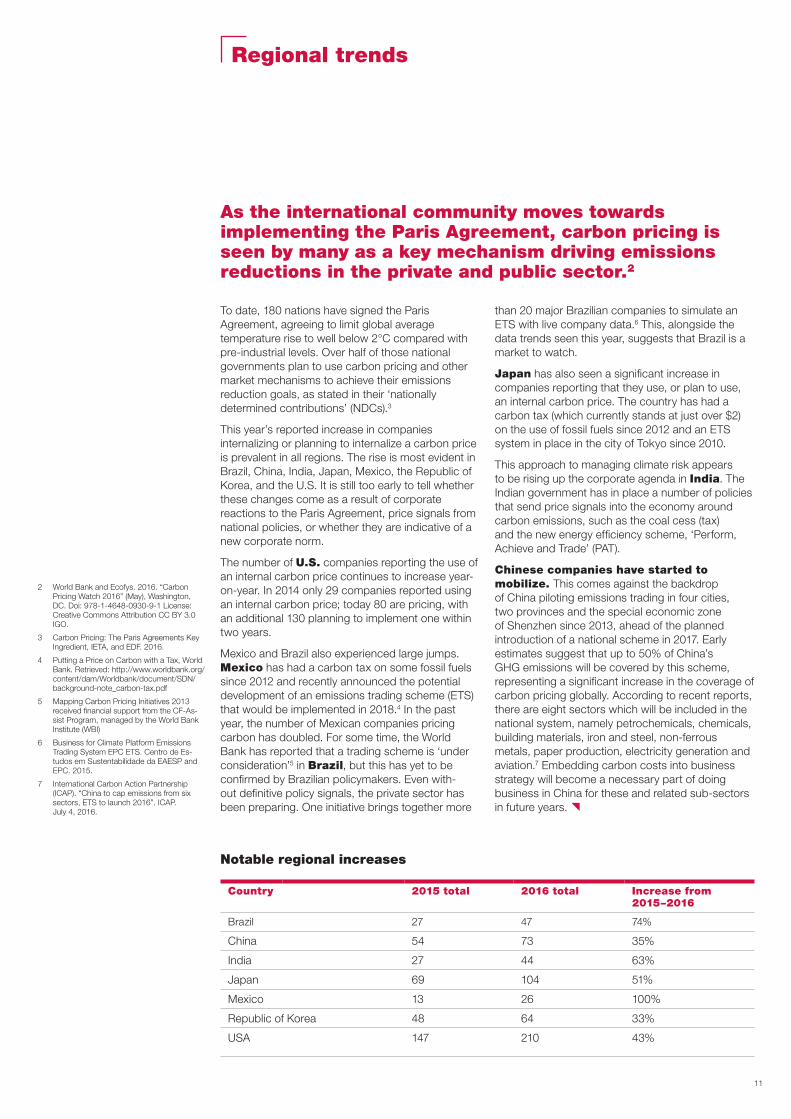
This year’s reported increase in companies internalizing or planning to internalize a carbon price is prevalent in all regions. The rise is most evident in Brazil, China, India, Japan, Mexico, the Republic of Korea, and the U.S. It is still too early to tell whether these changes come as a result of corporate reactions to the Paris Agreement, price signals from national policies, or whether they are indicative of a new corporate norm.
The number of U.S. companies reporting the use of an internal carbon price continues to increase year-on-year. In 2014 only 29 companies reported using an internal carbon price; today 80 are pricing, with an additional 130 planning to implement one within two years.
Mexico and Brazil also experienced large jumps. Mexico has had a carbon tax on some fossil fuels since 2012 and recently announced the potential development of an emissions trading scheme (ETS) that would be implemented in 2018.4 In the past year, the number of Mexican companies pricing carbon has doubled. For some time, the World Bank has reported that a trading scheme is ‘under consideration’5 in Brazil, but this has yet to be confirmed by Brazilian policymakers. Even with-out definitive policy signals, the private sector has been preparing. One initiative brings together more
than 20 major Brazilian companies to simulate an ETS with live company data.6 This, alongside the data trends seen this year, suggests that Brazil is a market to watch.
Japan has also seen a significant increase in companies reporting that they use, or plan to use, an internal carbon price. The country has had a carbon tax (which currently stands at just over $2) on the use of fossil fuels since 2012 and an ETS system in place in the city of Tokyo since 2010.
This approach to managing climate risk appears to be rising up the corporate agenda in India. The Indian government has in place a number of policies that send price signals into the economy around carbon emissions, such as the coal cess (tax) and the new energy efficiency scheme, ‘Perform, Achieve and Trade’ (PAT).
Chinese companies have started to mobilize. This comes against the backdrop of China piloting emissions trading in four cities, two provinces and the special economic zone of Shenzhen since 2013, ahead of the planned introduction of a national scheme in 2017. Early estimates suggest that up to 50% of China’s GHG emissions will be covered by this scheme, representing a significant increase in the coverage of carbon pricing globally. According to recent reports, there are eight sectors which will be included in the national system, namely petrochemicals, chemicals, building materials, iron and steel, non-ferrous metals, paper production, electricity generation and aviation.7 Embedding carbon costs into business strategy will become a necessary part of doing business in China for these and related sub-sectors in future years. {
Country 2015 total 2016 total Increase from 2015–2016
Brazil 27 47 74%
China 54 73 35%
India 27 44 63%
Japan 69 104 51%
Mexico 13 26 100%
Republic of Korea 48 64 33%
USA 147 210 43%
Notable regional increases
2 World Bank and Ecofys. 2016. “Carbon Pricing Watch 2016” (May), Washington, DC. Doi: 978-1-4648-0930-9-1 License: Creative Commons Attribution CC BY 3.0 IGO.
3 Carbon Pricing: The Paris Agreements Key Ingredient, IETA, and EDF. 2016.
4 Putting a Price on Carbon with a Tax, World Bank. Retrieved: http://www.worldbank.org/content/dam/Worldbank/document/SDN/background-note_carbon-tax.pdf
5 Mapping Carbon Pricing Initiatives 2013 received financial support from the CF-As-sist Program, managed by the World Bank Institute (WBI)
6 Business for Climate Platform Emissions Trading System EPC ETS. Centro de Es-tudos em Sustentabilidade da EAESP and EPC. 2015.
7 International Carbon Action Partnership (ICAP). “China to cap emissions from six sectors, ETS to launch 2016”. ICAP. July 4, 2016.
Regional trends
12
KAZAKHSTAN
ESTONIA
LATVIA
LITHUANIA
UKRAINE
BRITISHCOLUMBIA
CALIFORNIA
QUÉBEC
RGGI*
ALBER
TA
BEIJING
TIANJIN
CHONGQINGPROVINCE
SHENZHEN
GUANGDONGPROVINCE
TOKYO
SAITAMA PROVINCE
KYOTO
HUBEIPROVINCE
USA
UNITED ARABEMIRATES
TURKEY
THAILAND
TAIWAN
SWITZERLAND
REPUBLIC OF KOREA
SOUTH AFRICA
SINGAPORE
RUSSIA
PHILIPPINES
PERU
Existing policies
Emerging policies
NORWAY
NIGERIA
NEW ZEALAND
MEXICO
MALAYSIA
JORDAN
JAPAN
ISRAEL
INDONESIA
INDIA
HONG KONG
GUATEMALA
EGYPT
ECUADOR
COSTA RICA
COLOMBIA
CHINA
CHILE
CANADA
BRAZIL
BERMUDA
AUSTRALIA
ARGENTINA
EUROPEAN UNION
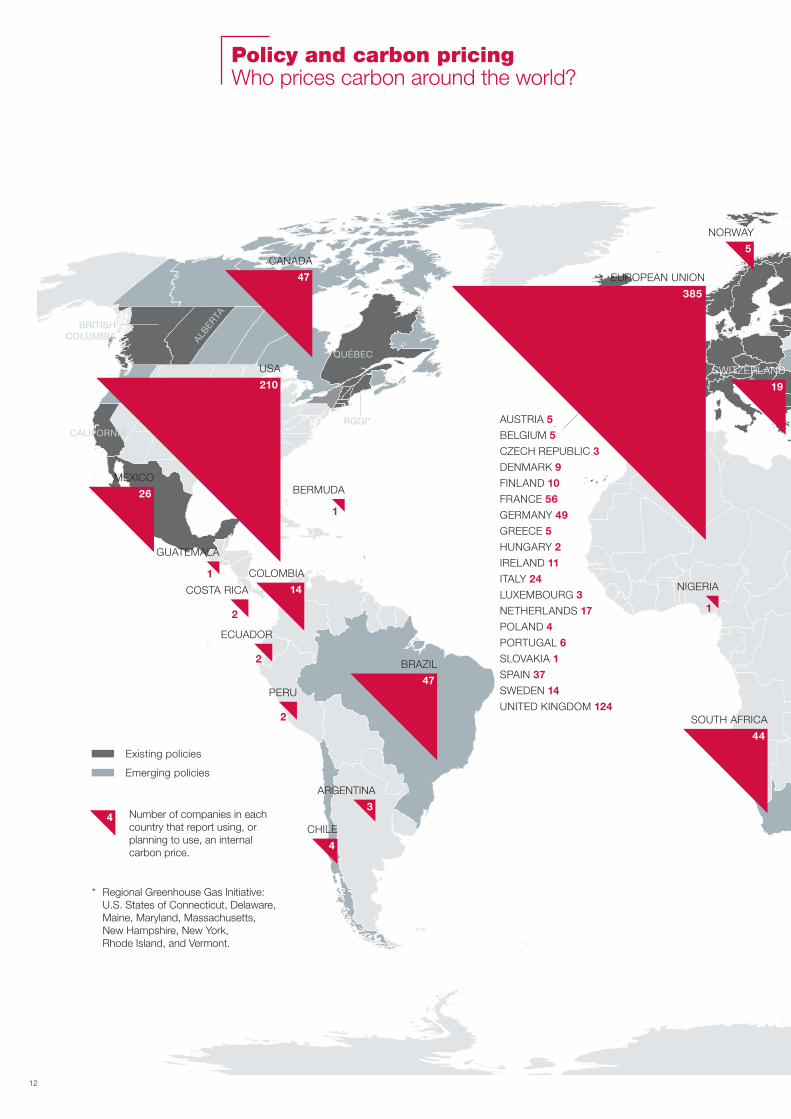
* Regional Greenhouse Gas Initiative:U.S. States of Connecticut, Delaware, Maine, Maryland, Massachusetts,New Hampshire, New York, Rhode Island, and Vermont.
3Number of companies in each country that report using, or planning to use, an internal carbon price.
37
1
47
47
4
4
73
14
2
1
1
6
44
3
1
104
1
2
26
3
1
5
2
2
4
3
6
44
64
19
52
10
20
2
210
385
AUSTRIA 5
BELGIUM 5
CZECH REPUBLIC 3
DENMARK 9
FINLAND 10
FRANCE 56
GERMANY 49
GREECE 5
HUNGARY 2
IRELAND 11
ITALY 24
LUXEMBOURG 3
NETHERLANDS 17
POLAND 4
PORTUGAL 6
SLOVAKIA 1
SPAIN 37
SWEDEN 14
UNITED KINGDOM 124
Policy and carbon pricingWho prices carbon around the world?

13
KAZAKHSTAN
ESTONIA
LATVIA
LITHUANIA
UKRAINE
BRITISHCOLUMBIA
CALIFORNIA
QUÉBEC
RGGI*
ALBER
TA
BEIJING
TIANJIN
CHONGQINGPROVINCE
SHENZHEN
GUANGDONGPROVINCE
TOKYO
SAITAMA PROVINCE
KYOTO
HUBEIPROVINCE
USA
UNITED ARABEMIRATES
TURKEY
THAILAND
TAIWAN
SWITZERLAND
REPUBLIC OF KOREA
SOUTH AFRICA
SINGAPORE
RUSSIA
PHILIPPINES
PERU
Existing policies
Emerging policies
NORWAY
NIGERIA
NEW ZEALAND
MEXICO
MALAYSIA
JORDAN
JAPAN
ISRAEL
INDONESIA
INDIA
HONG KONG
GUATEMALA
EGYPT
ECUADOR
COSTA RICA
COLOMBIA
CHINA
CHILE
CANADA
BRAZIL
BERMUDA
AUSTRALIA
ARGENTINA
EUROPEAN UNION
* Regional Greenhouse Gas Initiative:U.S. States of Connecticut, Delaware, Maine, Maryland, Massachusetts,New Hampshire, New York, Rhode Island, and Vermont.
3Number of companies in each country that report using, or planning to use, an internal carbon price.
37
1
47
47
4
4
73
14
2
1
1
6
44
3
1
104
1
2
26
3
1
5
2
2
4
3
6
44
64
19
52
10
20
2
210
385
AUSTRIA 5
BELGIUM 5
CZECH REPUBLIC 3
DENMARK 9
FINLAND 10
FRANCE 56
GERMANY 49
GREECE 5
HUNGARY 2
IRELAND 11
ITALY 24
LUXEMBOURG 3
NETHERLANDS 17
POLAND 4
PORTUGAL 6
SLOVAKIA 1
SPAIN 37
SWEDEN 14
UNITED KINGDOM 124
Carbon pricing policy information source: World Bank and Ecofys. 2016. “Carbon Pricing Watch 2016” (May), Washington, DC.
Note: Implemented policies re-categorized as “existing,” and scheduled policies and policies under consideration re-categorized as “emerging.”

14
EU ETS$5.92
South AfricanCarbon Tax
$8.17
UK carbon price floor$25.71
South African CarbonTax (phase-in price)
$3.27
Tokyo and Saitama ETS$31.19
Korean ETS$16.12
$Quebec CAT $12.60
BC carbon tax $22.99
Alberta SGER $15.33
$
$
European UnionCarbon prices by company, $USD/metric ton
South AfricaCarbon prices by company, $USD/metric ton
United KingdomCarbon prices by company, $USD/metric ton
CanadaCarbon prices by company, $USD/metric ton
Republic of KoreaCarbon prices by company, $USD/metric ton
JapanCarbon prices by company, $USD/metric ton
$
$
$
150.78
83.77
39.09 50.26 80.4223.34
69.25
5.58 67.01
64
55.84
54.03
50
22.34
40
39.09
35.74
33.51
33.51
33.51
30
27.92
27.92
25
22.34
22.34
12.29
7.82
15
6.70
12.29
12.29
11.49
11.17
11.17
11.17
10.05
9.42
8.94
8.94
8.23
8
7.82
7.82
7.82
7.82
6.70
5.58
5.58
5.58
4.86
3.35
2.23
13.40
18
22.34
22.34
44.68
55.84
8.173.27
75.83
86.04
53.15
40
33.51
32.08
27.71
25.08
24.64
24.64
24.64
24.64
24.64
24.64
24
23.92
23.92
23.48
23.48
23.33
23.33
21.29
17.50
17.50
11.17
10
291.65
893.29
384.11
133.99
90
84.86
50.43
26.80
26.80
8.93
22.97
17.87
15.30
13.40
9.83
8.93
26.80
35.73
89.33
8.173.27
8.173.27
8.17
8.17
8.17
8.17
7.70
3.79
3.27
3.27
2.36
125
42.12
38.29
20
80
61.27
11.49
15.32
30.6411.49
25
22.98
22.98
22.98
22.98
22.98
22.98
22.98
22.98
22.98
22.98
13.79
11.49
11.49
11.49
11.49
11.49
11.49
85.75
19.72
16.46
16.29
14.58
12.68
12.68
8.57
8.57
9
78.18
Current or impending policy regulations are sending stronger price signals to a number of markets throughout the world. This year’s data shows that companies appear to be responding by pegging their internal carbon prices to policy price signals.¹
Internal carbon prices used by companies in Canada resemble the price levels set by Provincial policies operating in Québec, Alberta and British Columbia. Québec has a GHG cap and trade system in place with the current price at around $12.60. Alberta’s carbon tax is around $15.30. British Colombia’s tax is $23. A national carbon pricing system is also under consideration.²
In South Africa, nearly all disclosed corporate carbon prices follow the range of prices ($3.27–$8.17) released by the National Treasury Department in respect of the South African carbon tax.
In the Republic of Korea, companies are pegging their prices to the prevailing market price within their newly established ETS. A range of prices may emerge in the future, as some companies increase their internal prices, particularly those with operations in other countries or those embedding carbon risk more deeply into their business strategy.
While a clear pattern is not evident in the prices that Japanese companies disclose, many companies report that their internal pricing practice is influenced by the Tokyo ETS.
A vast range of prices are used by companies in Europe, coinciding with the variety of policies that operate in the region, as well as a history of active engagement by companies on climate. Currently, 12 carbon tax systems, some of which have been in place since 1990, sit alongside the EU and Swiss emission trading systems, the UK’s carbon price
floor, and the French government’s plans to introduce a price floor for the electricity sector. Notably, UK company prices are trending at the level of the UK’s price floor, around $25.70 in 2016.
There is little consistency in the pricing process and price levels among U.S. companies. Prices start as low as >$1 and range as high as $150. Companies reported references to the EU ETS and Californian Cap and Trade system, either because they fall under their compliance, or in order to model potential future pricing scenarios in the absence of a federal carbon price. Others internalize implicit carbon prices that already affect their business—including energy price forecasts, allowance prices, costs of energy efficiency standards, all manner of environmental and related compliance costs, and even costs that might result from the U.S. Clean Power Plan. This year, two U.S. companies, Ameren Corporation and Covanta Energy Corporation, disclosed internalizing the U.S. Environmental Protection Agency’s social cost of carbon. {
Disclosed prices by regionInternalizing policy prices
1 Corporate prices have been converted to USD/metric ton, based on an annual average exchange rate from June 2015–June 2016. Some companies disclose a range, or multiple, internal carbon prices—differentiated by varying colors in the bar graphs above.
2 Carbon pricing policy information source: World Bank and Ecofys, 2016. “Carbon Pricing Watch 2016” (May), Washington, DC. (policy prices in USD based on April 1, 2016 exchange rate)

15
EU ETS$5.92
South AfricanCarbon Tax
$8.17
UK carbon price floor$25.71
South African CarbonTax (phase-in price)
$3.27
Tokyo and Saitama ETS$31.19
Korean ETS$16.12
$Quebec CAT $12.60
BC carbon tax $22.99
Alberta SGER $15.33
$
$
European UnionCarbon prices by company, $USD/metric ton
South AfricaCarbon prices by company, $USD/metric ton
United KingdomCarbon prices by company, $USD/metric ton
CanadaCarbon prices by company, $USD/metric ton
Republic of KoreaCarbon prices by company, $USD/metric ton
JapanCarbon prices by company, $USD/metric ton
$
$
$
150.78
83.77
39.09 50.26 80.4223.34
69.25
5.58 67.01
64
55.84
54.03
50
22.34
40
39.09
35.74
33.51
33.51
33.51
30
27.92
27.92
25
22.34
22.34
12.29
7.82
15
6.70
12.29
12.29
11.49
11.17
11.17
11.17
10.05
9.42
8.94
8.94
8.23
8
7.82
7.82
7.82
7.82
6.70
5.58
5.58
5.58
4.86
3.35
2.23
13.40
18
22.34
22.34
44.68
55.84
8.173.27
75.83
86.04
53.15
40
33.51
32.08
27.71
25.08
24.64
24.64
24.64
24.64
24.64
24.64
24
23.92
23.92
23.48
23.48
23.33
23.33
21.29
17.50
17.50
11.17
10
291.65
893.29
384.11
133.99
90
84.86
50.43
26.80
26.80
8.93
22.97
17.87
15.30
13.40
9.83
8.93
26.80
35.73
89.33
8.173.27
8.173.27
8.17
8.17
8.17
8.17
7.70
3.79
3.27
3.27
2.36
125
42.12
38.29
20
80
61.27
11.49
15.32
30.6411.49
25
22.98
22.98
22.98
22.98
22.98
22.98
22.98
22.98
22.98
22.98
13.79
11.49
11.49
11.49
11.49
11.49
11.49
85.75
19.72
16.46
16.29
14.58
12.68
12.68
8.57
8.57
9
78.18

16
This section of the report discusses the trend of 147 companies that are maturing in their use of an internal price on carbon.
These companies are using an internal carbon price to implement or achieve an established climate target, allowing them to further embed climate change considerations into business decisions. A series of case studies examine the experience of seven companies that use this approach. Each study focuses on the company’s overall approach to managing climate change risks and opportunities, and the rationale for adopting a price on carbon. They examine how the price is embedded into business strategy to achieve implement or achieve climate targets. The companies covered are headquartered in Europe, Japan, South Africa, and Turkey and come from a range of sectors. Almost all of the companies have committed to setting science based targets or disclose that they anticipate doing so in two years.
The case studies rely upon information disclosed by the companies in response to the 2016 climate change information request and further information supplied by the companies in subsequent interviews conducted by CDP.
Managing climate risks and opportunities Over 90% of disclosing companies stated in their 2016 disclosures that climate change poses an inherent risk to their business. These companies highlighted a variety of risks, driven by changes in the physical climate or regulations concerning climate, that have ‘the potential to generate a substantive change in business operations, revenue, or expenditure’. The majority of these companies no longer simply track climate-related risks but also include them in risk and opportunity analyses, thereby integrating climate change considerations into overall business strategies.
Companies seeking to operationalize ‘climate-conscious’ business strategies typically turn to ‘climate targets’ that lower risks by cutting emissions and their associated costs. Climate targets can encompass GHG emissions reductions, energy efficiency, and renewable energy procurement goals—among others. Some targets are expressed as aspirations to achieve carbon neutrality or to gain a competitive edge in the market for eco-friendly products and services. Smartly designed climate targets can reduce the burden associated with existing or future climate change regulations.
A growing number of companies, 147, have disclosed that they are adopting an internal price on carbon in the implementation of ‘climate-conscious’ business strategies. These companies describe internal carbon pricing as a key driver in the execution of ‘climate targets’—specifically pointing to the realized or anticipated impacts on investment
decisions that would lead to emissions reductions. Examples of this approach are provided in the case studies that follow.
Companies identify internal carbon pricing as an effective tool in a number of ways, including:
1. It provides an incentive or added reason to reallocate resources toward low-carbon activities—such as energy efficiency improvements, emissions reductions, and renewable energy procurement—over high-carbon activities. Applying a carbon cost to such investment decisions supports a better return on investment, thus creating a clear business case for their execution.
Case study examples (p. 20–26): Arçelik, Harmony Gold Mining, Nissan, Novartis, Royal DSM, Saint-Gobain, SUEZ. Other examples: Sky Plc and Cummins Inc.
Sky Plc Consumer Discretionary, United Kingdom
“[Sky uses] an internal price of carbon to help us make decisions on the investments we make in energy efficiency and on site renewable energy in addition to standard simple pay back and Investment Rates of Returns (IRR)…to help build a more robust business case in investments made, particularly for the case of on-site renewable energy when simple pay backs are typically longer than other business investments made…
“Examples of where this has been used is in the investment of on-site renewables at our site in Osterley, West London, where we have invested in excess of £7m in a Combined Cooling and Heating Power Plant (CCHP), 100KW wind turbine and PVs. Typically simple pay backs for these on site renewables would be between 6–11 years but when the cost the internal price of carbon is included in the review including CRC costs, FIT tariffs and EU Emissions Trading then the investment is a more positive one over the long term.”
Cummins Inc. Industrials, USA
“An internal price of carbon is used when evaluating funding of energy efficiency projects … Cummins is still at the stage of its energy efficiency projects where the price of carbon is usually not a determining factor in whether a project is funded. There are instances, however, when a project may not have a high return on investment or meet other financial hurdles but does avoid a significant amount of GHGs, so project may then get funded in that way.”
A maturing practiceEmbedding an internal price on carbon into business strategy
Over
90%
of disclosing companies stated that climate change poses an inherent risk to their business

17
2. It is used in determining the business case for R&D investments necessary for new low-carbon products and services; a priority for companies seeking to cut emissions from the manufacturing process and attract new business from customers interested in low-carbon, low-cost solutions.
Case study examples: Saint-Gobain, SUEZ. Other examples: Anglo American Platinum, Vina Concha y Toro SA.
Anglo American Platinum Materials, South Africa
“Amplats employs an internal price of carbon for:• Planning and justifying climate-related
investments;• Stimulating research and development of PGM
related low carbon technologies such as fuel cells;
• Identifying and prioritising climate change-related risks and opportunities;
• Incentivising efficiencies across the business;• Buffering the impact of South Africa’s proposed
carbon tax;• Gaining a long term competitive advantage; and• Engaging with suppliers on climate change
strategies and greenhouse gas reduction measures.”
Vina Concha y Toro SA Consumer Staples, Chile
“…Viña Concha y Toro views this internal price of carbon as a key strategic element, a practice that will make all of our business units aware of the impact we have and how we can help fight Climate Change. We also hope to help them understand how Climate Change can affect our own business. Naturally, we expect this internal carbon price to stimulate innovation in our products and processes, driving competition and stimulating investment in low carbon technologies. Internally, this carbon pricing works as a fund….”
3. Assigning a financial value to both emit-ted and avoided carbon emissions helps reveal hidden risks and opportunities in a company’s own operations and in its supply chain. This is particularly relevant for companies navigating an array of carbon pricing regulations because their operations span multiple countries.
Case study examples: Arçelik, Harmony Gold Mining, Nissan, Novartis, Royal DSM, Saint-Gobain, SUEZ. Other examples: Autodesk Inc., Kering.
Autodesk, Inc. Information Technology, USA
“Autodesk believes in taking bold action on climate change. Setting an internal price on carbon will not only enable better decision-making by aligning our own business and investments with a low-carbon economy, but will also help us better understand and support our global customers to reimagine, reinvent, and recreate the built world for everyone…”
Kering Consumer Discretionary, France
“Since 2012, Kering has been working on the creation and deployment of its Environmental Profit and Loss account (EP&L), the stated objective given in 2012 being to cover 100% of the Group’s activities by 2015 … The EP&L is an innovative tool designed to assess impacts and reliance on natural resources. … It makes it possible to attribute a monetary value to the Company’s environmental impacts throughout its supply chain. The EP&L is covering 6 indicators among which is GHG emissions … Carbon pricing and monetization of other key environmental indicators led the Group to explore new sourcing strategies for key raw materials…” {
18
Effectivecarbon riskmanagement
New low-carbonproducts andservicesEmissions
reductions
Implementation tool:Carbon price
Energy efficiency and renewable energy investments
Objective:Climate-aligned
business strategy
Business strategy delivering climate outcomes
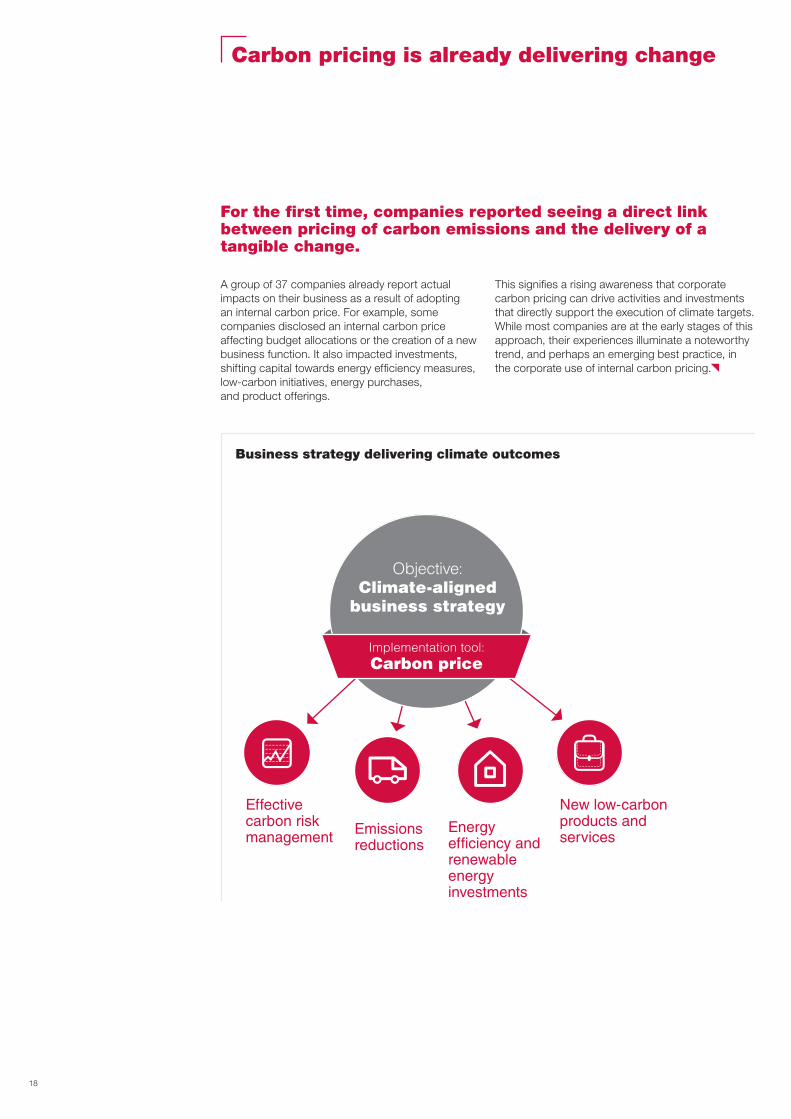
Carbon pricing is already delivering change
For the first time, companies reported seeing a direct link between pricing of carbon emissions and the delivery of a tangible change.
A group of 37 companies already report actual impacts on their business as a result of adopting an internal carbon price. For example, some companies disclosed an internal carbon price affecting budget allocations or the creation of a new business function. It also impacted investments, shifting capital towards energy efficiency measures, low-carbon initiatives, energy purchases, and product offerings.
This signifies a rising awareness that corporate carbon pricing can drive activities and investments that directly support the execution of climate targets. While most companies are at the early stages of this approach, their experiences illuminate a noteworthy trend, and perhaps an emerging best practice, in the corporate use of internal carbon pricing.{

19
EXAMPLES
ENGIE Utilities, France
“The Group uses internal regional carbon price sensitives to assess its investments projects…The impacts of carbon pricing scenarios on the new investment projects proposals are reviewed in light of the specific context of the host country and of its regulatory framework, and inform decision making. In 2015, the Group decided to no longer pursue new developments in coal, believing that a carbon price will steadily be established in the world’s various regions and that coal-fired power plants will be adversely affected in the future.”
Societe Generale Financials, France
“...the Group is one of the first banks to have implemented in 2011 an “Internal Carbon Tax,” currently amounting to EUR 10 per ton emitted. The proceeds raised in the business lines are used to fund internal environmental efficiency initiatives. The goal of this scheme is to show that environmental measures are also opportunities to create value and innovation for the bank…Over the three years of this scheme’s existence, all 119 winning initiatives, involving building, IT, paper, transport or waste (since 2015), enabled annual recurring savings of an average of EUR 13 million on overheads, an average of 4,700 tonnes per year of CO² and an average of 30 GWh of energy savings.”
Microsoft Corporation Information Technology, USA
“The carbon fee affects investment decisions by providing both an incentive and the financial justification for internal efficiency initiatives … In FY15, the carbon fee fund was used to support investments in:
a. 14 internal efficiency initiatives that otherwise likely would not have taken place, for a project lifetime reduction of $596,395 and 8.896 mtCO²e.
b. 2,699,210 MWh in green power in the United States, earning Microsoft the U.S. Environmental Protection Agency (EPA)’s Green Power Partnership as the number two purchaser in the United States.
c. 18 carbon offset projects in 16 countries to reduce nearly 550,000 mtCO²e and support the development of a low-carbon economy in emerging nations.”
Bouygues Industrials, France
“The internal price of carbon is only concerning Bouygues Batiment IDF’s scope. This carbon fund is a Bouygues Construction project which resulted in the creation of a guide for eco-friendly alternatives. In 2015, thanks to the carbon fund, which was being tested, two construction projects were subsidised in which low carbon eco-friendly alternatives could be used. One of the projects used low-carbon concrete and the other an alternative energy production method based on a heat pump drawing energy from grey water.”
TD Bank Group Financials, Canada
“…The learnings from our carbon neutrality and internal price on carbon have also driven an increased commitment to developing a range of low-carbon financial products including the financing for residential renewables and energy efficiency projects, insurance for hybrid and electric vehicles, and the issuance of a $500 million green bond.”

20
Novartis reports that climate change could result in increased prices for key inputs such as water and energy, and extreme weather events could significantly impact supply chains or damage facilities. They are also at risk of increasing costs linked to the carbon emissions associated with their manufacturing facilities. Recognizing this, Novartis discloses that it has decided to embed climate change into its corporate strategy and has set itself the targets of reducing combined Scope 1 and Scope 2 GHG emissions by 30% by 2020, and 50% by 2030 from its 2010 baseline. These targets have been set “based on the belief that governmental schemes can only be successful if private sector companies actively contribute with targets for their own global operations and products.”
Novartis is included in the EU ETS with several production sites located in EU member states. The company notes that so far this has not driven up operating costs and Novartis has been able to sell surplus allowances thanks to the successful energy efficiency programs implemented at these sites. Yet they highlight that this is likely to change as the system undergoes reform and as other countries follow suit.
The company discloses that they “support the true cost of carbon being embedded within the economy,” whether through carbon taxes or cap and trade schemes, as a tool “that will be effective in mitigating climate change.” For this reason and to help achieve their climate goals, Novartis decided in 2015 to set an internal carbon price of
$100 USD/metric ton of CO²e. They report that they based the amount on the World Bank's ‘cost of climate change to society’ calculations.
Using its carbon price—similar prices were evaluated for other environmental impacts—Novartis quantified its entire environmental footprint in monetary terms, when participating in a pilot application of the recently launched Natural Capital Protocol. Through this exercise, Novartis was able to estimate its global environmental Profit and Loss for its own operations and for its material supply chain.
Novartis notes that they believe setting an internal price on carbon will help identify projects that can cost-effectively reduce GHG emissions, and will drive investments into areas such as energy efficiency and using renewable energy sources to power their operations. The Real Estate and Facilities Services teams will prioritize projects that will help Novartis meet its 2020 GHG emissions reduction targets, and the projects will be approved by top management. Currently, Novartis is investigating projects that could help reduce GHG emissions by up to 185,000 metric tons CO²e. A major off-site wind and several on-site solar power purchase agreement options are part of this evaluation. The company notes that an internal price on carbon is helping Novartis identify projects that reduce GHG emissions, and generate a return on investment.{
GICS SECTOR Health CareANNUAL REVENUE US $49,414,000,000¹
Emissions reduction target² Absolute target—by 2020, 30% reduction and by 2030, 50% reduction of
Scope 1 and 2 emissions from 2010 baseline.
Reported emissions (2015) Scope 1 533,736 metric tons CO²e
Scope 2 (location-based) 1,085,252 metric tons CO²e
Scope 2 (market-based) 829,375 metric tons CO²e
Baseline emissions (2010) Scope 1 617,909 metric tons CO²e
Scope 2 (location-based) 1,062,041 metric tons CO²e
Scope 2 (market-based) 962,836 metric tons CO²e
Headquarters:Basel, Switzerland
Internal price on carbon:$100 USD/metric ton
Energy efficiency &renewable energy
Emissions reductions
Case studyNovartis
1 All annual revenue in USD, 2016 disclosure year.Retrieved September 15, 2016 from Bloomberg terminal.
2 Companies may have other emissions reduction targets in addition to those listed in these studies.

21
Within its 2015–2030 climate roadmap, SUEZ announced a new business strategy that prioritizes actions that will enable the business to mitigate the causes and adapt to the consequences of climate disruption. SUEZ has set a target of 30% reduction of Scope 1 and Scope 2 combined emissions by 2030, using its 2014 emissions as a baseline, as well as an objective to reach 60 million metric tons of CO² avoided for its customers on the 2015–2020 period through waste and wastewater recovery.
The company notes that a central component of its environmental commitments is support for a reliable external price on carbon, which it says will “reinforce the market of recycled products and accelerate the development of waste treatment activities in developing countries”. Additionally, SUEZ has adopted an internal price on carbon this year.
SUEZ reports that it will use a price on carbon in three ways. One price will apply to capital investment decisions to “bring GHG emissions performance as a concrete criterion in project investments, increasing long-term profitability of low-carbon solutions.” Another (significantly
higher) price will help orient research and development towards less carbon-intensive technologies. A third approach will consist of systematically measuring the performance of the company’s low-carbon products and services and calculating the associated “carbon goodwill,” in order to demonstrate their benefits compared to alternatives. This way, SUEZ believes that it can incentivize clients to choose low-carbon options by revealing cost savings and GHG emissions avoided or reduced and thus help them to achieve their mandatory or voluntary carbon commitments.
While at the group-level the internal price on carbon is a new innovation, some parts of SUEZ’s businesses have employed this tool for some time. SUEZ notes that in the case of Bristol Water, it has helped the company to navigate the United Kingdom's Carbon Reduction Commitment, which applies a carbon tax of £16 per metric ton CO²e. Using an internal carbon price has helped Bristol Water to manage and reduce its carbon tax bill by prioritizing investments that reduce energy use. SUEZ says that the price is also linked to Bristol Water’s goal to reduce its emissions by 75% by 2040. To meet this target, the company uses a shadow price of carbon to drive investments in low-carbon technologies. For example, it led to the decision to install new water pumps that offer superior energy performance. The price improved the return on investment that could be realized as a result of making the investment. {
GICS SECTOR UtilitiesANNUAL REVENUE US $16,799,980,000
Emissions reduction target Absolute target—by 2030, 30% reduction of Scope 1 and 2 emissions
from 2014 baseline.
Reported emissions (2015) Scope 1 6,364,728 metric tons CO²e
Scope 2 1,790,762 metric tons CO²e
Baseline emissions (2014) Scope 1 6,086,997 metric tons CO²e
Scope 2 1,796,765 metric tons CO²e
Headquarters:La Défense, France
Energy efficiency &renewable energy
Low-carbon products
Emissions reductions
Case studySUEZ
From now on, SUEZ committed to take into account carbon pricing signals within its investment decisions and its research and development programs to accelerate the implementation of circular economy, the only model of growth which can structurally reduce greenhouse gases emissions.
Jean-Louis Chaussade, CEO

22
Saint-Gobain, a French multinational building materials manufacturer, discloses that an internal price on carbon will be used as a decision support tool to prioritize and manage CO² action plans. The company discloses that its CO² approach features a set of group-wide climate goals, including its current intensity target of cutting 20% of GHG emissions by 2025 from a 2010 baseline, and a new set of science-based emissions reduction targets that are currently under development.
Introduced in early 2016, Saint-Gobain highlights that it expects an internal price on carbon will impact its CO² reduction targets through the use of it in:
• Measuring and incorporating the current and anticipated future impacts of regulatory carbon prices into the company’s risk management strategy;
• Identifying growth opportunities in low-carbon innovations, and redirecting capital expenditure and R&D in line with new opportunities; and
• Managing priority actions to reduce CO² emissions.
Saint-Gobain discloses that it will use two prices to denote the two ways in which a price on carbon will be applied in the business.
One carbon price will be applied to capital expenditure projects above a certain threshold, to energy source investments, and to energy-related investments at the company’s current sites that consume more than 10GWh annually. In its disclosure to CDP, Saint-Gobain reports that a carbon price will be used in the strategy and plans of its plants that are included in the EU ETS—in order to incentivize investment in energy efficiency equipment so as to manage a worst case scenario that, after 2020, it no longer receives free allowances under the EU ETS, which would lead to higher operational costs.
Another carbon price, markedly higher, will be used to drive investments in R&D that will accelerate the delivery of “breakthrough” technologies. Saint-Gobain reports that the use of a price on carbon in this manner will be instrumental in its business plan to increase market share in energy-saving products for existing-building and new-building markets.
Saint-Gobain reports that its internal price on carbon will be applied to all corporate activities across 66 countries (many of which are not presently subject to regulatory pricing) and will impact the company’s scope 1, 2 and 3 emissions. {
GICS SECTOR IndustrialsANNUAL REVENUE US $43,981,860,000
Emissions reduction target Intensity target—by 2025, 20% reduction of Scope 1 and 2 emissions
from 2010 baseline at iso-production.
Reported emissions (2015) Scope 1 9,528,115 metric tons CO²e
Scope 2 (location-based) 3,619,635 metric tons CO²e
Baseline emissions (2010) Scope 1 12,976,886 metric tons CO²e
Scope 2 (location-based) 4,461,638 metric tons CO²e
Case studySaint-Gobain
Headquarters:Courbevoie, France
Emissions reductions
Energy efficiency &renewable energy
Low-carbon products
Setting ambitious carbon pricing levels that are in line with Saint-Gobain’s objectives contributes to reinforce our commitment to fight for the climate.
Pierre-André de Chalendar, Chairman and CEO

23
Nissan is developing low to near-zero carbon emission motor vehicles as part of its response to the risks and opportunities presented by climate change. It discloses that its vehicle ‘the LEAF’ is the “first mass-market, pure-electric vehicle launched globally, and is now the best-selling EV in history.”
Nissan notes that its approach is supported by customers, who have told this global auto maker that fuel consumption and vehicle CO² emissions are priority issues. This long term business strategy is reflected in a goal to reduce new-vehicle GHG emissions by 90% by 2050 compared to 2000 levels. Across all aspects of the company’s operations in over 20 countries, Nissan discloses an absolute target of a 24% reduction in scopes 1, 2 and 3 GHG emissions by 2050.
Nissan’s strategy is also evident in the investments it has made in low- to zero-carbon technologies, such as vehicle electrification and lithium-ion batteries. Seventy percent of Nissan’s annual research and engineering budget will be allocated to environmental technologies during the Nissan Green Program, which is a six-year program
running from 2011 to 2016. This is equivalent to 300 billion JPY annually for 6 years. While investing in electric vehicles involves considerable costs, Nissan sees the potential for big returns on investment in the future—at the same time, they are supporting the achievement of what they call a ‘zero emission society.’
An internal price on carbon is used in the capital allocation process:
“GHG emissions reduction is one of the most crucial parameters in Nissan’s investment plan selection process. Proposals are compared and selected based on carbon emissions reduction per unit cost of investment, as well as the energy reduction potential, measured with an internal price of carbon.”
While Nissan did not disclose its price level, the company did share that the process involved setting a GHG reduction target first, with the price level linked to the costs and returns that investments undertaken in order to meet the target. {
GICS SECTOR Consumer DiscretionaryANNUAL REVENUE US $101,400,000,000
Emissions reduction target Absolute target—by 2050, 24% reduction of Scope 1, 2 and 3 emissions
from 2000 baseline.
Product target—by 2050, new-vehicle emissions reduction by 90% from
2000 baseline.
Reported emissions (2015) Scope 1 928,236 metric tons CO²e
Scope 2 (location-based) 3,111,678 metric tons CO²e
Scope 2 (market-based) 2,547,951 metric tons CO²e
Baseline emissions (2000) Scope 1+2 (market-based) +3 (downstream)
135,000,000 metric tons CO²e
Headquarters:Yokohama, Japan
Emissions reductions
Energy efficiency
Case studyNissan Motor Co., Limited

24
Arçelik discloses that it sees climate change as both a key risk and opportunity for its business and has embedded climate change into the heart of its strategy. The company highlights that they focus on having a product line of household appliances that are as energy efficient as possible. It reports that it has set a ‘net zero emissions’ target for its domestic production plants by 2040, with an interim goal of a 60% reduction by 2020. Additionally, Arçelik notes that it anticipates setting a ‘science-based target’ in the next two years. The company reports that it aims to meet its targets through projects in energy efficiency and energy generated from renewable sources, as well as through carbon offsets to meet its 2040 goal. The company discloses that it plans to purchase 100% renewable electricity by 2020.
Despite there not being any immediate risks of a carbon price in Turkey, Arçelik has decided to use an internal price to help it achieve its aims. The company reports that it will introduce a ‘carbon fee’ based on the GHG emissions of each of its departments. Each corporate division will be required to contribute a sum of money to a company-wide carbon fund, their contribution will be proportional to what each is responsible for emitting. Using the revenue that the carbon fee generates, the fund will “invest in carbon reduction projects, such as energy efficiency, renewable energy, and similar environmental initiatives”.
Arçelik did not disclose the value it uses to price carbon. The company’s Sustainability Committee, headed by Arçelik’s Chief Financial Officer, is ultimately responsible for the coordination of the carbon price and fund.
Arçelik’s reported that its scope 1 and 2 emissions dropped 38% in 2014 from 2013 levels. Arçelik invested in several energy efficiency projects that cut 3,812 metric tons CO²e in 2014, accounting for about 7% of reductions achieved that year. The remaining 93% was due to the purchase of electricity generated by renewable energy sources. In 2014, 78% of the electricity Arçelik used came from renewable energy sources—compared with 28% in 2013 and 1% in 2012. It has done this through purchasing from renewable energy suppliers and is now considering possible renewable energy production investments. {
GICS SECTOR Consumer DiscretionaryANNUAL REVENUE US $5,225,270,000
Emissions reduction target Absolute target—by 2020, 60% reduction and by 2040, 100% reduction
of Scope 1 and 2 emissions from 2010 baseline.
Reported emissions (2014) Scope 1 64,888 metric tons CO²e
Scope 2 22,091 metric tons CO²e
Baseline emissions (2010) Scope 1 77,038 metric tons CO²e
Scope 2 80,687 metric tons CO²e
Headquarters:Istanbul, Turkey
Energy efficiency &renewable energy
Emissions reductions
Case studyArçelik A.S.

25
Harmony is a gold mining and exploration company with operations in South Africa and Papua New Guinea. The company highlights that it aims to set a precedent for the South African mining industry in renewable energy investment and GHG emissions reduction and plans to obtain at least 50% of its future electricity from renewable sources. It discloses that it anticipates setting a science based target within the next two years.
Harmony reports that it uses an internal price on carbon based on the carbon tax due to be implemented in South Africa in 2017. According to its disclosure, it will not be exposed to the tax directly until 2020, but has assumed an internal price into the planning of its operations from 2016 nevertheless. Internalizing a price on carbon has shown the company that some of its “more marginal assets will no longer be profitable” in the future once carbon taxation begins. It notes that this is one of the reasons it has decided to shift its business strategy to reducing its emissions and energy intensive assets.
The company highlights that it uses the price to:
• “Understand the influence of carbon pricing on the economies and viability of Harmony’s business
• Adapt to the effects of a changing climate
• Drive investment in emission reduction projects
• Reduce risks and identify opportunities
• Ensure the long term sustainability of the business in the green economy
• Position itself for the potential impacts of climate change”
Additionally, Harmony discloses that the effects of climate change pose potential risks for Harmony's operations, particularly in terms of potential water shortages. This has also influenced the company's strategy in this area, leading to investments and technical changes that maximize recovery of water for re-use in some of it major mines, for example. In 2015, Harmony invested in 12 energy and water management projects, and has 19 ongoing projects that it reports will help save 64,040 MWh per year. It further reports that the 17 energy efficiency projects planned for 2016 will save 82,301 MWh per year. It plans to utilize the internal price on carbon to help create the investment case for these projects and will be able to report on the success of this strategy in future disclosures. {
GICS SECTOR Materials ANNUAL REVENUE US $1,272,390,000
Emissions reduction target Absolute targets—by 2025, 22% reduction of Scope 2 emissions from a
2015 baseline. By 2045, 90% reduction of Scope 1 and 2 emissions from
2015 baseline.
Reported emissions (2015) Scope 1 66,902 metric tons CO²e
Scope 2 (location-based) 2,686,401 metric tons CO²e
Baseline emissions (2015) As above
Headquarters:Randfontein,Gauteng,South Africa
Emissions reductions
Energy efficiency
Case studyHarmony Gold Mining Company Limited

26
Royal DSM, a Dutch multinational company active in health, nutrition and materials, reports that it has “recognized climate change as a societal megatrend for over a decade.” Reflecting this, it highlights that it has embedded in the core of its business strategy the objectives of reducing its own carbon footprint and creating an enabling environment for its low-carbon products. In 2016, Royal DSM reported a new target to improve its GHG efficiency by 45% by 2025 from 2008 levels.
Royal DSM uses an internal price of carbon with a value of €50/metric ton, exceeding the price in the EU ETS, which it trades in. The company reported that it set this price for use in the valuation of large investment projects so the financial impact of GHG emissions could be accounted for:
“In order to encourage investments in low-carbon or carbon free technologies, the Executive Committee decided to include the financial impact of GHG emissions (scopes 1 and 2) through internal carbon pricing in the valuations of large investment projects from 2016 onwards. This also serves to prepare Royal DSM for the financial impact of an external carbon price, which is one of the elements of the comprehensive climate deal that was struck in Paris in December 2015 during COP21. For each large investment proposal, two business cases have to be presented. One without and one with an internal carbon price of 50 €/t CO²e.”
The company notes that in the early phase of using the price, it was added to projects already underway to reveal how decisions could have been impacted by an internal price. Since the full implementation of this corporate directive in 2016, Royal DSM has observed the advantage of being able to embed sustainability considerations more effectively at an early point in the design stage of projects, when fundamental decisions that positively contribute to the company’s climate change objectives can be readily made. The company’s preliminary observation is that the internal carbon price is being used during conceptual engineering to evaluate and select different engineering options. In coming years, Royal DSM discloses that it will undertake an evaluation of the impact of its internal price on carbon on the company’s low-carbon investment decisions, and its climate change and business objectives. {
GICS SECTOR Materials ANNUAL REVENUE US $8,571,490,000
Emissions reduction target GHG efficiency target—by 2025, 45% reduction of Scope 1 and 2
emissions from 2008 baseline.
Reported emissions (2015) Scope 1 608,762 metric tons CO²e
Scope 2 458,643 metric tons CO²e
Baseline emissions (2008) Scope 1 3,218,000 metric tons CO²e
Scope 2 1,076,000 metric tons CO²e
Headquarters:Heerlen,Netherlands
Internal price on carbon:€50/metric ton
Emissions reductions
Case studyRoyal DSM
The main benefit is to embed the consideration of a price on carbon into the general conversation in a very systematic way within the company; that it becomes a part of our language in the same way we would talk about any other embedded costs within our projects.
Geraldine Matchett, Chief Financial Officer

Appendix
CDP Climate Change Questionnaire Guidance: Effectively answering the internal carbon pricing question
Question CC2.2c Does your company use an internal price on carbon?
Yes No, but we anticipate doing so in the next 2 years
(this choice is for companies that are planning to establish and implement an internal carbon price)
Question CC2.2d Please provide details and examples of how your company uses an internal price on carbon
Please respond using the text box provided, where possible detailing
• Scope that the emissions pertain to (i.e. Scope 1, Scope 2 and/or Scope 3)
• Type of internal carbon pricing • Rationale for employing a price • Actual price(s) used and variance (e.g. by time or region, or by the way
it is used across the business or in specific business units or corporate divisions)
• Process to determine price(s) and business division responsible • Examples of how carbon pricing has affected your business (e.g.
business strategy, risk assessment or evaluation, emissions reduction, investment decisions)
• Challenges with this process
No, and we do not currently anticipate doing so in the next 2 years

28
AfricaCarbon price disclosure by GICS sector
Companies currently using an internal price on carbon
Company Country Price (US$)² Impact³ Target4
Consumer Staples
Illovo Sugar Ltd South Africa
Pick 'n Pay Stores Ltd South Africa 8.17
Tiger Brands South Africa 8.17
Energy Exxaro Resources Ltd South Africa 8.17
Sasol Limited South Africa
Financials Barclays Africa South Africa n
Nedbank Limited South Africa n
Redefine Properties Ltd South Africa 8.17
Health Care Netcare Limited South Africa
Industrials Group Five Ltd South Africa 3.27
Murray & Roberts Holdings Limited South Africa
Transnet South Africa n
Materials Anglo American Platinum South Africa 3.27–8.17 n n
AngloGold Ashanti South Africa 7.70
Arcelor Mittal South Africa Ltd South Africa
Gold Fields Limited South Africa 3.79; 5 n
Harmony Gold Mining Co Ltd South Africa 3.27 n n
Kumba Iron Ore South Africa 3.27–8.17
Sibanye Gold Ltd South Africa 2.36
Telecom. Services
MTN Group South Africa
Companies that anticipate using an internal price on carbon in the next two years
Consumer DiscretionaryImperial Holdings, South Africa
Woolworths Holdings Ltd, South Africa
Consumer StaplesSesic, Egypt
Golden Sugar Company Ltd, Nigeria
RCL Foods Ltd, South Africa
Tongaat Hulett Ltd, South Africa
FinancialsEmira Property Fund, South Africa
Liberty Holdings Ltd (incorporating Liberty
Life Group Ltd), South Africa
Standard Bank Group, South Africa
Health CareMediclinic International, South Africa
IndustrialsAveng Ltd, South Africa
Basil Read, South Africa
Grindrod Ltd, South Africa
Reunert, South Africa
MaterialsAfrican Rainbow Minerals, South Africa
Neopak, South Africa
Northam Platinum Ltd, South Africa
Sappi, South Africa
Telecommunication ServicesTelkom SA Limited, South Africa
Vodacom Group, South Africa
21companies in Africa are pricing carbon now.¹
1 One company submitted private responses and is not listed in the appendix.
2 All prices have been converted to USD/metric ton, based on an annual average exchange rate from June 2015–June 2016. Some companies disclose a range of prices (ex: 10-50), or multiple (ex: 10; 50) internal carbon prices.
3 A company is tagged for impact if they dis-closed a tangible change in their business practice as a result of applying an internal carbon price
4 A company is tagged for target if they disclose using an internal carbon price to execute a climate-related objective.
Currency conversion information
Currency Exchange rate (to USD)
AUD 1.36
BRL 3.55
CAD 1.31
CHF 0.97
CNY 6.49
EUR 0.90
GBP 0.69
HKD 7.76
HUF 280.13
INR 66.55
JPY 111.95
KRW 1166.20
MXN 17.86
NOK 8.33
RUB 65.76
THB 35.26
TRY 2.90
TWD 32.35
USD 1.00
ZAR 14.68
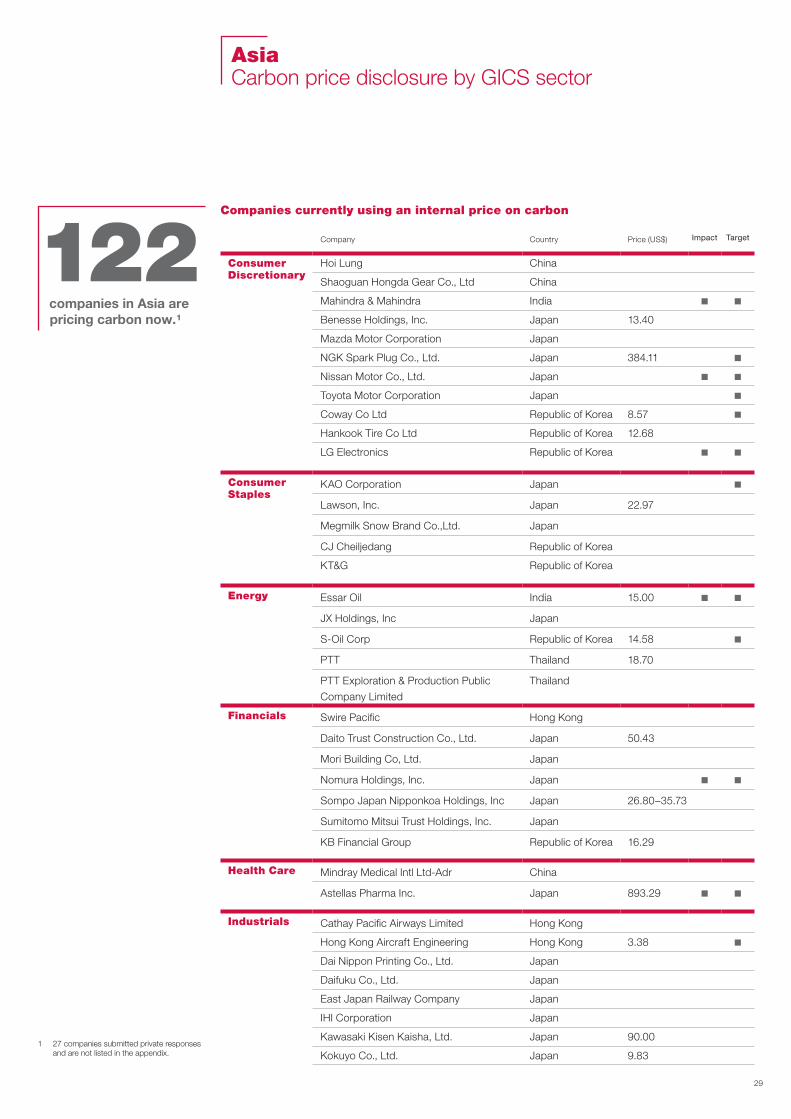
29
AsiaCarbon price disclosure by GICS sector
Companies currently using an internal price on carbon
Company Country Price (US$) Impact Target
Consumer Discretionary
Hoi Lung China
Shaoguan Hongda Gear Co., Ltd China
Mahindra & Mahindra India n n
Benesse Holdings, Inc. Japan 13.40
Mazda Motor Corporation Japan
NGK Spark Plug Co., Ltd. Japan 384.11 n
Nissan Motor Co., Ltd. Japan n n
Toyota Motor Corporation Japan n
Coway Co Ltd Republic of Korea 8.57 n
Hankook Tire Co Ltd Republic of Korea 12.68
LG Electronics Republic of Korea n n
Consumer Staples
KAO Corporation Japan n
Lawson, Inc. Japan 22.97
Megmilk Snow Brand Co.,Ltd. Japan
CJ Cheiljedang Republic of Korea
KT&G Republic of Korea
Energy Essar Oil India 15.00 n n
JX Holdings, Inc Japan
S-Oil Corp Republic of Korea 14.58 n
PTT Thailand 18.70
PTT Exploration & Production Public
Company Limited
Thailand
Financials Swire Pacific Hong Kong
Daito Trust Construction Co., Ltd. Japan 50.43
Mori Building Co, Ltd. Japan
Nomura Holdings, Inc. Japan n n
Sompo Japan Nipponkoa Holdings, Inc Japan 26.80–35.73
Sumitomo Mitsui Trust Holdings, Inc. Japan
KB Financial Group Republic of Korea 16.29
Health Care Mindray Medical Intl Ltd-Adr China
Astellas Pharma Inc. Japan 893.29 n n
Industrials Cathay Pacific Airways Limited Hong Kong
Hong Kong Aircraft Engineering Hong Kong 3.38 n
Dai Nippon Printing Co., Ltd. Japan
Daifuku Co., Ltd. Japan
East Japan Railway Company Japan
IHI Corporation Japan
Kawasaki Kisen Kaisha, Ltd. Japan 90.00
Kokuyo Co., Ltd. Japan 9.83
122companies in Asia are pricing carbon now.¹
1 27 companies submitted private responses and are not listed in the appendix.
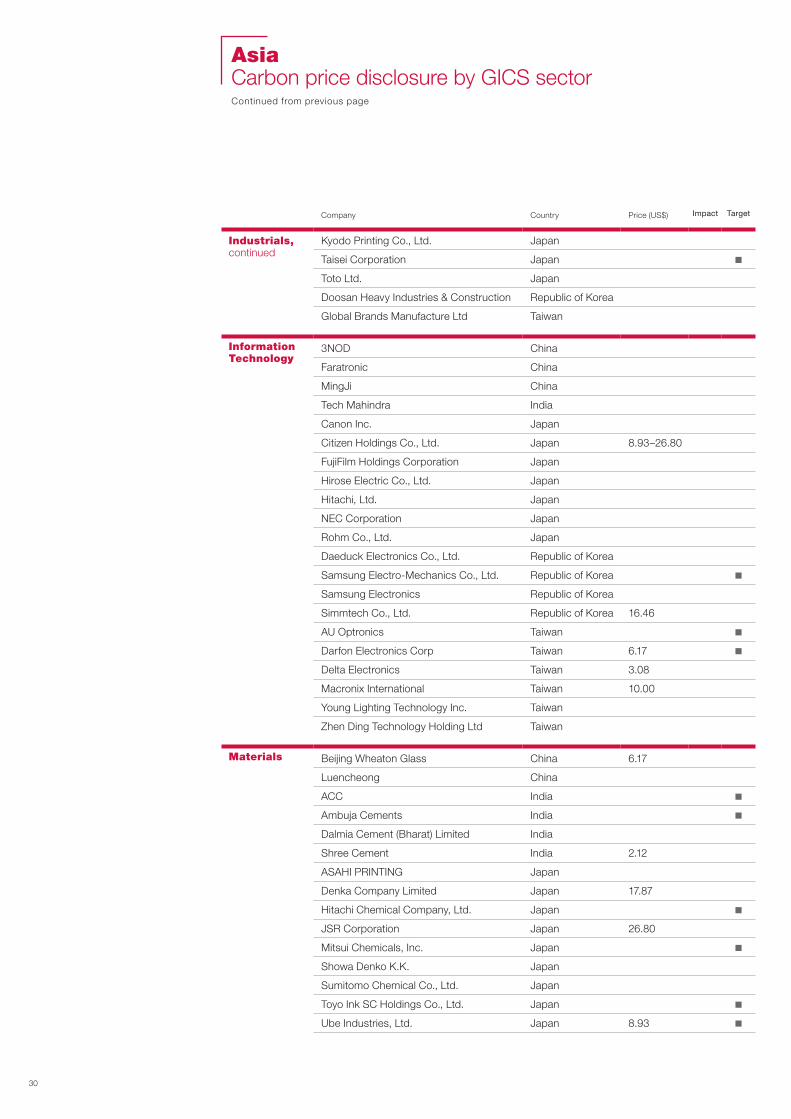
30
Company Country Price (US$) Impact Target
Industrials, continued
Kyodo Printing Co., Ltd. Japan
Taisei Corporation Japan n
Toto Ltd. Japan
Doosan Heavy Industries & Construction Republic of Korea
Global Brands Manufacture Ltd Taiwan
Information Technology
3NOD China
Faratronic China
MingJi China
Tech Mahindra India
Canon Inc. Japan
Citizen Holdings Co., Ltd. Japan 8.93–26.80
FujiFilm Holdings Corporation Japan
Hirose Electric Co., Ltd. Japan
Hitachi, Ltd. Japan
NEC Corporation Japan
Rohm Co., Ltd. Japan
Daeduck Electronics Co., Ltd. Republic of Korea
Samsung Electro-Mechanics Co., Ltd. Republic of Korea n
Samsung Electronics Republic of Korea
Simmtech Co., Ltd. Republic of Korea 16.46
AU Optronics Taiwan n
Darfon Electronics Corp Taiwan 6.17 n
Delta Electronics Taiwan 3.08
Macronix International Taiwan 10.00
Young Lighting Technology Inc. Taiwan
Zhen Ding Technology Holding Ltd Taiwan
Materials Beijing Wheaton Glass China 6.17
Luencheong China
ACC India n
Ambuja Cements India n
Dalmia Cement (Bharat) Limited India
Shree Cement India 2.12
ASAHI PRINTING Japan
Denka Company Limited Japan 17.87
Hitachi Chemical Company, Ltd. Japan n
JSR Corporation Japan 26.80
Mitsui Chemicals, Inc. Japan n
Showa Denko K.K. Japan
Sumitomo Chemical Co., Ltd. Japan
Toyo Ink SC Holdings Co., Ltd. Japan n
Ube Industries, Ltd. Japan 8.93 n
AsiaCarbon price disclosure by GICS sectorContinued from previous page

31
Company Country Price (US$) Impact Target
Materials, continued
Hansol Paper Co Republic of Korea 8.57
Kumho Petrochemical Republic of Korea
LG Chem Ltd Republic of Korea
Lotte Chemical Corp Republic of Korea n
Lotte Fine Chemical Republic of Korea
POSCO Republic of Korea n
Telecom. Services
KDDI Corporation Japan 84.86–89.33
NTT DOCOMO, Inc. Japan n
True Corporation Thailand 5.67
Utilities Osaka Gas Co., Ltd. Japan
The Tokyo Electric Power Company
Holdings, Inc (TEPCO)
Japan
Tokyo Gas Co., Ltd. Japan
Korea District Heating Corp. Republic of Korea
Korea East-West Power Republic of Korea 19.72
Korea Electric Power Corp Republic of Korea
Korea Gas Corp Republic of Korea 85.75
Companies that anticipate using an internal price on carbon in the next two years
Consumer DiscretionaryBestway (Hong Kong) Int, China
Guangzhou Huabao Glass Co Ltd, China
Minth Group Ltd, China
Neostra, China
Shandong Helon Polytex, China
Top Victory Electronics(Fujian) Co. Ltd, China
Westfield Outdoor, Inc., China
Yueli, China
Zinwell Corporation, China
Arvind Ltd, India
Bharat Forge, India
Tata Motors, India
Asics Corporation, Japan
Dentsu Inc., Japan
Honda Motor Company, Japan
Marui Group Co., Ltd., Japan
Nikon Corporation, Japan
Panasonic Corporation, Japan
Dong Yang Piston Co., Ltd., Republic of Korea
Ducksan co., Ltd., Republic of Korea
erae Automotive Systems Co., Ltd, Republic of Korea
Eunsung textile co,. ltd., Republic of Korea
Hansoll Textile Ltd, Republic of Korea
Hotel Shilla Co., Ltd., Republic of Korea
Korens Inc., Republic Of Korea
SL Corp, Republic of Korea
Consumer StaplesFree-Free Industrial Co, China
Ningbo Ji Ming Electric Appliance, China
Zhejiang Axilone Shunhua Aluminum & Plastic Co., Ltd,
China
Hayco, Hong Kong
Godrej Consumer Products, India
Tata Global Beverages, India
NH Foods Ltd., Japan
Nihon Kajitsu Kogyo Co., Ltd, Japan
Shiseido Co., Ltd., Japan
Olam International, Singapore
Charoen Pokphand Foods PCL, Thailand

32
Companies that anticipate using an internal price on carbon in the next two years
EnergyInpex Corporation, Japan
FinancialsZhejiang Yat Electrical Appliance Co., Ltd.,China
Mahindra & Mahindra Financial Services, India
Mahindra Lifespace Developers Limited, India
State Bank of India, India
YES Bank Limited, India
Daiwa House Industry Co., Ltd., Japan
ORIX Corporation, Japan
Seven Bank, Ltd., Japan
Tokio Marine Holdings, Inc., Japan
Hana Financial Group, Republic of Korea
Industrial Bank of Korea, Republic of Korea
Samsung Fire & Marine Insurance, Republic of Korea
Samsung Securities, Republic of Korea
City Developments Limited, Singapore
Kasikornbank, Thailand
Health CareFenda, China
Shengda, China
Dr. Reddy’s Laboratories, India
Nitin Life Sciences, India
Piramal Enterprises, India
ZCL Chemicals, India
Daiichi Sankyo Co., Ltd., Japan
IndustrialsBeauty Star, China
China State Construction International Holdings Ltd,
China
Cixi Zhongfa Lamps, China
Cosco Container Lines Co., Ltd, China
Hurrytop China Network Logistics, China
Juteng, China
Ningbo Jiayin, China
Ningbo Klite, China
Sengled Optoelectronics Co.,Ltd, China
Suzhou Victory Precision Manufacture Co., Ltd, China
Victory Giant Technology, China
Zotac, Hong Kong
Jain Irrigation Systems, India
Furukawa Electric Co., Ltd., Japan
Kajima Corporation, Japan
Shimizu Corporation, Japan
Sumitomo Heavy Industries. Ltd., Japan
Pacific Inter-link Sdn Bhd, Malaysia
Daewoo E&C, Republic of Korea
Hanjin Logistics, Republic of Korea
Hyundai E&C, Republic of Korea
Hyundai Glovis Co Ltd, Republic of Korea
JK Lighting, Republic of Korea
KCC, Republic of Korea
Samsung C&T, Republic of Korea
Samsung Heavy Industries Co Ltd, Republic of Korea
Taihan Electric Wire, Republic of Korea
King Slide Technology Co., Ltd, Taiwan
YZC Kunshan, Taiwan
Information TechnologyBOE Technology Group Co.,Ltd., China
Cienet Technologies, China
Cybertan Technology Inc, China
Founder PCB, China
Huafeng, China
Shandong Saint Electronics, China
Shanghai Meixing, China
Shenzhen Grentech, China
Shenzhen Sun And Lynn, China
Sirtec, China
T&W, China
Tongyu, China
YanTat Printed Circuit (Shenzhen) Co., Ltd, China
Infosys Limited, India
Brother Industries, Ltd., Japan
Fujitsu Ltd., Japan
Konica Minolta, Inc., Japan
Nomura Research Institute, Ltd., Japan
Ricoh Co., Ltd., Japan
TDK Corporation, Japan
Techsap Asp Sdn Bhd, Malaysia
Daewon Semiconductor Packaging Industrial Co Ltd,
Republic of Korea
ISU Petasys Co Ltd, Republic of Korea
LG Display, Republic of Korea
LG Innotek, Republic of Korea
Samsung SDI, Republic of Korea
AsiaCarbon price disclosure by GICS sectorContinued from previous page

33
SK Hynix, Republic of Korea
Elec & Eltek Co Ltd, Singapore
Advanced Semiconductor Engineering, Taiwan
Arcadyan Germany Technology, Taiwan
Chaun-Choung Technology Corp, Taiwan
Chicony Electronics Co. Ltd, Taiwan
Compal Electronics, Taiwan
Everlight Electronics Co Ltd, Taiwan
FSP Technology Inc., Taiwan
Innolux Corporation, Taiwan
Joy Technology (Shenzen) Corp., Taiwan
Lextar, Taiwan
Mitrastar Technologies (Formerly Zyxel
Communications), Taiwan
MiTAC Holdings Corporation (MHC), Taiwan
Nanya Technology Corp, Taiwan
Powertech Technology Inc, Taiwan
Qisda, Taiwan
Quanta Computer, Taiwan
Sable Corporation, Taiwan
Siliconware Precision Industries Co., Taiwan
Taiwan Semiconductor Manufacturing, Taiwan
MaterialsBlack Cat, China
Nanyi Zhi Pin Packaging Co., Ltd, China
Porton, China
Rong Hua (Qing Yuan) Offset Printing, China
Shanghai Huachi Printing Co., Ltd, China
Shanghai Takemoto Packages Co., Ltd, China
Shenma, China
Shya Hsin Packaging Industry (China) Co.,Ltd., China
Spread Profit, China
STARLITE PRINTERS (SZ) CO.,LTD, China
Essar Steel Limited, India
Godrej Industries, India
GRP, India
Hindustan Zinc, India
Mahindra Sanyo Special Steel Pvt. Ltd, India
Parksons Packaging Limited Chakan, India
Tata Chemicals, India
Tata Steel, India
Vedanta Ltd, India
Dynaplast, Indonesia
Pt Visichem Intiprima, Indonesia
Pt. Printindo Utama, Indonesia
Nitto Denko Corporation, Japan
Rengo Co., Ltd., Japan
Shin-Etsu Chemical Co., Ltd., Japan
Takeuchi-press Industries, Japan
Hyundai Steel Co, Republic of Korea
Kiswire Ltd., Republic of Korea
China Steel, Taiwan
Indorama Ventures PCL, Thailand
PTT Global Chemical, Thailand
Telecommunication ServicesAirsys, China
Anhui Tianyuan Commu, China
China Mobile, China
Chinacomm, China
Innolight, China
Svarn Infratel, India
KT Corporation, Republic of Korea
LG Uplus, Republic of Korea
SK Telecom, Republic of Korea
SingTel, Singapore
Hwacom Systems, Taiwan
Advanced Info Service, Thailand
UtilitiesCLP Holdings Limited, Hong Kong
GAIL, India
Tata Power Co, India

34
EuropeCarbon price disclosure by GICS sector
Companies currently using an internal price on carbon
Company Country Price (US$) Impact Target
Consumer Discretionary
JCDecaux SA. France
Kering France 69.25 n n
Michelin France n
Renault France n
BMW AG Germany 6.70
Daimler AG Germany
PUMA SE Germany n
Volkswagen AG Germany
Roechling Automotive Italy
Inditex Spain 30.00 n
Compagnie Financière Richemont SA Switzerland
Arçelik A.S. Turkey n n
Vestel Elektronik Sanayi Ve Ticaret A.S. Turkey
Crest Nicholson PLC United Kingdom
Domino's Pizza Group plc United Kingdom 24.64
Jaguar Land Rover Ltd United Kingdom 11.17 n
JD Sports Fashion United Kingdom
Marks and Spencer Group plc United Kingdom n
N Brown Group Plc United Kingdom 23.48
RELX Group United Kingdom
Sky plc United Kingdom 23.33 n n
Whitbread United Kingdom
WPP Group United Kingdom 53.15
Consumer Staples
Carlsberg Breweries A/S Denmark
Carrefour France 22.34–78.18 n
Danone France
Sofidel S.p.A. Italy
Rixona Netherlands
Jerónimo Martins SGPS SA Portugal 5.58
Coca-Cola HBC AG Switzerland n
Nestlé Switzerland 1.02 n
Migros Ticaret A.S. Turkey n
Associated British Foods United Kingdom
Dairy Crest Group United Kingdom
J Sainsbury Plc United Kingdom 24.64
Morrison Supermarkets United Kingdom n
Muntons plc United Kingdom
Unilever plc United Kingdom 10.00 n
214companies in Europe are pricing carbon now.¹
1 33 companies submitted private responses and are not listed in the appendix.

35
Company Country Price (US$) Impact Target
Energy OMV AG Austria
Neste Corporation Finland
Total France 27.92
MOL Nyrt. Hungary
Eni SpA Italy 40.00
Royal Dutch Shell Netherlands 40.00
Vopak Netherlands 27.92
Det Norske Oljeselskap ASA Norway
Statoil ASA Norway 50–64
Galp Energia SGPS SA Portugal 33.51 n
Compañía Española de Petróleos, S.A.U.
CEPSA
Spain
Repsol Spain n
Lundin Petroleum Sweden 54.03
BP United Kingdom 40.00
Tullow Oil United Kingdom
Financials Danske Bank A/S Denmark n
BNP Paribas France
Gecina France n
Societe Generale France 11.17 n n
Commerzbank AG Germany n
Deutsche Bank AG Germany n
Piraeus Bank Greece 7.82
Banco de credito social cooperativo Spain
Banco Popular Espanol S.A. Spain 8.94 n n
CaixaBank Spain 5.58 n
Nordea Bank Sweden 2.23 n
BEKB / BCBE Switzerland
Credit Suisse Switzerland n
Swiss Re Switzerland n
T.Garanti Bankasi A.S. Turkey n
T.Sinai Kalkinma Bankasi A.S. Turkey
Aviva plc United Kingdom
Barclays United Kingdom
Big Yellow Group United Kingdom 23.92
Capital & Counties Properties United Kingdom 17.50 n
Ernst & Young LLP UK United Kingdom 23.92 n
Henderson Group United Kingdom n
Legal and General Investment
Management
United Kingdom
Unite Students United Kingdom 24.64 n
Workspace Group United Kingdom

36
EuropeCarbon price disclosure by GICS sectorContinued from previous page
Company Country Price (US$) Impact Target
Health Care Lundbeck A/S Denmark
Novartis Switzerland 100.00 n n
Boots Contract Manufacturing United Kingdom
Nuffield Health United Kingdom
Spire Healthcare United Kingdom 24.64
Industrials Grundfos Denmark
Air France—KLM France
Bic France 12.29; 22.34 n n
Bouygues France n n
Groupe Eurotunnel France
La Poste France 7.82 n n
LEGRAND France 33.51
Saint-Gobain France n
Hochtief AG Germany
Kingspan Group PLC Ireland
Danieli & C Officine Meccaniche S.p.A. Italy
Arcadis Netherlands
Royal BAM Group nv Netherlands n
CTT—Correios de Portugal SA Portugal 39.10;
7.82–22.34n n
Abengoa Spain 10.05 n
Ferrovial Spain n
Grupo Logista Spain n
International Consolidated Airlines Group,
S.A.
Spain n
Obrascon Huarte Lain (OHL) Spain 4.86
SAS Sweden
Pegasus Hava Taşimaciliği A.Ş. Turkey 6.37
Balfour Beatty United Kingdom 24.64
Go-Ahead Group United Kingdom 23.33 n
Linklaters LLP United Kingdom
Morgan Advanced Materials United Kingdom n
Morgan Sindall Group plc United Kingdom n
Senior Plc United Kingdom 27.71
Travis Perkins United Kingdom
Information Technology
Atos SE France n
Sopra Steria Group France 5.58
Renishaw United Kingdom
Sungard Availability Services (Sungard
AS)
United Kingdom

37
Company Country Price (US$) Impact Target
Materials Solvay S.A. Belgium 83.77 n
Novozymes A/S Denmark n
Metsä Board Finland 11.17 n
Outokumpu Oyj Finland n
Stora Enso Oyj Finland
MMP Packetis France 35.74
MMP Premium France 35.74
BASF SE Germany
D.G.W. Germany
Edelmann Germany
HeidelbergCement AG Germany 22.34
ThyssenKrupp AG Germany
Smurfit Kappa Group PLC Ireland
Palladio Group SPA Italy 9.24; 22.34
Zignago Vetro SpA Italy
AkzoNobel Netherlands 55.84–150.78 n
Royal DSM Netherlands 55.84 n
Borregaard ASA Norway n
Norsk Hydro Norway
Arkhangelsk Pulp and Paper Mill Russia 16.75
Acerinox Spain
Ercros Spain
Boliden Group Sweden n
SSAB Sweden
Tetra Pak Sweden 11.17 n n
Glencore plc Switzerland 8.17
LafargeHolcim Ltd Switzerland n
Anglo American United Kingdom 3.27–8.17
BHP Billiton United Kingdom 24.00 n
GPS PE Products United Kingdom 17.50 n
Hill & Smith Holdings United Kingdom
Lonmin United Kingdom
Marshalls United Kingdom
Mondi PLC United Kingdom 33.51
Petra Diamonds Ltd United Kingdom n
Rio Tinto United Kingdom n n
Telecom. Services
Magyar Telekom Nyrt. Hungary n
Koninklijke KPN NV (Royal KPN) Netherlands
BT Group United Kingdom 24.64 n
TalkTalk Telecom Group United Kingdom 25.08
Vodafone Group United Kingdom

38
EuropeCarbon price disclosure by GICS sectorContinued from previous page
Company Country Price (US$) Impact Target
Utilities Verbund AG Austria 5.58–7.48 n
Fortum Oyj Finland
EDF France
ENGIE France
SUEZ France n
VEOLIA France
E.ON SE Germany 22.34–44.68
A2A Italy 6.70–13.40
ENEL SpA Italy 12.29 n
Snam S.P.A Italy 8.23
Terna Italy
EDP—Energias de Portugal S.A. Portugal 5.58–67.01
REN—Redes Energéticas Nacionais Portugal
ACCIONA S.A. Spain 39.09; 50.26;
80.42n n
Enagas Spain 7.82 n n
Endesa Spain 12.29 n
Gas Natural SDG SA Spain 23.24–37.11 n
Iberdrola SA Spain 33.51 n n
Vattenfall Group Sweden n
Centrica United Kingdom 32.08
National Grid PLC United Kingdom 86.04 n n
Pennon Group United Kingdom 75.83–291.65 n
Severn Trent United Kingdom 21.29 n
SSE United Kingdom n n
United Utilities United Kingdom 23.48

39
Companies that anticipate using an internal price on carbon in the next two years
Consumer DiscretionaryGroupe PSA, France
Ipsos, France
Sodexo, France
Axel Springer SE, Germany
iwis motorsysteme, Germany
Adler Plastic Spa, Italy
O.M.G. Di Messieri Odoardo & C. Spa, Italy
IEE, Luxembourg
Melia Hotels International SA, Spain
NAGARES. S.A., Spain
NH Hotel Group, Spain
Ihlas Ev Aletleri Imalat Sanayi Ve Ticaret A.S., Turkey
Berkeley Group, United Kingdom
Brand Addition, United Kingdom
Cms Cameron Mckenna, United Kingdom
De Vere Group, United Kingdom
Dentsu Aegis Network, United Kingdom
GLH (Thistle Hotels), United Kingdom
Norton Rose, United Kingdom
Redrow Homes Ltd, United Kingdom
Rosti, United Kingdom
SuperGroup, United Kingdom
TUI Group, United Kingdom
Consumer StaplesDelhaize Group, Belgium
L’Oréal, France
Tereos, France
Beiersdorf AG, Germany
METRO AG, Germany
MI (Michaelleides), Greece
De Matteis Agroalimentare S.P.A., Italy
Heineken NV, Netherlands
Aceites Del Sur—Coosu, Spain
AJE Group, Spain
Dacsa Ltd, Spain
A.G. Barr Plc, United Kingdom
Britvic, United Kingdom
Greggs, United Kingdom
EnergyMaurel Et Prom, France
ERG S.p.A, Italy
SBM Offshore, Netherlands
PJSC Gazprom, Russia
Tecnicas Reunidas, Spain
Ophir Energy Plc, United Kingdom
Premier Oil, United Kingdom
FinancialsAltarea Cogedim, France
AXA Group, France
CNP Assurances, France
Credit Agricole, France
Icade, France
Klepierre, France
Nexity, France
Eurobank Ergasias SA, Greece
National Bank Of Greece, Greece
Allied Irish Banks plc, Ireland
UniCredit, Italy
ING Group, Netherlands
DNB ASA, Norway
Bankinter, Spain
BBVA, Spain
Hoist Finance, Sweden
Akbank T.A.S., Turkey
Türkiye Kalkinma Bankasi A.S., Turkey
Yapi Ve Kredi Bankasi A.S., Turkey
De Vere Venues Group Ltd, United Kingdom
Hammerson, United Kingdom
Land Securities, United Kingdom
Prudential PLC, United Kingdom
Health CareUCB SA, Belgium
Coloplast A/S, Denmark
Sanofi, France
Fresenius SE & Co. KGaA, Germany
Shire, Ireland
AstraZeneca, United Kingdom
Bupa, United Kingdom
IndustrialsÖsterreichische Post AG, Austria
Palfinger AG, Austria
Keytec, Czech Republic
A.P. Moller—Maersk, Denmark
DANFOSS, Denmark
Finnair, Finland
Valmet, Finland
ADP (Aeroports de Paris), France
Derichebourg Multiservices, France
Schneider Electric, France
Deutsche Post AG, Germany
Siemens AG, Germany
Suedkabel GmbH, Germany
WAGO, Germany
Weener Plastik GmbH, Germany

40
Companies that anticipate using an internal price on carbon in the next two years
Ingersoll-Rand Co. Ltd., Ireland
Airbus Group, Netherlands
CEVA, Netherlands
Royal Philips, Netherlands
Ficosa, Portugal
Iturri, S.A., Spain
Inwido Ab, Sweden
Skanska AB, Sweden
Gategroup Holding AG, Switzerland
Kuehne + Nagel International AG, Switzerland
AVK, United Kingdom
BBA Aviation, United Kingdom
CNH Industrial NV, United Kingdom
Costain Group, United Kingdom
easyJet, United Kingdom
FirstGroup Plc, United Kingdom
Interserve Plc, United Kingdom
National Express Group Plc, United Kingdom
Project People, United Kingdom
Rolls-Royce, United Kingdom
Stephenson Harwood, United Kingdom
Unipart, United Kingdom
Virgin Atlantic Airways Ltd, United Kingdom
Volex Group, United Kingdom
Whistl UK Ltd, United Kingdom
WSH Group, United Kingdom
Information TechnologyScanfil, Finland
Cap Gemini, France
Jenoptik AG, Germany
SAP SE, Germany
Ericsson, Sweden
Aci Worldwide Ltd, United Kingdom
NSC Global Ltd, United Kingdom
MaterialsConstantia Packaging, Austria
Air Liquide, France
ARKEMA, France
Chimex, France
Lanxess AG, Germany
Wieland Holding, Germany
CRH Plc, Ireland
Armetallizing NV, Italy
Industria Grafica Eurostampa S P A, Italy
Italcementi, Italy
Nuceria Adesivi SRL, Italy
PCC Exol, Poland
Grafobal a.s, Slovakia
Alliabox, Spain
Menshen, Spain
Clariant AG, Switzerland
Givaudan SA, Switzerland
Model Holding AG, Switzerland
Akçansa Çimento Sanayi Ve Ticaret A.S., Turkey
ASG, United Kingdom
Croda International, United Kingdom
Innovia Films Ltd, United Kingdom
Vedanta Resources PLC, United Kingdom
Telecommunication ServicesGOBE, France
Deutsche Telekom AG, Germany
VIA optronics (Suzhou) Co., Ltd, Germany
Telecom Italia, Italy
Telefonica, Spain
Millicom International Cellular SA, Sweden
Swisscom, Switzerland
Beacon Security & Communications Limited, United
Kingdom
UtilitiesR.E.E., Spain
Akenerji Elektrik Üretim A.S., Turkey
Zorlu Dogal Elektrik Üretimi A.S., Turkey
Zorlu Enerji Elektrik Üretim A.S., Turkey
EuropeCarbon price disclosure by GICS sectorContinued from previous page

41
Latin AmericaCarbon price disclosure by GICS sector
Companies currently using an internal price on carbon
Company Country Price (US$) Impact Target
Consumer Discretionary
Feedbacktur Viagens Ltda—EPP—GILOGRJ Brazil
Grupo Televisa S.A. Mexico
Consumer Staples
Granja 3 Arroyos Argentina
Natura Cosmeticos SA Brazil
Vina Concha y Toro S A Chile 1.00 n n
Grupo Nutresa S.A. Colombia n n
Sociedad Agrícola e Industrial San Carlos Ecuador
Energy Petróleo Brasileiro SA–Petrobras Brazil
Financials Banco Santander Brasil Brazil
Itaú Unibanco Holding S.A. Brazil
Itausa Investimentos Itau S.A. Brazil
Industrials Ecofrotas Brazil
Transportes Cavalinho Brazil
Colcafe Colombia n n
Information Technology
Service Bank Servs. Tecnologicos E Brazil
Materials Braskem S/A Brazil n
Duratex S/A Brazil
Utilities AES Tiete SA Brazil
Centrais Eletricas Brasileiras S/A (Eletrobras) Brazil 5.00
Companhia Energetica Minas Gerais—CEMIG Brazil 1.00
CPFL Energia SA Brazil 0.28
Colbun SA Chile 5.00
Celsia SA ESP Colombia
Companies that anticipate using an internal price on carbon in the next two years
Consumer DiscretionaryAethra Sistemas Automotivos S/A., Brazil
B2W Companhia Global do Varejo, Brazil
Lojas Americanas S/A, Brazil
CINSA SA DE CV, Mexico
Janesville de México, S.A. de C.V., Mexico
Karmatex, Mexico
Prod Infantiles Selectos SA CV, Mexico
Consumer StaplesJBS S/A, Brazil
Mataboi, Brazil
Vigor, Brazil
Colombina S.A., Colombia
Dyval S.A (Repostería Deli), Colombia
Panifresh Costa Rica SA, Costa Rica
Ayvi SA de CV, Mexico
Cafinco SA de CV, Mexico
Comercializadora GAB (Mr Lucky), Mexico
Innophos Mexicana S. de R.L. de C.V., Mexico
Pinsa Comercial SA de CV, Mexico
Proteinas Y Oleicos SA CV, Mexico
26companies in Latin America are pricing carbon now.¹
1 3 companies submitted private responses and are not listed in the appendix.

42
Middle EastCarbon price disclosure by sector
Companies that anticipate using an internal price on carbon in the next two years
Consumer Discretionary
Classic Fashion Apparel, Jordan
Materials
Altajir Glass, United Arab Emirates
Telecommunication Services
ECI Telecom, Israel
Companies that anticipate using an internal price on carbon in the next two years
FinancialsBanco Bradesco S/A, Brazil
Paschoalotto I C BR G E LTDA, Brazil
Banco Davivienda SA, Colombia
Grupo de Inversiones Suramericana SA, Colombia
Grupo Financiero Banorte SAB de CV, Mexico
IndustrialsLoginter, Argentina
Companhia de Concessões Rodoviárias—CCR, Brazil
Grupo Libra, Brazil
Hidrojato Nacional SC LTDA, Brazil
Sete Servicos De Entrega DE TI (Texlog), Brazil
Transportadora Rodomeu LTDA, Brazil
Transvip Transp De Val Vig Patrimonial LTDA, Brazil
MaterialsRigolleau, Argentina
FIBRIA Celulose S/A, Brazil
Grafica 43, Brazil
Klabin S/A, Brazil
Vale, Brazil
Votorantim Cimentos, Brazil
Empresas CMPC, Chile
Cementos Argos SA, Colombia
Fepromel SAS., Colombia
Vical, Costa Rica
Absormex, Mexico
Fresnillo plc, Mexico
Packaging Products del Peru, Peru
Trupal S.A, Peru
Telecommunication ServicesAxtel, Mexico
UtilitiesCia Paranaense de Energia—COPEL, Brazil
EDP—Energias do Brasil S.A., Brazil
Eletropaulo Metropolitana Eletricidade de São Paulo
S/A, Brazil
Empresa de Energia de Bogota S.A. E.S.P., Colombia
Interconexion Electrica Sa, Colombia
Isagen S.A. E.S.P., Colombia
Latin AmericaCarbon price disclosure by GICS sectorContinued from previous page

43
North AmericaCarbon price disclosure by GICS sector
Companies currently using an internal price on carbon
Company Country Price (US$) Impact Target
Consumer Discretion-ary
Aimia Inc. Canada 13.79
Canadian Tire Corporation, Limited Canada 11.49–22.99
Fruit of the Loom USA
General Motors Company USA 5.00 n n
Superior Industries International USA
Walt Disney Company USA n n
Consumer Staples
Archer Daniels Midland USA
Campbell Soup Company USA
Colgate Palmolive Company USA n
Dean Foods Company USA
Del Monte Foods USA
Hormel Foods USA
WhiteWave Foods USA n
Energy ARC Resources Ltd. Canada
Canadian Natural Resources Limited Canada
Cenovus Energy Inc. Canada
Encana Corporation Canada 20–125
Enerplus Corporation Canada 22.98
Husky Energy Inc. Canada
Imperial Oil Canada 80.00
Keyera Corp. Canada 11.49–22.98
Suncor Energy Inc. Canada 11.49–42.12
TransCanada Corporation Canada 61.27
Vermilion Energy Inc. Canada 11.49; 16.91
Chevron Corporation USA
ConocoPhillips USA 6–38
Devon Energy Corporation USA 15.00
Exxon Mobil Corporation USA 80.00
Hess Corporation USA 20–40
Occidental Petroleum Corporation USA
Financials Bank of Montreal Canada 25.00 n
Great-West Lifeco Inc. Canada 22.98
Power Corporation of Canada Canada 22.98
Power Financial Corporation Canada 22.98
TD Bank Group Canada 9.00 n n
BNY Mellon USA 29.02 n
Goldman Sachs Group Inc. USA n n
Harvard Maintenance, Inc. USA
Wells Fargo & Company USA
111companies in North America are pricing carbon now.¹
1 15 companies submitted private responses and are not listed in the appendix.

44
Company Country Price (US$) Impact Target
Health Care Allergan plc USA n
Biogen Inc. USA n
Industrials Air Canada Canada
The Beck Group—HC Beck USA
Covanta Energy Corporation USA
Cummins Inc. USA n
Delta Air Lines USA
General Electric Company USA
Jacobs Engineering Group Inc. USA 23.92
Owens Corning USA 10–60 n
Parker-Hannifin Corporation USA
Stanley Black & Decker, Inc. USA 23; 25; 150 n
Tennant Company USA n
Waste Management, Inc. USA
Wisconsin Energy Conservation
Corporation (WECC)
USA 13.12 n n
Information Technology
Adobe Systems, Inc. USA n n
Alphabet, Inc. USA
Asociar LLC USA
Autodesk, Inc. USA n
Corning Incorporated USA
EMC Corporation USA 30.00
IO Data Centers USA
Microchip Technology USA
Microsoft Corporation USA n n
Materials Barrick Gold Corporation Canada
Catalyst Paper Corporation Canada 22.98
HudBay Minerals Inc. Canada 15.32–38.29
Resolute Forest Products Inc. Canada n
Teck Resources Limited Canada 11.49–30.64
E.I. du Pont de Nemours and Company USA
Eastman Chemical Company USA
Monsanto Company USA
Owens-Illinois USA
The Dow Chemical Company USA
Telecom. Services
Rogers Communications Inc. Canada
GENBAND USA
World Wide Technology Holding Company USA
North AmericaCarbon price disclosure by GICS sectorContinued from previous page

45
Company Country Price (US$) Impact Target
Utilities Capital Power Corporation Canada
TransAlta Corporation Canada 22.98
Ameren Corporation USA 23–53
American Electric Power Company, Inc. USA
CMS Energy Corporation USA
DTE Energy Company USA
Duke Energy Corporation USA
Eversource Energy USA
Exelon Corporation USA 0–20
FirstEnergy Corporation USA
Los Angeles Department of Water and
Power
USA 12.45
NiSource Inc. USA 20.00
NRG Energy Inc USA n n
OGE Energy Corp. USA
Ormat Technologies Inc USA
PG&E Corporation USA
Pinnacle West Capital Corporation USA
Sempra Energy USA
WEC Energy Group USA
Xcel Energy Inc. USA 1.86–40 n
Companies that anticipate using an internal price on carbon in the next two years
Consumer Discretionary
Active Knitwear Resources Inc, USA
Adjmi Apparel Group, USA
All Access Apparel, Inc., USA
Cable Connection & Supply, USA
Custom Accessories Inc, USA
Detroit Manufacturing Systems, USA
E&E Manufacturing, USA
Jjs Mae Inc Dba Rainbeau, USA
Lowe’s Companies, Inc., USA
Neapco, USA
Otter Products, LLC, USA
Paris Presents LTD, USA
Renfro Corporation, USA
Royal Caribbean Cruises Ltd, USA
Roytex Inc, USA
Topson Downs, USA
VF Corporation, USA
Whirlpool Corporation, USA
Wyndham Worldwide Corporation, USA
Consumer Staples
Loblaw Companies Limited, Canada
Maple Leaf Foods Inc., Canada
Albaad, USA
Alliance One International Inc., USA
Beaver Street Fisheries, USA
Berwick Offray Hong Kong, USA
Cargill, USA
Coca-Cola European Partners, USA
Kellogg Company, USA
Leprino Foods, USA
Mars, USA
Massimo Zanetti Beverage USA, USA
Michael Foods Inc (USFS), USA
Molson Coors Brewing Company, USA
Norpac Foods, Inc., USA
Oxygen, USA
PepsiCo, Inc., USA
Philip Morris International, USA
Royal Cup, Inc., USA
Shanghai Yingshuo Plastic Co, Ltd, USA
Supreme Rice Mill, USA

46
Companies that anticipate using an internal price on carbon in the next two years
Energy
Crescent Point Energy Corporation, Canada
Baker Hughes Incorporated, USA
CONSOL Energy Inc., USA
Financials
Bank of Nova Scotia (Scotiabank), Canada
Bentall Kennedy, Canada
Host Hotels & Resorts, Inc., USA
Invesco Ltd, USA
Iron Mountain Inc., USA
JPMorgan Chase & Co., USA
Morgan Stanley, USA
Health Care
Baxter International Inc., USA
Bristol-Myers Squibb, USA
Catalent Pharma Solutions, USA
Valeant Pharmaceuticals International, Inc., USA
Waters Corporation, USA
Industrials
Canadian National Railway Company, Canada
TTR Transport, Canada
3M Company, USA
Asplundh Tree Expert, USA
Boston Coach, USA
DSC Logistics, USA
Flyte Tyme Limousine, USA
Iwco Direct, USA
Martin Transportation Systems, USA
Northline Utilities, USA
Republic Services, Inc., USA
Wabtec Corp., USA
Information Technology
BlackBerry Limited, Canada
Arista Networks, USA
Automatic Data Processing, Inc., USA
Equinix, INC., USA
Jabil Circuit, Inc., USA
Juniper Networks, Inc., USA
NetApp Inc., USA
Optoplex, USA
PCTEL, USA
Penguin Computing, USA
Qualcomm Inc., USA
Synaptics, USA
Telamon Corporation, USA
VMware, Inc, USA
VXI Global Solutions Inc, USA
Western Digital Corp, USA
Yahoo! Inc., USA
Materials
Detour Gold Corporation, Canada
Kruger Products Inc, Canada
Yamana Gold Inc., Canada
Accurate Box, USA
Alcoa Inc., USA
Avery Dennison Corporation, USA
Berry Plastics, USA
Golden Aluminum, Inc., USA
Koppers Holdings Inc, USA
Newmont Mining Corporation, USA
Novelis Inc., USA
Paper Magic Group Hong Kong Ltd, USA
YONYU Plastics (Shanghai) Co., Ltd, USA
Telecommunication Services
Telus Corporation, Canada
CenturyLink, USA
Utilities
The AES Corporation, USA
North AmericaCarbon price disclosure by GICS sectorContinued from previous page

47
OceaniaCarbon price disclosure by GICS sector
Companies currently using an internal price on carbon
Company Country Price (US$) Impact Target
Consumer Staples
Wesfarmers Australia
Woolworths Limited Australia
Energy AWE Australia
Origin Energy Australia 36.75
Santos Australia
Woodside Petroleum Australia
Financials AMP Australia n
Australia and New Zealand
Banking Group
Australia 1.30;
10.29–15.44
GPT Group Australia
Insurance Australia Group Australia n
Investa Property Group Australia
National Australia Bank Australia n
Platinum Asset Management Australia
Stockland Australia
Westpac Banking Corporation Australia
Industrials Qantas Airways Australia
Materials Incitec Pivot Australia
South32 Australia
Fletcher Building New Zealand
Utilities AGL Energy Australia 10.25
Infigen Energy Australia
Companies that anticipate using an internal price on carbon in the next two years
Consumer Discretionary
Super Retail Group, Australia
Warehouse Group, New Zealand
Energy
Oil Search, Australia
Financials
Ayala Land Inc, Philippines
Industrials
Aurizon Holdings, Australia
Australia Post, Australia
Cleanaway Waste Management, Australia
Materials
Alumina, Australia
Boral, Australia
Fortescue Metals Group, Australia
Integrated Packaging Australia Pty Ltd, Australia
Sandfire Resources NL, Australia
Sims Metal Management, Australia
Atlas Consolidated Mining & Development, Philippines
Telecommunication Services
Spark New Zealand, New Zealand
Globe Telecom Inc, Philippines
Utilities
APA Group, Australia
23companies in Oceania are pricing carbon now.¹
1 2 companies submitted private responses and are not listed in the appendix.
Report Authors
Nicolette Bartlett Director, Carbon Pricing
Hannah Cushing Project Manager, Global Initiatives
Sara Law Vice President, Global Initiatives
Media inquiries
Zoe Tcholak-Antitch Communications, CDP North America [email protected]
CDP Contacts
Paul Simpson CEO
Lance Pierce President, CDP North America
Paula DiPerna Special Advisor
For further information, contact: [email protected]
This report is available for download from www.cdp.net.
Design
www.tatianatemple.com
CDP is a non-profit running the global environmental disclosure system for companies and sub-national governments.
www.cdp.net
This report is supported by The Children’s Investment Fund Foundation, MacArthur Foundation, Merck Family Fund, V. Kann Rasmussen Foundation and We Mean Business.