Embed Size (px)
Citation preview
Embedded Systems Research at DemoFest’07
Oscar Almeida, Alessandro Forin, Philip Garcia, Johannes Helander, Nishith Khantal, Hong Lu, Karl
Meier, Sibin Mohan, Henrik Nielsen, Richard Neil Pittman, Risto Serg, Bharat Sukhwani, Margus
Veanes, Ben Zorn
Microsoft Research
Sarah Berry, Chris Boyce, David Chaszar, Brandon Culrich, Mikhail Kisin, Gabe Knezek, Warren
Linam-Church, Steve Liu, Michael Stewart, Doug Toney
Texas A&M University
July 2007
Technical Report
MSR-TR-2007-94
Microsoft Research
Microsoft Corporation
One Microsoft Way
Redmond, WA 98052

- 2 -
- 3 -
Embedded Systems Research at DemoFest’07
Oscar Almeida, Alessandro Forin, Philip Garcia, Johannes Helander, Nishith Khantal, Hong Lu, Karl
Meier, Sibin Mohan, Henrik Nielsen, Richard Neil Pittman, Risto Serg, Bharat Sukhwani, Margus
Veanes, Ben Zorn
Microsoft Research
Sarah Berry, Chris Boyce, David Chaszar, Brandon Culrich, Mikhail Kisin, Gabe Knezek, Warren
Linam-Church, Steve Liu, Michael Stewart, Doug Toney
Texas A&M University
Abstract
The Embedded Systems group at Microsoft Research has been engaged in joint academic collaborations spanning
both teaching and research activities. The results of these collaborations are jointly reviewed, and highlighted to the
academic community at the Faculty Summit at Microsoft headquarters in Redmond, WA, during the DemoFest event.
This is also a good opportunity to review some of the other research projects that the group is engaged in, with special
consideration to the research performed as part of the summer internships. This report presents the demonstrations that
took place during the 2007 DemoFest. Two undergraduate student projects from the Real Time Distributed System group
at Texas A&M illustrate the results of the teaching activities. The first was a six-motor robotic assembly capable of
solving the Rubik Cube puzzle interactively, on an actual cube. The second was a 3D spherical display system realized
with a rotating ring of LEDs controlled by twelve microcontroller boards, each board controlling a row of 18 multi-
color LEDs. The research projects presented included the introduction of the first working prototype of the MSR eMIPS
dynamically self-extensible microprocessor and three current intern projects that leverage the eMIPS architecture.
Additional joint projects included a prototype of a data management system based on multiple trust evidence sources,
illustrating a new approach to online and embedded security developed in collaboration with the Software Design and
Implementation group. A walking stick for outpatient monitoring was the result of the collaboration between the
Robotics and the Embedded Systems groups. Finally, scalability in Embedded Systems was the focus of two closely
related projects. The first project realized the world’s smallest Web2.0 server, using 2,636 bytes of code and 92 bytes of
data on an 8-bit AVR microprocessor. This result leveraged the analysis and modeling tools realized in the second
project, a collaboration with the Foundations of Software Engineering group that led to a hybrid static-dynamic tool for
worst-case execution time estimation and off-line scheduling generation.
- 4 -
1 Introduction
The Microsoft Faculty Summit is a workshop that has grown considerably over the years. This year, the attendance
totaled nearly 350 highly qualified participants from universities across the globe. One of the most favorably received
events at the Summit is the DemoFest event, when a large number of research projects and related activities are presented
in a fair-like environment over a very short period of time (just about three hours!). This year the floor space, and
consequently the number of booths, was somewhat reduced due to the widespread renovation work being carried out at
the Microsoft Conference Center where the Summit takes place. The total number of booths was still high at 35, down
only slightly from the 39 of the previous year.
The Embedded Systems Group has been present at the Summit since its inception, demonstrating both the results of
its own research and the results of joint collaborations with academic partners and other researchers. This year we
highlighted the ongoing collaboration with the Real Time Distributed Systems Group at Texas A&M University, with
Microsoft Robotics, and with MSR researchers from the Software Design and Implementation Group and from the
Foundations of Software Engineering Group.
The goal of this document is to attempt to communicate the vitality and excitement of the DemoFest event for those
who could not attend it. While the atmosphere of free-flow communications and discussions is clearly impossible to
reproduce, we can at least recapture and recount the artifacts and some of the practical demonstrations that took place in
our small section of the event. Each of the document‟s sections is dedicated to one of the demonstrations that occurred at
the event; it describes the demo in simple terms and reproduces and explains its outputs and screenshots. Each section has
a corresponding poster that was displayed at the booth and which is reproduced in Appendix A. Short movies and
memorable moments are recorded in Appendix B.
It is likewise impossible to describe the atmosphere of the days that immediately preceded the event, when the demos
where finalized sometime very late into the night and very many and very busy people crammed into a couple of offices,
interacting, arguing, feeding, competing, laughing, sleeping and generally helping each other reach a common goal of
complete and amazing success. Our heartfelt thanks go especially to Sara Dangel and Claudia Boyle for their help with
the ensuing bedlam, and to all our significant others for their patience and tolerance.
- 5 -
Educational Experiences in Embedded Systems:
A Goal Driven, Self-Propelling Process
Steve Liu
Texas A&M University
Abstract
Over the past five years, in partnership with MSR researchers, we have developed an experimental teaching
strategy to explore more effective ways of teaching embedded computing systems to undergraduate students. Since its
humble start, valuable experiences and tangible results continue to emerge. In this DemoFest we presented and shared
the project’s results. We found that disciplined creativity and explorative processes can steer students into a self-
learning pathway that would be difficult to achieve by traditional lectures, tests and lab exercises alone.
In this strategy, the first half of the semester is driven by traditional lectures, exams and lab exercises aimed at
imparting a baseline knowledge base. The second half of the semester is driven by open projects that require the students
to deliver tangible prototypes, using the basic tools and materials learned in the first half of the semester. Specific
learning objectives and methods are developed for different stages of the semester in order to achieve the stated
technical goals of the class: “Exploration of students’ creativity through group creation of entry-level, industrial grade
toy projects using basic parts and tools.”
1 Introduction
A recent National Academy report, “Rising Above the Gathering Storm: Energizing and Employing America for
a Brighter Economic Future (2007) ,” cites science and technology as critical assets to the security and prosperity of the
United States. “Death by distance,” a phrase used by the authors to describe the painful prospect of outsourcing
professional jobs overseas, is a subtle yet real threat to the U.S. leadership in technology. While this issue needs to be
addressed by the American society as a whole, higher education institutions face the immediate challenge of educating
junior engineers who can serve the industry needs in the furiously competitive global market. This is particularly true for
the information technology (IT) industry, which does not require heavy machinery investment to establish an operational
base. The ongoing upheaval in the U.S. automotive industry is a clear hint of what will happen tomorrow if we do not act
today on the pressing issues facing the American IT industry. Undergraduate education is responsible for producing the
entry level engineers who perform the basic work. If domestic students cannot meet or surpass the productivity standards
in the global market, the only alternative for a corporation to survive from global competition is to migrate the technical
jobs to those places that can provide qualified workers at competitive wages. The last wave of outsourcing should be a
clear reminder of this possibility. Unless we escalate both the number and professional preparedness of our engineering
graduates, it will be only a matter of time before the U.S. loses its competitiveness in the global IT market.
Public universities are chartered with educating the larger student body with a broad background, within
reasonable financial burdens for the students. Recruiting and retaining the undergraduate engineering students without
compromising the curriculum‟s quality is a standing priority issue for many schools. Our experience is related to this
issue, but some of the experiences provide greater insights on the effects of the new teaching approach. Our goal is to
escalate the students‟ ability to transform technical knowledge into working systems at a minimal cost. Some self-
imposed questions and our field experiences in addressing these questions in a large public university are highlighted in
this report. Despite the progress made in the past several years (2002-present), our discoveries, experiences and
approaches were limited to the Texas A&M campus. They may not necessarily be applicable to other institutions, and
they should be interpreted with caution.
- 6 -
In this experiment, we took a clean slate approach in revising the course; literally everything related to the
class―technical materials, labs, assignments, textbooks, technology, even the lab physical layout itself―are new. Our
goal is to advance the technical competence of the students within existing credit-hour and prerequisite constraints. To
achieve this goal, we based our experiment on the adjustment of the teaching-learning strategies, of the class objectives
and of the technical materials. The entire process was supported by industry partners from Microsoft, Xilinx and ARM.
The Changes Before our experiment started, the class was structured like most other classes in the curriculum but with the
addition of a lab session. A textbook based on a popular microcontroller family was the only technical reference. The lab
was based on a few exercises using the microcontroller covered in the book. Homework assignments, tests, and labs were
the main tools for student learning and evaluation. The lecture materials were well structured and followed the book, and
the lab was based on a few fixed exercises based on a separate lab manual. For students, this class setup represented a
gradual transition from a learning process dominated by the textbook-exam scheme into an environment with some
lightweight hands-on lab activity, and before they entered into their final senior capstone design class. Unfortunately,
previous experience in teaching the senior capstone design course had shown that most students did not even know how
to start a project, or were unable to transform their knowledge into a working system and therefore most students failed to
bring the project to a successful completion.
We began by researching incremental changes to the existing technical materials and procedures in order to
achieve our goals. This was eventually abandoned because of the following overriding concerns: (1) the textbook was
very rich in content, but it was a major burden for both students and faculty. If a book is used as the main technical thrust
there is little room left for other teaching options. (2) There was a significant gap between the lab materials and the
textbook. (3) The existing process served the learning purpose well, but only for the heavily structured material in the
book. Students would garner little experience in the discovery, usage and cross-reference of the broad and diverse
technical data required to build practical working systems.
After an extensive search for textbooks, we found none that served our purposes effectively. We concluded that
the only option left was to restructure the class from scratch. With the endorsement of both industrial collaborators and
colleagues whose interests directly related to and were affected by the class, we decided to restructure it using a total
hands-on approach to teaching and learning. We replaced the textbook with real microelectronic chip datasheets and
schematics, supplemented by lectures on basic system design. Instead of developing monolithic but trivial applications on
the microcontroller board, we choose to run a small open source, componentized, real time operating system (Microsoft
Invisible Computing, aka MMLite). We consider the addition of the real time operating system to the microcontroller an
important decision because, for instance, most modern handheld devices require some operating system functions.
Students would learn to create embedded software that can coexist with and leverage other pre-existing software modules.
We added an FPGA board to the hardware contents because of its widespread use in modern microelectronics systems.
We chose not to use testing as the primary tool to assess the students‟ performance in class; instead, we gave more weight
to the lab sessions and, most importantly, to the final open project. This reflected our view that basic knowledge can be
checked by written tests, but system design skills and creativity can only be tested by labs and projects.
Faculty and Student Roles A class is a human-centric system where faculty, students and teaching materials are the inputs, and the new
knowledge and experience acquired by the students are the outputs. The traditional wisdom is to deliver the material in
the most structured way possible in order to maximize the amount of knowledge that the students will gain from the class.
The structure of the body of knowledge, the communication between faculty and students, the assignments, the tests, and
the labs form the crux of most classes. For many fields in science, mathematics, engineering and technology (SMET),
interaction mechanisms that are student-oriented and multidimensional can serve the learning objectives effectively. But
whether the same can be said about education in information technology needs to be examined carefully.
In our approach, the semester is informally divided into two parts. In the first half the instructor and teaching
assistants deliver the basic system concepts, lab procedures and examples to bring the students to the minimal technical
level sufficient to perform basic development functions. The second part of the semester is instead driven by the students
to bring their open project to completion. The faculty plays many roles in this second half of the semester:
- Consultant for project ideas and strategies;
- Mediator for dispute arbitration;
- Sponsor to finance the projects‟ purchases;
- 7 -
- Judge for the final evaluation.
Students begin the semester as passive learners, but soon they must explore their design options and the available
parts needed to complete their project. The second half of the semester essentially becomes a self-propelled, self-learning
process.
Hands-on and Fun Fun and curiosity are the key factors that stimulate the students‟ willingness to tackle advanced ideas and
transform them into working systems. The value of building an artifact is lost on the students when it cannot be shown to
friends, or if they do not find it interesting. This is a particularly important issue for embedded computing systems,
because of the tight integration of hardware, software, algorithms and even mechanical design into any complete, working
system. Granted, learning to construct computing systems is important in its own right, and the integration of the
computing devices with their environment, e.g., power, sizes, mechanical structures, etc., is also a major challenge. But
rather than attempt to instill the proper design rules in advance, experience has taught us that leaving all options open to
the students leads to a more effective self-learning experience. Our approach is to use a challenge-response process while
mentoring the students in the pursuit of their technical goals. Students are challenged at every stage about the scope and
progress of their projects, but there is no definite correlation between their adoption of the instructors‟ inputs and the final
project outcomes. In fact, some of the best projects were realized in total defiance of the instructors‟ suggestions.
Nonetheless, when the challenge-response process is used in conjunction with the instructor‟s sponsorship incentives, it
clearly stimulates the students to think out of the box and to take on more interesting projects.
Students can use any information and any available design reference, provided that they can properly justify the
value-added to their own project. They are allowed to regroup, and to scale up or scale down as their projects progresses
with time. They can even redirect the project goals if appropriate. Freedom however comes with responsibility; students
are held responsible for the way they use the information, for how they manage the intra-team relationships, and for the
ultimate outcome of their project. Projects are graded based on the value that is added during the process. This value
added could be quantified in terms of creativity, engineering process, or even the (failed) attempt to take on exceedingly
difficult problems. Safe or “canned” projects receive the lowest and possibly failing grades.
From the teacher‟s perspective, the objective of hands-on and fun is not the artifact itself, but rather the
stimulation of the students‟ creativity, knowledge usage and teamwork. The result of the final project is only a portion of
the final grade; even a failed project can receive a good grade if the team can demonstrate high quality in their project
development process. The level of challenges, creativity, and teamwork vs. accountability are all important decision
factors. Students are encouraged to follow and to expand upon the successful projects from previous semesters.
Admittedly, some projects did resemble each other but every semester has produced at least one very interesting project
that is worth preserving and that will be cited as example in the next semester. Outstanding projects are submitted to the
DemoFest fair to share our experiences with participating faculty. The history of exceptional projects is maintained in a
website, and together with the exposure at DemoFest it creates further motivation for the new students.
Literature vs. Textbooks A critical decision made at the beginning of this project was to eliminate the textbook in favor of real
microelectronic datasheets, source codes and some basic system design lectures. We did not make this choice lightly. For
generations the textbook has been the proven tool to pass knowledge from one generation to the next. It will continue to
play this critical role in our teaching system, but it is not the only tool that can be used for a design-oriented, embedded
computing class. Rarely do two embedded computing systems look alike; for decades in this field, very few convergent
theories, architectures, or computing models have been agreed upon. New technologies constantly emerge from industry
and many of them have very short life spans. Although datasheets are not written in the clear format and style of
textbooks, most are written in fairly simple language and with complete technical information. We have classified the
datasheets in two types: architectural and functional pages, and reference pages. Reference pages are not covered in the
exams but functional pages are. While it may appear less convenient to students, there is a compelling reason to expose
them to the original technical documents as they learn real system design.
Some websites are easy to navigate, while others are very difficult. Similarly, some datasheets are much easier to
read than others; it may take weeks for a full-time engineer to go through some particularly voluminous and detailed set
of datasheets. Unless they have some prior internship experience in the industry, most students assume that the textbook
is their only source of knowledge. Luckily, technical information for undergraduate-level students is abundantly available
from many different sources. Very few students, however, are able to navigate through the many sources of information
- 8 -
and their required tool chains and then transform them into working systems. Helping students make the breakthrough
and move from the class to industry is very difficult if we maintain the teaching and learning processes of the past.
The other major concern with a textbook is the timely delivery of contemporary and updated knowledge to the
students, because it can take months or even years before a good textbook can be written about a new subject. Requiring
students to use industry datasheets in the class can be quite intimidating, but we might not be able to find a textbook that
balances the well structured abstraction against the detailed and complete information. Therefore, we have no alternative
but to make selective use of some well written datasheets to better serve the purpose of bringing the students closer to the
real world of system design and development. “Time to market” is an industry expression that captures the tension to
deliver a product to the consumer in the shortest time possible, to avoid rapid obsolescence and loss of consumer interest.
Similarly, we might define as “time to classroom” our own struggle in the education field to bring to the student materials
that are current and therefore improve on the market value of the knowledge that the students acquire.
Industry Collaboration A primary objective of this experiment is to find the teaching methods that most elevate the students‟
professional preparedness. Experience tells us that there is a strong correlation between the degree of interaction between
industry and university and these educational outcomes. This interaction must lead to face-to-face dialogues that can be
translated into classroom-business actions. Ever since the inception of our collaboration, our MSR partners have played a
critical role in the progress that we have been able to make. The first natural question was how to better match students‟
skills and industry expectations. It turns out that this issue does not have a standard answer, and, rightfully, should not.
Industrial needs change with time, and the delivering of contemporary technological knowledge to the classroom is only
one small part in the effort to make a quantum leap in educational outcomes. Material engagement in the classroom
activities and genuine interests from industry are critical to keep the class lively and interesting for both faculty and
students. Our joint projects in the DemoFest have proven highly effective in keeping the collaboration energy focused and
vibrant.
In summary, we believe we have identified a sustainable, productive educational model that can enable other
faculty with similar interests to reenergize their classes. It is not easy to get this far, particularly considering the existing
fiscal and curricula restrictions and the students‟ resistance to change, but the outcomes speak for themselves. Students
are able to complete far more advanced projects in their capstone design courses, and they demonstrate greater
confidence in their job interviews. And the project results get stronger and stronger with the years. This year is another
good year, and we look forward to an even better future.
- 9 -
Rubik’s Cube Solver
Chris Boyce, David Chaszar, Michael Stewart, Doug Toney, Steve Liu
Texas A&M University
Abstract
The Rubik’s cube solver is a multilayer embedded computing-motion control system that is capable of moving a
Rubik’s cube from an arbitrary initial state to the solved state. The high level cube solver is based on the Kociemba’s
algorithm and was implemented by Michael Reid (source: http://www.cubeman.org/). An EB63 microcontroller
evaluation board running an application built with Microsoft Invisible Computing receives the motion commands from
the high- level solver running on a PC, and moves the cube accordingly by rotating one of the faces at a time. We built a
hardwood frame, mounted six stepper motors on the frame and directly coupled them to the cube to make the moves.
Each axel links one stepper motor to the center element of one of the cube’s faces. The whole project was completed
within a few weeks from the assignment and demonstrates the students’ abilities to transform their knowledge into a
working system. Except for the RubikSolver software, all other software and hardware circuits and their controlling
functions were realized by the students with minimal assistance from the instructor.
1 Introduction
RubikSolver is the GUI/solving portion of the Rubik‟s cube solver. It is solved separately on the PC because the
algorithm used [1] (Kociemba‟s algorithm) is fairly space and CPU intensive, more than the EB63 can perform within a
reasonable time frame. It uses the COM2 port on the PC in order to send the motor commands to the EB63, but it is also
possible to just solve the puzzle without sending the solution to the motors.
Kociemba‟s algorithm is implemented as a non-optimal solver first formalized by Herbert Kociemba. The
solving algorithm we used is modified from source code provided by Michael Reid. The code was originally acquired
from http://www.cubeman.org/, where Reid‟s Near-Optimal Cube Executable and Source is provided freely to the public.
We have made many changes to the original version. We have ported the source code to C++, and moved all of the
algorithm code into its own class (KociembaAlgorithm) under its own namespace (Kociemba). Additionally, several of
the structs have been changed into classes and their members made private (Cube, Options), as well as using C++ friend
declarations to ensure smooth transition (Options). Cube has been moved into its own namespace (Rubik) along with
several constants that might be useful for future algorithm implementations. KociembaAlgorithm derives from a base
Algorithm class which also helps make it easier to implement other algorithms in the future. The end result is that we have
reduced pollution of the global namespace with algorithm specific constants and classes. Additionally, many of the
#define‟d constants have been made either static const or made into enums to help enforce type safety. Finally, the
original printf and scanf routines have been replaced with much safer C++ streams, which makes input and output to the
algorithm much more flexible.
2 Demonstration
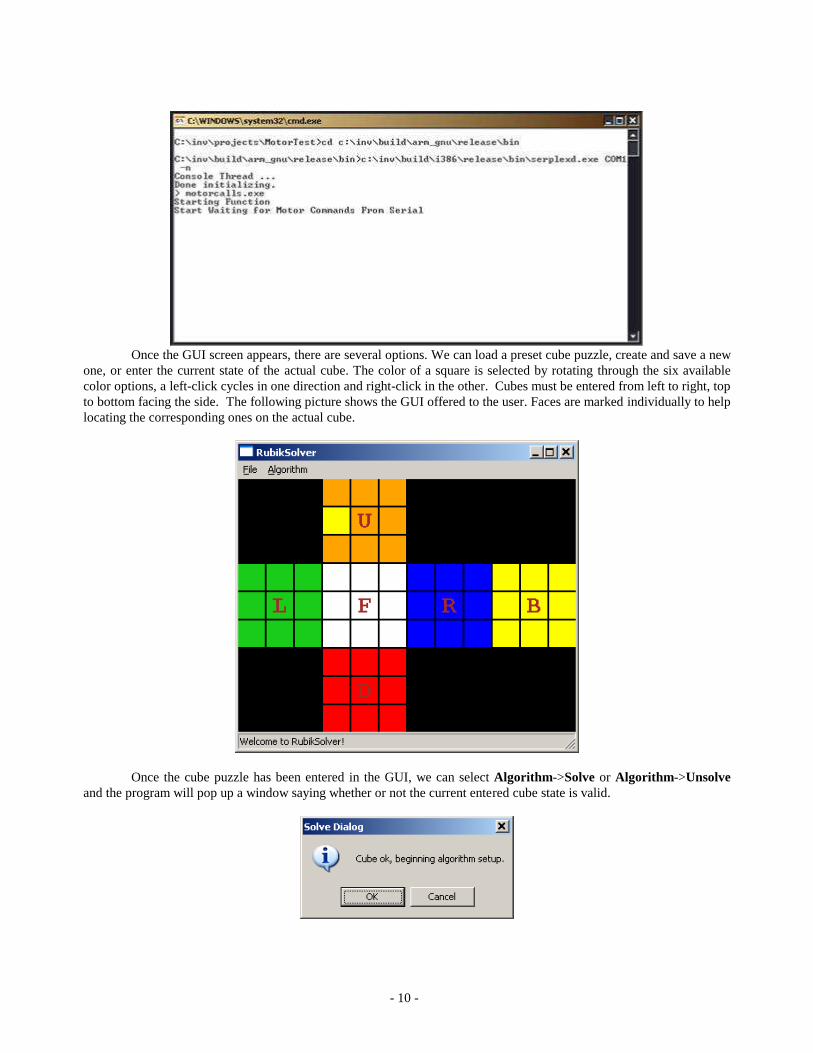
We start the demonstration by running RubikGUI.exe on the PC side and motorcalls.exe on the EB63 side.
When motorcalls is initialized and ready for operation the console screen output from the board is as shown in the
following screen. This indicates that the controller is waiting for the string of commands, which are expected on the
second serial line connector of the EB63 board.
- 10 -
Once the GUI screen appears, there are several options. We can load a preset cube puzzle, create and save a new
one, or enter the current state of the actual cube. The color of a square is selected by rotating through the six available
color options, a left-click cycles in one direction and right-click in the other. Cubes must be entered from left to right, top
to bottom facing the side. The following picture shows the GUI offered to the user. Faces are marked individually to help
locating the corresponding ones on the actual cube.
Once the cube puzzle has been entered in the GUI, we can select Algorithm->Solve or Algorithm->Unsolve
and the program will pop up a window saying whether or not the current entered cube state is valid.
- 11 -
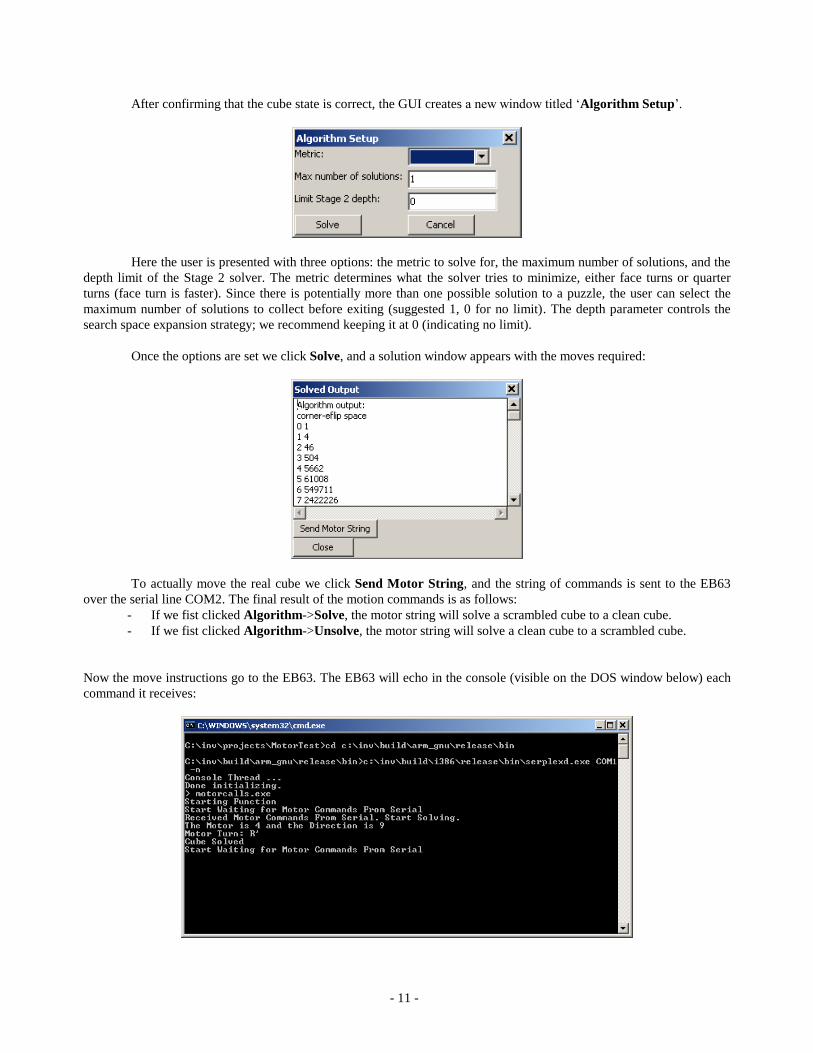
After confirming that the cube state is correct, the GUI creates a new window titled „Algorithm Setup‟.
Here the user is presented with three options: the metric to solve for, the maximum number of solutions, and the
depth limit of the Stage 2 solver. The metric determines what the solver tries to minimize, either face turns or quarter
turns (face turn is faster). Since there is potentially more than one possible solution to a puzzle, the user can select the
maximum number of solutions to collect before exiting (suggested 1, 0 for no limit). The depth parameter controls the
search space expansion strategy; we recommend keeping it at 0 (indicating no limit).
Once the options are set we click Solve, and a solution window appears with the moves required:
To actually move the real cube we click Send Motor String, and the string of commands is sent to the EB63
over the serial line COM2. The final result of the motion commands is as follows:
- If we fist clicked Algorithm->Solve, the motor string will solve a scrambled cube to a clean cube.
- If we fist clicked Algorithm->Unsolve, the motor string will solve a clean cube to a scrambled cube.
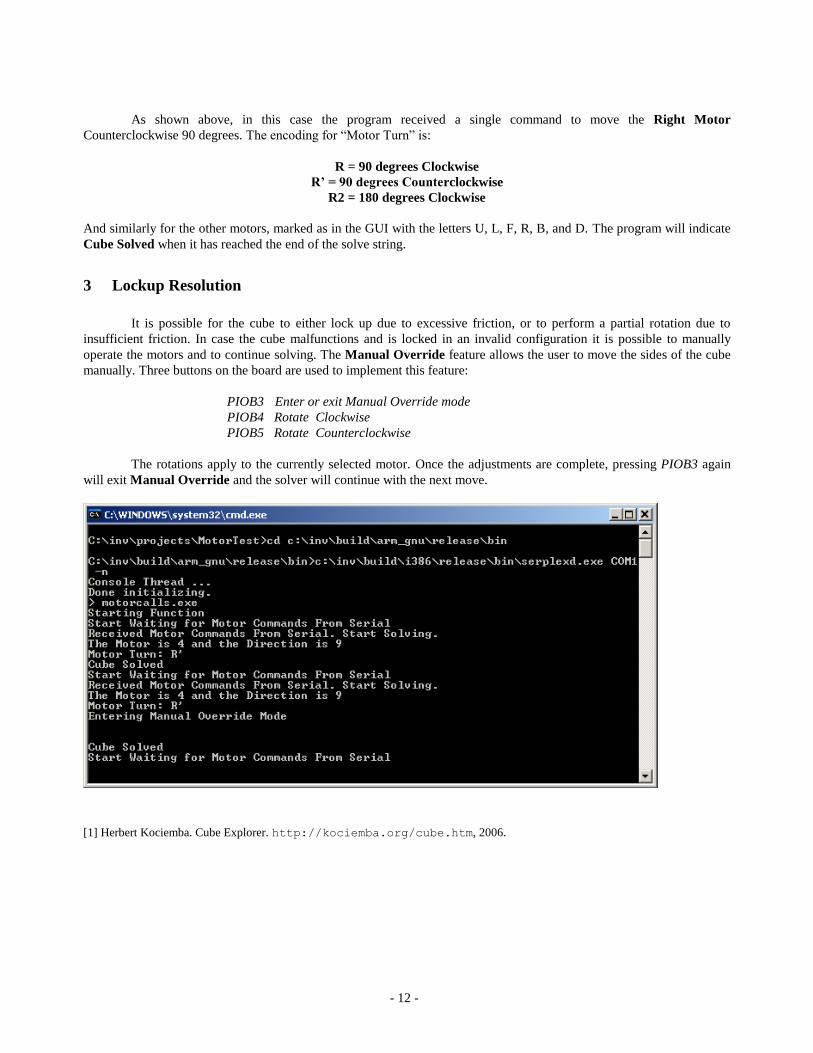
Now the move instructions go to the EB63. The EB63 will echo in the console (visible on the DOS window below) each
command it receives:
- 12 -
As shown above, in this case the program received a single command to move the Right Motor
Counterclockwise 90 degrees. The encoding for “Motor Turn” is:
R = 90 degrees Clockwise
R’ = 90 degrees Counterclockwise
R2 = 180 degrees Clockwise
And similarly for the other motors, marked as in the GUI with the letters U, L, F, R, B, and D. The program will indicate
Cube Solved when it has reached the end of the solve string.
3 Lockup Resolution
It is possible for the cube to either lock up due to excessive friction, or to perform a partial rotation due to
insufficient friction. In case the cube malfunctions and is locked in an invalid configuration it is possible to manually
operate the motors and to continue solving. The Manual Override feature allows the user to move the sides of the cube
manually. Three buttons on the board are used to implement this feature:
PIOB3 Enter or exit Manual Override mode
PIOB4 Rotate Clockwise
PIOB5 Rotate Counterclockwise
The rotations apply to the currently selected motor. Once the adjustments are complete, pressing PIOB3 again
will exit Manual Override and the solver will continue with the next move.
[1] Herbert Kociemba. Cube Explorer. http://kociemba.org/cube.htm, 2006.
- 13 -
Orb Spherical Display
Sarah Berry, Brandon Culrich, Mikhail Kisin, Gabe Knezek, Warren Linam-Church, Steve Liu
Texas A&M University
Abstract
The Aggie Orb is a spherical display system capable of displaying images on a rotational ring, which rotates at a
speed of 1100 RPM (corresponding to approximately 20fps) to create the spherical visual effects. This project represents
two generations of development efforts by undergraduate students in the computer science department of the Texas A&M
University. The first generation Orb I was a light-weight prototype built using hand-made circuit boards, connectors,
and pedestal. The success of Orb I led to the creation of Orb II, which was built on a heavy duty metal frame and
pedestal, a Plexiglas safety enclosure, twelve custom-built LED controller modules connected in a daisy chain, and a
high performance slip ring to implement the spherical display concept. Due to the heavy weight (over 200 pounds) and
large size, two students loaded the artifact on a van and drove for three days from College Station, TX to Redmond, WA
to present the project results at the Summit.
1 Introduction
The Orb II project is an extension of the Global Spinomatic 3000 project (Orb I) created by Sarah Berry, Mikhail Kisin,
and Gabe Knezek in the CPSC 462 Microcomputer Systems course. Given the time allotted (about 1 month) and the
budget constraints, the Orb I was an excellent proof of concept with regard to spherical rendering. At completion of the
semester the students were invited to extend the project with higher grade material, more advanced manufacturing
processes, and more advanced computing and communication architectures. Some students in the Orb I project chose not
to continue the endeavor, and two new students joined the continuation project. Orb I was implemented in a class setting
within a planned schedule, whereas Orb II was implemented in a small group, under the direct supervision of the
instructor and under a directed study class code.
2 Cyber-physical system principles
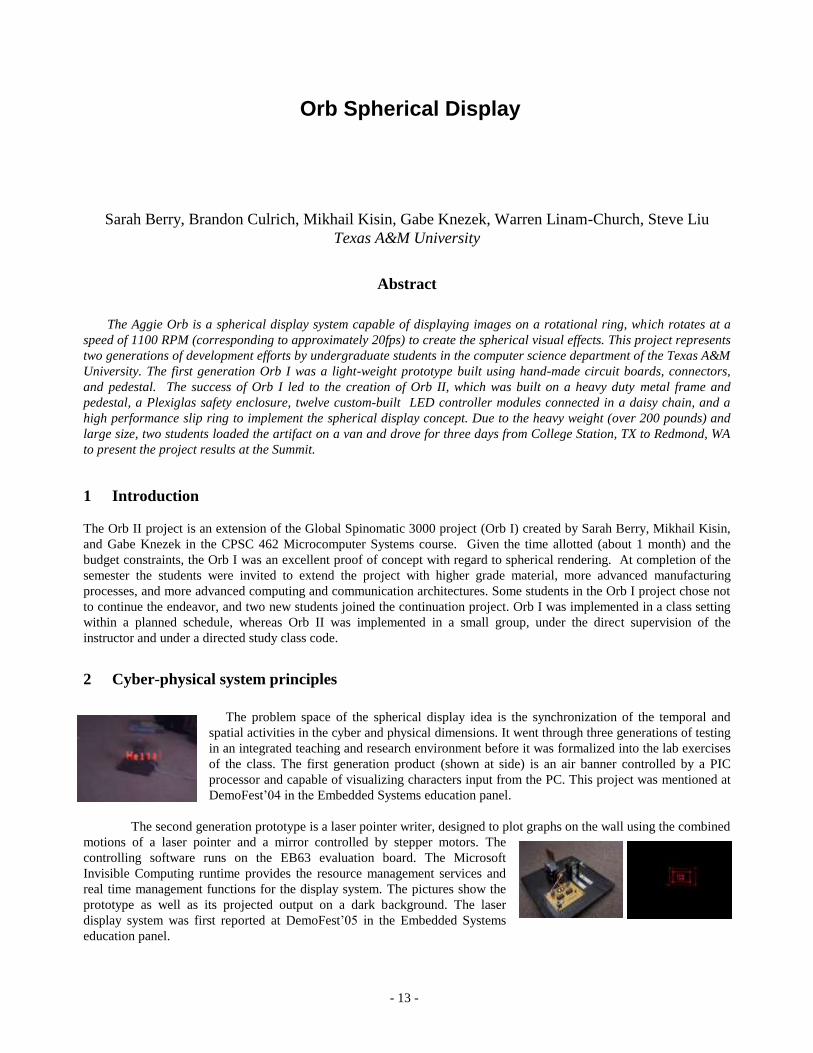
The problem space of the spherical display idea is the synchronization of the temporal and
spatial activities in the cyber and physical dimensions. It went through three generations of testing
in an integrated teaching and research environment before it was formalized into the lab exercises
of the class. The first generation product (shown at side) is an air banner controlled by a PIC
processor and capable of visualizing characters input from the PC. This project was mentioned at
DemoFest‟04 in the Embedded Systems education panel.
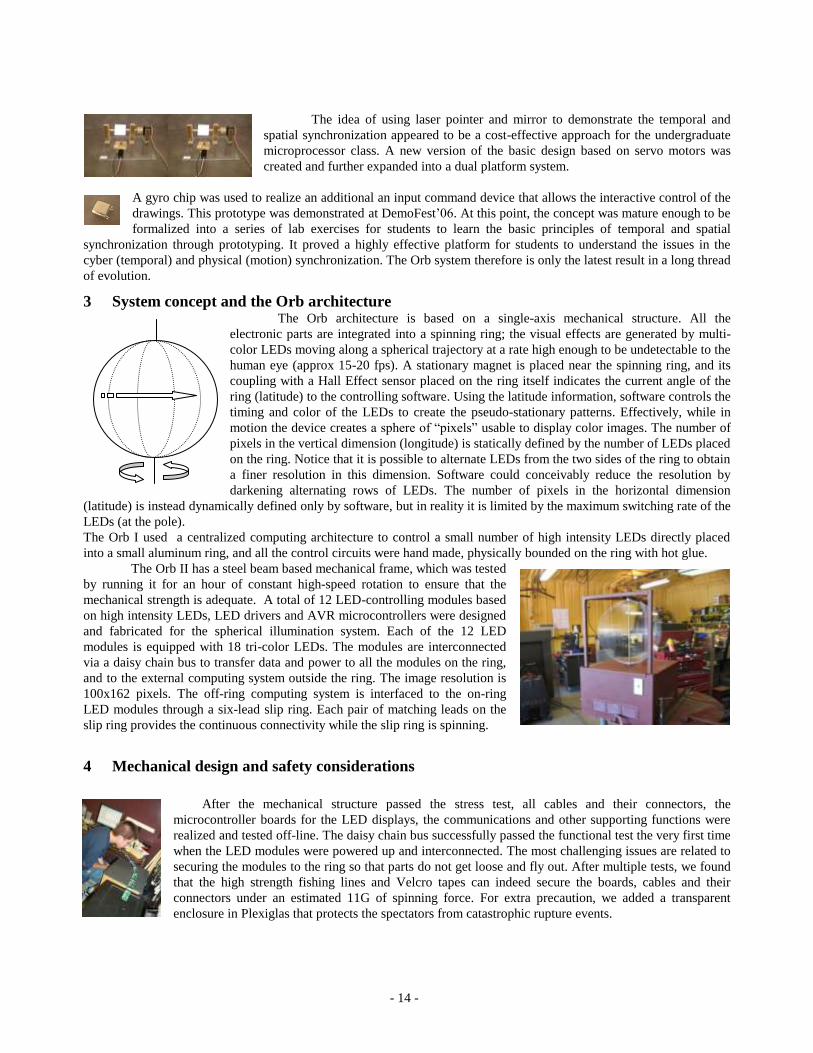
The second generation prototype is a laser pointer writer, designed to plot graphs on the wall using the combined
motions of a laser pointer and a mirror controlled by stepper motors. The
controlling software runs on the EB63 evaluation board. The Microsoft
Invisible Computing runtime provides the resource management services and
real time management functions for the display system. The pictures show the
prototype as well as its projected output on a dark background. The laser
display system was first reported at DemoFest‟05 in the Embedded Systems
education panel.
- 14 -
The idea of using laser pointer and mirror to demonstrate the temporal and
spatial synchronization appeared to be a cost-effective approach for the undergraduate
microprocessor class. A new version of the basic design based on servo motors was
created and further expanded into a dual platform system.
A gyro chip was used to realize an additional an input command device that allows the interactive control of the
drawings. This prototype was demonstrated at DemoFest‟06. At this point, the concept was mature enough to be
formalized into a series of lab exercises for students to learn the basic principles of temporal and spatial
synchronization through prototyping. It proved a highly effective platform for students to understand the issues in the
cyber (temporal) and physical (motion) synchronization. The Orb system therefore is only the latest result in a long thread
of evolution.
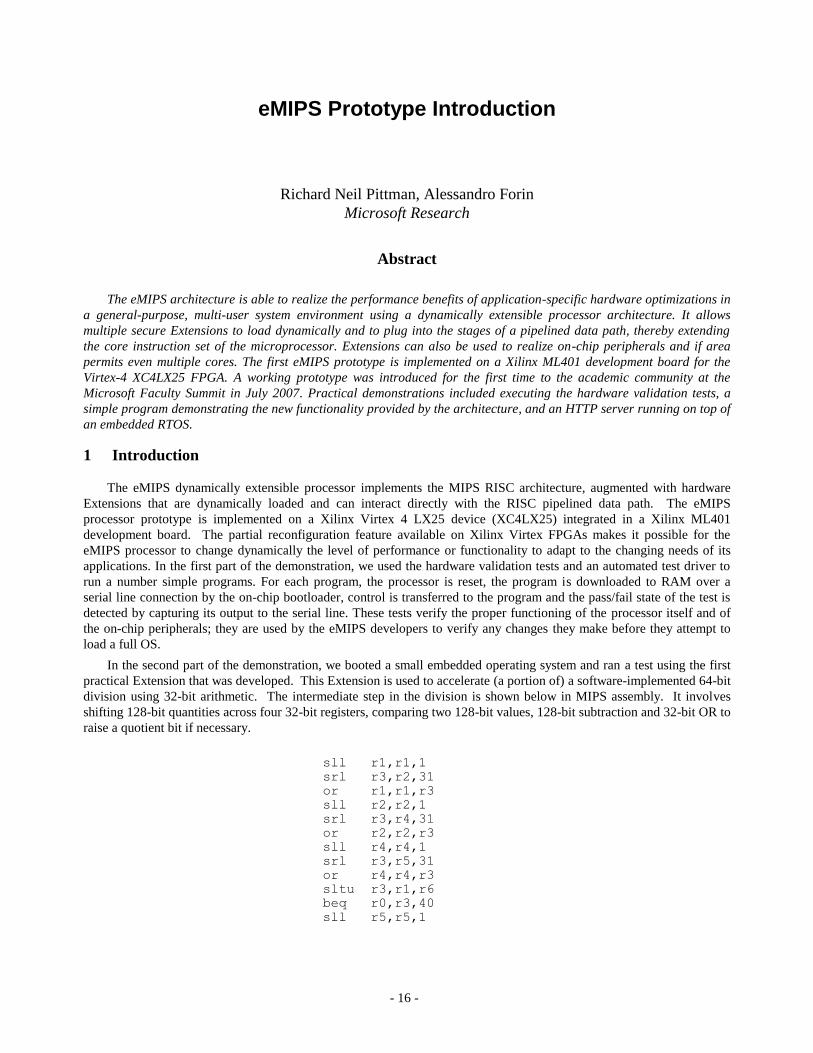
3 System concept and the Orb architecture The Orb architecture is based on a single-axis mechanical structure. All the
electronic parts are integrated into a spinning ring; the visual effects are generated by multi-
color LEDs moving along a spherical trajectory at a rate high enough to be undetectable to the
human eye (approx 15-20 fps). A stationary magnet is placed near the spinning ring, and its
coupling with a Hall Effect sensor placed on the ring itself indicates the current angle of the
ring (latitude) to the controlling software. Using the latitude information, software controls the
timing and color of the LEDs to create the pseudo-stationary patterns. Effectively, while in
motion the device creates a sphere of “pixels” usable to display color images. The number of
pixels in the vertical dimension (longitude) is statically defined by the number of LEDs placed
on the ring. Notice that it is possible to alternate LEDs from the two sides of the ring to obtain
a finer resolution in this dimension. Software could conceivably reduce the resolution by
darkening alternating rows of LEDs. The number of pixels in the horizontal dimension
(latitude) is instead dynamically defined only by software, but in reality it is limited by the maximum switching rate of the
LEDs (at the pole).
The Orb I used a centralized computing architecture to control a small number of high intensity LEDs directly placed
into a small aluminum ring, and all the control circuits were hand made, physically bounded on the ring with hot glue.
The Orb II has a steel beam based mechanical frame, which was tested
by running it for an hour of constant high-speed rotation to ensure that the
mechanical strength is adequate. A total of 12 LED-controlling modules based
on high intensity LEDs, LED drivers and AVR microcontrollers were designed
and fabricated for the spherical illumination system. Each of the 12 LED
modules is equipped with 18 tri-color LEDs. The modules are interconnected
via a daisy chain bus to transfer data and power to all the modules on the ring,
and to the external computing system outside the ring. The image resolution is
100x162 pixels. The off-ring computing system is interfaced to the on-ring
LED modules through a six-lead slip ring. Each pair of matching leads on the
slip ring provides the continuous connectivity while the slip ring is spinning.
4 Mechanical design and safety considerations
After the mechanical structure passed the stress test, all cables and their connectors, the
microcontroller boards for the LED displays, the communications and other supporting functions were
realized and tested off-line. The daisy chain bus successfully passed the functional test the very first time
when the LED modules were powered up and interconnected. The most challenging issues are related to
securing the modules to the ring so that parts do not get loose and fly out. After multiple tests, we found
that the high strength fishing lines and Velcro tapes can indeed secure the boards, cables and their
connectors under an estimated 11G of spinning force. For extra precaution, we added a transparent
enclosure in Plexiglas that protects the spectators from catastrophic rupture events.

- 15 -
The quality of the visual effect improves with a higher spinning rate, but this also leads to stronger structural
vibrations. Great care must be taken to balance the weight distributions to avoid potentially severe property damage or
even injuries. The spinning generates considerable lateral forces; see below the G force calculations for the ring.
5 The journey
The plan was to demonstrate the Orb II and two other projects at the DemoFest‟07 event, but the deadline
approached and the project infact was far from complete. Because of its heavy weight (estimated over 200 lbs) and its
large size, transport of the Orb II is not trivial. We inquired multiple carriers of their time and other delivery restrictions.
It was concluded that the lead time, packaging and shipping could become a major hurdle to the plan. Eventually Gabe
Knezek and Warren Linam-Church decided to simply rent a minivan and embark in the three days road trip from College
Station, TX to deliver the prototype and development computers to Redmond, WA. Their GPS location was relied to the
instructor and other collaborators, who followed Gabe and Warren until their safe arrival.
6 The demo
The prototype was tested for low bandwidth communications through the slip ring but the powerful spinning motor
caused significant noise on the DC power and communication links. The image mapping software, whose original
function was to drive the Orb display patterns in real time, was instead used to transform any image into the display
format of the spherical surface. The most popular pattern used in the demo is the planar earth, as shown in the short
movie in Appendix B. It took a few seconds for the motor to reach its table speed, and also for the software system to
calibrate to its average readings. A short movie illustrating the Orb in action is shown in Appendix B. The spherical
display shows the Earth, using a bitmap taken from the Windows time-zone applet and downloaded in advance to the
microcontrollers.
7 Operations
Currently, the LED modules are powered by eight rechargeable batteries, which should be fully charged before a
demo session. The batteries are located at the bottom of the ring and need to be securely placed in their casing, with all
the flat cables tugged in over them. The protective cage and the front cover must be tightened before the motor power is
turned on. The prototype is not designed for long time of continuous operation. If the noise increases (loosening of screws
on the cover), odd smell emerges (overheated motor) the power should be shut down immediately.
487.118.9
574.112
8.9
574.112254.0
594.28
,
594.28sec60
1075254.022
254.0
508.0"20
2
2
2
2
g
c
g
c
c
a
aforcesG
sma
sm
m
sm
r
va
maFr
mvF
sm
m
rpmrpsrv
mr
md
- 16 -
eMIPS Prototype Introduction
Richard Neil Pittman, Alessandro Forin
Microsoft Research
Abstract
The eMIPS architecture is able to realize the performance benefits of application-specific hardware optimizations in
a general-purpose, multi-user system environment using a dynamically extensible processor architecture. It allows
multiple secure Extensions to load dynamically and to plug into the stages of a pipelined data path, thereby extending
the core instruction set of the microprocessor. Extensions can also be used to realize on-chip peripherals and if area
permits even multiple cores. The first eMIPS prototype is implemented on a Xilinx ML401 development board for the
Virtex-4 XC4LX25 FPGA. A working prototype was introduced for the first time to the academic community at the
Microsoft Faculty Summit in July 2007. Practical demonstrations included executing the hardware validation tests, a
simple program demonstrating the new functionality provided by the architecture, and an HTTP server running on top of
an embedded RTOS.
1 Introduction
The eMIPS dynamically extensible processor implements the MIPS RISC architecture, augmented with hardware
Extensions that are dynamically loaded and can interact directly with the RISC pipelined data path. The eMIPS
processor prototype is implemented on a Xilinx Virtex 4 LX25 device (XC4LX25) integrated in a Xilinx ML401
development board. The partial reconfiguration feature available on Xilinx Virtex FPGAs makes it possible for the
eMIPS processor to change dynamically the level of performance or functionality to adapt to the changing needs of its
applications. In the first part of the demonstration, we used the hardware validation tests and an automated test driver to
run a number simple programs. For each program, the processor is reset, the program is downloaded to RAM over a
serial line connection by the on-chip bootloader, control is transferred to the program and the pass/fail state of the test is
detected by capturing its output to the serial line. These tests verify the proper functioning of the processor itself and of
the on-chip peripherals; they are used by the eMIPS developers to verify any changes they make before they attempt to
load a full OS.
In the second part of the demonstration, we booted a small embedded operating system and ran a test using the first
practical Extension that was developed. This Extension is used to accelerate (a portion of) a software-implemented 64-bit
division using 32-bit arithmetic. The intermediate step in the division is shown below in MIPS assembly. It involves
shifting 128-bit quantities across four 32-bit registers, comparing two 128-bit values, 128-bit subtraction and 32-bit OR to
raise a quotient bit if necessary.
sll r1,r1,1
srl r3,r2,31
or r1,r1,r3
sll r2,r2,1
srl r3,r4,31
or r2,r2,r3
sll r4,r4,1
srl r3,r5,31
or r4,r4,r3
sltu r3,r1,r6
beq r0,r3,40
sll r5,r5,1
- 17 -
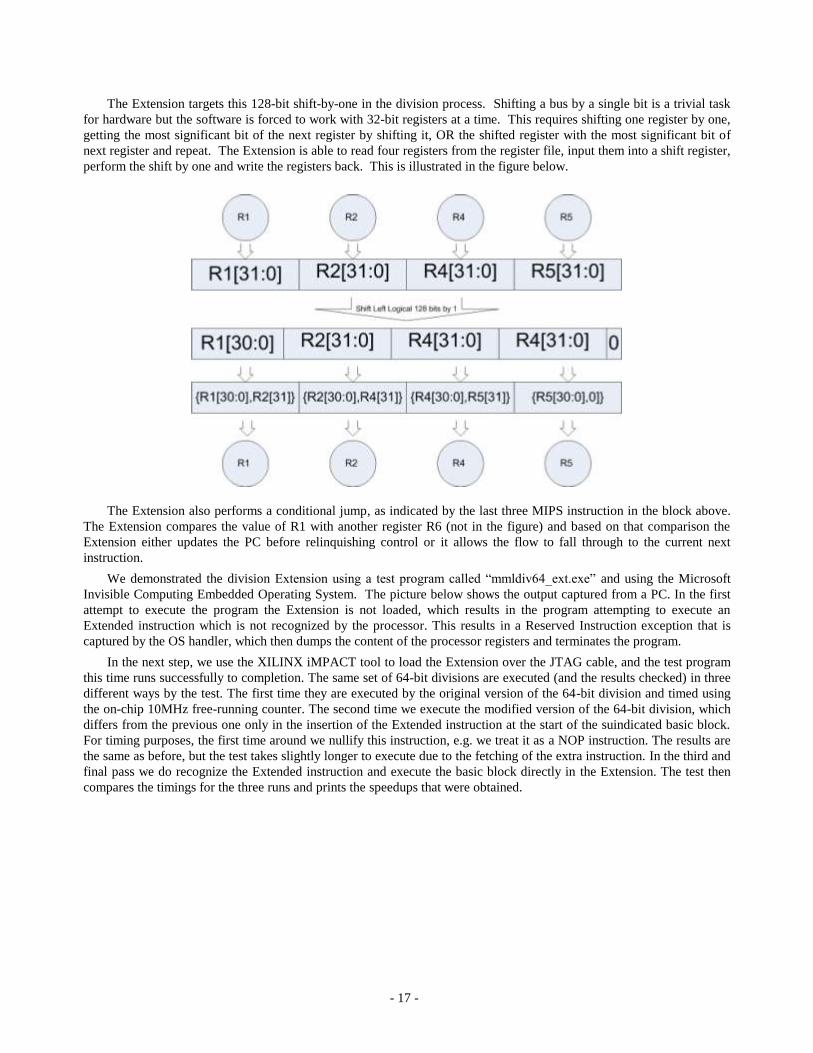
The Extension targets this 128-bit shift-by-one in the division process. Shifting a bus by a single bit is a trivial task
for hardware but the software is forced to work with 32-bit registers at a time. This requires shifting one register by one,
getting the most significant bit of the next register by shifting it, OR the shifted register with the most significant bit of
next register and repeat. The Extension is able to read four registers from the register file, input them into a shift register,
perform the shift by one and write the registers back. This is illustrated in the figure below.
The Extension also performs a conditional jump, as indicated by the last three MIPS instruction in the block above.
The Extension compares the value of R1 with another register R6 (not in the figure) and based on that comparison the
Extension either updates the PC before relinquishing control or it allows the flow to fall through to the current next
instruction.
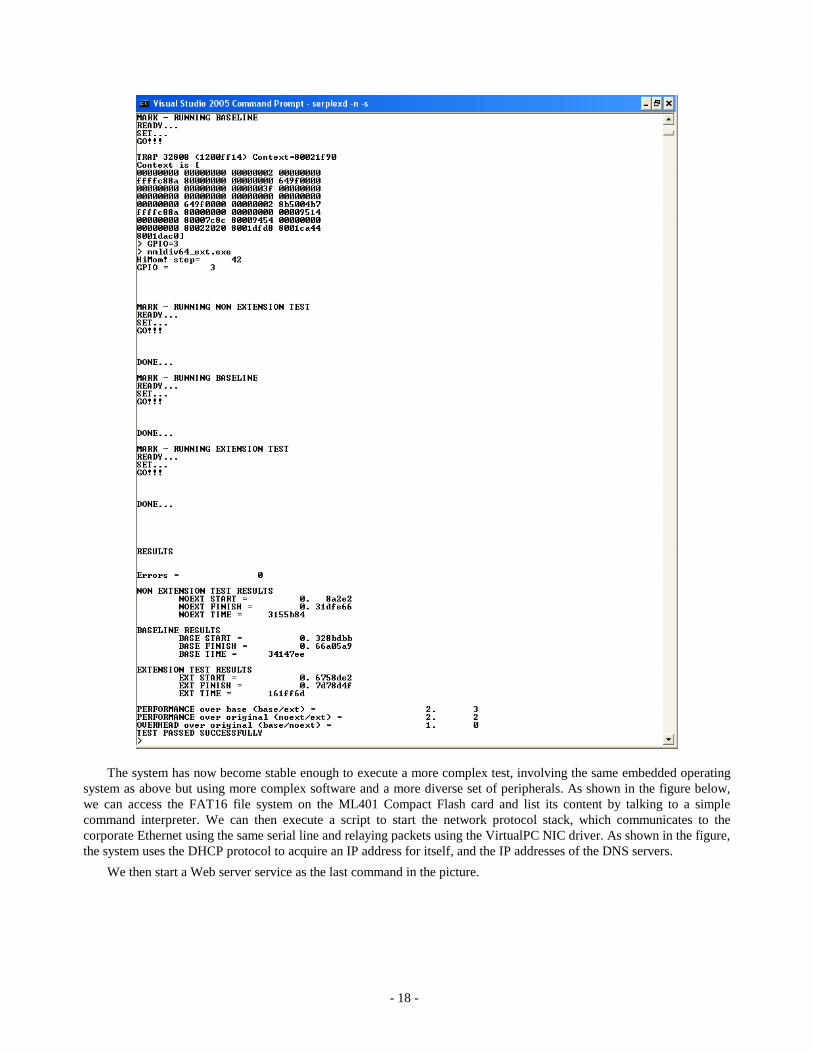
We demonstrated the division Extension using a test program called “mmldiv64_ext.exe” and using the Microsoft
Invisible Computing Embedded Operating System. The picture below shows the output captured from a PC. In the first
attempt to execute the program the Extension is not loaded, which results in the program attempting to execute an
Extended instruction which is not recognized by the processor. This results in a Reserved Instruction exception that is
captured by the OS handler, which then dumps the content of the processor registers and terminates the program.
In the next step, we use the XILINX iMPACT tool to load the Extension over the JTAG cable, and the test program
this time runs successfully to completion. The same set of 64-bit divisions are executed (and the results checked) in three
different ways by the test. The first time they are executed by the original version of the 64-bit division and timed using
the on-chip 10MHz free-running counter. The second time we execute the modified version of the 64-bit division, which
differs from the previous one only in the insertion of the Extended instruction at the start of the suindicated basic block.
For timing purposes, the first time around we nullify this instruction, e.g. we treat it as a NOP instruction. The results are
the same as before, but the test takes slightly longer to execute due to the fetching of the extra instruction. In the third and
final pass we do recognize the Extended instruction and execute the basic block directly in the Extension. The test then
compares the timings for the three runs and prints the speedups that were obtained.
- 18 -
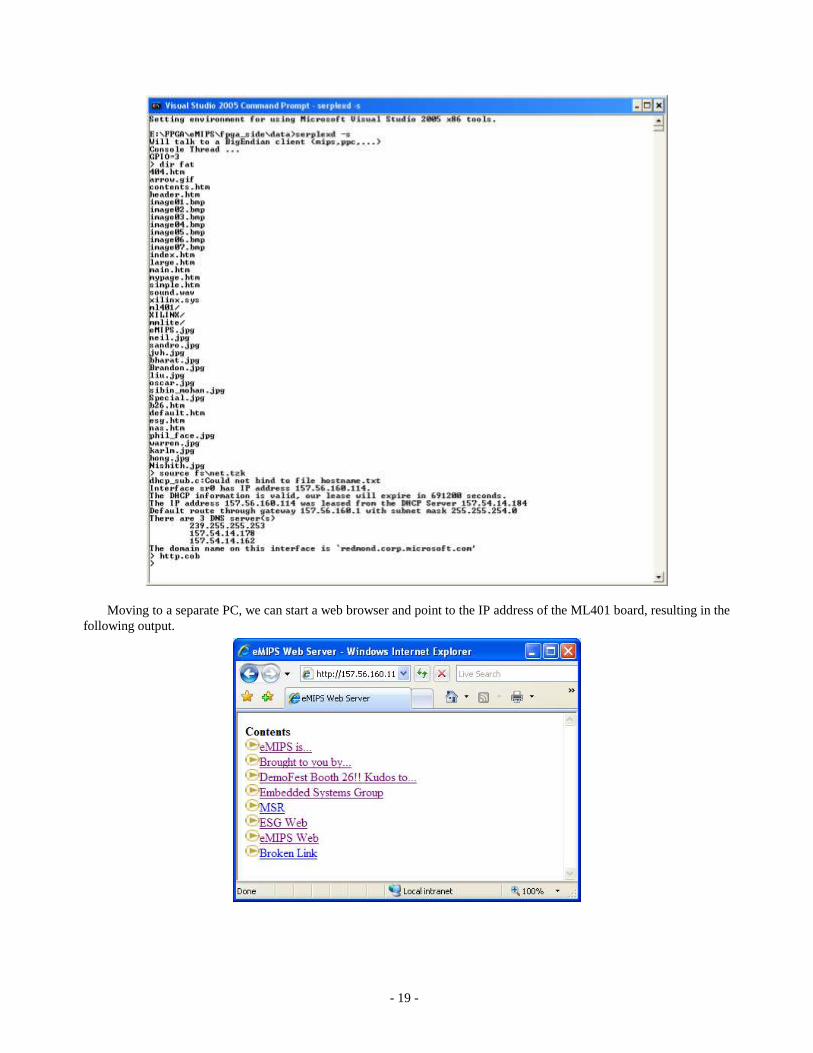
The system has now become stable enough to execute a more complex test, involving the same embedded operating
system as above but using more complex software and a more diverse set of peripherals. As shown in the figure below,
we can access the FAT16 file system on the ML401 Compact Flash card and list its content by talking to a simple
command interpreter. We can then execute a script to start the network protocol stack, which communicates to the
corporate Ethernet using the same serial line and relaying packets using the VirtualPC NIC driver. As shown in the figure,
the system uses the DHCP protocol to acquire an IP address for itself, and the IP addresses of the DNS servers.
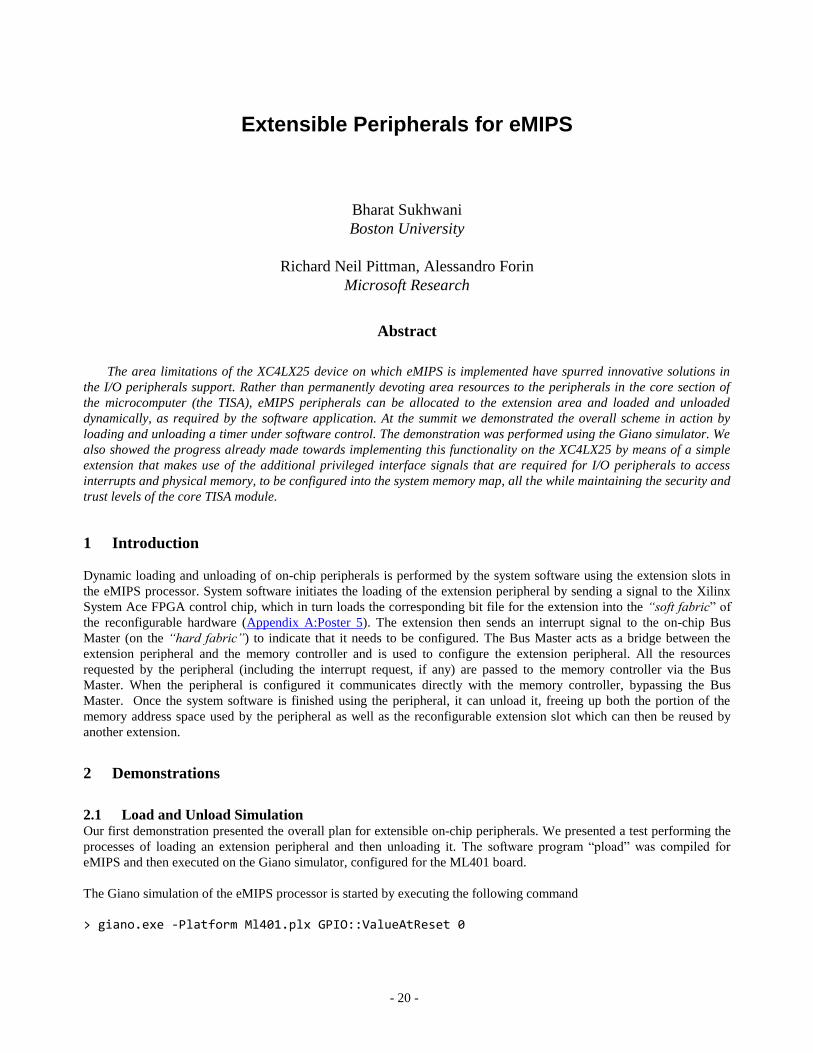
We then start a Web server service as the last command in the picture.
- 19 -
Moving to a separate PC, we can start a web browser and point to the IP address of the ML401 board, resulting in the
following output.
- 20 -
Extensible Peripherals for eMIPS
Bharat Sukhwani
Boston University
Richard Neil Pittman, Alessandro Forin
Microsoft Research
Abstract
The area limitations of the XC4LX25 device on which eMIPS is implemented have spurred innovative solutions in
the I/O peripherals support. Rather than permanently devoting area resources to the peripherals in the core section of
the microcomputer (the TISA), eMIPS peripherals can be allocated to the extension area and loaded and unloaded
dynamically, as required by the software application. At the summit we demonstrated the overall scheme in action by
loading and unloading a timer under software control. The demonstration was performed using the Giano simulator. We
also showed the progress already made towards implementing this functionality on the XC4LX25 by means of a simple
extension that makes use of the additional privileged interface signals that are required for I/O peripherals to access
interrupts and physical memory, to be configured into the system memory map, all the while maintaining the security and
trust levels of the core TISA module.
1 Introduction
Dynamic loading and unloading of on-chip peripherals is performed by the system software using the extension slots in
the eMIPS processor. System software initiates the loading of the extension peripheral by sending a signal to the Xilinx
System Ace FPGA control chip, which in turn loads the corresponding bit file for the extension into the “soft fabric” of
the reconfigurable hardware (Appendix A:Poster 5). The extension then sends an interrupt signal to the on-chip Bus
Master (on the “hard fabric”) to indicate that it needs to be configured. The Bus Master acts as a bridge between the
extension peripheral and the memory controller and is used to configure the extension peripheral. All the resources
requested by the peripheral (including the interrupt request, if any) are passed to the memory controller via the Bus
Master. When the peripheral is configured it communicates directly with the memory controller, bypassing the Bus
Master. Once the system software is finished using the peripheral, it can unload it, freeing up both the portion of the
memory address space used by the peripheral as well as the reconfigurable extension slot which can then be reused by
another extension.
2 Demonstrations
2.1 Load and Unload Simulation Our first demonstration presented the overall plan for extensible on-chip peripherals. We presented a test performing the
processes of loading an extension peripheral and then unloading it. The software program “pload” was compiled for
eMIPS and then executed on the Giano simulator, configured for the ML401 board.
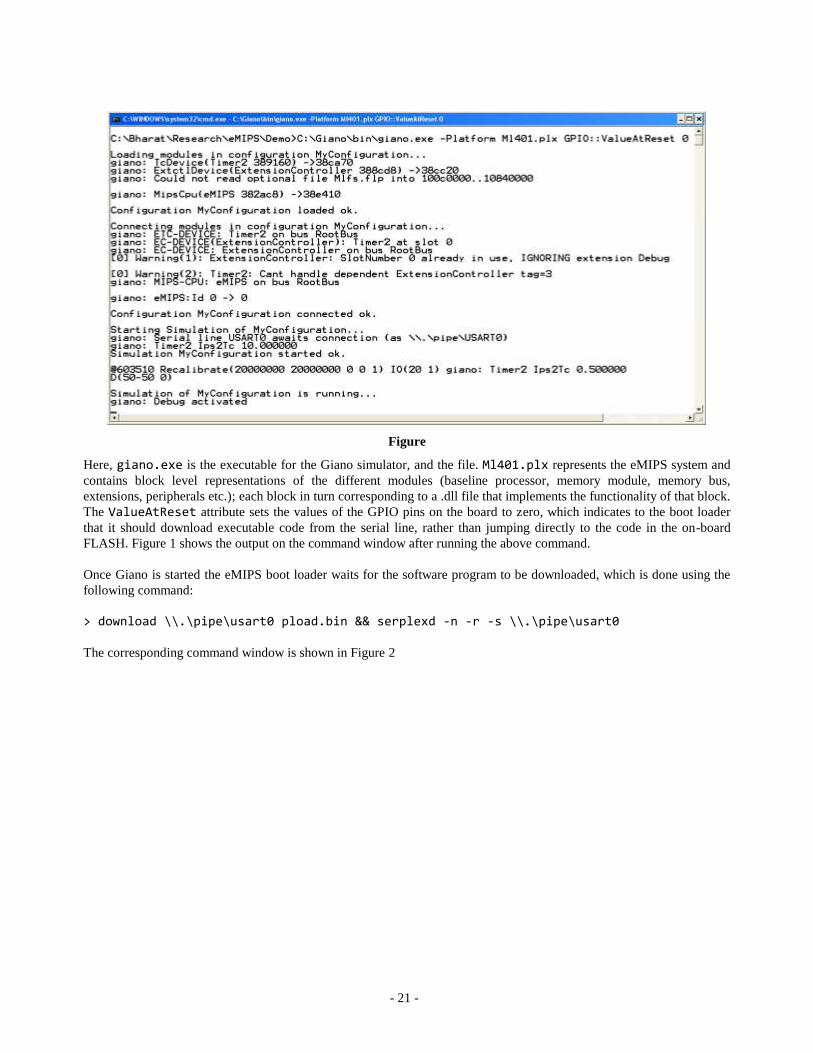
The Giano simulation of the eMIPS processor is started by executing the following command
> giano.exe -Platform Ml401.plx GPIO::ValueAtReset 0
- 21 -
Figure
Here, giano.exe is the executable for the Giano simulator, and the file. Ml401.plx represents the eMIPS system and
contains block level representations of the different modules (baseline processor, memory module, memory bus,
extensions, peripherals etc.); each block in turn corresponding to a .dll file that implements the functionality of that block.
The ValueAtReset attribute sets the values of the GPIO pins on the board to zero, which indicates to the boot loader
that it should download executable code from the serial line, rather than jumping directly to the code in the on-board
FLASH. Figure 1 shows the output on the command window after running the above command.
Once Giano is started the eMIPS boot loader waits for the software program to be downloaded, which is done using the
following command:
> download \\.\pipe\usart0 pload.bin && serplexd -n -r -s \\.\pipe\usart0
The corresponding command window is shown in Figure 2
- 22 -
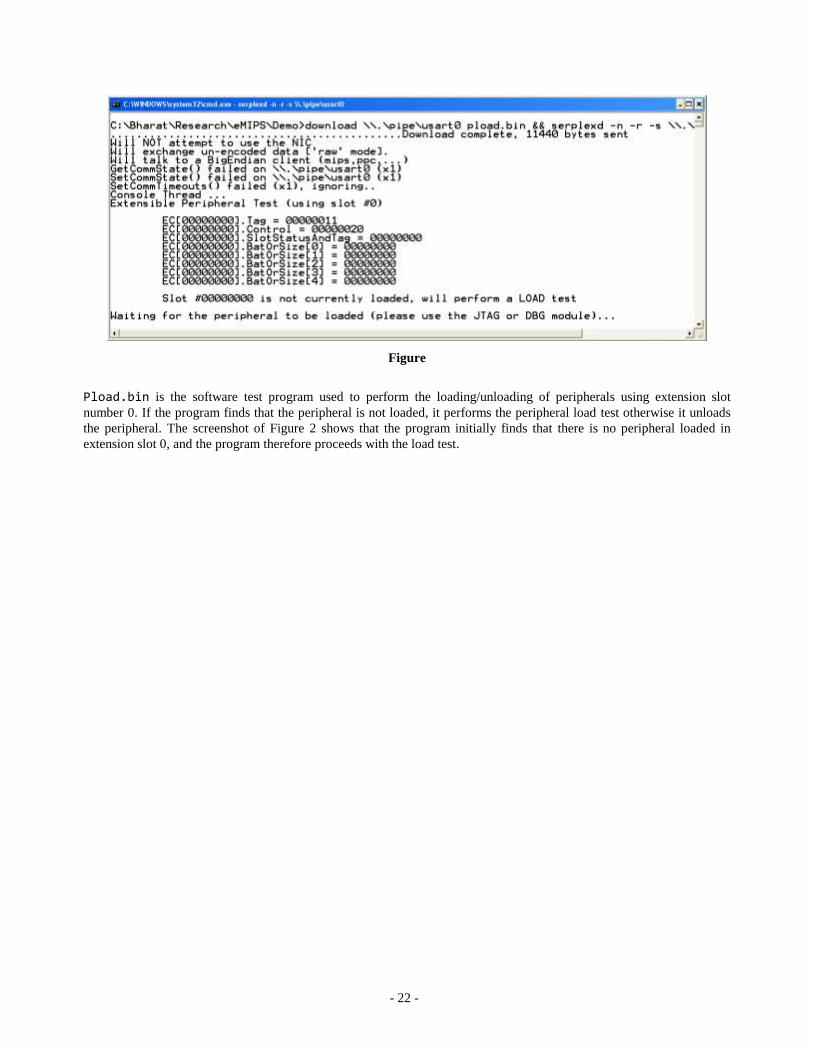
Figure
Pload.bin is the software test program used to perform the loading/unloading of peripherals using extension slot
number 0. If the program finds that the peripheral is not loaded, it performs the peripheral load test otherwise it unloads
the peripheral. The screenshot of Figure 2 shows that the program initially finds that there is no peripheral loaded in
extension slot 0, and the program therefore proceeds with the load test.
- 23 -
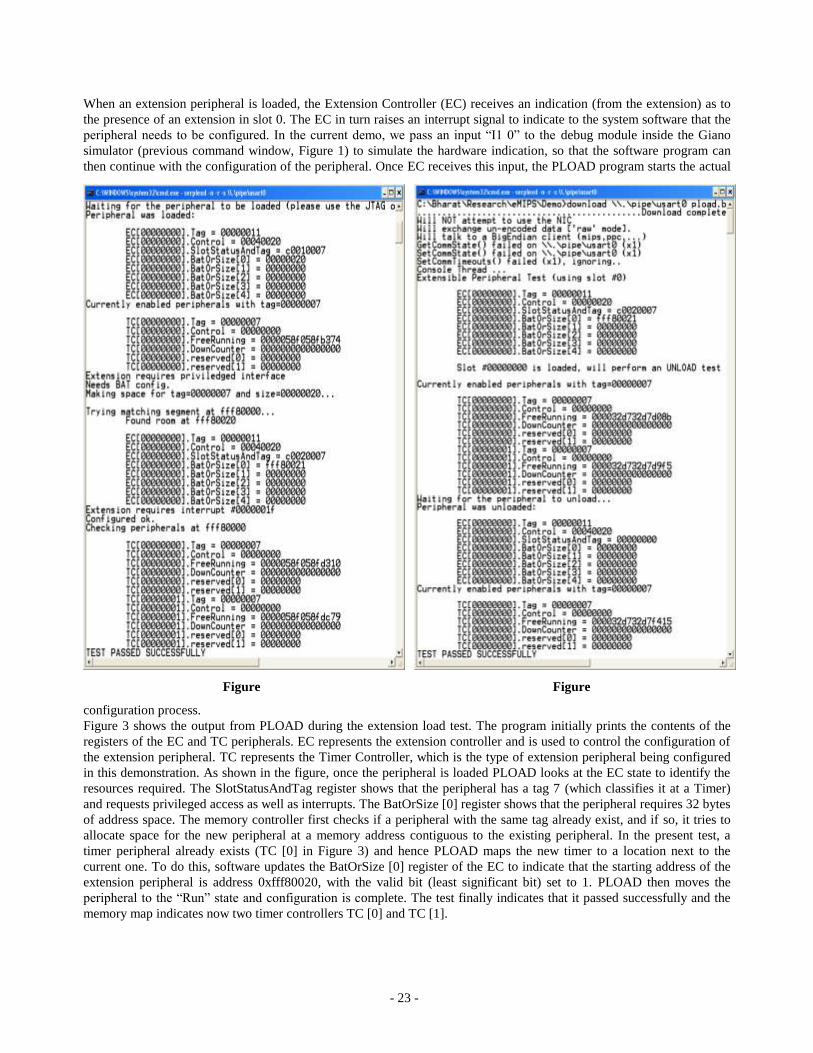
When an extension peripheral is loaded, the Extension Controller (EC) receives an indication (from the extension) as to
the presence of an extension in slot 0. The EC in turn raises an interrupt signal to indicate to the system software that the
peripheral needs to be configured. In the current demo, we pass an input “I1 0” to the debug module inside the Giano
simulator (previous command window, Figure 1) to simulate the hardware indication, so that the software program can
then continue with the configuration of the peripheral. Once EC receives this input, the PLOAD program starts the actual
configuration process.
Figure 3 shows the output from PLOAD during the extension load test. The program initially prints the contents of the
registers of the EC and TC peripherals. EC represents the extension controller and is used to control the configuration of
the extension peripheral. TC represents the Timer Controller, which is the type of extension peripheral being configured
in this demonstration. As shown in the figure, once the peripheral is loaded PLOAD looks at the EC state to identify the
resources required. The SlotStatusAndTag register shows that the peripheral has a tag 7 (which classifies it at a Timer)
and requests privileged access as well as interrupts. The BatOrSize [0] register shows that the peripheral requires 32 bytes
of address space. The memory controller first checks if a peripheral with the same tag already exist, and if so, it tries to
allocate space for the new peripheral at a memory address contiguous to the existing peripheral. In the present test, a
timer peripheral already exists (TC [0] in Figure 3) and hence PLOAD maps the new timer to a location next to the
current one. To do this, software updates the BatOrSize [0] register of the EC to indicate that the starting address of the
extension peripheral is address 0xfff80020, with the valid bit (least significant bit) set to 1. PLOAD then moves the
peripheral to the “Run” state and configuration is complete. The test finally indicates that it passed successfully and the
memory map indicates now two timer controllers TC [0] and TC [1].
Figure
Figure
- 24 -
Figure 4 shows the output on the command window when the test is run again. In this case, the peripheral is already
loaded in slot 0 and the test will therefore try to unload it. PLOAD writes to the SlotStatusAndTag register a new value
for the state machine that controls the peripheral (see Appendix A Poster 5). As indicated, writing a value of Absent will
inactivate the peripheral and notify the EC of the event. PLOAD notices this event (“Peripheral was unloaded” in Figure
4) and dumps the content of EC. The SlotStatusAndTag register shows the extension slot 0 is now free, because the
extension peripheral was successfully unloaded. This leaves only a single timer controller TC[0] in the memory map.
2.2 Accessing Physical Memory from an Extension Our second demonstration presented our progress towards implementing the extensible on-chip peripherals on the FPGA.
Some peripherals need privileged physical memory access to the system memory bus. The purpose of this demo is to
show the capability of memory access from the extension. This feature has been successfully implemented, as shown by
the current demo.
We augmented the eMIPS processor ISA with an extended instruction that replaces the basic block executed for returning
from a function call. The basic block consists of the following instructions
lw ra (immediate - 8)(sp)
jr ra
addiu sp sp immediate
The first instruction loads the return address at an offset from the current value of the stack pointer register. The second
instruction jumps to the return address. The third instruction is the so-called “delay slot”, on the MIPS architecture it is
also executed as part of the previous jump instruction. In this case the instruction pops the stack frame.
The extended instruction used to replace that basic block is
op7c ra sp immediate
Figure
The extended instruction encodes the three parameters that define the original basic block, namely the size of the stack
frame, the register that acts as stack pointer and the one that acts as the return address.
Our demo runs a simple program that performs a function call in a loop. After every return from the function, the calling
function prints a string indicating that the control has returned. We patched the binary of this program (using the
automatic binary patching tool part of the bbtools) to insert the extended instruction before the above mentioned basic

- 25 -
block. We then run this binary on the eMIPS processor implemented on the Xilinx FPGA on the ML401 development
board.
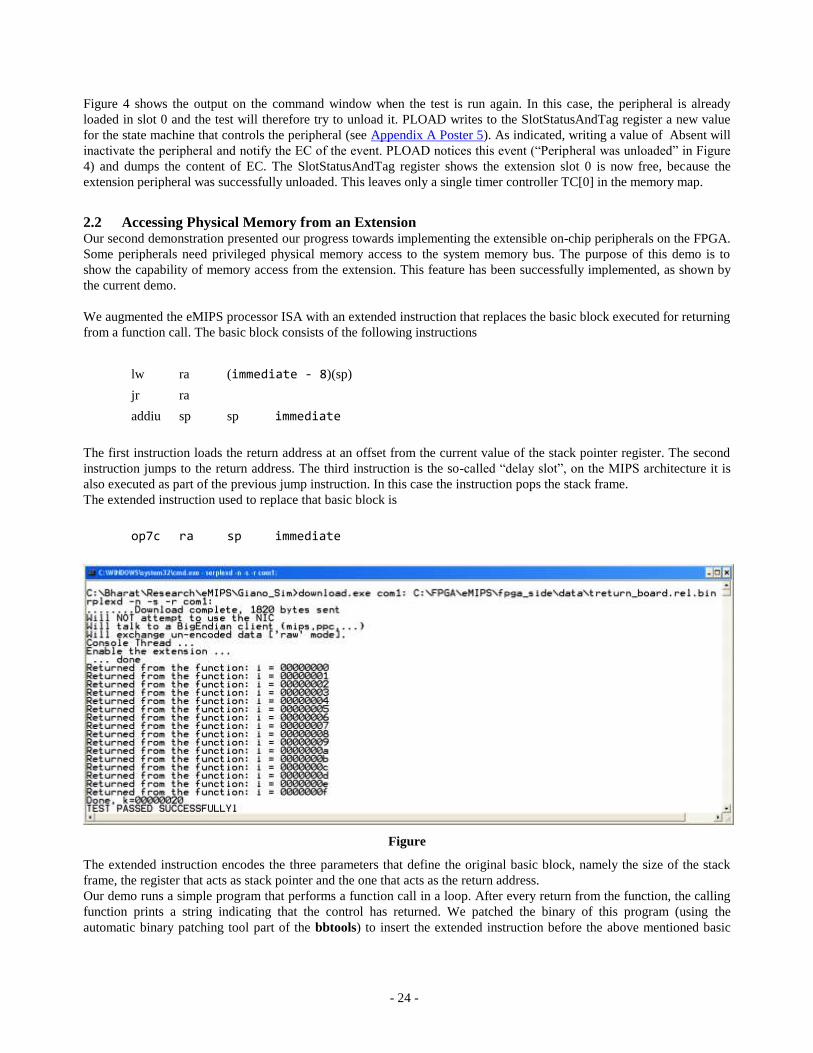
Figure 5 shows the result of running the demo program on the board. Treturn.rel.bin is the patched binary which is
downloaded to the FPGA board using the com1: serial line. As shown, the program calls the function 16 times and each
time prints a string after returning from the call. After the loop has been executed, the program displays the success
message.
- 26 -
Project P2V: An Architecture for Zero-Overhead Online
Verification of Software Programs
Hong Lu
Texas A&M University
Alessandro Forin
Microsoft Research
Abstract
The PSL-to-Verilog (P2V) compiler translates a set of assertions about a block-structured software program into a hardware design
to be executed concurrently with the execution of the software program. The assertions validate the correctness of the program
without altering its temporal behavior in any way, a result that has never been previously achieved by any online model-checking
system. The assertions are expressed in the simple subset of the IEEE Standard Property Specification Language PSL and the target
execution system is the eMIPS processor, a dynamically self-extensible processor. At the summit we demonstrated a working
prototype of the P2V compile, implemented in Python. The compiler generates code for the implementation of the eMIPS processor
running on the Xilinx ML401 development board. The input to the compiler is either a PSL file or it is typed by the user on the Python
interpreter’s interactive window. The output is a set of Verilog modules that implement the Verification Unit.
1 Introduction
In project P2V, we concern ourselves with zero-overhead monitors for software programs, monitors whose execution
does not interfere with the target programs. Zero-overhead monitoring involves both passive observation and online
verification. Passive observation refers to the non-intrusive collection of relevant information from an executing program,
and online verification refers to the detection of requirement violations on-the-fly at the earliest possible moment using
the collected information.
Most existing monitoring techniques are based on code instrumentation. Such techniques cause the unavoidable probe
effect which changes the timing behavior of the target program. P2V takes a different approach, where the monitoring
task is performed by a separate piece of hardware which is generated automatically from the PSL specification. As a
result, the executable of the software program does not need to be modified, and furthermore, its temporal behavior does
not change in any way.
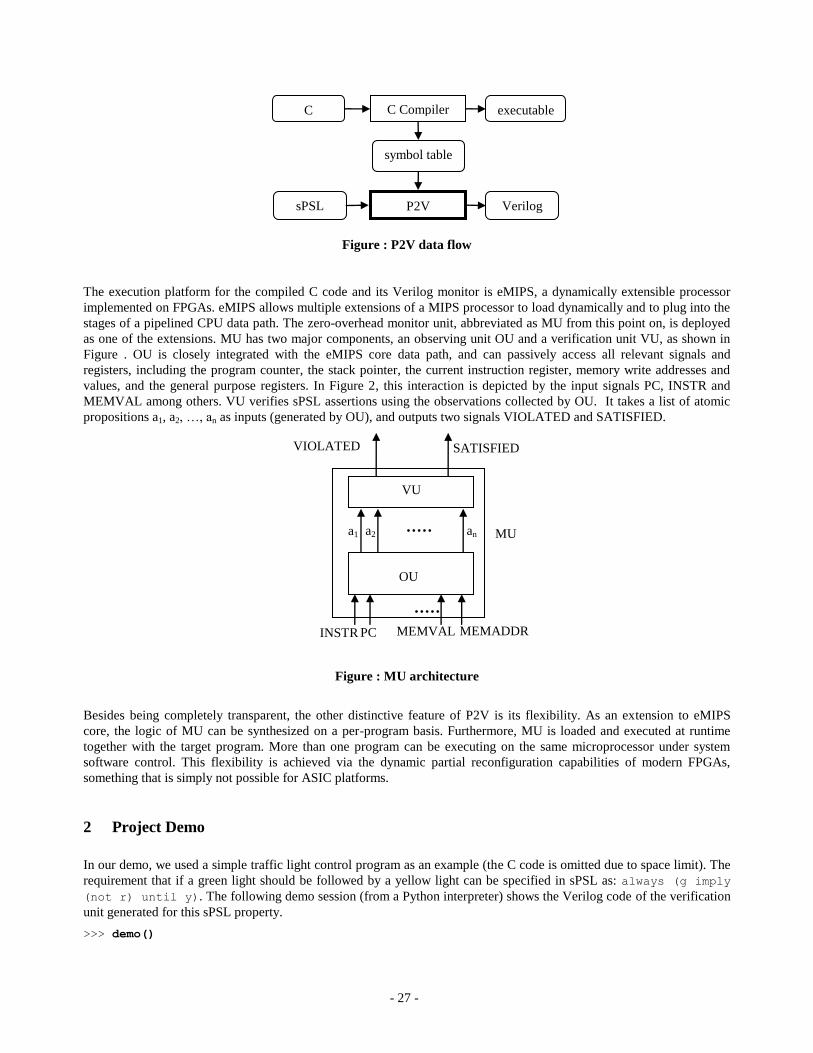
Software correctness specifications are expressed in sPSL, a subset of PSL adapted for C requirement specifications. The
dataflow of P2V is shown in Figure . The top side of the diagram depicts the normal compilation flow for C, using the
standard compiler and tools and resulting in the executable image file. The bottom part of the diagram shows the
symmetric flow for the sPSL specifications, where the P2V compiler translates sPSL assertions into Verilog code. Then
the manufacturer‟s FPGA tools take this Verilog source file and create the binary file that is actually used for partial
reconfiguration of the FPGA at run time, when the program is started. When compiling a sPSL specification, P2V uses
the symbol table generated by the C compiler to keep track of C objects.
- 27 -
Figure : P2V data flow
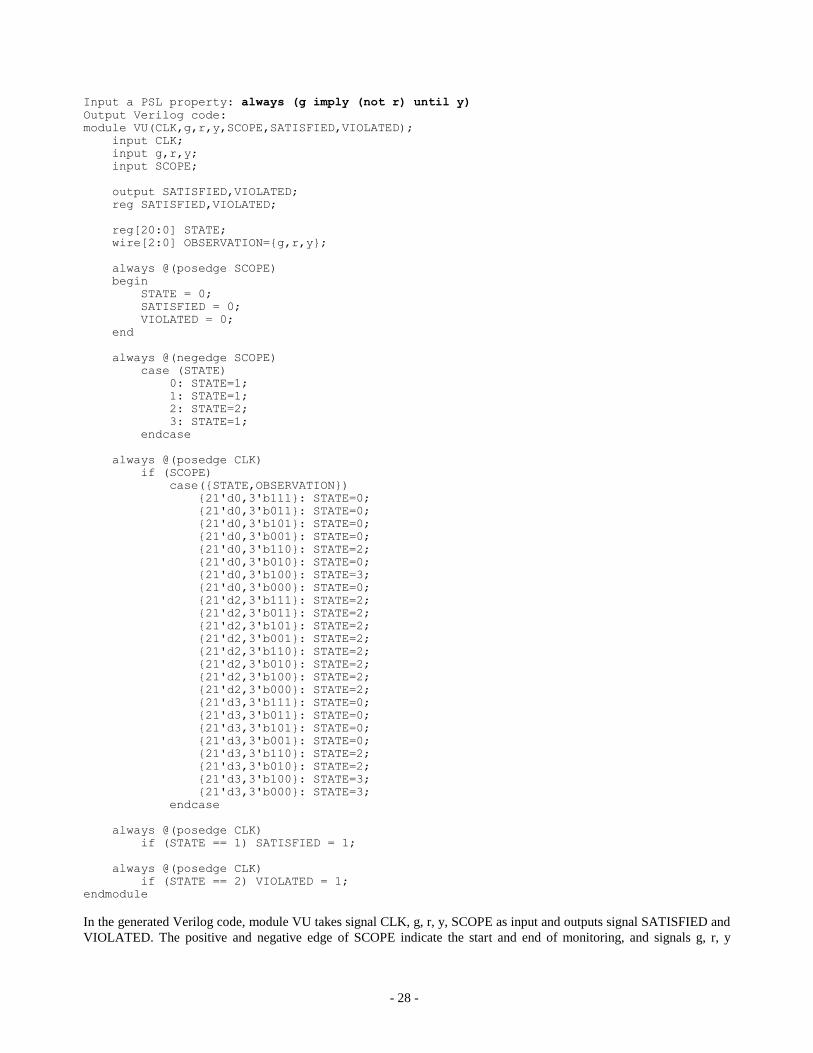
The execution platform for the compiled C code and its Verilog monitor is eMIPS, a dynamically extensible processor
implemented on FPGAs. eMIPS allows multiple extensions of a MIPS processor to load dynamically and to plug into the
stages of a pipelined CPU data path. The zero-overhead monitor unit, abbreviated as MU from this point on, is deployed
as one of the extensions. MU has two major components, an observing unit OU and a verification unit VU, as shown in
Figure . OU is closely integrated with the eMIPS core data path, and can passively access all relevant signals and
registers, including the program counter, the stack pointer, the current instruction register, memory write addresses and
values, and the general purpose registers. In Figure 2, this interaction is depicted by the input signals PC, INSTR and
MEMVAL among others. VU verifies sPSL assertions using the observations collected by OU. It takes a list of atomic
propositions a1, a2, …, an as inputs (generated by OU), and outputs two signals VIOLATED and SATISFIED.
Figure : MU architecture
Besides being completely transparent, the other distinctive feature of P2V is its flexibility. As an extension to eMIPS
core, the logic of MU can be synthesized on a per-program basis. Furthermore, MU is loaded and executed at runtime
together with the target program. More than one program can be executing on the same microprocessor under system
software control. This flexibility is achieved via the dynamic partial reconfiguration capabilities of modern FPGAs,
something that is simply not possible for ASIC platforms.
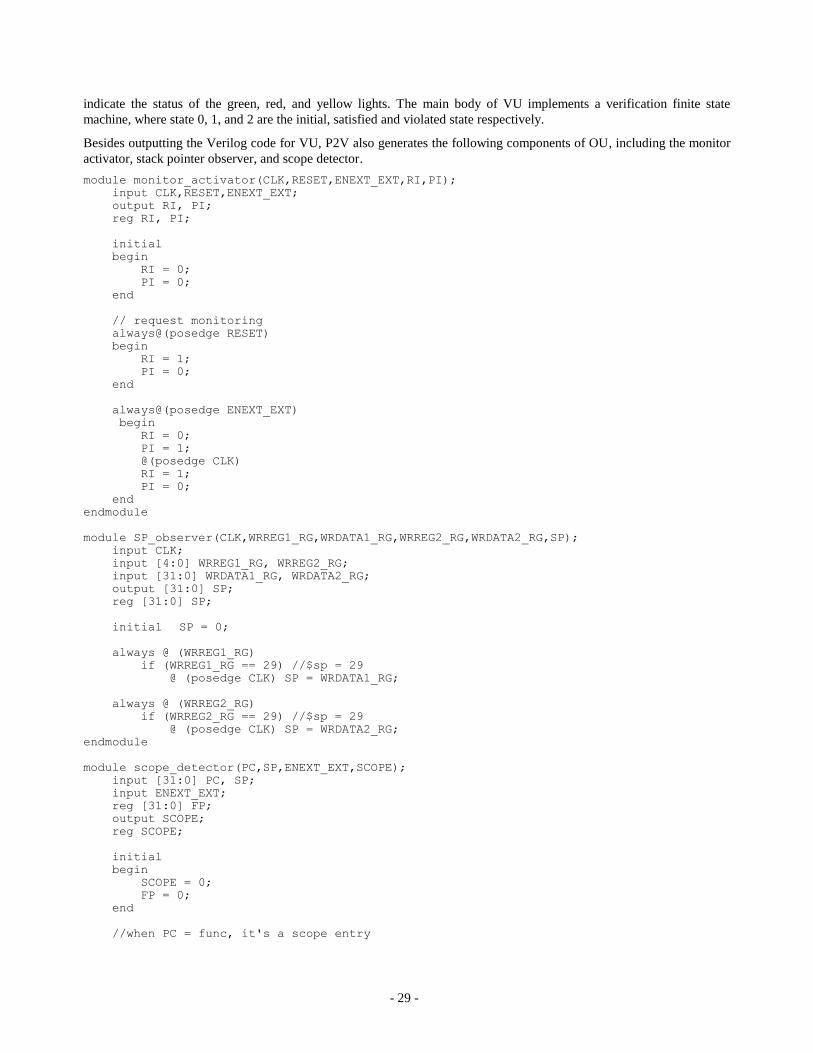
2 Project Demo
In our demo, we used a simple traffic light control program as an example (the C code is omitted due to space limit). The
requirement that if a green light should be followed by a yellow light can be specified in sPSL as: always (g imply
(not r) until y). The following demo session (from a Python interpreter) shows the Verilog code of the verification
unit generated for this sPSL property.
>>> demo()
VU
a1 a2 an
PC
MU
MEMVAL
OU
VIOLATED SATISFIED
MEMADDR INSTR
C
sPSL
C Compiler
P2V
compiler
Verilog
executable
symbol table
- 28 -
Input a PSL property: always (g imply (not r) until y)
Output Verilog code:
module VU(CLK,g,r,y,SCOPE,SATISFIED,VIOLATED);
input CLK;
input g,r,y;
input SCOPE;
output SATISFIED,VIOLATED;
reg SATISFIED,VIOLATED;
reg[20:0] STATE;
wire[2:0] OBSERVATION={g,r,y};
always @(posedge SCOPE)
begin
STATE = 0;
SATISFIED = 0;
VIOLATED = 0;
end
always @(negedge SCOPE)
case (STATE)
0: STATE=1;
1: STATE=1;
2: STATE=2;
3: STATE=1;
endcase
always @(posedge CLK)
if (SCOPE)
case({STATE,OBSERVATION})
{21'd0,3'b111}: STATE=0;
{21'd0,3'b011}: STATE=0;
{21'd0,3'b101}: STATE=0;
{21'd0,3'b001}: STATE=0;
{21'd0,3'b110}: STATE=2;
{21'd0,3'b010}: STATE=0;
{21'd0,3'b100}: STATE=3;
{21'd0,3'b000}: STATE=0;
{21'd2,3'b111}: STATE=2;
{21'd2,3'b011}: STATE=2;
{21'd2,3'b101}: STATE=2;
{21'd2,3'b001}: STATE=2;
{21'd2,3'b110}: STATE=2;
{21'd2,3'b010}: STATE=2;
{21'd2,3'b100}: STATE=2;
{21'd2,3'b000}: STATE=2;
{21'd3,3'b111}: STATE=0;
{21'd3,3'b011}: STATE=0;
{21'd3,3'b101}: STATE=0;
{21'd3,3'b001}: STATE=0;
{21'd3,3'b110}: STATE=2;
{21'd3,3'b010}: STATE=2;
{21'd3,3'b100}: STATE=3;
{21'd3,3'b000}: STATE=3;
endcase
always @(posedge CLK)
if (STATE == 1) SATISFIED = 1;
always @(posedge CLK)
if (STATE == 2) VIOLATED = 1;
endmodule
In the generated Verilog code, module VU takes signal CLK, g, r, y, SCOPE as input and outputs signal SATISFIED and
VIOLATED. The positive and negative edge of SCOPE indicate the start and end of monitoring, and signals g, r, y
- 29 -
indicate the status of the green, red, and yellow lights. The main body of VU implements a verification finite state
machine, where state 0, 1, and 2 are the initial, satisfied and violated state respectively.
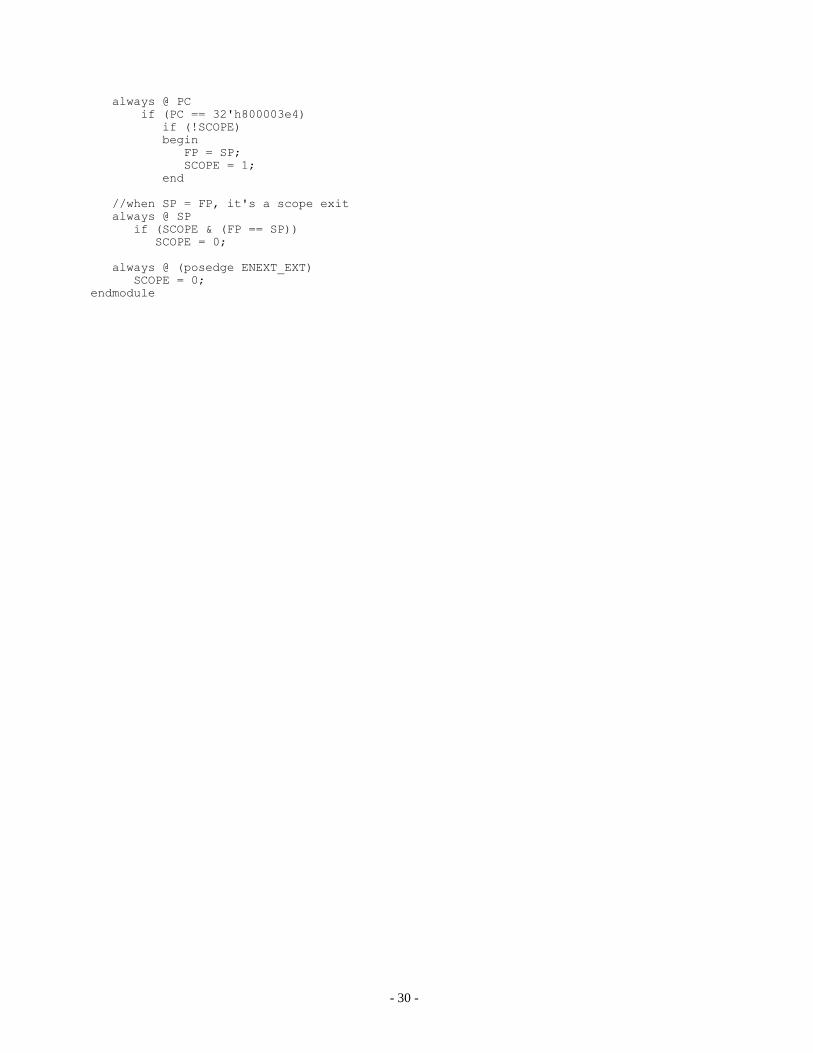
Besides outputting the Verilog code for VU, P2V also generates the following components of OU, including the monitor
activator, stack pointer observer, and scope detector.
module monitor_activator(CLK,RESET,ENEXT_EXT,RI,PI);
input CLK,RESET,ENEXT_EXT;
output RI, PI;
reg RI, PI;
initial
begin
RI = 0;
PI = 0;
end
// request monitoring
always@(posedge RESET)
begin
RI = 1;
PI = 0;
end
always@(posedge ENEXT_EXT)
begin
RI = 0;
PI = 1;
@(posedge CLK)
RI = 1;
PI = 0;
end
endmodule
module SP_observer(CLK,WRREG1_RG,WRDATA1_RG,WRREG2_RG,WRDATA2_RG,SP);
input CLK;
input [4:0] WRREG1_RG, WRREG2_RG;
input [31:0] WRDATA1_RG, WRDATA2_RG;
output [31:0] SP;
reg [31:0] SP;
initial SP = 0;
always @ (WRREG1_RG)
if (WRREG1_RG == 29) //$sp = 29
@ (posedge CLK) SP = WRDATA1_RG;
always @ (WRREG2_RG)
if (WRREG2_RG == 29) //$sp = 29
@ (posedge CLK) SP = WRDATA2_RG;
endmodule
module scope_detector(PC,SP,ENEXT_EXT,SCOPE);
input [31:0] PC, SP;
input ENEXT_EXT;
reg [31:0] FP;
output SCOPE;
reg SCOPE;
initial
begin
SCOPE = 0;
FP = 0;
end
//when PC = func, it's a scope entry
- 30 -
always @ PC
if (PC == 32'h800003e4)
if (!SCOPE)
begin
FP = SP;
SCOPE = 1;
end
//when SP = FP, it's a scope exit
always @ SP
if (SCOPE & (FP == SP))
SCOPE = 0;
always @ (posedge ENEXT_EXT)
SCOPE = 0;
endmodule
- 31 -
Project M2V
Karl Meier
University of Washington
Alessandro Forin
Microsoft Research
Abstract
The MIPS-to-Verilog (M2V) compiler translates blocks of MIPS machine code into a hardware design represented
in Verilog. The design constitutes an Extension for the eMIPS processor, a dynamically extensible processor realized on
the Virtex-4 XC4LX25 FPGA. The Extension interacts closely with the basic pipeline of the microprocessor and
recognizes special Extended instructions, instructions that are not part of the basic MIPS ISA. Each instruction is
semantically equivalent to one or more blocks of MIPS code. The purpose of the M2V compiler is to automate the
process of creating Extensions for the specific purpose of accelerating the execution of software programs.
At the summit we demonstrated the current state of the compiler, which is implemented as a C++ program. The
compiler accepts as input basic blocks in the form generated by the eMIPS bbtools, a set of programs for the analysis
and instrumentation of MIPS ELF images. The parser recognizes the full MIPS ISA and creates a graph representing the
dependencies between instructions and between registers. The semantic analysis is currently restricted to the R set of
instructions. The scheduling algorithm is complete but the timing analysis is not yet sufficient to produce correct outputs.
1 Introduction
The eMIPS platform consists of a standard MIPS pipeline and an extension unit (EU). The EU contains programmable
logic that is used for extensions to the MIPS instruction set. These extensions are used to accelerate the execution of an
application. The machine code for the extended instruction is inserted before the accelerated basic block in the MIPS
binary. When the extended instruction completes, program execution will proceed at the address following the basic
block or at the address of a branch target.
The objective for the M2V compiler is to automatically create the logic for eMIPS extensions using a .bbw file as the
hardware specification. The .bbw file is a basic block that is extracted from a MIPS binary image using the bbtools. A
basic block is a candidate for extension when it is identified as a block that takes considerable execution time when an
application is running. The Giano simulator and the bbtools are used to identify the blocks that should be accelerated.
The M2V compiler generates synthesizable Verilog which is synthesized using the standard Xilinx place and route tool-
chain to create a bit file that can be loaded onto the eMIPS platform. In an embedded platform, the extension can be
loaded at power-up. In a more general purpose system, the extension can be dynamically loaded when a binary image is
loaded. Dynamic loading of the extension requires partial reconfiguration of the programmable logic.
2 M2V Compiler Implementation
The M2V compiler is a multi-pass compiler. The first pass parses the .bbw file, semantically analyzes the MIPS
instructions, and builds and connects nodes in a dependency graph. There are two types of nodes in the graph: register
nodes and instruction nodes. The semantic analysis provides the function and cost for each instruction and also the
register dependencies. The register nodes represent a register access which could go to the register file or to a temporary
storage location in the EU. The register table tracks whether a register has already been read from the register file, where
- 32 -
the last update to the register is stored, and whether the register needs to be written back to the register file. When
multiple instructions read the same unchanged register value, the register table provides information so only a single
register node is created. Register nodes may or may not result in an actual clocked hardware register. The final schedule
for the extension determines when pipeline stages are added and whether a register node will result in a hardware register.
A major challenge for the M2V compiler is to constrain the EU such that it does not interfere with instructions flowing
through the eMIPS pipeline before and after the extended instruction executes. eMIPS uses a standard five stage RISC
pipeline, with IF, ID, EX, MA, and WB stages. This pipeline is tightly integrated with the EU. An extended instruction
will take multiple cycles to execute since it is semantically equivalent to all of the MIPS instructions in a basic block.
During ID, the extension will snoop the register reads that are visible to the primary eMIPS pipeline. If the instruction is
an extended instruction, the EU will claim the instruction and stall the instructions behind it while it executes.
Instructions before the extended instruction complete normally and must have access to the same resources that they
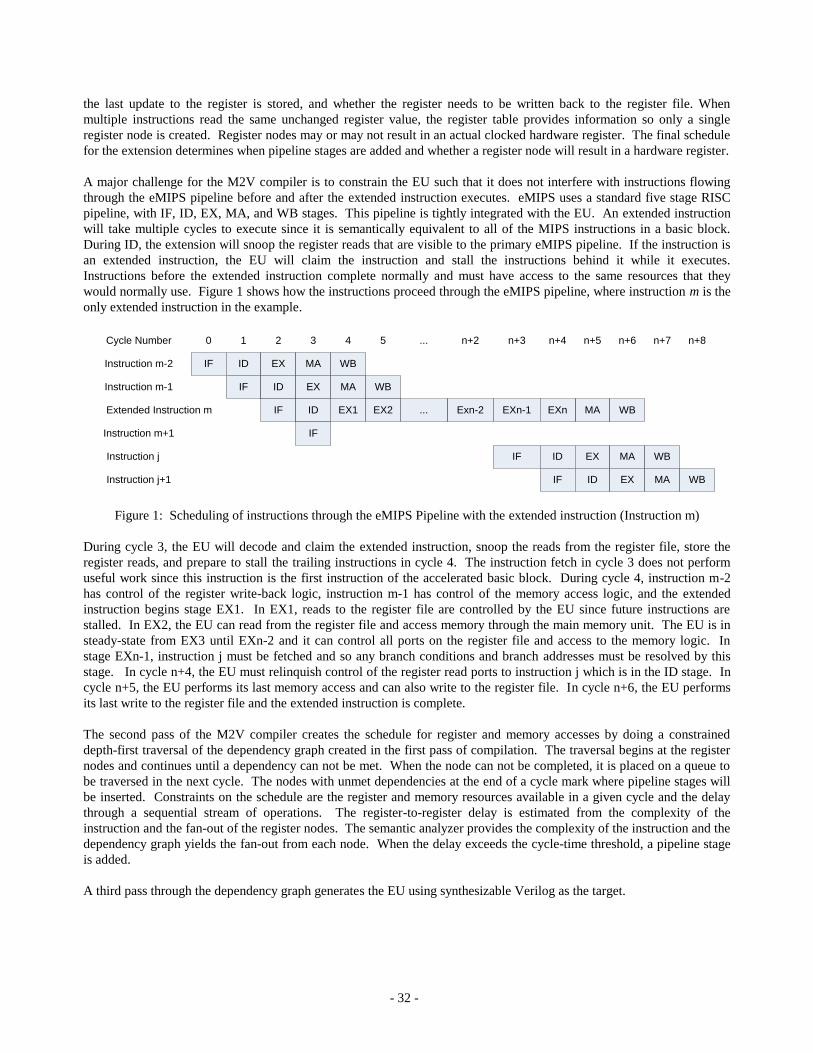
would normally use. Figure 1 shows how the instructions proceed through the eMIPS pipeline, where instruction m is the
only extended instruction in the example.
IF ID EX MA
EX1
WB
IF ID EX MA WB
IF ID EX2 MA WBEXn-1Exn-2 EXn...
IF ID EX MA WB
IF ID EX MA WB
Instruction m-2
Instruction m-1
Extended Instruction m
Instruction j
Instruction j+1
Cycle Number 0 1 2 3 4 5 n+2 n+3 n+4 n+5 n+6 n+7 n+8...
IFInstruction m+1
Figure 1: Scheduling of instructions through the eMIPS Pipeline with the extended instruction (Instruction m)
During cycle 3, the EU will decode and claim the extended instruction, snoop the reads from the register file, store the
register reads, and prepare to stall the trailing instructions in cycle 4. The instruction fetch in cycle 3 does not perform
useful work since this instruction is the first instruction of the accelerated basic block. During cycle 4, instruction m-2
has control of the register write-back logic, instruction m-1 has control of the memory access logic, and the extended
instruction begins stage EX1. In EX1, reads to the register file are controlled by the EU since future instructions are
stalled. In EX2, the EU can read from the register file and access memory through the main memory unit. The EU is in
steady-state from EX3 until EXn-2 and it can control all ports on the register file and access to the memory logic. In
stage EXn-1, instruction j must be fetched and so any branch conditions and branch addresses must be resolved by this
stage. In cycle n+4, the EU must relinquish control of the register read ports to instruction j which is in the ID stage. In
cycle n+5, the EU performs its last memory access and can also write to the register file. In cycle n+6, the EU performs
its last write to the register file and the extended instruction is complete.
The second pass of the M2V compiler creates the schedule for register and memory accesses by doing a constrained
depth-first traversal of the dependency graph created in the first pass of compilation. The traversal begins at the register
nodes and continues until a dependency can not be met. When the node can not be completed, it is placed on a queue to
be traversed in the next cycle. The nodes with unmet dependencies at the end of a cycle mark where pipeline stages will
be inserted. Constraints on the schedule are the register and memory resources available in a given cycle and the delay
through a sequential stream of operations. The register-to-register delay is estimated from the complexity of the
instruction and the fan-out of the register nodes. The semantic analyzer provides the complexity of the instruction and the
dependency graph yields the fan-out from each node. When the delay exceeds the cycle-time threshold, a pipeline stage
is added.
A third pass through the dependency graph generates the EU using synthesizable Verilog as the target.
- 33 -
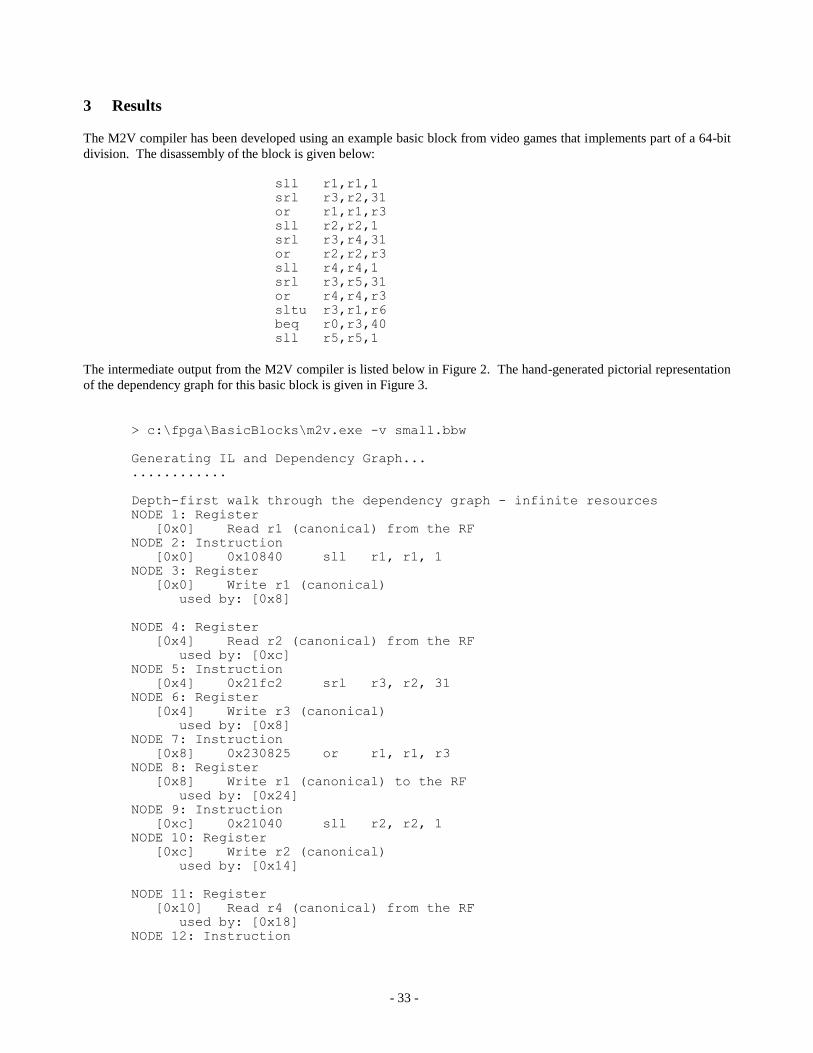
3 Results
The M2V compiler has been developed using an example basic block from video games that implements part of a 64-bit
division. The disassembly of the block is given below:
sll r1,r1,1
srl r3,r2,31
or r1,r1,r3
sll r2,r2,1
srl r3,r4,31
or r2,r2,r3
sll r4,r4,1
srl r3,r5,31
or r4,r4,r3
sltu r3,r1,r6
beq r0,r3,40
sll r5,r5,1
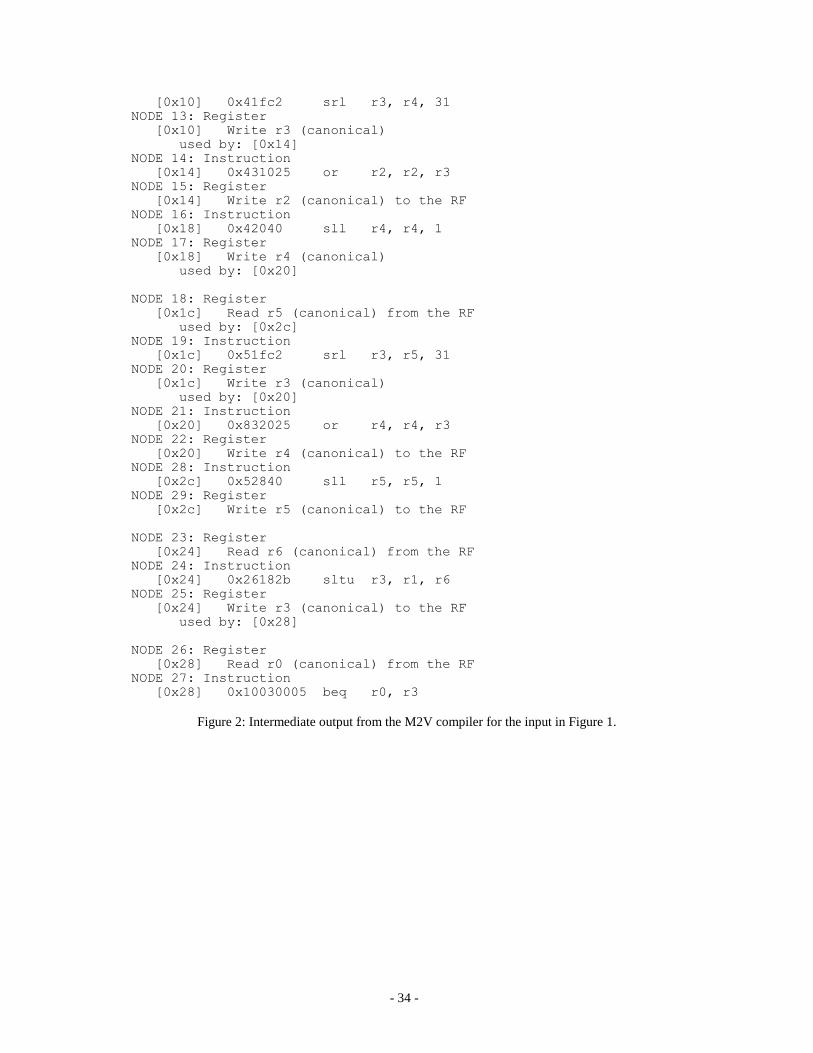
The intermediate output from the M2V compiler is listed below in Figure 2. The hand-generated pictorial representation
of the dependency graph for this basic block is given in Figure 3.
> c:\fpga\BasicBlocks\m2v.exe -v small.bbw
Generating IL and Dependency Graph...
............
Depth-first walk through the dependency graph - infinite resources
NODE 1: Register
[0x0] Read r1 (canonical) from the RF
NODE 2: Instruction
[0x0] 0x10840 sll r1, r1, 1
NODE 3: Register
[0x0] Write r1 (canonical)
used by: [0x8]
NODE 4: Register
[0x4] Read r2 (canonical) from the RF
used by: [0xc]
NODE 5: Instruction
[0x4] 0x21fc2 srl r3, r2, 31
NODE 6: Register
[0x4] Write r3 (canonical)
used by: [0x8]
NODE 7: Instruction
[0x8] 0x230825 or r1, r1, r3
NODE 8: Register
[0x8] Write r1 (canonical) to the RF
used by: [0x24]
NODE 9: Instruction
[0xc] 0x21040 sll r2, r2, 1
NODE 10: Register
[0xc] Write r2 (canonical)
used by: [0x14]
NODE 11: Register
[0x10] Read r4 (canonical) from the RF
used by: [0x18]
NODE 12: Instruction
- 34 -
[0x10] 0x41fc2 srl r3, r4, 31
NODE 13: Register
[0x10] Write r3 (canonical)
used by: [0x14]
NODE 14: Instruction
[0x14] 0x431025 or r2, r2, r3
NODE 15: Register
[0x14] Write r2 (canonical) to the RF
NODE 16: Instruction
[0x18] 0x42040 sll r4, r4, 1
NODE 17: Register
[0x18] Write r4 (canonical)
used by: [0x20]
NODE 18: Register
[0x1c] Read r5 (canonical) from the RF
used by: [0x2c]
NODE 19: Instruction
[0x1c] 0x51fc2 srl r3, r5, 31
NODE 20: Register
[0x1c] Write r3 (canonical)
used by: [0x20]
NODE 21: Instruction
[0x20] 0x832025 or r4, r4, r3
NODE 22: Register
[0x20] Write r4 (canonical) to the RF
NODE 28: Instruction
[0x2c] 0x52840 sll r5, r5, 1
NODE 29: Register
[0x2c] Write r5 (canonical) to the RF
NODE 23: Register
[0x24] Read r6 (canonical) from the RF
NODE 24: Instruction
[0x24] 0x26182b sltu r3, r1, r6
NODE 25: Register
[0x24] Write r3 (canonical) to the RF
used by: [0x28]
NODE 26: Register
[0x28] Read r0 (canonical) from the RF
NODE 27: Instruction
[0x28] 0x10030005 beq r0, r3
Figure 2: Intermediate output from the M2V compiler for the input in Figure 1.
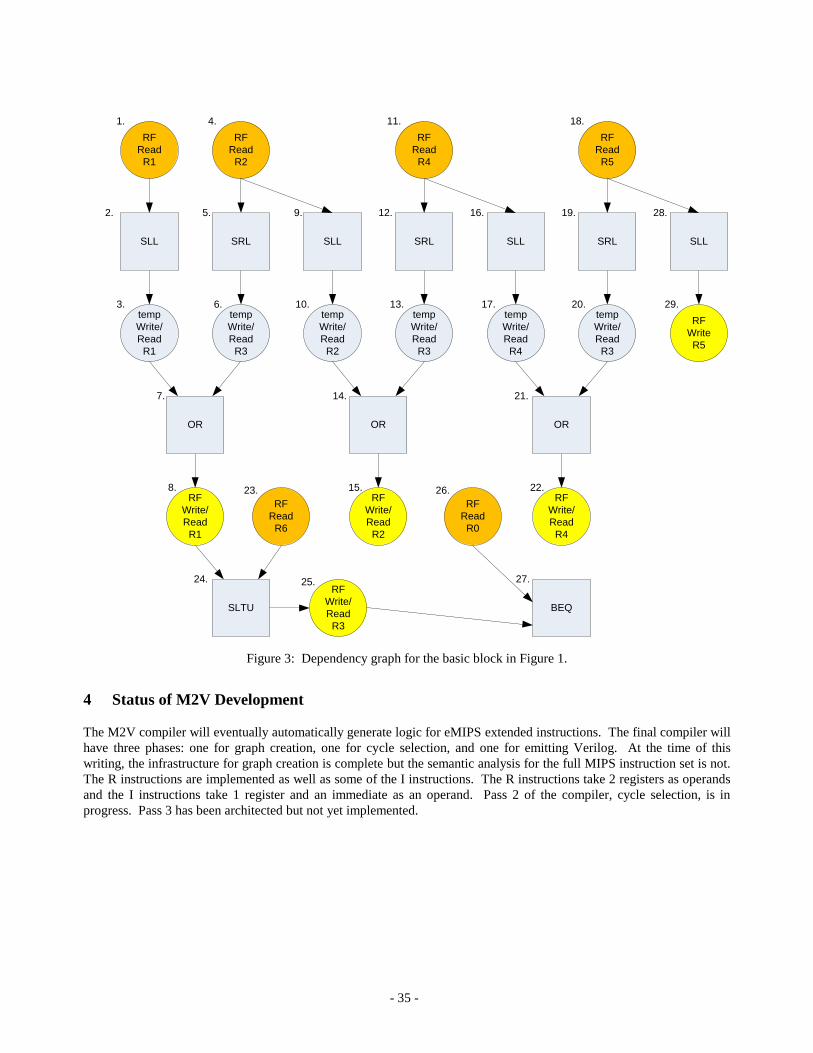
- 35 -
RF
Read
R1
temp
Write/
Read
R1
RF
Write/
Read
R1
RF
Read
R6
RF
Read
R2
temp
Write/
Read
R3
temp
Write/
Read
R2
RF
Write/
Read
R2
RF
Read
R4
temp
Write/
Read
R3
temp
Write/
Read
R4
RF
Write/
Read
R4
RF
Read
R5
temp
Write/
Read
R3
RF
Write
R5
RF
Write/
Read
R3
1.
2.
3.
4.
5.
6.
7.
8.
9.
10.
11.
13.
12.
14.
15.
16.
17.
18.
19.
20.
21.
22.23.
24. 25. 27.
28.
29.
SLL SLLSRL
OR
SRL SRLSLL SLL
OR OR
SLTU BEQ
RF
Read
R0
26.
Figure 3: Dependency graph for the basic block in Figure 1.
4 Status of M2V Development
The M2V compiler will eventually automatically generate logic for eMIPS extended instructions. The final compiler will
have three phases: one for graph creation, one for cycle selection, and one for emitting Verilog. At the time of this
writing, the infrastructure for graph creation is complete but the semantic analysis for the full MIPS instruction set is not.
The R instructions are implemented as well as some of the I instructions. The R instructions take 2 registers as operands
and the I instructions take 1 register and an immediate as an operand. Pass 2 of the compiler, cycle selection, is in
progress. Pass 3 has been architected but not yet implemented.
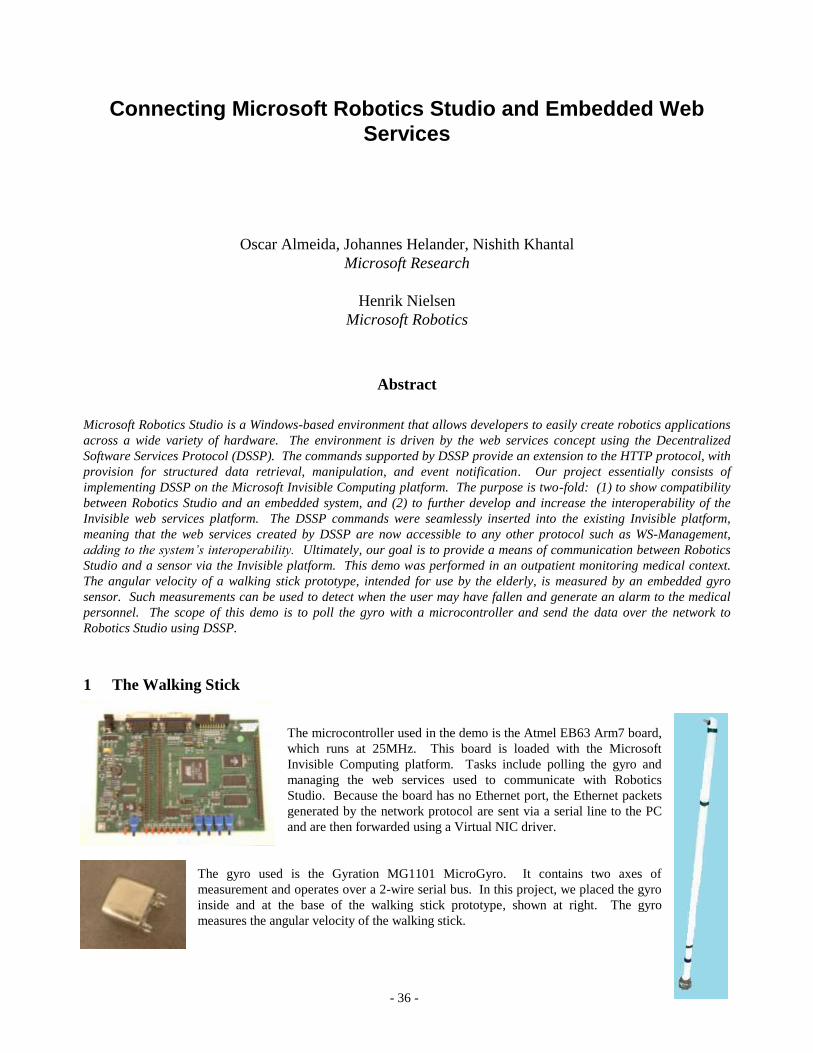
- 36 -
Connecting Microsoft Robotics Studio and Embedded Web
Services
Oscar Almeida, Johannes Helander, Nishith Khantal
Microsoft Research
Henrik Nielsen
Microsoft Robotics
Abstract
Microsoft Robotics Studio is a Windows-based environment that allows developers to easily create robotics applications
across a wide variety of hardware. The environment is driven by the web services concept using the Decentralized
Software Services Protocol (DSSP). The commands supported by DSSP provide an extension to the HTTP protocol, with
provision for structured data retrieval, manipulation, and event notification. Our project essentially consists of
implementing DSSP on the Microsoft Invisible Computing platform. The purpose is two-fold: (1) to show compatibility
between Robotics Studio and an embedded system, and (2) to further develop and increase the interoperability of the
Invisible web services platform. The DSSP commands were seamlessly inserted into the existing Invisible platform,
meaning that the web services created by DSSP are now accessible to any other protocol such as WS-Management,
adding to the system’s interoperability. Ultimately, our goal is to provide a means of communication between Robotics
Studio and a sensor via the Invisible platform. This demo was performed in an outpatient monitoring medical context.
The angular velocity of a walking stick prototype, intended for use by the elderly, is measured by an embedded gyro
sensor. Such measurements can be used to detect when the user may have fallen and generate an alarm to the medical
personnel. The scope of this demo is to poll the gyro with a microcontroller and send the data over the network to
Robotics Studio using DSSP.
1 The Walking Stick
The microcontroller used in the demo is the Atmel EB63 Arm7 board,
which runs at 25MHz. This board is loaded with the Microsoft
Invisible Computing platform. Tasks include polling the gyro and
managing the web services used to communicate with Robotics
Studio. Because the board has no Ethernet port, the Ethernet packets
generated by the network protocol are sent via a serial line to the PC
and are then forwarded using a Virtual NIC driver.
The gyro used is the Gyration MG1101 MicroGyro. It contains two axes of
measurement and operates over a 2-wire serial bus. In this project, we placed the gyro
inside and at the base of the walking stick prototype, shown at right. The gyro
measures the angular velocity of the walking stick.
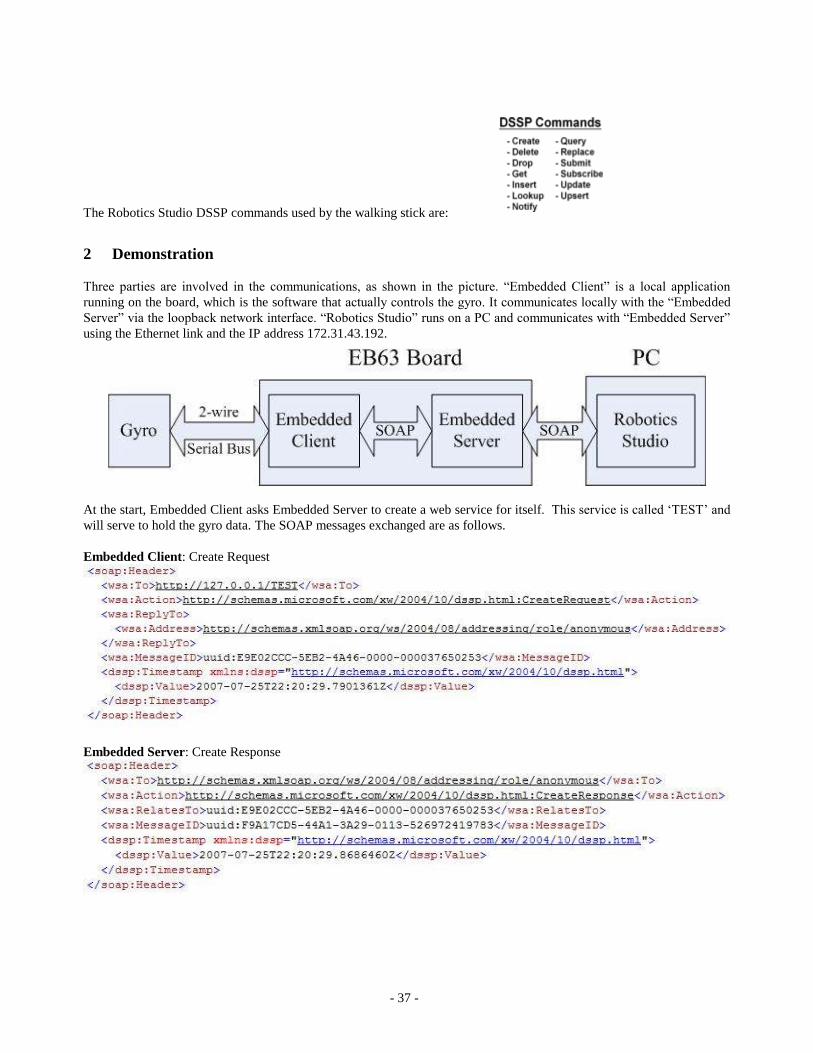
- 37 -
The Robotics Studio DSSP commands used by the walking stick are:
2 Demonstration
Three parties are involved in the communications, as shown in the picture. “Embedded Client” is a local application
running on the board, which is the software that actually controls the gyro. It communicates locally with the “Embedded
Server” via the loopback network interface. “Robotics Studio” runs on a PC and communicates with “Embedded Server”
using the Ethernet link and the IP address 172.31.43.192.
At the start, Embedded Client asks Embedded Server to create a web service for itself. This service is called „TEST‟ and
will serve to hold the gyro data. The SOAP messages exchanged are as follows.
Embedded Client: Create Request
Embedded Server: Create Response
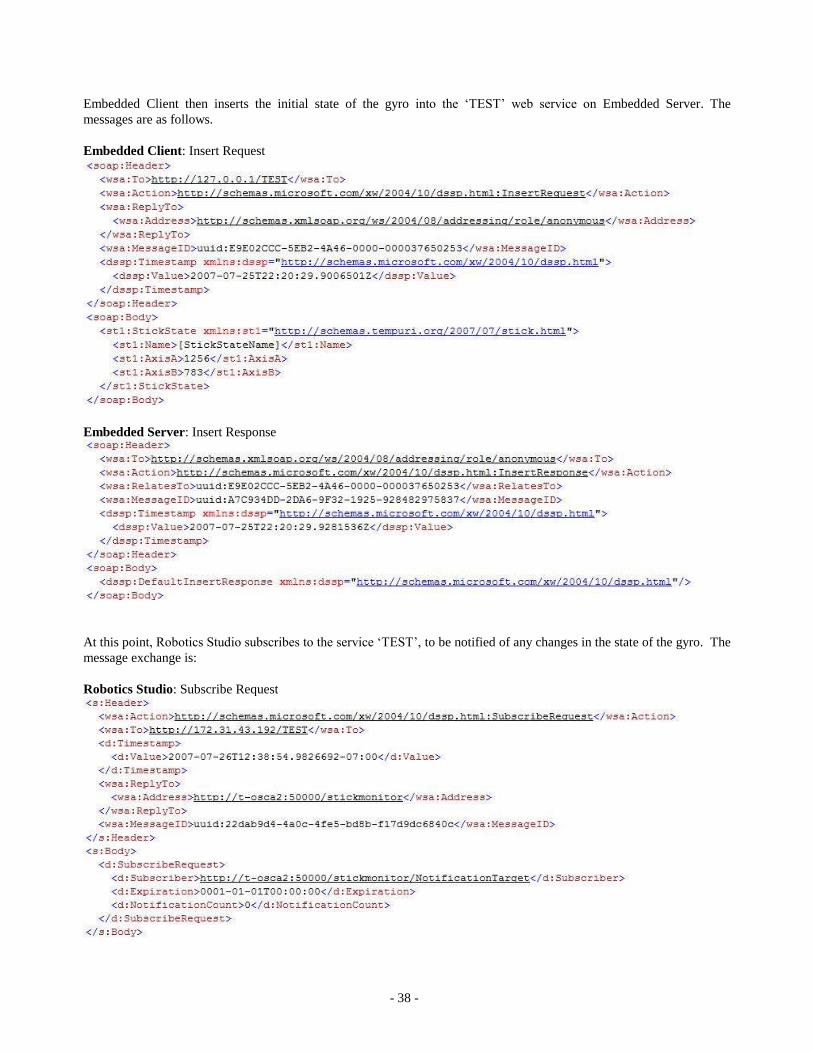
- 38 -
Embedded Client then inserts the initial state of the gyro into the „TEST‟ web service on Embedded Server. The
messages are as follows.
Embedded Client: Insert Request
Embedded Server: Insert Response
At this point, Robotics Studio subscribes to the service „TEST‟, to be notified of any changes in the state of the gyro. The
message exchange is:
Robotics Studio: Subscribe Request
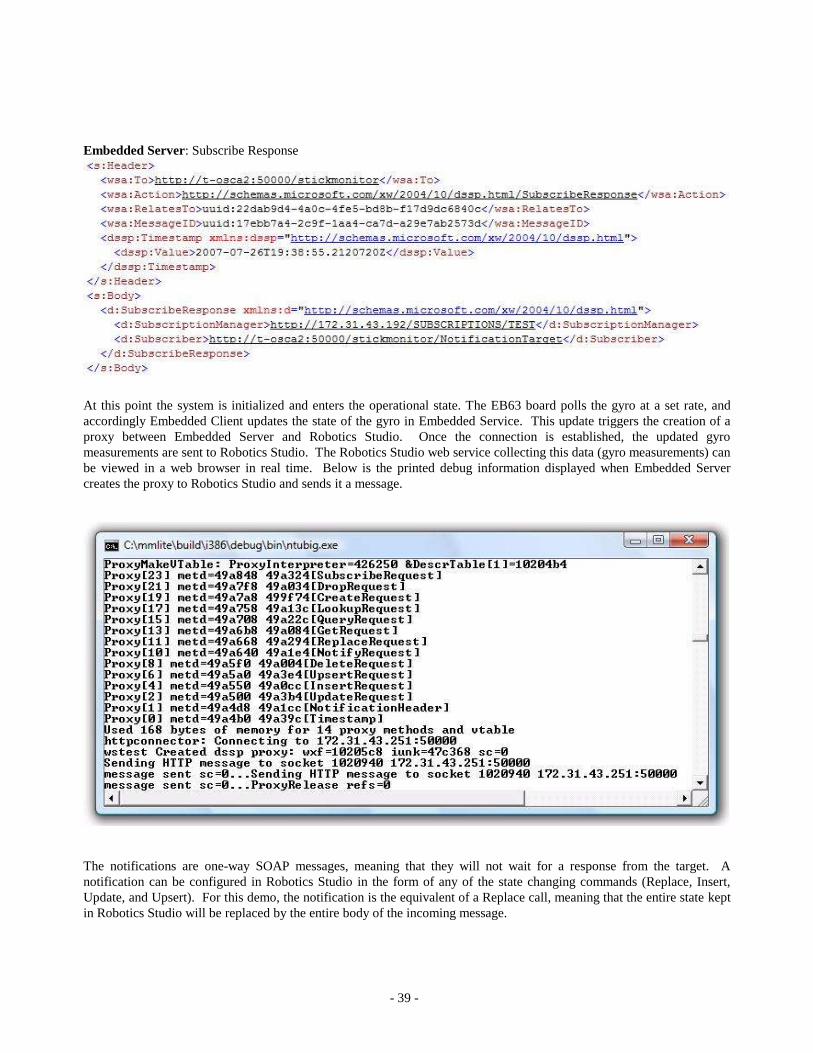
- 39 -
Embedded Server: Subscribe Response
At this point the system is initialized and enters the operational state. The EB63 board polls the gyro at a set rate, and
accordingly Embedded Client updates the state of the gyro in Embedded Service. This update triggers the creation of a
proxy between Embedded Server and Robotics Studio. Once the connection is established, the updated gyro
measurements are sent to Robotics Studio. The Robotics Studio web service collecting this data (gyro measurements) can
be viewed in a web browser in real time. Below is the printed debug information displayed when Embedded Server
creates the proxy to Robotics Studio and sends it a message.
The notifications are one-way SOAP messages, meaning that they will not wait for a response from the target. A
notification can be configured in Robotics Studio in the form of any of the state changing commands (Replace, Insert,
Update, and Upsert). For this demo, the notification is the equivalent of a Replace call, meaning that the entire state kept
in Robotics Studio will be replaced by the entire body of the incoming message.
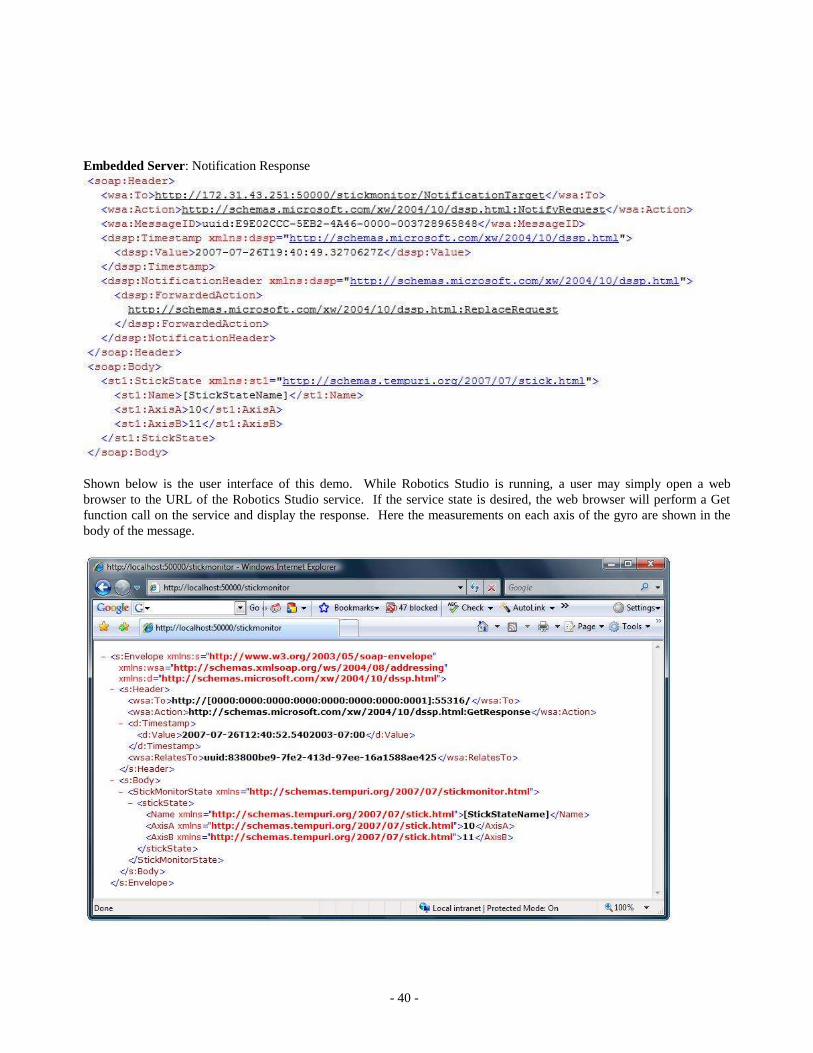
- 40 -
Embedded Server: Notification Response
Shown below is the user interface of this demo. While Robotics Studio is running, a user may simply open a web
browser to the URL of the Robotics Studio service. If the service state is desired, the web browser will perform a Get
function call on the service and display the response. Here the measurements on each axis of the gyro are shown in the
body of the message.
- 41 -
Data Centric Embedded Services
Johannes Helander, Nishith Khantal, Ben Zorn, Oscar Almeida
Microsoft Research
Abstract
Data Centric Embedded Services are based on the core idea of an object manager, which provides both flexibility and
code sharing. The Object Manager is flexible because it can handle a wide variety of objects ranging from hardware
sensors to trust policies. At the same time, it has a lot of code sharing with common modules for data representation,
communication, security etc. We have implemented a trust management service based on the object manager model, and
used it in one of the other demos (Ref: Connecting Microsoft Robotics Studio and Embedded Web Services) to
communicate with Microsoft Robotics Studio.
Trust among parties is modeled in the form of policies and evidences. The policies and evidences are stored and
managed by the trust management service, which is referred to as Trust Manager in the poster in Appendix A. The
service evaluates policies, based on the evidences and makes online access check decisions. For example, we can have a
simple policy stating that to access a particular resource a client needs “to know the password” and “must be human”.
Hence we have a policy that is defined by the resource and the evidences that is to be provided by the client. The
communication pattern for an access check consists of the client communicating with the Trust Manager and requesting
access to the resource, followed by the Trust Manager evaluating the policies based on the evidences it holds on behalf
of the client. This interaction is illustrated in the figure at the bottom left of the poster in Appendix A. The output is
either “access granted” (if access is given) or “the URL to the evidence provider service” (if access is not given). The
client can provide the necessary evidence at the evidence provider service, which will update the value in the Trust
Manager, thus allowing access to the client.
Demo
Bootstrapping
Step 1: Starting the trust management service at a central location
A trust management service is started. The service in this demo is run on an i386 processor but it could run on an
embedded platform. In another demo (Ref: Connecting Microsoft Robotics Studio and Embedded Web Services) the
same code is run on an ARM processor.
Step 2: Configuring the trust management service (by the administrator)
In order to bootstrap the system, we assume that an administrator creates the object hierarchy represented at the bottom
right of our poster in appendix A. In this demo the objects are created locally, but the Trust Management Service allows
the creation of objects from a remote machine as well.
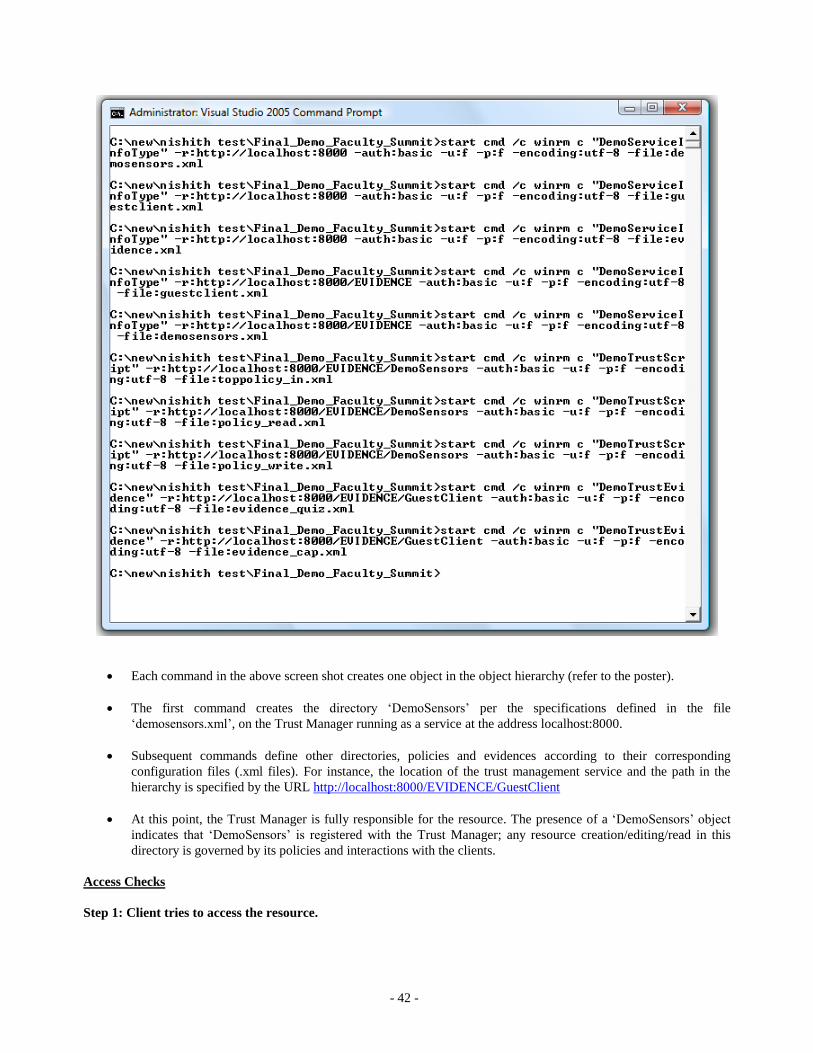
- 42 -
Each command in the above screen shot creates one object in the object hierarchy (refer to the poster).
The first command creates the directory „DemoSensors‟ per the specifications defined in the file
„demosensors.xml‟, on the Trust Manager running as a service at the address localhost:8000.
Subsequent commands define other directories, policies and evidences according to their corresponding
configuration files (.xml files). For instance, the location of the trust management service and the path in the
hierarchy is specified by the URL http://localhost:8000/EVIDENCE/GuestClient
At this point, the Trust Manager is fully responsible for the resource. The presence of a „DemoSensors‟ object
indicates that „DemoSensors‟ is registered with the Trust Manager; any resource creation/editing/read in this
directory is governed by its policies and interactions with the clients.
Access Checks
Step 1: Client tries to access the resource.

- 43 -
In the above screen shot, the client tries to access the Trust Management Service. The URL in the above
command defines the location of the Trust Management Service the client wants to use, in this case the
DemoSensors directory as indicated by the URL http://localhost:8000/DemoSensors.
The Trust Manager receives the request and applies the policies related to “DemoSensors”. It finds a Top Policy
(Ref: Object Hierarchy in the poster), which redirects to a more specific policy that is based on the access mode.
In this case the mode is „create‟ and therefore we must apply Policy_write.
Policy_write in turn requires Evidence_CAP, a CAPTCHA1 evidence, and Evidence_quiz, an evidence based on
the knowledge of the subject. At this point the client has not passed the CAPTCHA test and the value of
Evidence_CAP is false (Ref: Object Hierarchy in the bottom-right of the poster).
Hence the access check fails, as indicated in the figure below.
Step 2: Trust Manager sends a reply with the URL of evidence provider (Access Check Failed).
The reply from the Trust Manager to the client indicates that “Access check” failed because evidence is required
and the client needs to go to http://localhost:59503/Default.aspx to provide it.
1 Completely Automated Public Turing test to tell Computers and Humans Apart
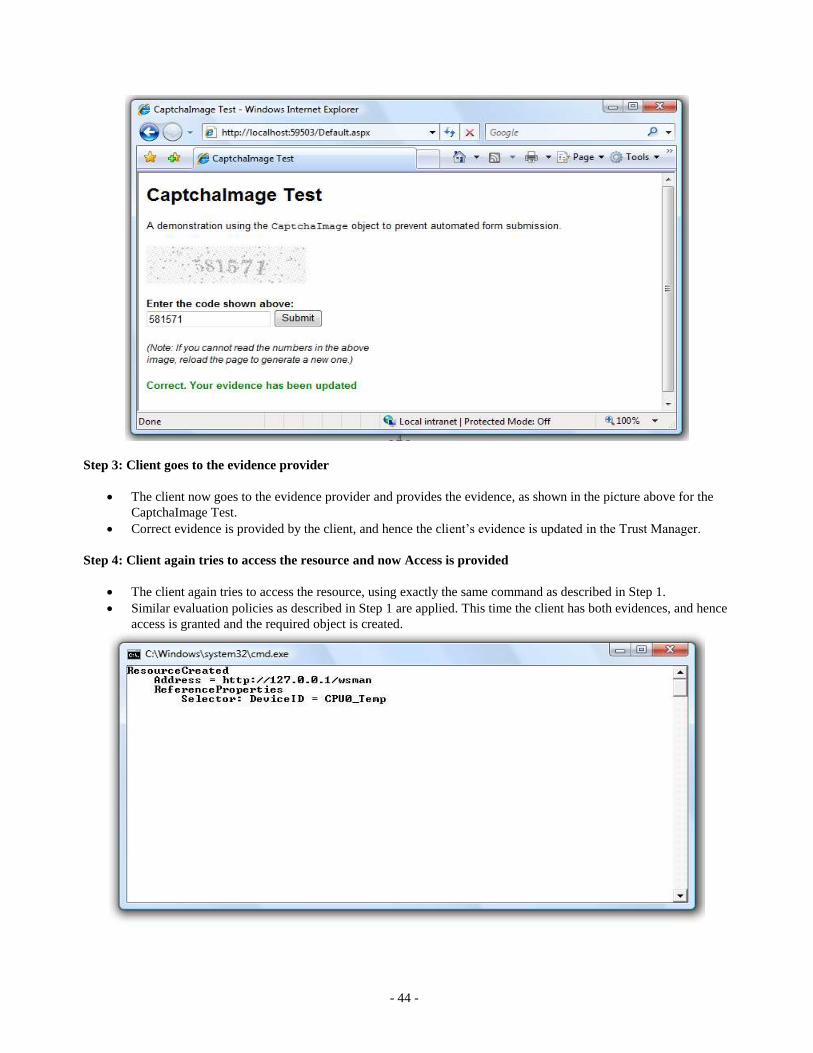
- 44 -
Step 3: Client goes to the evidence provider
The client now goes to the evidence provider and provides the evidence, as shown in the picture above for the
CaptchaImage Test.
Correct evidence is provided by the client, and hence the client‟s evidence is updated in the Trust Manager.
Step 4: Client again tries to access the resource and now Access is provided
The client again tries to access the resource, using exactly the same command as described in Step 1.
Similar evaluation policies as described in Step 1 are applied. This time the client has both evidences, and hence
access is granted and the required object is created.
- 45 -
World’s Smallest Web 2.0 Server
Risto Serg, Johannes Helander
Microsoft Research
Abstract
The Service oriented systems architecture is gaining popularity among system designers because it can help reduce the
development and maintenance costs. Communication between systems can be arranged using either some custom,
application specific protocol or some standard protocol such as XML Web Services and reap the advantages that come
from standardization and interoperability. One concern is that implementing XML Web Services on small embedded
systems causes unnecessary overheads. This might well be true if we were to implement the entire SOAP protocol
support. Fortunately, in most cases this is not necessary. Many small embedded systems provide a very limited and
predefined set of services and therefore it is possible to implement only a subset of the protocol -- only what is explicitly
needed for the application. Using some specific optimization techniques we showed that a subset of the XML Web
Services protocol can be implemented on a tiny platform – an 8-bit AVR microcontroller with minimal overhead. Our
sample application provides two sample services – addition and subtraction. It was implemented using a total of 92 bytes
of RAM and 2,636 bytes of code. The XML messages that the system receives as service requests and send out as replies
are all several hundreds of bytes long. The whole system doesn't need any hardware or software interrupts for operating,
making it possible to target even simpler hardware platforms.
1 Demo
The following SOAP message is sent to the AVR controller over a serial line, requesting it to perform a simple
addition.
<?xml version="1.0"?>
<soap:Envelope xmlns:tns="http://soapinterop.org/">
<soap:Header>
<wsa:To>http://127.0.0.1/COB/calc.cob</wsa:To>
<wsa:Action>http://soapinterop.org//Add</wsa:Action>
</soap:Header>
<soap:Body>
<tns:Add xmlns:tns="http://soapinterop.org/">
<tns:A>35</tns:A>
<tns:B>7</tns:B>
</tns:Add>
</soap:Body>
</soap:Envelope>
The reply message from the AVR is as follows:
<?xml version="1.0"?>
<soap:Envelope xmlns:tns="http://soapinterop.org/">
<soap:Header>
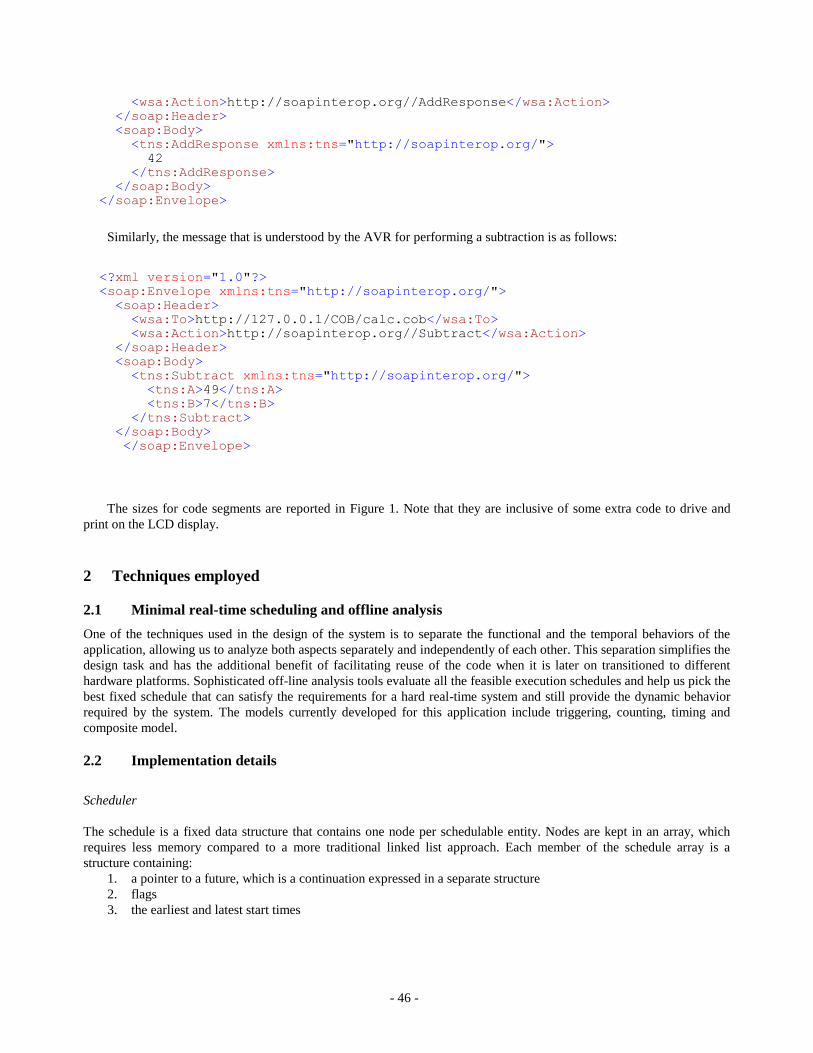
- 46 -
<wsa:Action>http://soapinterop.org//AddResponse</wsa:Action>
</soap:Header>
<soap:Body>
<tns:AddResponse xmlns:tns="http://soapinterop.org/">
42
</tns:AddResponse>
</soap:Body>
</soap:Envelope>
Similarly, the message that is understood by the AVR for performing a subtraction is as follows:
<?xml version="1.0"?>
<soap:Envelope xmlns:tns="http://soapinterop.org/">
<soap:Header>
<wsa:To>http://127.0.0.1/COB/calc.cob</wsa:To>
<wsa:Action>http://soapinterop.org//Subtract</wsa:Action>
</soap:Header>
<soap:Body>
<tns:Subtract xmlns:tns="http://soapinterop.org/">
<tns:A>49</tns:A>
<tns:B>7</tns:B>
</tns:Subtract>
</soap:Body>
</soap:Envelope>
The sizes for code segments are reported in Figure 1. Note that they are inclusive of some extra code to drive and
print on the LCD display.
2 Techniques employed
2.1 Minimal real-time scheduling and offline analysis
One of the techniques used in the design of the system is to separate the functional and the temporal behaviors of the
application, allowing us to analyze both aspects separately and independently of each other. This separation simplifies the
design task and has the additional benefit of facilitating reuse of the code when it is later on transitioned to different
hardware platforms. Sophisticated off-line analysis tools evaluate all the feasible execution schedules and help us pick the
best fixed schedule that can satisfy the requirements for a hard real-time system and still provide the dynamic behavior
required by the system. The models currently developed for this application include triggering, counting, timing and
composite model.
2.2 Implementation details
Scheduler
The schedule is a fixed data structure that contains one node per schedulable entity. Nodes are kept in an array, which
requires less memory compared to a more traditional linked list approach. Each member of the schedule array is a
structure containing:
1. a pointer to a future, which is a continuation expressed in a separate structure
2. flags
3. the earliest and latest start times
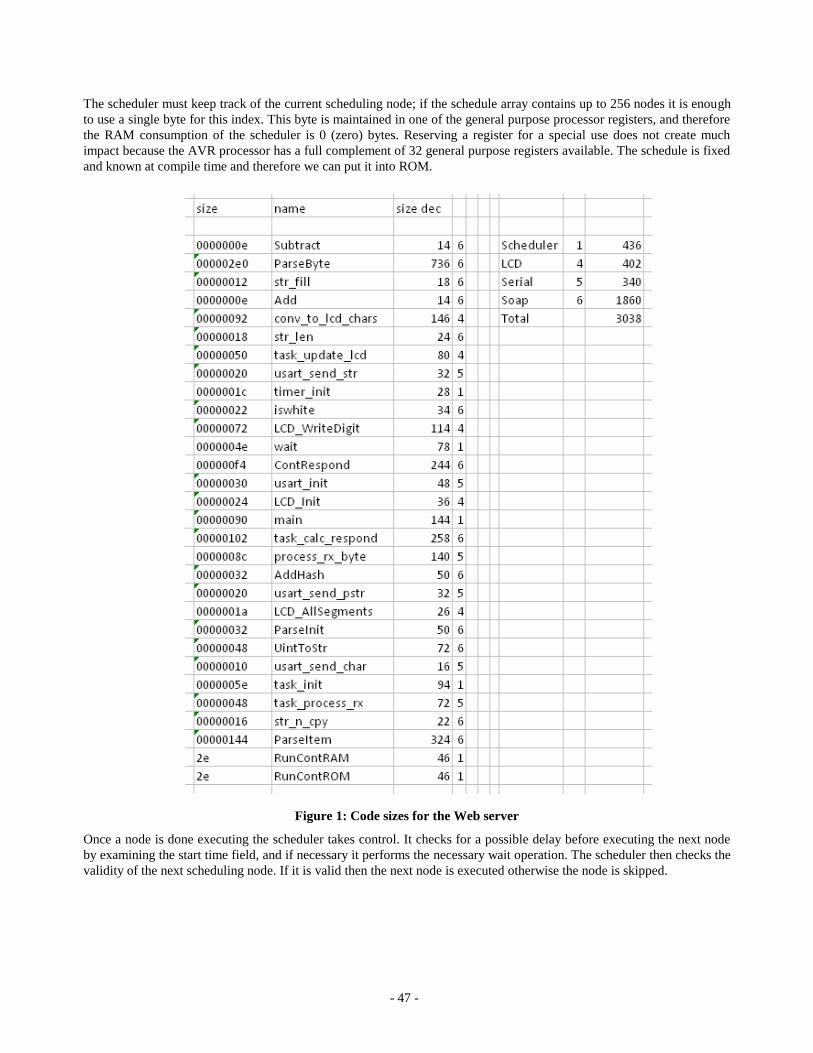
- 47 -
The scheduler must keep track of the current scheduling node; if the schedule array contains up to 256 nodes it is enough
to use a single byte for this index. This byte is maintained in one of the general purpose processor registers, and therefore
the RAM consumption of the scheduler is 0 (zero) bytes. Reserving a register for a special use does not create much
impact because the AVR processor has a full complement of 32 general purpose registers available. The schedule is fixed
and known at compile time and therefore we can put it into ROM.
Figure 1: Code sizes for the Web server
Once a node is done executing the scheduler takes control. It checks for a possible delay before executing the next node
by examining the start time field, and if necessary it performs the necessary wait operation. The scheduler then checks the
validity of the next scheduling node. If it is valid then the next node is executed otherwise the node is skipped.

- 48 -
Futures
The term “future” was originally used in the MultiLisp programming language to express potential concurrency and lazy
evaluation of functional expressions. In our system a future is an execution node structure that contains:
1. a pointer to a function code
2. the stack frame size
3. a variable number of parameters
If a future needs to preserve state across evaluations then at least one of the parameters is a pointer. Evaluations of the
future consist of loading the parameters into the processor registers and on the current stack frame (from the future node
structure) and then invoking the future‟s function according to the C calling convention. The future node can usually be
allocated in ROM, unless it needs to preserve state e.g. over-write one of the parameters.
Drivers
The AVR AtMega 169 processor includes a built-in serial line interface and a passive LCD screen controller. Both
peripherals are managed in software by objects with different interface methods. Since each method is a function we can
turn every method into a future and execute it as part of the schedule.
The serial line is used as the communication channel to carry XML messages. The send and receive routines poll the
corresponding hardware registers to achieve the necessary synchronization.
The LCD screen is capable of displaying 6 alphanumeric characters. Its driver includes the necessary conversion tables
between segment data registers and ASCII codes, plus an intermediate buffer for atomic LCD updates. Currently the LCD
screen is used to just display arguments and result of the implemented WEB Service calls, and it can be easily omitted to
further reduce the memory footprint. Figure 1 indicates the corresponding costs.
XML parser
The parser is called from the serial line driver one byte at a time. It uses a nested state machine to preserve its state
across invocations. The future that is performing the data receive process is described in a fixed schedule and is executed
frequently enough to get the serial data without the need of an intermediate buffer. If the message start marker is received
then the state of the future changes and all subsequent received bytes are passed to the XML parser. The corresponding
method is called until the message end marker is received. The XML parser parses incoming message one byte at a time
with the aid of internal nested state machine. If it detects a match against a predefined string then it fills an already
scheduled future node with valid data, which activates execution of the service. Effectively, this converts the output of the
XML parser into a future. As described in the scheduler section, an execution node is only run if it contains valid data.
WEB Service
Many WEB Services require that a response message is sent back to the requestor. When this is the case, the service
response is generated by a future that is scheduled to run after the execution of the Web Service future. The Response
method checks if the future that computes the results has ran and if so it sends back the response message.
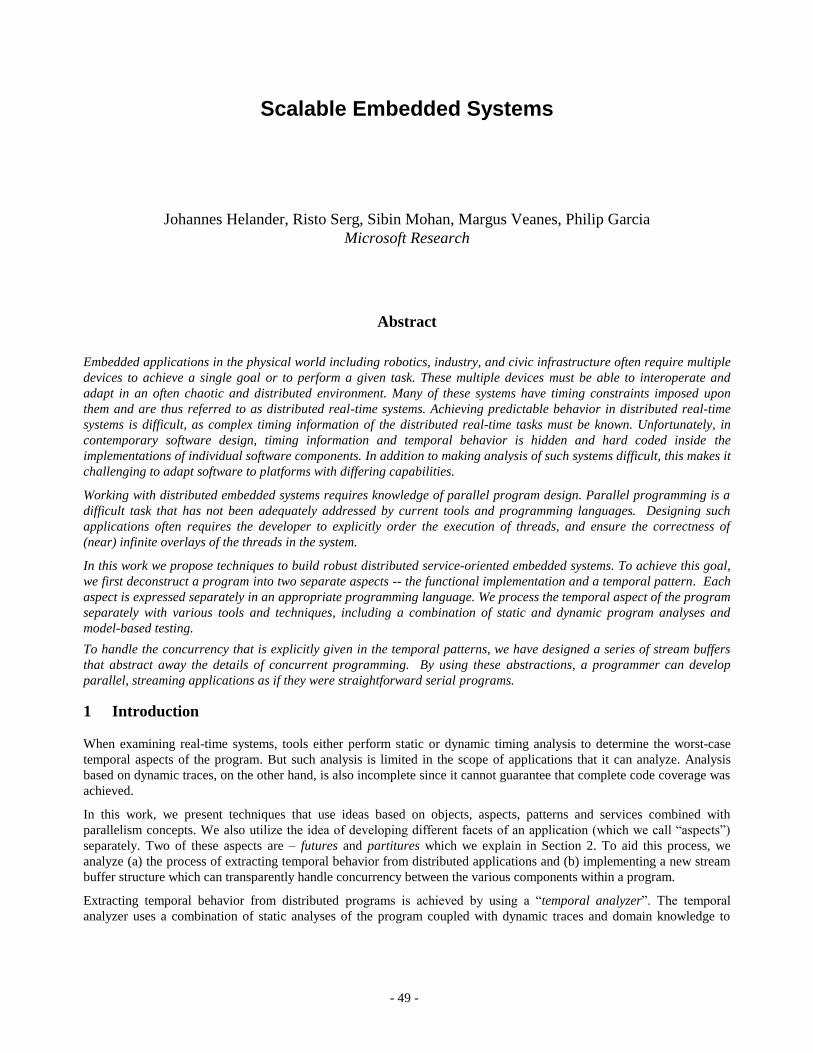
- 49 -
Scalable Embedded Systems
Johannes Helander, Risto Serg, Sibin Mohan, Margus Veanes, Philip Garcia
Microsoft Research
Abstract
Embedded applications in the physical world including robotics, industry, and civic infrastructure often require multiple
devices to achieve a single goal or to perform a given task. These multiple devices must be able to interoperate and
adapt in an often chaotic and distributed environment. Many of these systems have timing constraints imposed upon
them and are thus referred to as distributed real-time systems. Achieving predictable behavior in distributed real-time
systems is difficult, as complex timing information of the distributed real-time tasks must be known. Unfortunately, in
contemporary software design, timing information and temporal behavior is hidden and hard coded inside the
implementations of individual software components. In addition to making analysis of such systems difficult, this makes it
challenging to adapt software to platforms with differing capabilities.
Working with distributed embedded systems requires knowledge of parallel program design. Parallel programming is a
difficult task that has not been adequately addressed by current tools and programming languages. Designing such
applications often requires the developer to explicitly order the execution of threads, and ensure the correctness of
(near) infinite overlays of the threads in the system.
In this work we propose techniques to build robust distributed service-oriented embedded systems. To achieve this goal,
we first deconstruct a program into two separate aspects -- the functional implementation and a temporal pattern. Each
aspect is expressed separately in an appropriate programming language. We process the temporal aspect of the program
separately with various tools and techniques, including a combination of static and dynamic program analyses and
model-based testing.
To handle the concurrency that is explicitly given in the temporal patterns, we have designed a series of stream buffers
that abstract away the details of concurrent programming. By using these abstractions, a programmer can develop
parallel, streaming applications as if they were straightforward serial programs.
1 Introduction
When examining real-time systems, tools either perform static or dynamic timing analysis to determine the worst-case
temporal aspects of the program. But such analysis is limited in the scope of applications that it can analyze. Analysis
based on dynamic traces, on the other hand, is also incomplete since it cannot guarantee that complete code coverage was
achieved.
In this work, we present techniques that use ideas based on objects, aspects, patterns and services combined with
parallelism concepts. We also utilize the idea of developing different facets of an application (which we call “aspects”)
separately. Two of these aspects are – futures and partitures which we explain in Section 2. To aid this process, we
analyze (a) the process of extracting temporal behavior from distributed applications and (b) implementing a new stream
buffer structure which can transparently handle concurrency between the various components within a program.
Extracting temporal behavior from distributed programs is achieved by using a “temporal analyzer”. The temporal
analyzer uses a combination of static analyses of the program coupled with dynamic traces and domain knowledge to
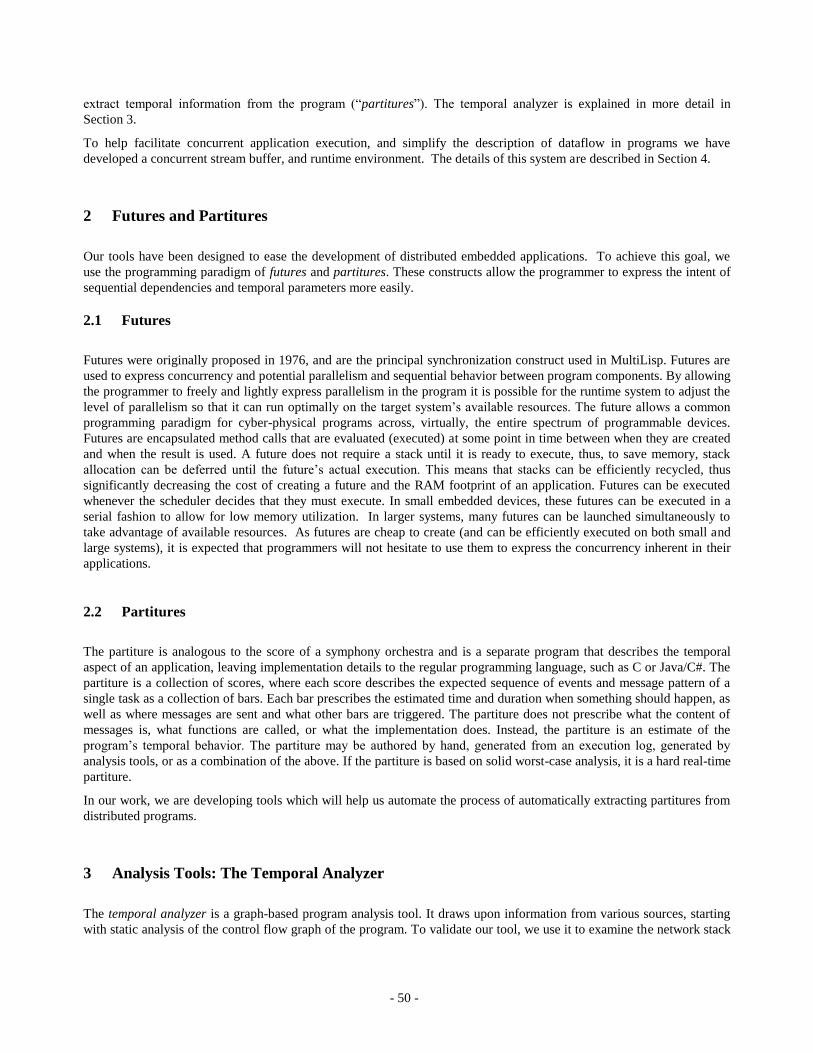
- 50 -
extract temporal information from the program (“partitures”). The temporal analyzer is explained in more detail in
Section 3.
To help facilitate concurrent application execution, and simplify the description of dataflow in programs we have
developed a concurrent stream buffer, and runtime environment. The details of this system are described in Section 4.
2 Futures and Partitures
Our tools have been designed to ease the development of distributed embedded applications. To achieve this goal, we
use the programming paradigm of futures and partitures. These constructs allow the programmer to express the intent of
sequential dependencies and temporal parameters more easily.
2.1 Futures
Futures were originally proposed in 1976, and are the principal synchronization construct used in MultiLisp. Futures are
used to express concurrency and potential parallelism and sequential behavior between program components. By allowing
the programmer to freely and lightly express parallelism in the program it is possible for the runtime system to adjust the
level of parallelism so that it can run optimally on the target system‟s available resources. The future allows a common
programming paradigm for cyber-physical programs across, virtually, the entire spectrum of programmable devices.
Futures are encapsulated method calls that are evaluated (executed) at some point in time between when they are created
and when the result is used. A future does not require a stack until it is ready to execute, thus, to save memory, stack
allocation can be deferred until the future‟s actual execution. This means that stacks can be efficiently recycled, thus
significantly decreasing the cost of creating a future and the RAM footprint of an application. Futures can be executed
whenever the scheduler decides that they must execute. In small embedded devices, these futures can be executed in a
serial fashion to allow for low memory utilization. In larger systems, many futures can be launched simultaneously to
take advantage of available resources. As futures are cheap to create (and can be efficiently executed on both small and
large systems), it is expected that programmers will not hesitate to use them to express the concurrency inherent in their
applications.
2.2 Partitures
The partiture is analogous to the score of a symphony orchestra and is a separate program that describes the temporal
aspect of an application, leaving implementation details to the regular programming language, such as C or Java/C#. The
partiture is a collection of scores, where each score describes the expected sequence of events and message pattern of a
single task as a collection of bars. Each bar prescribes the estimated time and duration when something should happen, as
well as where messages are sent and what other bars are triggered. The partiture does not prescribe what the content of
messages is, what functions are called, or what the implementation does. Instead, the partiture is an estimate of the
program‟s temporal behavior. The partiture may be authored by hand, generated from an execution log, generated by
analysis tools, or as a combination of the above. If the partiture is based on solid worst-case analysis, it is a hard real-time
partiture.
In our work, we are developing tools which will help us automate the process of automatically extracting partitures from
distributed programs.
3 Analysis Tools: The Temporal Analyzer
The temporal analyzer is a graph-based program analysis tool. It draws upon information from various sources, starting
with static analysis of the control flow graph of the program. To validate our tool, we use it to examine the network stack
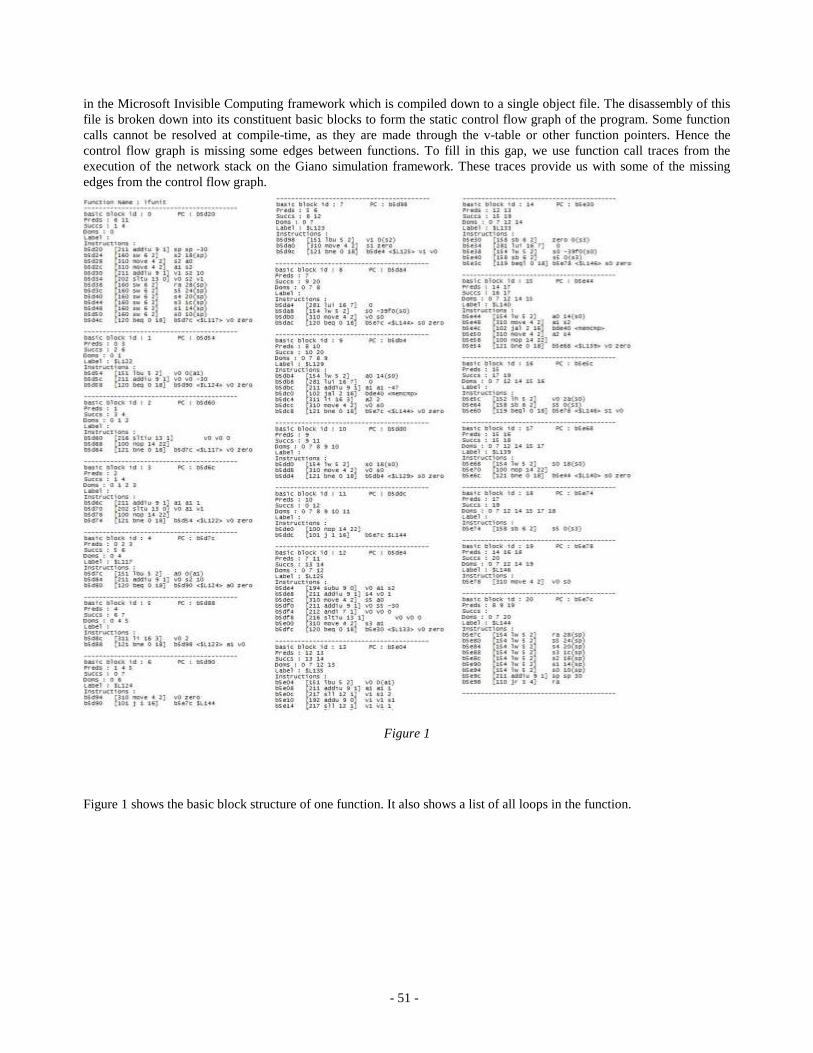
- 51 -
in the Microsoft Invisible Computing framework which is compiled down to a single object file. The disassembly of this
file is broken down into its constituent basic blocks to form the static control flow graph of the program. Some function
calls cannot be resolved at compile-time, as they are made through the v-table or other function pointers. Hence the
control flow graph is missing some edges between functions. To fill in this gap, we use function call traces from the
execution of the network stack on the Giano simulation framework. These traces provide us with some of the missing
edges from the control flow graph.
Figure 1
Figure 1 shows the basic block structure of one function. It also shows a list of all loops in the function.
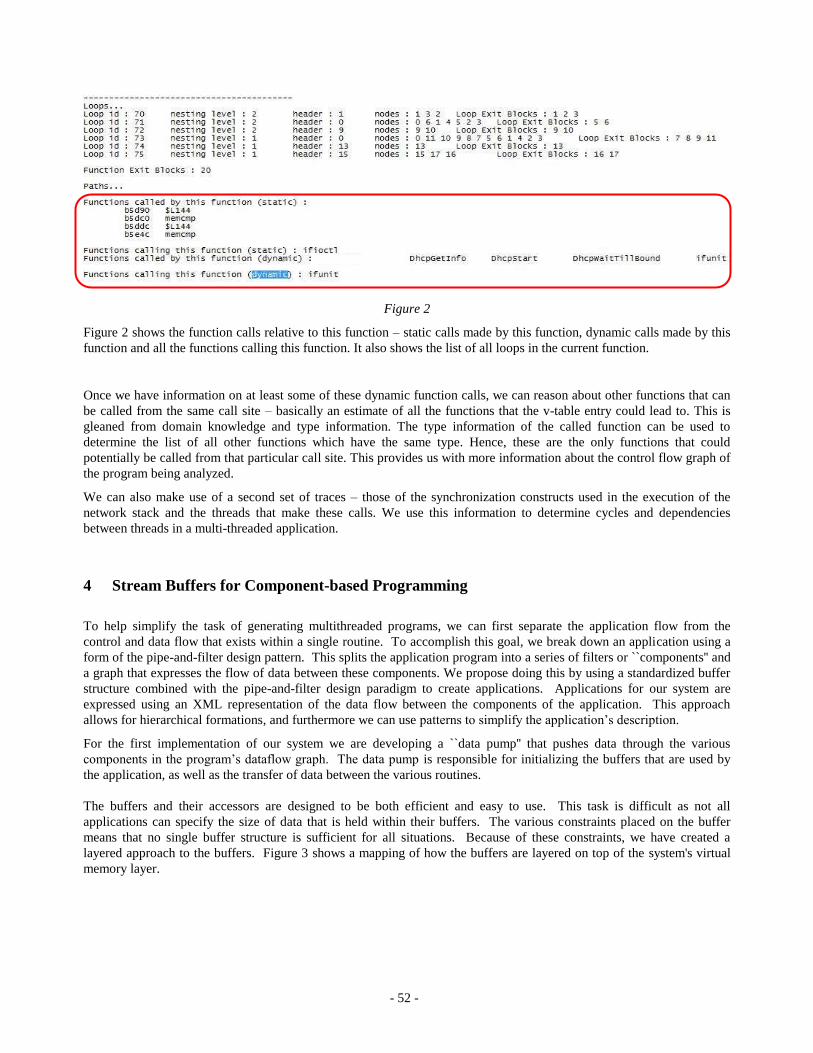
- 52 -
Figure 2
Figure 2 shows the function calls relative to this function – static calls made by this function, dynamic calls made by this
function and all the functions calling this function. It also shows the list of all loops in the current function.
Once we have information on at least some of these dynamic function calls, we can reason about other functions that can
be called from the same call site – basically an estimate of all the functions that the v-table entry could lead to. This is
gleaned from domain knowledge and type information. The type information of the called function can be used to
determine the list of all other functions which have the same type. Hence, these are the only functions that could
potentially be called from that particular call site. This provides us with more information about the control flow graph of
the program being analyzed.
We can also make use of a second set of traces – those of the synchronization constructs used in the execution of the
network stack and the threads that make these calls. We use this information to determine cycles and dependencies
between threads in a multi-threaded application.
4 Stream Buffers for Component-based Programming
To help simplify the task of generating multithreaded programs, we can first separate the application flow from the
control and data flow that exists within a single routine. To accomplish this goal, we break down an application using a
form of the pipe-and-filter design pattern. This splits the application program into a series of filters or ``components'' and
a graph that expresses the flow of data between these components. We propose doing this by using a standardized buffer
structure combined with the pipe-and-filter design paradigm to create applications. Applications for our system are
expressed using an XML representation of the data flow between the components of the application. This approach
allows for hierarchical formations, and furthermore we can use patterns to simplify the application‟s description.
For the first implementation of our system we are developing a ``data pump'' that pushes data through the various
components in the program‟s dataflow graph. The data pump is responsible for initializing the buffers that are used by
the application, as well as the transfer of data between the various routines.
The buffers and their accessors are designed to be both efficient and easy to use. This task is difficult as not all
applications can specify the size of data that is held within their buffers. The various constraints placed on the buffer
means that no single buffer structure is sufficient for all situations. Because of these constraints, we have created a
layered approach to the buffers. Figure 3 shows a mapping of how the buffers are layered on top of the system's virtual
memory layer.

- 53 -
(Figure 3)

- 54 -
Appendix A: Posters
The following posters decorated the walls of our booth at DemoFest.
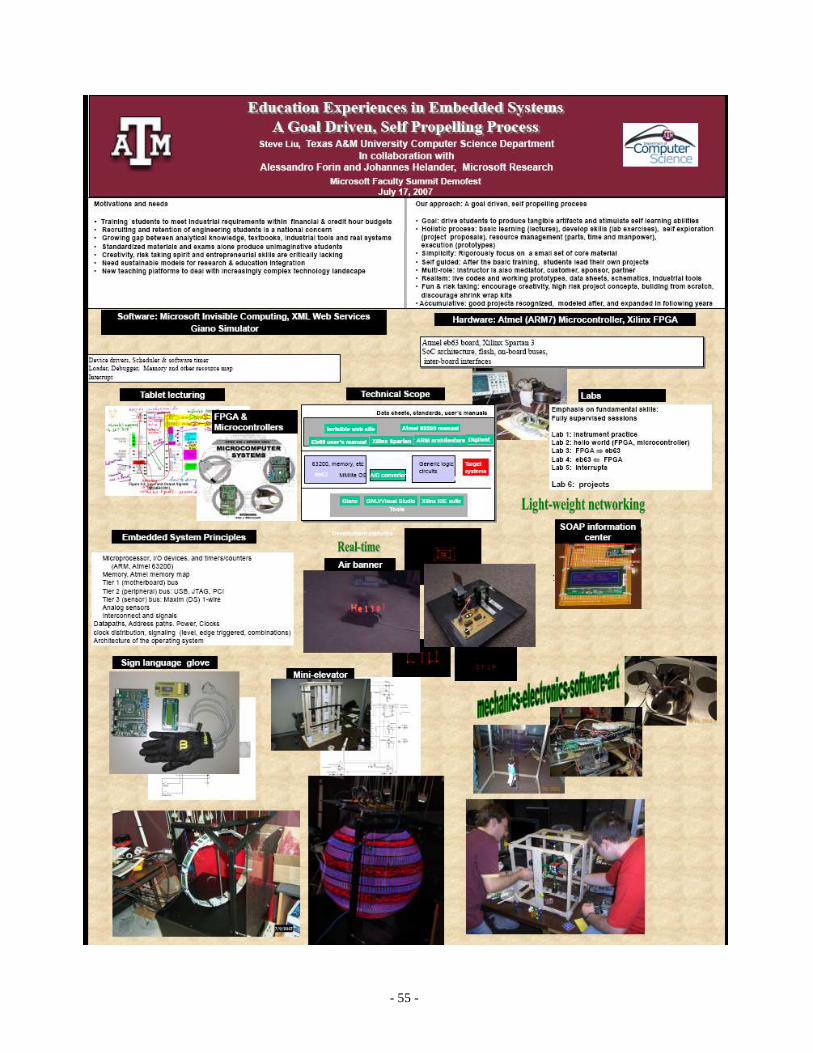
- 55 -
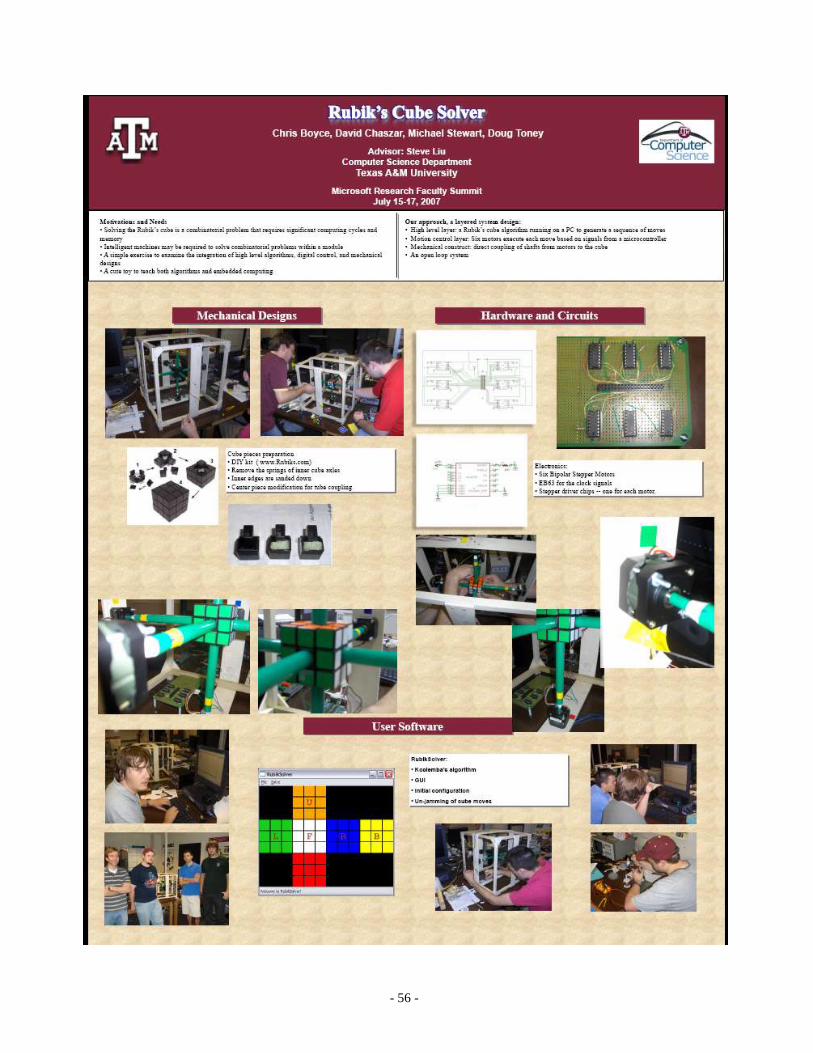
- 56 -
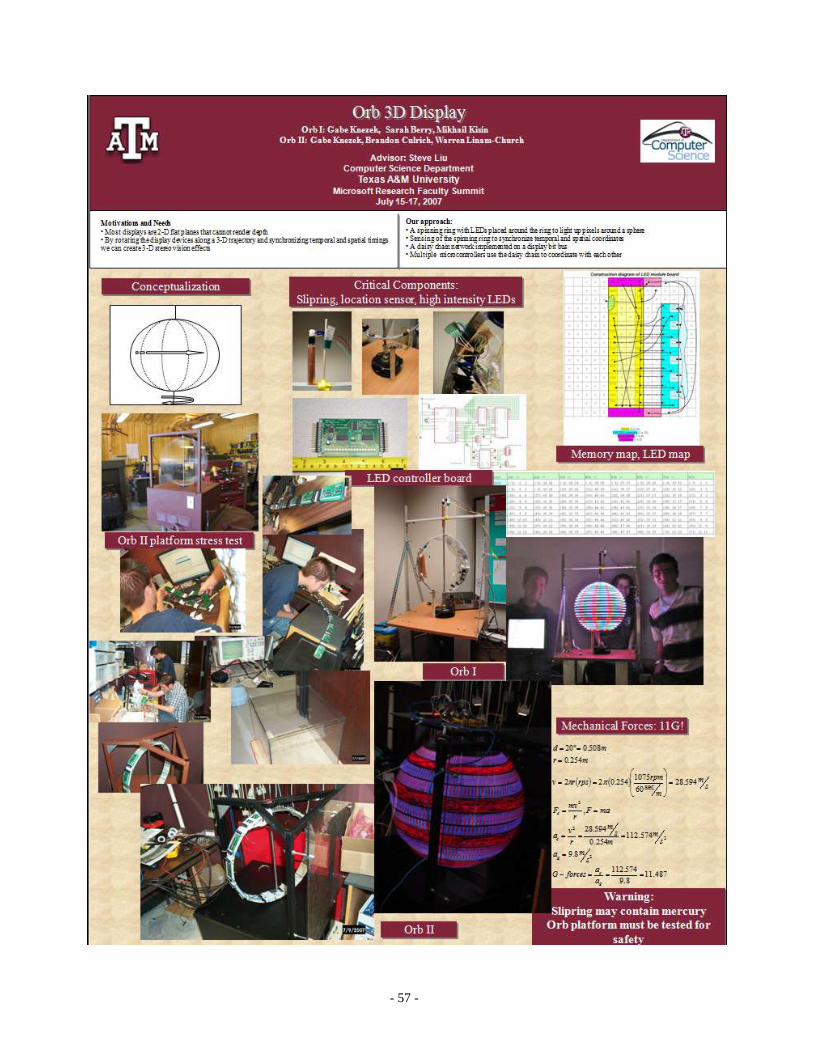
- 57 -
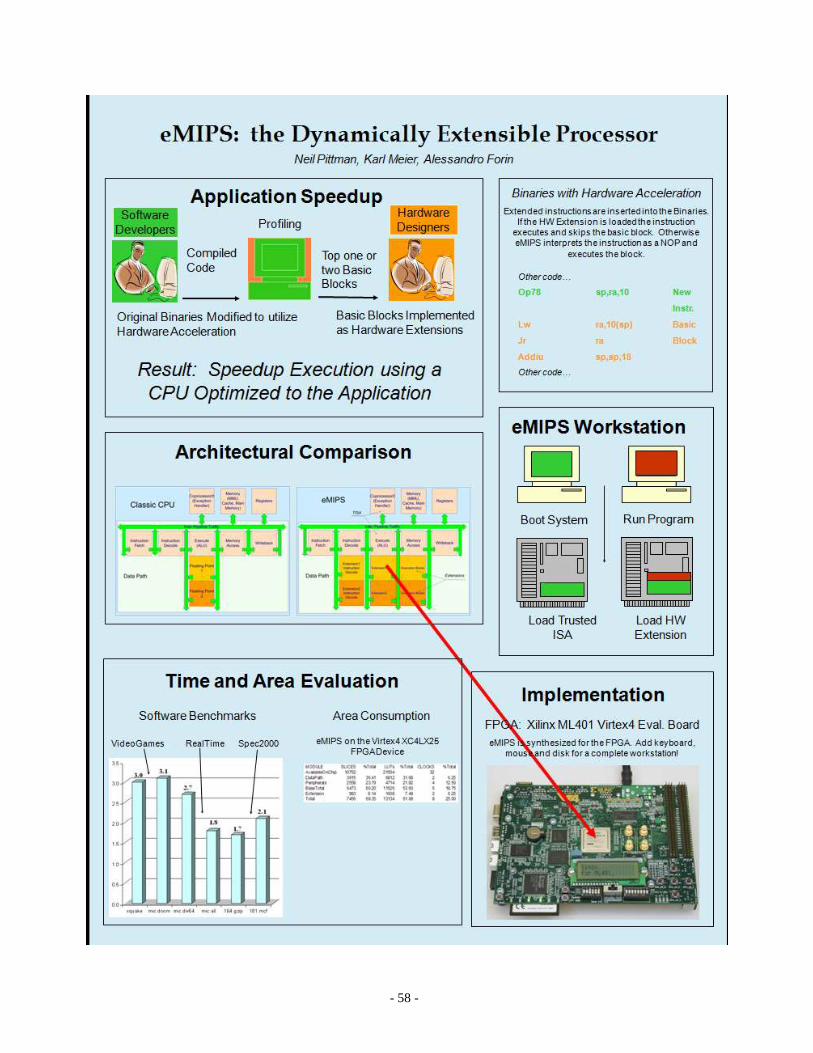
- 58 -
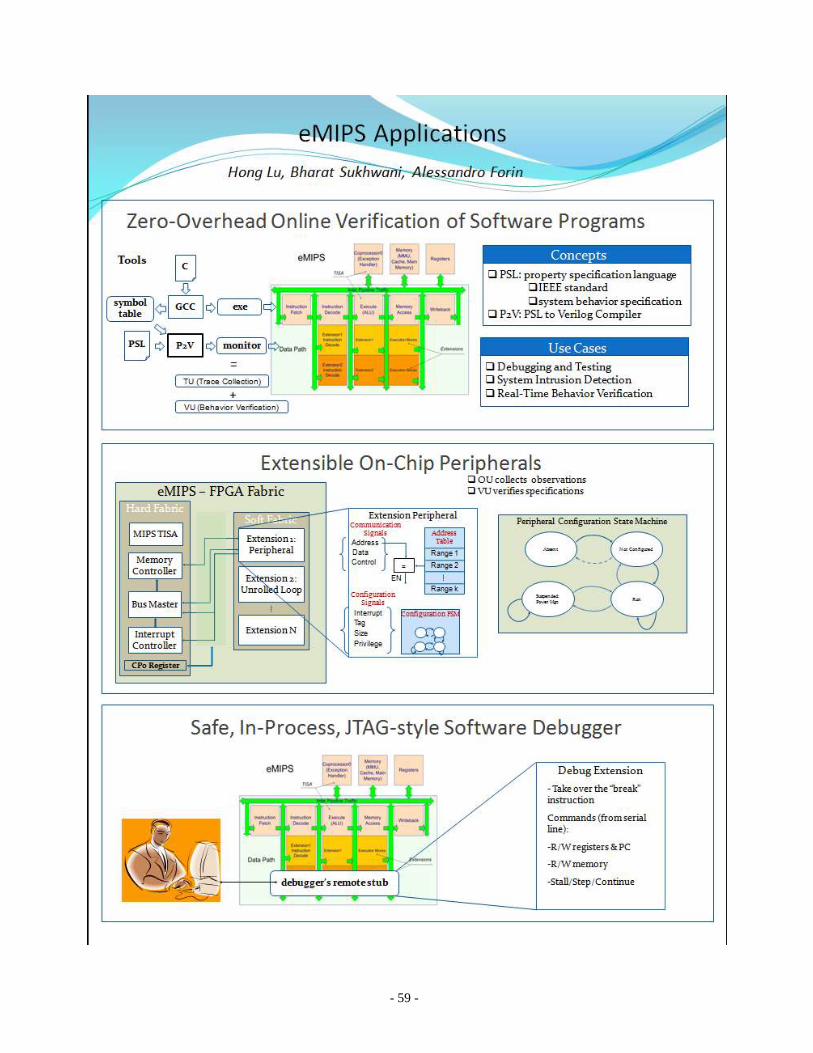
- 59 -
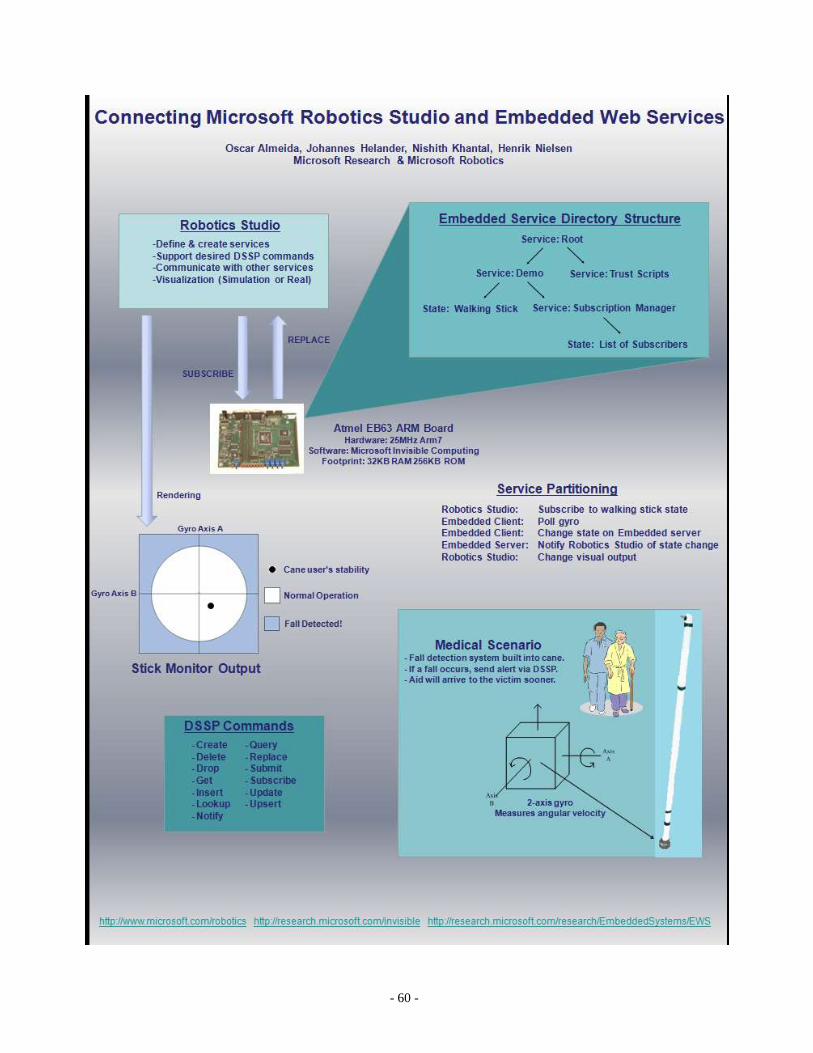
- 60 -
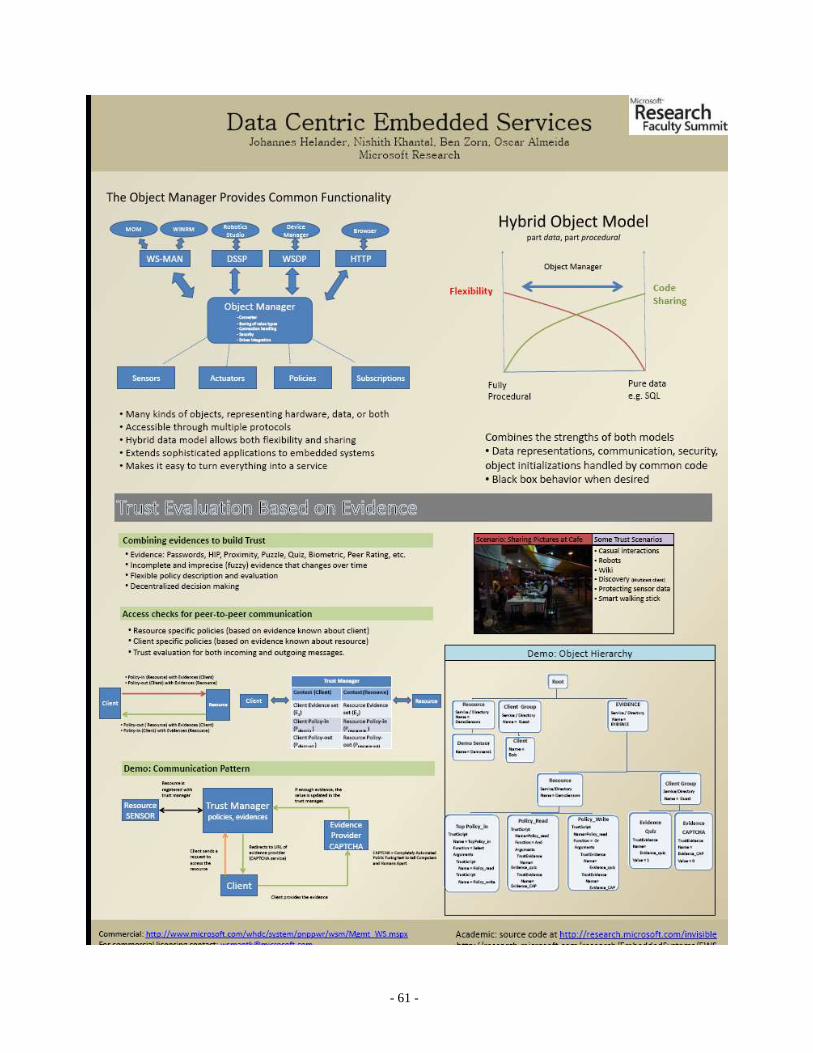
- 61 -
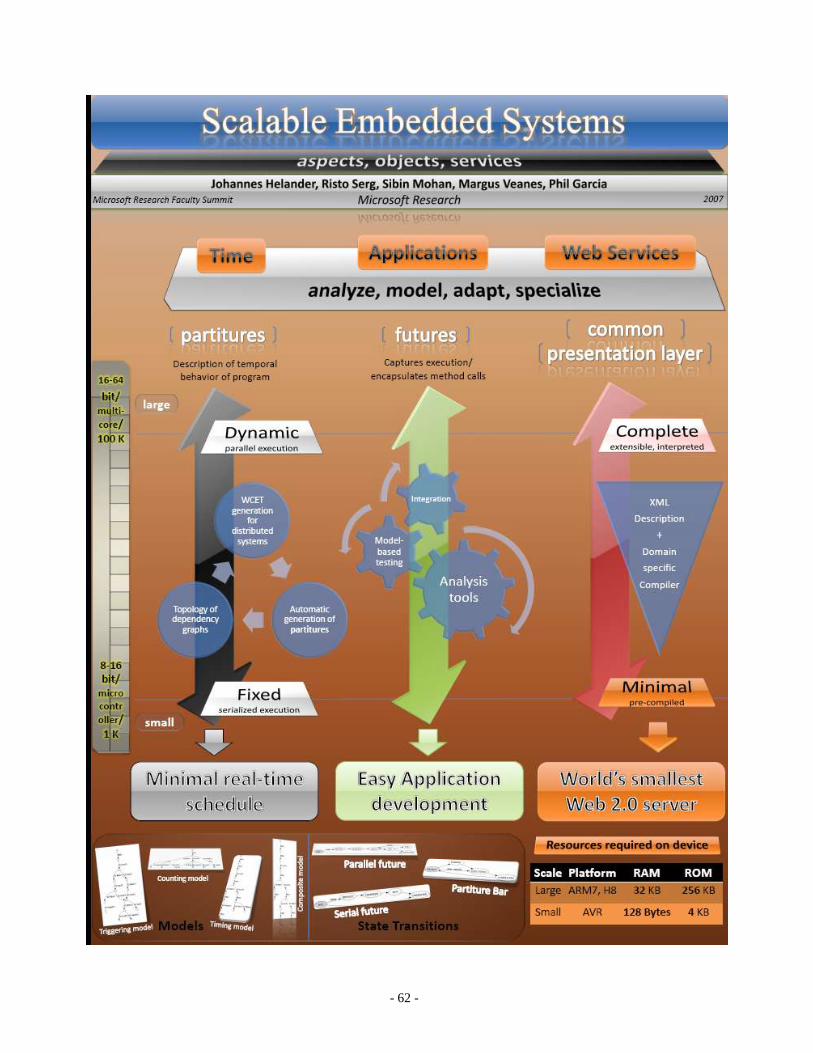
- 62 -
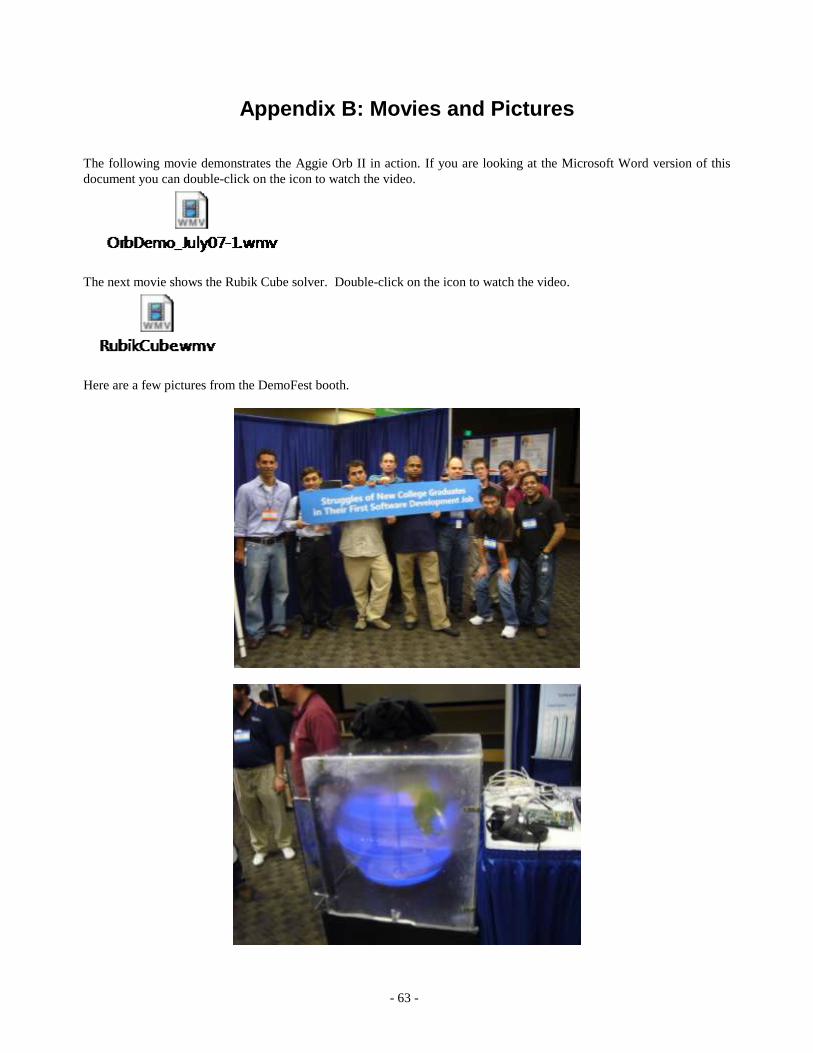
- 63 -
Appendix B: Movies and Pictures
The following movie demonstrates the Aggie Orb II in action. If you are looking at the Microsoft Word version of this
document you can double-click on the icon to watch the video.
The next movie shows the Rubik Cube solver. Double-click on the icon to watch the video.
Here are a few pictures from the DemoFest booth.
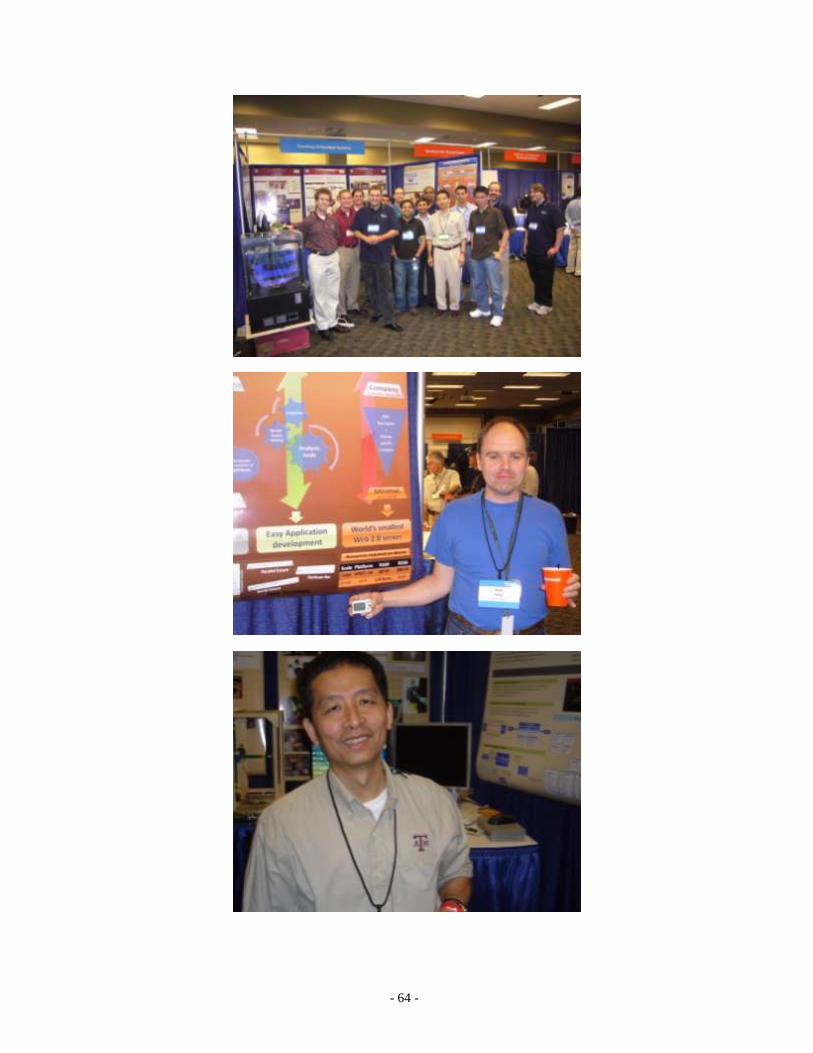
- 64 -
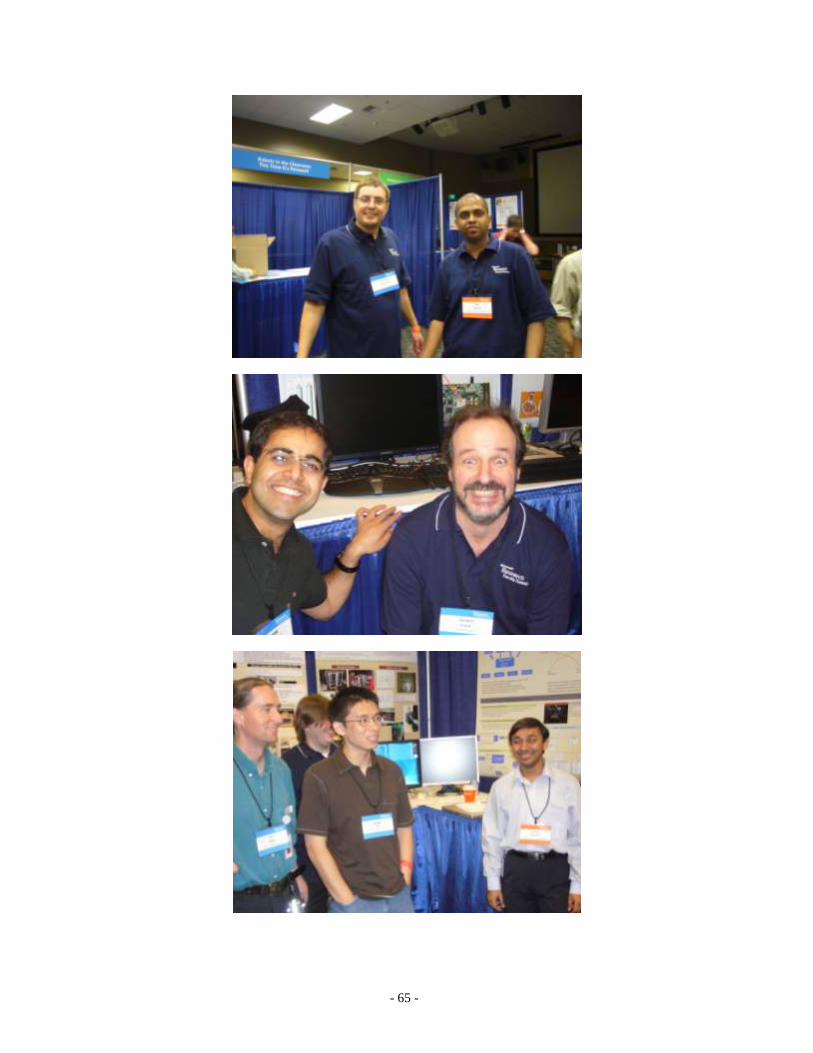
- 65 -
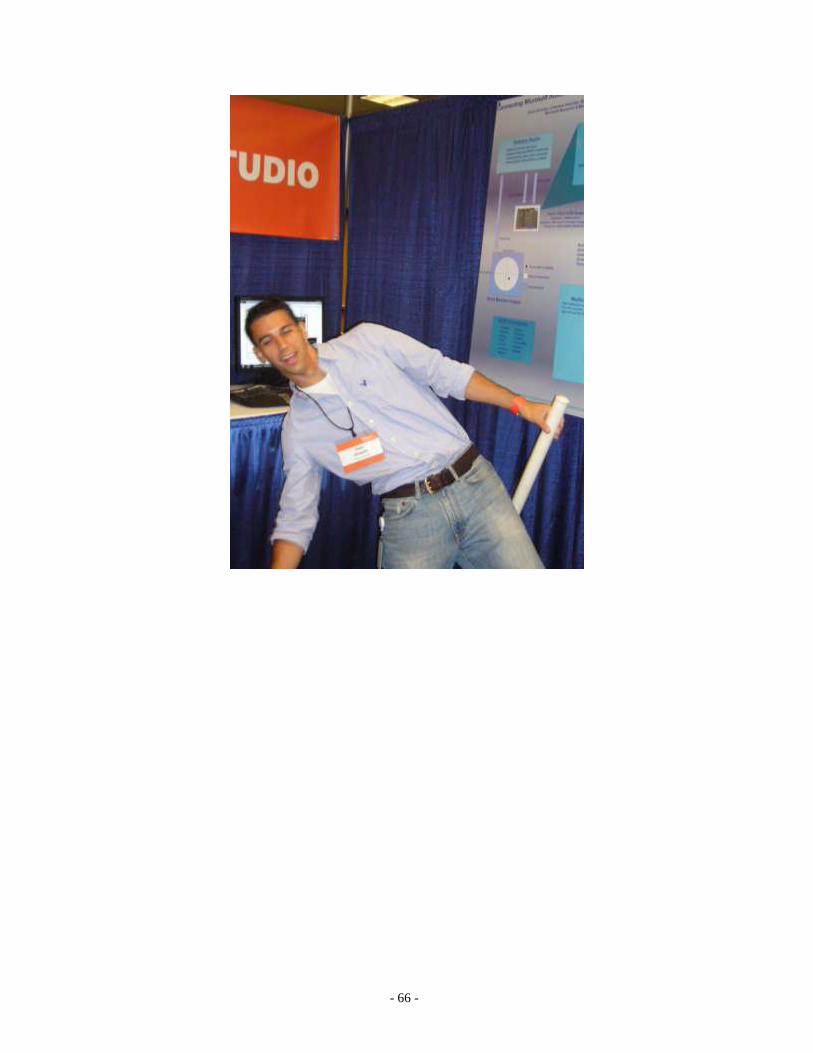
- 66 -