Embed Size (px)
Citation preview
To appear in IEEE Symposium on Large Data Analysis and Visualization (LDAV) 2016
Embedded Domain-Specific Language and Runtime System forProgressive Spatiotemporal Data Analysis and VisualizationCameron Christensen*
SCI Institute, University of UtahShusen Liu†
SCI Institute, University of UtahGiorgio Scorzelli‡
SCI Institute, University of Utah
Ji-Woo Lee§
Lawrence Livermore National LaboratoryPeer-Timo Bremer¶
Lawrence Livermore National LaboratoryValerio Pascucci||
SCI Institute, University of Utah
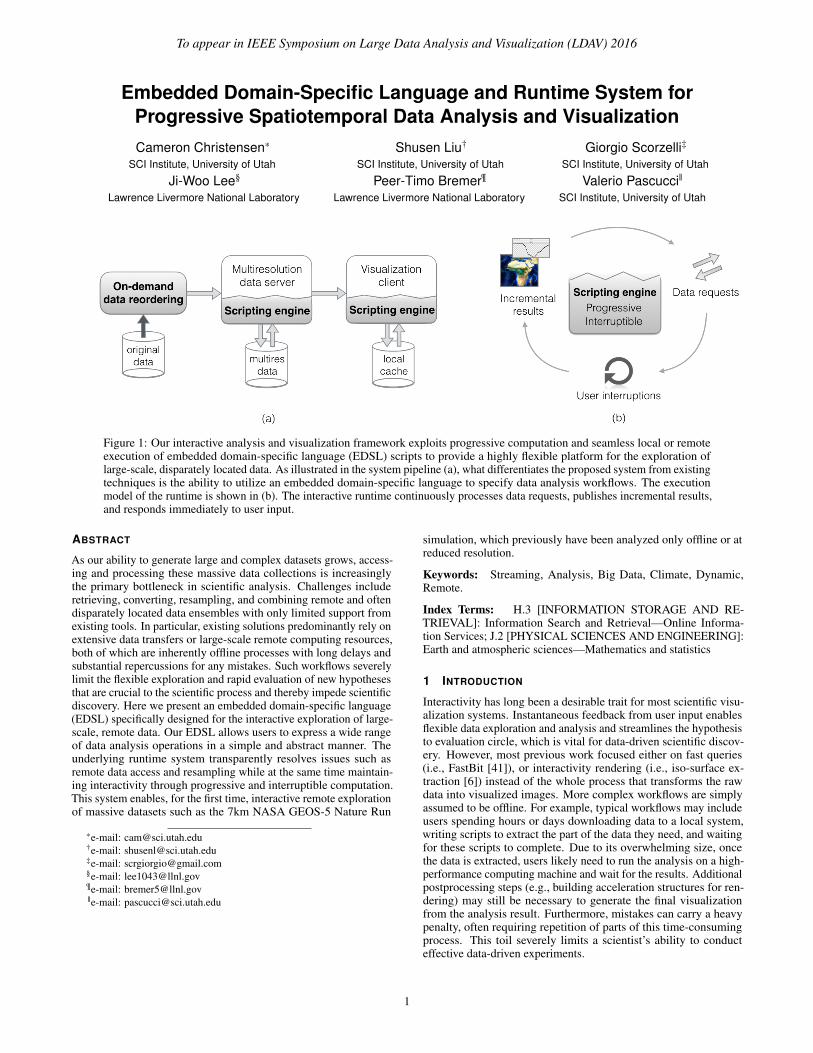
Figure 1: Our interactive analysis and visualization framework exploits progressive computation and seamless local or remoteexecution of embedded domain-specific language (EDSL) scripts to provide a highly flexible platform for the exploration oflarge-scale, disparately located data. As illustrated in the system pipeline (a), what differentiates the proposed system from existingtechniques is the ability to utilize an embedded domain-specific language to specify data analysis workflows. The executionmodel of the runtime is shown in (b). The interactive runtime continuously processes data requests, publishes incremental results,and responds immediately to user input.
ABSTRACT
As our ability to generate large and complex datasets grows, access-ing and processing these massive data collections is increasinglythe primary bottleneck in scientific analysis. Challenges includeretrieving, converting, resampling, and combining remote and oftendisparately located data ensembles with only limited support fromexisting tools. In particular, existing solutions predominantly rely onextensive data transfers or large-scale remote computing resources,both of which are inherently offline processes with long delays andsubstantial repercussions for any mistakes. Such workflows severelylimit the flexible exploration and rapid evaluation of new hypothesesthat are crucial to the scientific process and thereby impede scientificdiscovery. Here we present an embedded domain-specific language(EDSL) specifically designed for the interactive exploration of large-scale, remote data. Our EDSL allows users to express a wide rangeof data analysis operations in a simple and abstract manner. Theunderlying runtime system transparently resolves issues such asremote data access and resampling while at the same time maintain-ing interactivity through progressive and interruptible computation.This system enables, for the first time, interactive remote explorationof massive datasets such as the 7km NASA GEOS-5 Nature Run
*e-mail: [email protected]†e-mail: [email protected]‡e-mail: [email protected]§e-mail: [email protected]¶e-mail: [email protected]||e-mail: [email protected]
simulation, which previously have been analyzed only offline or atreduced resolution.
Keywords: Streaming, Analysis, Big Data, Climate, Dynamic,Remote.
Index Terms: H.3 [INFORMATION STORAGE AND RE-TRIEVAL]: Information Search and Retrieval—Online Informa-tion Services; J.2 [PHYSICAL SCIENCES AND ENGINEERING]:Earth and atmospheric sciences—Mathematics and statistics
1 INTRODUCTION
Interactivity has long been a desirable trait for most scientific visu-alization systems. Instantaneous feedback from user input enablesflexible data exploration and analysis and streamlines the hypothesisto evaluation circle, which is vital for data-driven scientific discov-ery. However, most previous work focused either on fast queries(i.e., FastBit [41]), or interactivity rendering (i.e., iso-surface ex-traction [6]) instead of the whole process that transforms the rawdata into visualized images. More complex workflows are simplyassumed to be offline. For example, typical workflows may includeusers spending hours or days downloading data to a local system,writing scripts to extract the part of the data they need, and waitingfor these scripts to complete. Due to its overwhelming size, oncethe data is extracted, users likely need to run the analysis on a high-performance computing machine and wait for the results. Additionalpostprocessing steps (e.g., building acceleration structures for ren-dering) may still be necessary to generate the final visualizationfrom the analysis result. Furthermore, mistakes can carry a heavypenalty, often requiring repetition of parts of this time-consumingprocess. This toil severely limits a scientist’s ability to conducteffective data-driven experiments.
1
To appear in IEEE Symposium on Large Data Analysis and Visualization (LDAV) 2016
As our ability to generate large datasets and our reliance on dis-tributed data storage grows, accessing and aggregating the data foranalysis and visualization is an increasingly challenging task. Onone hand, it is difficult to automate and streamline the workflow.Describing even comparatively simple analysis workflows such asaverages or comparisons can quickly become nontrivial if multipledata sources, remote locations, or different resolutions or data for-mats are involved. The resulting scripts and solutions are typicallycustomized for the specific analysis, difficult to adapt, and oftencontain manual steps such as file transfers. On the other hand, theinherent process latency can be prohibitive for a large dataset. Evenassuming sufficient computational resources, averaging terabytesof climate ensembles cannot be done interactively using previoussolutions, which not only makes mistakes costly but also severelyimpedes or even prevents a comprehensive exploration.
In the proposed work, we aim to address these challenges byutilizing progressive algorithms in recognition of the utility of inter-mediate or partial results for the realization of a genuinely interactivedata analysis and visualization environment. The key to streamliningthe data access and aggregation lies in the ability to allow the user tofocus on high-level logic while automating low-level data operations.To this end, we introduce an embedded domain-specific language(EDSL) to hide such low-level complexity from the user. For dataanalysis workflows created using the proposed EDSL, the user canfocus on operations directly associated with the analysis, such asstatistical operations and comparison, whereas details such as thesource location, data transfer, file formats, and grid resolutions, areautomatically handled by the language runtime system. To speed updata processing, the system accesses and transfers the least amountof data possible for the given computation. The generality of theEDSL allows great flexibility in its interpretation, enabling a suit-able runtime system to exploit task parallelism appropriate for large,dispersed data. The design of the runtime system focuses on mul-tiresolution storage and visualization such that preliminary resultscan be obtained without significant delay, followed by progressiverefinement. Our key contributions are:
1. An embedded DSL based on JavaScript that provides a simpleand abstract description of sophisticated analysis and visual-ization workflows;
2. The corresponding runtime system that executes a given work-flow in an interruptible, progressive manner and enables dy-namic selection of various computational parameters; and
3. An end-to-end pipeline for automatic conversion and cachingthat enables transparent multiresolution access to distributeddatasets of different formats.
2 RELATED WORK
In this section, we examine related work and discuss how it compareswith our efforts.General Integrated Visualization Environment. To lower the ac-cess barriers for complex visualization techniques, integrated visu-alization systems, such as VisIt [7] and Paraview [2], have been in-troduced to allow domain scientists to easily visualize their datasetsusing different algorithms, such as iso-surfaces, volume rendering,and streamlines. However, even though these integrated systemsprovide extensive visualization capabilities and customized scripting,it is necessary to manually specify data types, and explicitly definethe exact data structures that will be produced by the built-in scripts.Even simply combining data of different resolutions is non-trivial.Furthermore, these applications are not capable of displaying incre-mental updates necessary to maintain interactivity, and thereforeentail workflows that involve scripts and processes with many ofthe same characteristics as the offline workflow. Essentially, the ex-ploratory analysis process suffers from high “latencies” in the sense
that parameter modifications or other changes require potentiallylengthy reevaluations.Domain-Specific Visualization Systems. Besides the general inte-grated visualization environment, many systems focus on a specificdomain such as climate analysis (UV-CDAT [35], DV3D [27]). Byconcentrating on a more specific application, these systems usuallyhave fewer but more specialized capabilities. For example, UV-CDAT is designed for climate data visualization. By incorporatingmany standard analysis and visualization techniques for climate data,the scientists have an easy-to-use tool that is adequate for most visu-alization needs. However, for a modified workflow, as pointed out byour collaborator, the scientists is often required to write customizedcode to fill in missing features in these domain-specific visualiza-tion systems. He suggests the proposed embedded domain-specificlanguage can tremendously simplify and streamline such a process.Remote Data Access. Scientific analysis tools such as VisIt andParaview enable complex workflows but struggle with remote data,and setting up the workflows can be difficult. Local data analysistools can benefit from protocols such as OPeNDAP [1] that providelocal access to remote data, but these protocols are tied to the samelimitations as the underlying fixed-resolution data formats they serve,and do not do anything to facilitate the hierarchical access needed toscale interactive systems to extremely large data sizes.Workflow Management Systems. There exist sophisticated dis-tributed workflow management systems like Pegasus [11] and Ke-pler [25], but these are defined largely for offline use for whichrobustness to failures, data provenance, workflow abstraction, andreliability are the key concerns, and their use is not amenable to therequirements of an interactive system.Domain-Specific Languages. Languages such as Diderot [18] andViSlang [33] are specialized DSLs designed for visualization and donot handle remote data. Our work is intended for data processingof possibly remote data often used for the analysis and comparisonof scientific datasets, rather than focused purely on visualization-specific tasks. Other DSLs, such as Ebb [3] and Simit [19], aredesigned for physical simulation while abstracting execution envi-ronments to enable CPU, GPU, and parallel execution of commoncode. Others, such as Vivaldi [8], combine a specialized DSL forvisualization with a mixed execution model. Our DSL and asso-ciated runtime enable interactive exploration through progressiveremote data access and interruptible analyses rather than reducingtotal computation time by utilizing such hybrid execution back-ends. The results of our processing nodes could be used as inputfor visualization-specific DSLs such as Vivaldi or Diderot, enablingthese languages to be used for the visualization of a wider range oflocal and remote data. Languages such as Ebb or Simit could beuseful to perform more efficient server-side computation for whichinterruptibility may be less desirable than fast computation.Runtime Loop Optimizations. Portability and optimization ofanalysis programs is an issue that has been addressed with the use ofdirectives such as provided by OpenACC [5] and OpenMP [10],cross compilers that create optimized versions of some othercode [13, 26], and wrappers to provide a specific specialized set ofportable optimized functions. Thrust [17], RAJA [32]. Kokkos [14]provides vector libraries to manage multidimensional arrays withpolymorphic layouts and map those operations to fast manycoreimplementations. Overall, these works focus on providing specificoptimizations of existing code rather than enabling a simple semanticfor scientists to express iterative computations.
3 BACKGROUND
In this work, we strive to present the user with intermediate orpartial results quickly and then progressively refine them. One as-pect we exploit is the spatial resolution of data. As a result, webuild the proposed system on top of an existing multiresolution
2
To appear in IEEE Symposium on Large Data Analysis and Visualization (LDAV) 2016
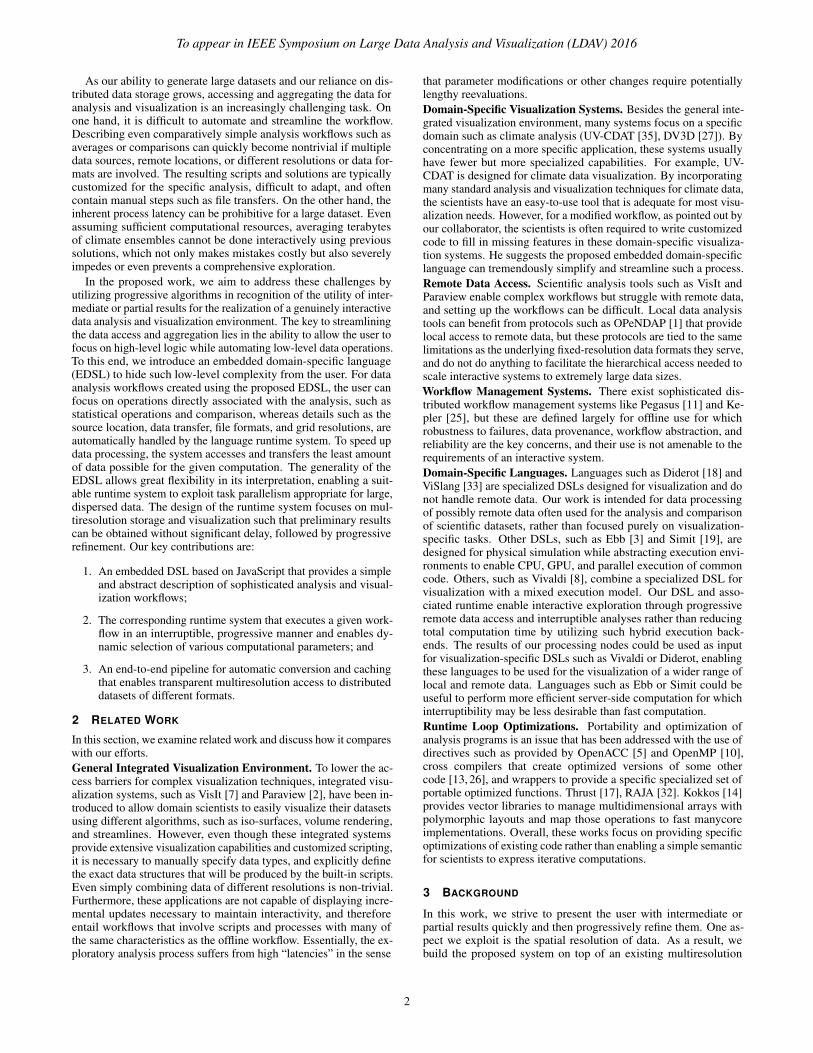
data storage and visualization framework. The ViSUS Visualiza-tion Framework [30, 31] enables streaming access to arbitrarilyhigh-resolution imagery through the use of an efficient multires-olution data reordering based on the hierarchical Morton Z-orderspace-filling curve [29]. As illustrated in Fig. 2, by utilizing amultiresolution data layout, data can be loaded and visualized atcoarse resolution, then successively refined as more data is streamedinto the system. Without loading the full dataset, preliminary resultscan be rapidly obtained. Localized queries are also optimized usingthe Morton data order, the layout of which naturally favors localrectilinear queries. The proposed DSL and runtime are logicallyseparated from the underlying multiresolution data format used bythe system. Multiresolution formats range from simple octree tomore complex multiresolution scheme such as [16, 37]. The dataformat used in this work could be replaced by one of these othermultiresolution approaches and the work would still retain most ofthe benefits provided by the proposed DSL. Details of the multireso-lution and data reordering algorithms are outside the scope of thiswork, and readers are encouraged to explore the references above formore information. Similar to other integrated visualization systems(e.g., VisIt or Paraview), the ViSUS framework also includes a setof common visualization algorithms, such as volume rendering andiso-surface extraction. The framework is multithreaded and imple-ments a directed acyclic graph, message-based dataflow pipelinesuch that messages can be “published” by a given node to connectednodes. The multithreaded implementation enables visualization andcomputation tasks to be carried out simultaneously.
Figure 2: Illustration of multiresolution data loading compared toloading from a “flat” row-major format. Using multiresolution IDX,coarse resolution data can be loaded in much less time, providingquick preliminary results.
4 METHOD
In this section, we discuss the design and implementation of theembedded domain-specific language (EDSL) and complementaryruntime system. The overall system is illustrated in Fig. 1(a). Thepipeline works as follows. An EDSL script is executed incrementallyon the visualization client. When data is needed by the script, theclient requests it from the multiresolution server, which first checksits local cache and if found immediately fulfills the request. If cacheddata is not found, the server requests the on-demand data reorderingservice to produce a multiresolution version of the data, which iscached and sent to the client. The visualization client producesresults incrementally as they are computed. What differentiates theproposed system from existing progressive visualization techniquesis the ability to utilize an embedded domain-specific language tospecify data analysis workflows that hide the complexity originatingfrom combining multiple input sources and spatial resolutions, andan interruptible script processing engine that facilitates progressivecomputation. Such a design provides the user tremendous expressivepower to write custom, reusable analysis workflows suitable for rapiddata exploration.
The embedded language introduced next is designed to permit thetypes of interpretation necessary for an interactive system without
compromising expressiveness or accuracy, and the runtime systemand scripting engine introduced in Section 4.2 enable interactiveexecution of these scripts.
4.1 Data Processing Embedded DSL
Our goal is to provide a simple and abstract language for describingrich data processing tasks that relieves users from having to dealwith mundane tasks such as data import and resampling (also called“regridding”) and allows for incremental execution suitable for aninteractive environment. We assert that necessary modifications tothe host language can be limited to three aspects, discussed in thefollowing sections, to be sufficient to facilitate interactive evaluationof generic data processing scripts.
1. A new built-in data type that abstracts the common modalitiesof scientific data (e.g., scalar or vector field data) and can beused directly as a first class citizen of the language withoutregard to format, resolution, or location of the underlying data;
2. A hinting mechanism to facilitate incremental production ofthe results of ongoing computations (i.e., long-running scripts)by indicating to the runtime system appropriate opportunitiesat which the current state of the computation can be shown;and
3. A generic multidimensional iterator for loops that can be per-formed in any order (e.g., for computing an average) thatpermits nonlinear evaluation of the loop body by the runtimesystem such that incremental results potentially converge fastertoward the final result, and allows for parallelization of theseloops.
In the remainder of this section, we will explain each languageaddition in detail and present a simple example script to illustratethem.Abstract Data Type. An abstract data type is necessary in orderto enable spatiotemporal data manipulation using a uniform andgeneric interface without regard to format, resolution, or location.The use of this type avoids embedding details in the data processingscripts concerning the management of the underlying data. Theruntime system will handle data loading, resampling, and conversionto a common format. We chose to make this a built-in type of theEDSL to enable features such as operator overloading that might nototherwise be feasible in the host language.
The specific methods provided by our EDSL include statisticalsummary operations such as mean and variance, multifield opera-tions that perform element-wise amalgamation such as average andmaximum, and operations such as convolve that involve some degreeof global dataset-wide access. A complete listing of the abstract datatype methods is provided in the addendum. Operator overloadingis provided to enable natural expression of element-wise operationsbetween fields of the new data type or with scalars. These methodsare sufficient for constructing arbitrarily sophisticated scripts for thecomputation of temporal averages, rank correlations, image segmen-tations, maximum intensity projections, and other types of outputused in scientific data analyses.Explicit Data Publishing Hints. Streaming algorithms provide in-cremental results based on incoming data that represent the best pos-sible computation for the currently available input. These snapshotsof ongoing computations present the user with an approximationof the final results of long-running operations, enabling errors tobe caught and addressed much sooner. Feedback is particularlydesirable for users of an interactive system, but for script-drivenanalysis the best times to show these incremental results are notalways apparent. Attempting automatic determination could resultin showing incorrect or undesirable results, such as when a script
3
To appear in IEEE Symposium on Large Data Analysis and Visualization (LDAV) 2016
utilizes an output variable as a temporary. In order to show pro-gressive results for streaming computations while avoiding outputat the wrong time, we introduce the doPublish primitive operation,which indicates appropriate times for the scripting engine to sendthe current computation results, designated output in Listing 1 be-low, to the visualization system. Using this primitive enables thecorresponding workflows to be progressive with partial results beingcomputed and updated continuously. The doPublish primitive has noeffect on the computation itself, and can be safely ignored, enablingthe runtime system to refresh output presented to the user at intervalssuitable to maintain interactivity.Generalized Multidimensional Iterators. To complement the pro-gressive asynchronous updates enabled by doPublish, we introducean iterator for order-independent loops called unordered. This gen-eralized facility allows for a variety of beneficial execution methodsto be utilized by the runtime system, and provides for the expressionof multidimensional loops that is both elegant and flexible. Theunordered primitive accepts as parameters the name of the variableto be used as an index inside the loop and the extents of the loopiterator. Loop indices are considered constant within the body of thecomputation. The result of the loop should be the same regardlessof the order of execution (except for floating point differences thatwould be expected to occur anyway), and it is considered a bug forthe user to construct an unordered loop body that depends on someparticular order of execution. In addition to parallelization, otheruseful interpretations of unordered loops are described in detail inSection 4.2.
The proposed EDSL described in this section primarily consistsof JavaScript extended with these carefully chosen primitives andnew built-in data type for scientific data. It allows users to expresscommon workflows in an abstract manner, suitable for interactiveexecution. In Section 4.2, we introduce a runtime scripting enginedesigned for progressive, interactive execution of these EDSL scriptsfor computations over arbitrarily large, disparately located datasets.An example script is presented next that illustrates the EDSL featuresdescribed above.Example Script. Listing 1 shows an example of a basic incrementalcomputation using the proposed EDSL. The script makes use ofWelford’s method [20, 40] to compute a monthly average of hourlytemporal climate data. The script is able to express in very terseterms a significant operation without the user needing to explicitlyaddress input formats, data resolution, or output type. Notice theuse of the overloaded arithmetic operators +, -, += in the statementoutput += (f-output) / (i+1). For this expression, output and f aremembers of our new abstract data type representing the current stateof the incremental average computation and the field at the currenttimestep of the iteration, respectively. The unordered loop could beinterpreted just like a normal for loop, but using this facility enablesother execution methods as described in Section 4.2. The doubleopening and closing brackets around the two statements designate acritical section. If the loop were executed in parallel by the runtimesystem, these would be necessary to ensure that the current outputand the running count are updated atomically.
Listing 1: EDSL script for incremental computation of a temporalaverage using hourly data from the 7km GEOS-5 Nature Run simu-lation. Notice the ability to succinctly express a significant operationwithout explicitly addressing input format, resolution, dimension, oroutput type./ / Computes r u n n i n g averagef i e l d = ’TOTSCATAU’ ; / / a e r o s o l s c a t t e r i n gs t a r t = q u e r y t i m e ; / / c u r r e n t t i m ewid th = 720 ; / / 720 hours (30 days )
o u t p u t = Array . New ( ) ; / / i n i t i a l i z e o u t p u tv a r i =0 ;u n o r d e r e d ( t , [ s t a r t , s t a r t + wid th ] ) / / 1d i t e r a t o r , i n d e x t
{f = i n p u t [ f i e l d +” ? t ime =”+ t ] ; / / read f i e l d a t t i m e t
/ / c r i t i c a l s e c t i o n f o r r u n n i n g average :/ / average and c o u n t must be upda ted a t o m i c a l l y{{
o u t p u t += ( f−o u t p u t ) / ( i + 1 ) ; / / We l fo rd ’ s methodi ++;
}}
d o P u b l i s h ( ) ; / / show c u r r e n t r e s u l t}
For comparison, a similar computation in the VisIt expressionsPython-based EDSL would require creating a specific class templatestructure in which the user must explicitly define output type anddimensions and manually create the VTK arrays to be computedby the script. The VisIt EDSL contains a specific function forcomputing temporal averages, average over time, but this type ofspecialization, in addition to being unnecessary in the proposedEDSL, does not facilitate progressive display of in-progress resultsthat are a focus of the proposed system in order to provide quick andpreliminary visualization.
Please refer to the Appendix of this work for a comprehensivespecification of the EDSL.
4.2 Progressive Runtime System
Now we present the complementary runtime system for the EDSLpresented in section 4.1, which incorporates an interruptible scriptprocessing engine to evaluate scripts in an interactive manner byenabling tuning of any necessary parameters in order to enable com-putations to be performed quickly and incrementally. Through thegenericity of the EDSL, the runtime system also enables direct andtransparent transition from a local execution to a distributed work-flow, including server-side execution and caching. To demonstratethe scripting engine presented here, we wrote our own JavaScriptinterpreter, used by the engine to directly execute scripts without anycompilation to byte code or significant optimization. Type-checkingis enabled at runtime using exceptions, which display the problem-atic line of the script and a detailed error message to the user toenable debugging. The presented runtime system utilizes techniquessuch as multiresolution streaming and low-discrepancy sampling toproduce progressive results from streaming input data. The goal ofthe system is to minimize the tradeoffs between accuracy and speedwhile continuously providing useful results during interactive dataexploration.
The following paragraphs describe the features of the runtimesystem that enable practical data exploration through interactiveinterpretation of EDSL scripts, including implementation of the built-in scientific data type, design of the progressive scripting engine,making effective use of order-independent loops and parallelization,and our method for remote or distributed script processing.Multiresolution Streaming. Our runtime system reads and cachesinput data using a lossless multiresolution format that provides ef-ficient coarse-to-fine data loading and much faster access to localregions of interest compared to traditional row- or column-majororder data [29]. In order to provide transparent access to multiresolu-tion data from other data formats, an on-demand reordering facilityis presented in section 4.3. Multiresolution data can be used toprovide fast cursory computations by displaying the result of aninitial coarse-resolution execution while refining it to provide moredetails when they are needed. The results of computation usingcoarse-resolution data can also be surprisingly accurate. One of ourcase studies in section 5 compares these results by performing thesame computation at different resolutions. See Fig. 11 in that sectionfor more details.Built-in Data Model. The runtime scripting engine utilizes a fast
4
To appear in IEEE Symposium on Large Data Analysis and Visualization (LDAV) 2016
C++ Array type to provide efficient implementations of the opera-tions defined for the EDSL built-in data type, similar to the numpypackage for Python [39]. Since datasets can be manipulated withoutregard to their location, the runtime system uses additional metadataassociated with a script to map its inputs to their corresponding localor remote data locations. Data read from remote locations is auto-matically cached on the local system, and the results of a given scriptexecution can be cached as well, allowing comparison of new resultswith previously computed data. Finally, the EDSL specifies element-wise operations that can be performed independent of the resolutionof the operands. Variables of this type must be implicitly resampledto the same resolution to be combined or compared. By default, thescripting engine uses upsampling to the largest resolutions in eachdimension of the given operands and linear interpolation for resam-pling. These methods, however, can be changed by the user at anytime without modification to the original script. Resampling data inorder to perform computations among different models is a seriousimpediment for scientists, and we present a powerful case studyin section 5 that demonstrates our system’s ability to effortlesslyfacilitate comparison of multiple climate ensembles.Progressivity and Incremental Results. When the runtime scriptinterpreter encounters doPublish in a script, it can produce, or “pub-lish”, the current state of an ongoing computation to provide theuser with important and timely feedback. Such a call can be safelyignored by the downstream visualization without adverse effectsto the computation, enabling results to be displayed at suitable in-tervals to maintain interactivity. The scripting engine implementsdoPublish as an asynchronous callback that creates a copy of the cur-rent computation output to be displayed by the visualization client.If a previously published result has not yet been displayed by thevisualization system, that result is simply replaced with the newoutput, ensuring smooth performance of the rest of the system whileallowing script execution to continue uninterrupted.
Figure 3: Results of a temporal average computation (Listing 1)via two different orderings for the inner loop. The error (plotted asRMSE) between the precomputed result and the incremental resultdecreases quickly when utilizing the low-discrepancy van der Corputsequence of timesteps versus a simple linear sequence.Loop Order and Parallelization. The EDSL presented in section4.1 introduced the unordered primitive to allow explicit declarationof order-independent multidimensional loops. These calculationsare common in scientific data analyses, yet their properties are rarelyexploited. For many iterative calculations, using an input orderingwith low discrepancy can lead to faster convergence of successiveiterations to the final solution compared to a simple linear sequence.The desirable qualities of a low-discrepancy ordering are uniformityand incrementality, such that samples are evenly distributed overthe given range, and decent coverage will have been achieved if theprocessing is terminated at any point in the sequence [24].
Consider the incremental average script from Listing 1. Thisscript could simply use a for loop, but since the final result of thecomputation does not depend on the order of loop iterations, we canchoose a superior ordering that converges significantly faster. Fig. 3
illustrates the difference of using a linear ordering compared to thelow-discrepancy sequence introduced by van der Corput [12] forthe incremental result of this computation. For higher dimensionaliterators, the Halton sequence [15] can be used. Fundamentally, anyevaluation order can be chosen at runtime for these loops, allowingthe flexibility to choose different orderings, for example to maximizethe use of cached data.
(a) (b) (c)
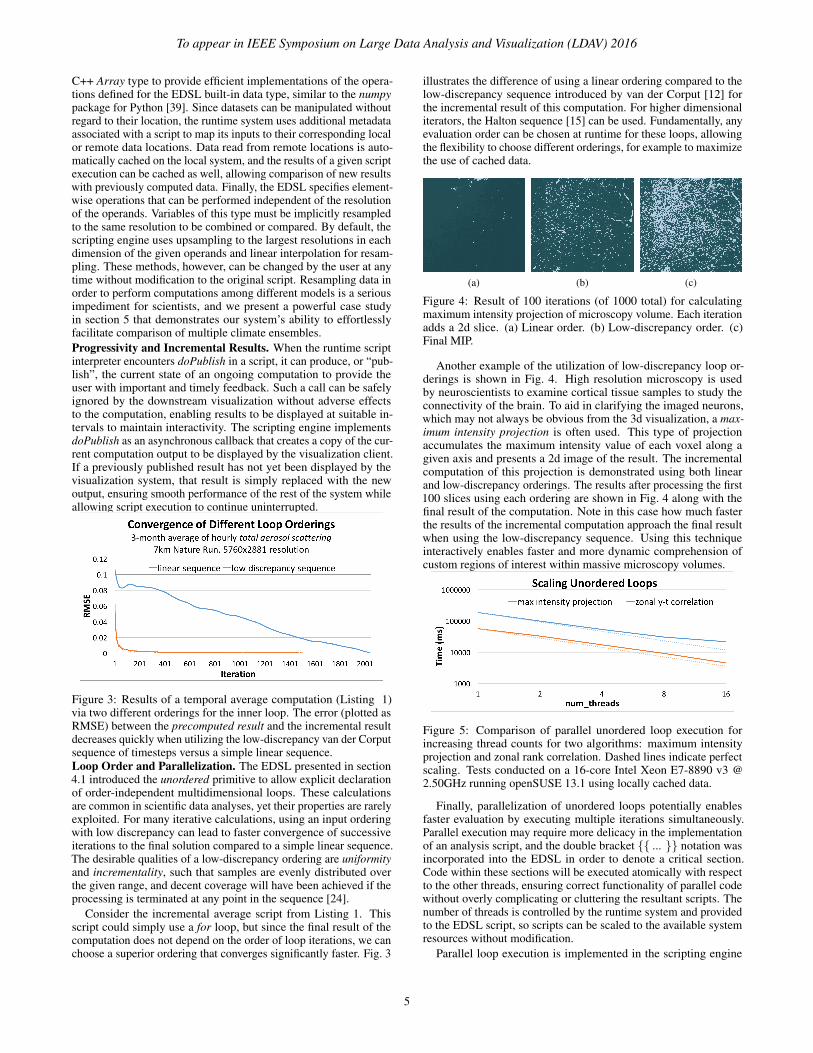
Figure 4: Result of 100 iterations (of 1000 total) for calculatingmaximum intensity projection of microscopy volume. Each iterationadds a 2d slice. (a) Linear order. (b) Low-discrepancy order. (c)Final MIP.
Another example of the utilization of low-discrepancy loop or-derings is shown in Fig. 4. High resolution microscopy is usedby neuroscientists to examine cortical tissue samples to study theconnectivity of the brain. To aid in clarifying the imaged neurons,which may not always be obvious from the 3d visualization, a max-imum intensity projection is often used. This type of projectionaccumulates the maximum intensity value of each voxel along agiven axis and presents a 2d image of the result. The incrementalcomputation of this projection is demonstrated using both linearand low-discrepancy orderings. The results after processing the first100 slices using each ordering are shown in Fig. 4 along with thefinal result of the computation. Note in this case how much fasterthe results of the incremental computation approach the final resultwhen using the low-discrepancy sequence. Using this techniqueinteractively enables faster and more dynamic comprehension ofcustom regions of interest within massive microscopy volumes.
Figure 5: Comparison of parallel unordered loop execution forincreasing thread counts for two algorithms: maximum intensityprojection and zonal rank correlation. Dashed lines indicate perfectscaling. Tests conducted on a 16-core Intel Xeon E7-8890 v3 @2.50GHz running openSUSE 13.1 using locally cached data.
Finally, parallelization of unordered loops potentially enablesfaster evaluation by executing multiple iterations simultaneously.Parallel execution may require more delicacy in the implementationof an analysis script, and the double bracket {{ ... }} notation wasincorporated into the EDSL in order to denote a critical section.Code within these sections will be executed atomically with respectto the other threads, ensuring correct functionality of parallel codewithout overly complicating or cluttering the resultant scripts. Thenumber of threads is controlled by the runtime system and providedto the EDSL script, so scripts can be scaled to the available systemresources without modification.
Parallel loop execution is implemented in the scripting engine
5
To appear in IEEE Symposium on Large Data Analysis and Visualization (LDAV) 2016
using a thread pool for each unordered loop and assigning the workof one iteration to each thread, with a shared context of globalvariables and a thread-local context for variables introduced in theiteration block. Critical sections are facilitated by using a sharedlock per loop. This strategy enables nested unordered loops, butone should beware of the potential explosion of tasks and considerrewriting the loop to instead utilize a multidimensional version of theunordered iterator. As shown in Fig. 5, parallelizing the executionof order-independent loops can provide a modest speedup even forrelatively naive algorithms. Permitting simple scripts to make betteruse of processing resources is a benefit to the user that permits morepractically useful interactive data exploration.Server-side Processing. The multiresolution data server containsan identical version of the scripting engine used by the visualizationclient (see Fig. 1). Server-side processing can be utilized to performcomputations using remote resources and thereby reduce data trans-mission. For example, when combining many ensemble membersinto a single average, the amount of data to be sent to the client canbe dramatically reduced by first combining the inputs on the serverand then sending only the result to the client. On the other hand, ifserver-side resources are scarce or in high demand, it may be moreefficient to transmit data directly to the client, perhaps at lower reso-lution to reduce network bandwidth. The runtime system specifieswhether or not to perform a computation remotely without requiringany modification to the input script, enabling a single script to beexecuted on either the client or the server. Multiple scripts can beincorporated within larger dataflows to mix both client- and server-side processing. The location on which to execute a computation iscurrently specified by the user on a per-script basis, but future workwill aim to address automatic selection based on available resources.
For the implementation of the runtime system, we extended theViSUS framework mentioned in section 3 to include a new scriptingengine that enables execution of generic EDSL scripts in a mannerthat is both progressive and accurate by making effective use ofmultiresolution data, asynchronous output, flexible iterator orderings,remote computation resources, and parallelization. A novel dataingest system was also added to automatically resample the variousinput datasets specified in the script to a common domain duringI/O. High-level support was added to the UI for the selection ofthe various runtime parameters, such as the default order used formultidimensional iterators.
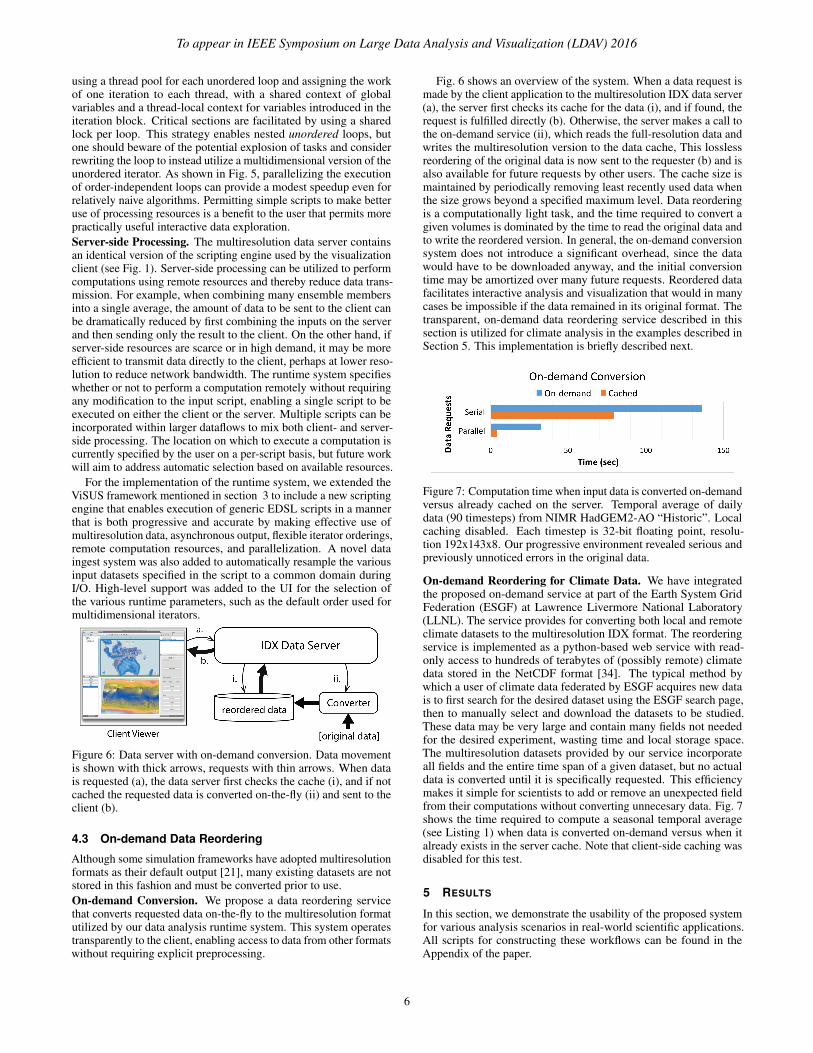
Figure 6: Data server with on-demand conversion. Data movementis shown with thick arrows, requests with thin arrows. When datais requested (a), the data server first checks the cache (i), and if notcached the requested data is converted on-the-fly (ii) and sent to theclient (b).
4.3 On-demand Data Reordering
Although some simulation frameworks have adopted multiresolutionformats as their default output [21], many existing datasets are notstored in this fashion and must be converted prior to use.On-demand Conversion. We propose a data reordering servicethat converts requested data on-the-fly to the multiresolution formatutilized by our data analysis runtime system. This system operatestransparently to the client, enabling access to data from other formatswithout requiring explicit preprocessing.
Fig. 6 shows an overview of the system. When a data request ismade by the client application to the multiresolution IDX data server(a), the server first checks its cache for the data (i), and if found, therequest is fulfilled directly (b). Otherwise, the server makes a call tothe on-demand service (ii), which reads the full-resolution data andwrites the multiresolution version to the data cache, This losslessreordering of the original data is now sent to the requester (b) and isalso available for future requests by other users. The cache size ismaintained by periodically removing least recently used data whenthe size grows beyond a specified maximum level. Data reorderingis a computationally light task, and the time required to convert agiven volumes is dominated by the time to read the original data andto write the reordered version. In general, the on-demand conversionsystem does not introduce a significant overhead, since the datawould have to be downloaded anyway, and the initial conversiontime may be amortized over many future requests. Reordered datafacilitates interactive analysis and visualization that would in manycases be impossible if the data remained in its original format. Thetransparent, on-demand data reordering service described in thissection is utilized for climate analysis in the examples described inSection 5. This implementation is briefly described next.
Figure 7: Computation time when input data is converted on-demandversus already cached on the server. Temporal average of dailydata (90 timesteps) from NIMR HadGEM2-AO “Historic”. Localcaching disabled. Each timestep is 32-bit floating point, resolu-tion 192x143x8. Our progressive environment revealed serious andpreviously unnoticed errors in the original data.
On-demand Reordering for Climate Data. We have integratedthe proposed on-demand service at part of the Earth System GridFederation (ESGF) at Lawrence Livermore National Laboratory(LLNL). The service provides for converting both local and remoteclimate datasets to the multiresolution IDX format. The reorderingservice is implemented as a python-based web service with read-only access to hundreds of terabytes of (possibly remote) climatedata stored in the NetCDF format [34]. The typical method bywhich a user of climate data federated by ESGF acquires new datais to first search for the desired dataset using the ESGF search page,then to manually select and download the datasets to be studied.These data may be very large and contain many fields not neededfor the desired experiment, wasting time and local storage space.The multiresolution datasets provided by our service incorporateall fields and the entire time span of a given dataset, but no actualdata is converted until it is specifically requested. This efficiencymakes it simple for scientists to add or remove an unexpected fieldfrom their computations without converting unnecesary data. Fig. 7shows the time required to compute a seasonal temporal average(see Listing 1) when data is converted on-demand versus when italready exists in the server cache. Note that client-side caching wasdisabled for this test.
5 RESULTS
In this section, we demonstrate the usability of the proposed systemfor various analysis scenarios in real-world scientific applications.All scripts for constructing these workflows can be found in theAppendix of the paper.
6
To appear in IEEE Symposium on Large Data Analysis and Visualization (LDAV) 2016
5.1 Climate Simulation
Global climate research has become a major undertaking of manygovernments and organizations in order to understand the primarycauses of the unusual warming observed over the past severaldecades, as well as to determine the extent to which this warmingcan be mitigated by changes in human behavior such as a reductionin carbon dioxide emissions.
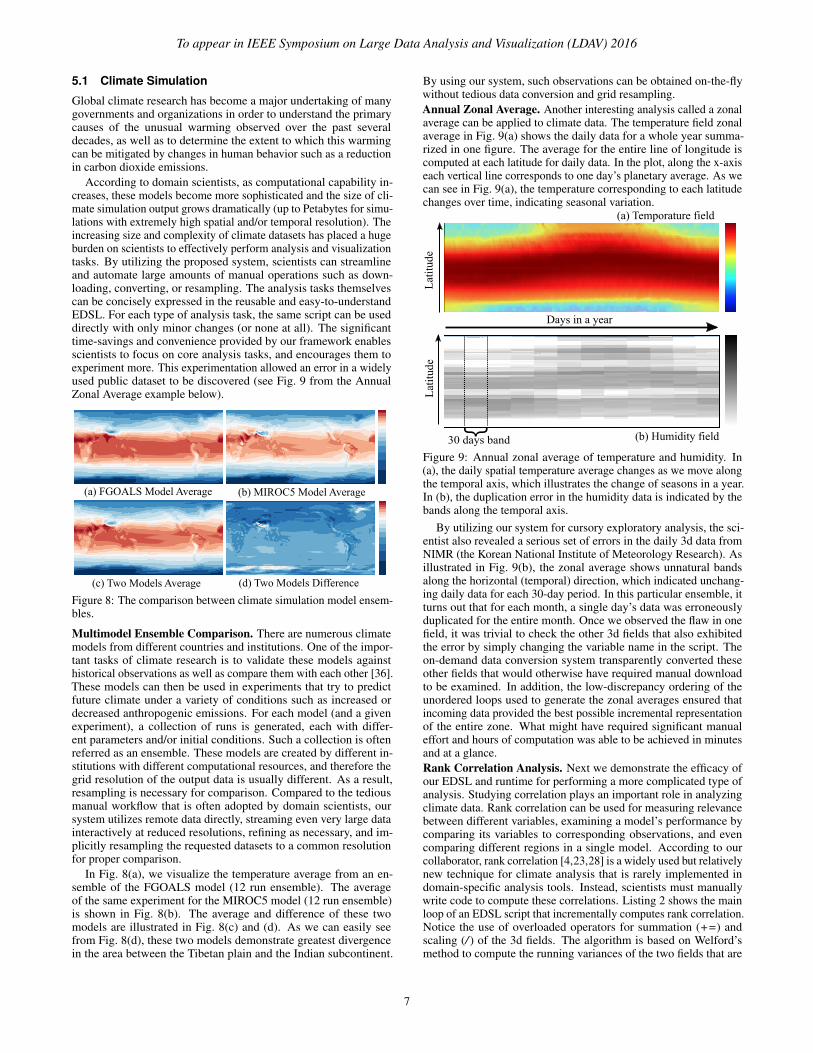
According to domain scientists, as computational capability in-creases, these models become more sophisticated and the size of cli-mate simulation output grows dramatically (up to Petabytes for simu-lations with extremely high spatial and/or temporal resolution). Theincreasing size and complexity of climate datasets has placed a hugeburden on scientists to effectively perform analysis and visualizationtasks. By utilizing the proposed system, scientists can streamlineand automate large amounts of manual operations such as down-loading, converting, or resampling. The analysis tasks themselvescan be concisely expressed in the reusable and easy-to-understandEDSL. For each type of analysis task, the same script can be useddirectly with only minor changes (or none at all). The significanttime-savings and convenience provided by our framework enablesscientists to focus on core analysis tasks, and encourages them toexperiment more. This experimentation allowed an error in a widelyused public dataset to be discovered (see Fig. 9 from the AnnualZonal Average example below).
(a) FGOALS Model Average (b) MIROC5 Model Average
(c) Two Models Average (d) Two Models Difference
Figure 8: The comparison between climate simulation model ensem-bles.
Multimodel Ensemble Comparison. There are numerous climatemodels from different countries and institutions. One of the impor-tant tasks of climate research is to validate these models againsthistorical observations as well as compare them with each other [36].These models can then be used in experiments that try to predictfuture climate under a variety of conditions such as increased ordecreased anthropogenic emissions. For each model (and a givenexperiment), a collection of runs is generated, each with differ-ent parameters and/or initial conditions. Such a collection is oftenreferred as an ensemble. These models are created by different in-stitutions with different computational resources, and therefore thegrid resolution of the output data is usually different. As a result,resampling is necessary for comparison. Compared to the tediousmanual workflow that is often adopted by domain scientists, oursystem utilizes remote data directly, streaming even very large datainteractively at reduced resolutions, refining as necessary, and im-plicitly resampling the requested datasets to a common resolutionfor proper comparison.
In Fig. 8(a), we visualize the temperature average from an en-semble of the FGOALS model (12 run ensemble). The averageof the same experiment for the MIROC5 model (12 run ensemble)is shown in Fig. 8(b). The average and difference of these twomodels are illustrated in Fig. 8(c) and (d). As we can easily seefrom Fig. 8(d), these two models demonstrate greatest divergencein the area between the Tibetan plain and the Indian subcontinent.
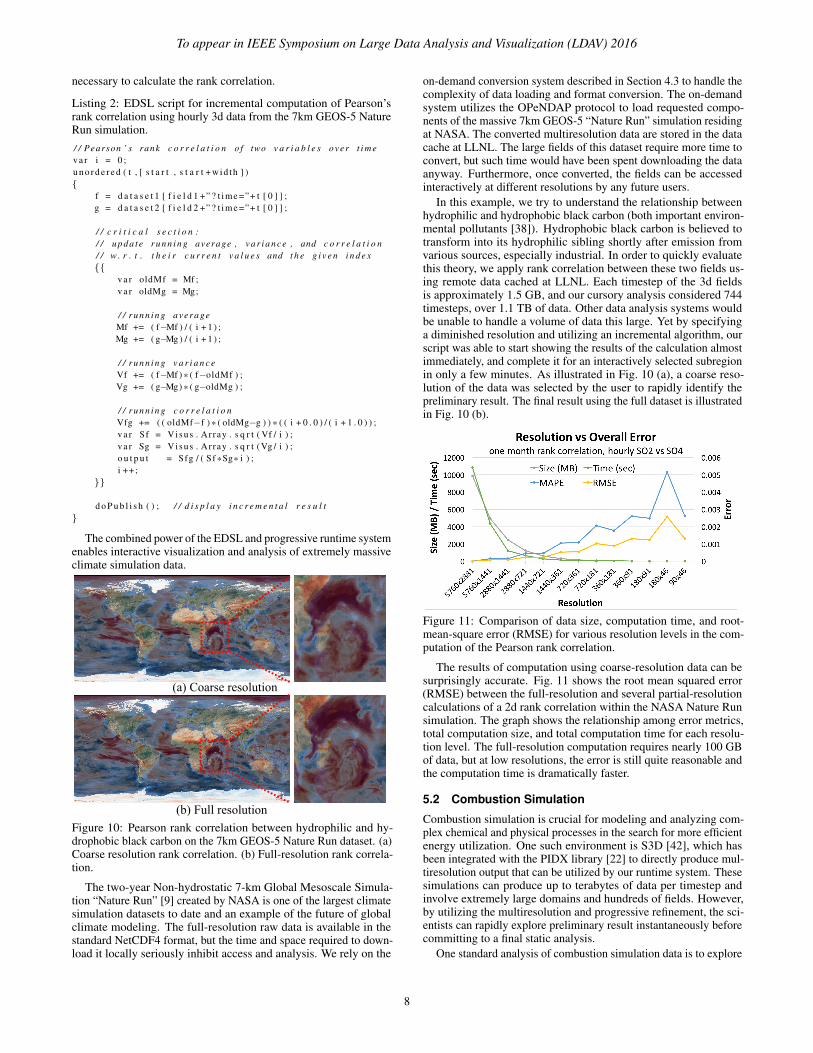
By using our system, such observations can be obtained on-the-flywithout tedious data conversion and grid resampling.Annual Zonal Average. Another interesting analysis called a zonalaverage can be applied to climate data. The temperature field zonalaverage in Fig. 9(a) shows the daily data for a whole year summa-rized in one figure. The average for the entire line of longitude iscomputed at each latitude for daily data. In the plot, along the x-axiseach vertical line corresponds to one day’s planetary average. As wecan see in Fig. 9(a), the temperature corresponding to each latitudechanges over time, indicating seasonal variation.
Lat
itud
e
Days in a year
{30 days bandL
atit
ude
(b) Humidity field
(a) Temporature field
Figure 9: Annual zonal average of temperature and humidity. In(a), the daily spatial temperature average changes as we move alongthe temporal axis, which illustrates the change of seasons in a year.In (b), the duplication error in the humidity data is indicated by thebands along the temporal axis.
By utilizing our system for cursory exploratory analysis, the sci-entist also revealed a serious set of errors in the daily 3d data fromNIMR (the Korean National Institute of Meteorology Research). Asillustrated in Fig. 9(b), the zonal average shows unnatural bandsalong the horizontal (temporal) direction, which indicated unchang-ing daily data for each 30-day period. In this particular ensemble, itturns out that for each month, a single day’s data was erroneouslyduplicated for the entire month. Once we observed the flaw in onefield, it was trivial to check the other 3d fields that also exhibitedthe error by simply changing the variable name in the script. Theon-demand data conversion system transparently converted theseother fields that would otherwise have required manual downloadto be examined. In addition, the low-discrepancy ordering of theunordered loops used to generate the zonal averages ensured thatincoming data provided the best possible incremental representationof the entire zone. What might have required significant manualeffort and hours of computation was able to be achieved in minutesand at a glance.Rank Correlation Analysis. Next we demonstrate the efficacy ofour EDSL and runtime for performing a more complicated type ofanalysis. Studying correlation plays an important role in analyzingclimate data. Rank correlation can be used for measuring relevancebetween different variables, examining a model’s performance bycomparing its variables to corresponding observations, and evencomparing different regions in a single model. According to ourcollaborator, rank correlation [4,23,28] is a widely used but relativelynew technique for climate analysis that is rarely implemented indomain-specific analysis tools. Instead, scientists must manuallywrite code to compute these correlations. Listing 2 shows the mainloop of an EDSL script that incrementally computes rank correlation.Notice the use of overloaded operators for summation (+=) andscaling (/ ) of the 3d fields. The algorithm is based on Welford’smethod to compute the running variances of the two fields that are
7
To appear in IEEE Symposium on Large Data Analysis and Visualization (LDAV) 2016
necessary to calculate the rank correlation.
Listing 2: EDSL script for incremental computation of Pearson’srank correlation using hourly 3d data from the 7km GEOS-5 NatureRun simulation./ / Pearson ’ s rank c o r r e l a t i o n o f two v a r i a b l e s over t i m ev a r i = 0 ;u n o r d e r e d ( t , [ s t a r t , s t a r t + wid th ] ){
f = d a t a s e t 1 [ f i e l d 1 +” ? t ime =”+ t [ 0 ] ] ;g = d a t a s e t 2 [ f i e l d 2 +” ? t ime =”+ t [ 0 ] ] ;
/ / c r i t i c a l s e c t i o n :/ / up da t e r u n n i n g average , v a r i a n c e , and c o r r e l a t i o n/ / w . r . t . t h e i r c u r r e n t v a l u e s and t h e g i v e n i n d e x{{
v a r oldMf = Mf ;v a r oldMg = Mg;
/ / r u n n i n g averageMf += ( f−Mf ) / ( i + 1 ) ;Mg += ( g−Mg ) / ( i + 1 ) ;
/ / r u n n i n g v a r i a n c eVf += ( f−Mf ) * ( f−oldMf ) ;Vg += ( g−Mg) * ( g−oldMg ) ;
/ / r u n n i n g c o r r e l a t i o nVfg += ( ( oldMf−f ) * ( oldMg−g ) ) * ( ( i + 0 . 0 ) / ( i + 1 . 0 ) ) ;v a r Sf = Visus . Array . s q r t ( Vf / i ) ;v a r Sg = Visus . Array . s q r t ( Vg / i ) ;o u t p u t = Sfg / ( Sf *Sg* i ) ;i ++;
}}
d o P u b l i s h ( ) ; / / d i s p l a y i n c r e m e n t a l r e s u l t}
The combined power of the EDSL and progressive runtime systemenables interactive visualization and analysis of extremely massiveclimate simulation data.
(a) Coarse resolution
(b) Full resolution
Figure 10: Pearson rank correlation between hydrophilic and hy-drophobic black carbon on the 7km GEOS-5 Nature Run dataset. (a)Coarse resolution rank correlation. (b) Full-resolution rank correla-tion.
The two-year Non-hydrostatic 7-km Global Mesoscale Simula-tion “Nature Run” [9] created by NASA is one of the largest climatesimulation datasets to date and an example of the future of globalclimate modeling. The full-resolution raw data is available in thestandard NetCDF4 format, but the time and space required to down-load it locally seriously inhibit access and analysis. We rely on the
on-demand conversion system described in Section 4.3 to handle thecomplexity of data loading and format conversion. The on-demandsystem utilizes the OPeNDAP protocol to load requested compo-nents of the massive 7km GEOS-5 “Nature Run” simulation residingat NASA. The converted multiresolution data are stored in the datacache at LLNL. The large fields of this dataset require more time toconvert, but such time would have been spent downloading the dataanyway. Furthermore, once converted, the fields can be accessedinteractively at different resolutions by any future users.
In this example, we try to understand the relationship betweenhydrophilic and hydrophobic black carbon (both important environ-mental pollutants [38]). Hydrophobic black carbon is believed totransform into its hydrophilic sibling shortly after emission fromvarious sources, especially industrial. In order to quickly evaluatethis theory, we apply rank correlation between these two fields us-ing remote data cached at LLNL. Each timestep of the 3d fieldsis approximately 1.5 GB, and our cursory analysis considered 744timesteps, over 1.1 TB of data. Other data analysis systems wouldbe unable to handle a volume of data this large. Yet by specifyinga diminished resolution and utilizing an incremental algorithm, ourscript was able to start showing the results of the calculation almostimmediately, and complete it for an interactively selected subregionin only a few minutes. As illustrated in Fig. 10 (a), a coarse reso-lution of the data was selected by the user to rapidly identify thepreliminary result. The final result using the full dataset is illustratedin Fig. 10 (b).
Figure 11: Comparison of data size, computation time, and root-mean-square error (RMSE) for various resolution levels in the com-putation of the Pearson rank correlation.
The results of computation using coarse-resolution data can besurprisingly accurate. Fig. 11 shows the root mean squared error(RMSE) between the full-resolution and several partial-resolutioncalculations of a 2d rank correlation within the NASA Nature Runsimulation. The graph shows the relationship among error metrics,total computation size, and total computation time for each resolu-tion level. The full-resolution computation requires nearly 100 GBof data, but at low resolutions, the error is still quite reasonable andthe computation time is dramatically faster.
5.2 Combustion Simulation
Combustion simulation is crucial for modeling and analyzing com-plex chemical and physical processes in the search for more efficientenergy utilization. One such environment is S3D [42], which hasbeen integrated with the PIDX library [22] to directly produce mul-tiresolution output that can be utilized by our runtime system. Thesesimulations can produce up to terabytes of data per timestep andinvolve extremely large domains and hundreds of fields. However,by utilizing the multiresolution and progressive refinement, the sci-entists can rapidly explore preliminary result instantaneously beforecommitting to a final static analysis.
One standard analysis of combustion simulation data is to explore
8
To appear in IEEE Symposium on Large Data Analysis and Visualization (LDAV) 2016
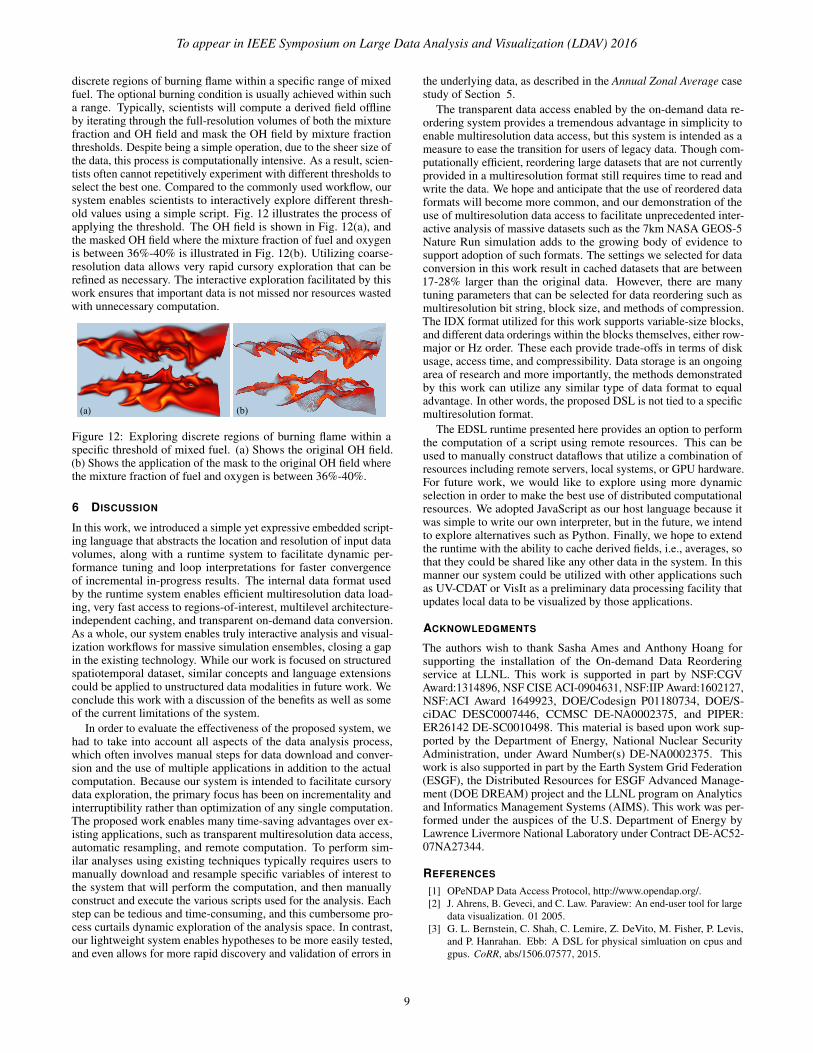
discrete regions of burning flame within a specific range of mixedfuel. The optional burning condition is usually achieved within sucha range. Typically, scientists will compute a derived field offlineby iterating through the full-resolution volumes of both the mixturefraction and OH field and mask the OH field by mixture fractionthresholds. Despite being a simple operation, due to the sheer size ofthe data, this process is computationally intensive. As a result, scien-tists often cannot repetitively experiment with different thresholds toselect the best one. Compared to the commonly used workflow, oursystem enables scientists to interactively explore different thresh-old values using a simple script. Fig. 12 illustrates the process ofapplying the threshold. The OH field is shown in Fig. 12(a), andthe masked OH field where the mixture fraction of fuel and oxygenis between 36%-40% is illustrated in Fig. 12(b). Utilizing coarse-resolution data allows very rapid cursory exploration that can berefined as necessary. The interactive exploration facilitated by thiswork ensures that important data is not missed nor resources wastedwith unnecessary computation.
(a) (b)
Figure 12: Exploring discrete regions of burning flame within aspecific threshold of mixed fuel. (a) Shows the original OH field.(b) Shows the application of the mask to the original OH field wherethe mixture fraction of fuel and oxygen is between 36%-40%.
6 DISCUSSION
In this work, we introduced a simple yet expressive embedded script-ing language that abstracts the location and resolution of input datavolumes, along with a runtime system to facilitate dynamic per-formance tuning and loop interpretations for faster convergenceof incremental in-progress results. The internal data format usedby the runtime system enables efficient multiresolution data load-ing, very fast access to regions-of-interest, multilevel architecture-independent caching, and transparent on-demand data conversion.As a whole, our system enables truly interactive analysis and visual-ization workflows for massive simulation ensembles, closing a gapin the existing technology. While our work is focused on structuredspatiotemporal dataset, similar concepts and language extensionscould be applied to unstructured data modalities in future work. Weconclude this work with a discussion of the benefits as well as someof the current limitations of the system.
In order to evaluate the effectiveness of the proposed system, wehad to take into account all aspects of the data analysis process,which often involves manual steps for data download and conver-sion and the use of multiple applications in addition to the actualcomputation. Because our system is intended to facilitate cursorydata exploration, the primary focus has been on incrementality andinterruptibility rather than optimization of any single computation.The proposed work enables many time-saving advantages over ex-isting applications, such as transparent multiresolution data access,automatic resampling, and remote computation. To perform sim-ilar analyses using existing techniques typically requires users tomanually download and resample specific variables of interest tothe system that will perform the computation, and then manuallyconstruct and execute the various scripts used for the analysis. Eachstep can be tedious and time-consuming, and this cumbersome pro-cess curtails dynamic exploration of the analysis space. In contrast,our lightweight system enables hypotheses to be more easily tested,and even allows for more rapid discovery and validation of errors in
the underlying data, as described in the Annual Zonal Average casestudy of Section 5.
The transparent data access enabled by the on-demand data re-ordering system provides a tremendous advantage in simplicity toenable multiresolution data access, but this system is intended as ameasure to ease the transition for users of legacy data. Though com-putationally efficient, reordering large datasets that are not currentlyprovided in a multiresolution format still requires time to read andwrite the data. We hope and anticipate that the use of reordered dataformats will become more common, and our demonstration of theuse of multiresolution data access to facilitate unprecedented inter-active analysis of massive datasets such as the 7km NASA GEOS-5Nature Run simulation adds to the growing body of evidence tosupport adoption of such formats. The settings we selected for dataconversion in this work result in cached datasets that are between17-28% larger than the original data. However, there are manytuning parameters that can be selected for data reordering such asmultiresolution bit string, block size, and methods of compression.The IDX format utilized for this work supports variable-size blocks,and different data orderings within the blocks themselves, either row-major or Hz order. These each provide trade-offs in terms of diskusage, access time, and compressibility. Data storage is an ongoingarea of research and more importantly, the methods demonstratedby this work can utilize any similar type of data format to equaladvantage. In other words, the proposed DSL is not tied to a specificmultiresolution format.
The EDSL runtime presented here provides an option to performthe computation of a script using remote resources. This can beused to manually construct dataflows that utilize a combination ofresources including remote servers, local systems, or GPU hardware.For future work, we would like to explore using more dynamicselection in order to make the best use of distributed computationalresources. We adopted JavaScript as our host language because itwas simple to write our own interpreter, but in the future, we intendto explore alternatives such as Python. Finally, we hope to extendthe runtime with the ability to cache derived fields, i.e., averages, sothat they could be shared like any other data in the system. In thismanner our system could be utilized with other applications suchas UV-CDAT or VisIt as a preliminary data processing facility thatupdates local data to be visualized by those applications.
ACKNOWLEDGMENTS
The authors wish to thank Sasha Ames and Anthony Hoang forsupporting the installation of the On-demand Data Reorderingservice at LLNL. This work is supported in part by NSF:CGVAward:1314896, NSF CISE ACI-0904631, NSF:IIP Award:1602127,NSF:ACI Award 1649923, DOE/Codesign P01180734, DOE/S-ciDAC DESC0007446, CCMSC DE-NA0002375, and PIPER:ER26142 DE-SC0010498. This material is based upon work sup-ported by the Department of Energy, National Nuclear SecurityAdministration, under Award Number(s) DE-NA0002375. Thiswork is also supported in part by the Earth System Grid Federation(ESGF), the Distributed Resources for ESGF Advanced Manage-ment (DOE DREAM) project and the LLNL program on Analyticsand Informatics Management Systems (AIMS). This work was per-formed under the auspices of the U.S. Department of Energy byLawrence Livermore National Laboratory under Contract DE-AC52-07NA27344.
REFERENCES
[1] OPeNDAP Data Access Protocol, http://www.opendap.org/.[2] J. Ahrens, B. Geveci, and C. Law. Paraview: An end-user tool for large
data visualization. 01 2005.[3] G. L. Bernstein, C. Shah, C. Lemire, Z. DeVito, M. Fisher, P. Levis,
and P. Hanrahan. Ebb: A DSL for physical simluation on cpus andgpus. CoRR, abs/1506.07577, 2015.
9
To appear in IEEE Symposium on Large Data Analysis and Visualization (LDAV) 2016
[4] S. J. Camargo and A. H. Sobel. Western north pacific tropical cycloneintensity and enso. Journal of Climate, 18(15):2996–3006, 2005.
[5] CAPS Enterprise, Cray Inc., NVIDIA, and the Portland Group. TheOpenACC Application Programming Interface v1.0, Nov 2011.
[6] Y.-J. Chiang, C. T. Silva, and W. J. Schroeder. Interactive out-of-coreisosurface extraction. In Visualization’98. Proceedings, pages 167–174.IEEE, 1998.
[7] H. Childs, E. Brugger, B. Whitlock, J. Meredith, S. Ahern, D. Pugmire,K. Biagas, M. Miller, C. Harrison, G. H. Weber, H. Krishnan, T. Fogal,A. Sanderson, C. Garth, E. W. Bethel, D. Camp, O. Rubel, M. Durant,J. M. Favre, and P. Navratil. VisIt: An End-User Tool For Visualizingand Analyzing Very Large Data. In High Performance Visualization—Enabling Extreme-Scale Scientific Insight, pages 357–372. Oct. 2012.
[8] H. Choi, W. Choi, T. M. Quan, D. G. C. Hildebrand, H. Pfister, andW. K. Jeong. Vivaldi: A domain-specific language for volume pro-cessing and visualization on distributed heterogeneous systems. IEEETransactions on Visualization and Computer Graphics, 20(12):2407–2416, Dec 2014.
[9] W. P. da Silva, A.M. and J. Nattala. File specification for the 7-km geos-5 nature run, ganymed release (non-hydrostatic 7-km global mesoscalesimulation), 2014.
[10] L. Dagum and R. Menon. Openmp: an industry standard api for shared-memory programming. Computational Science & Engineering, IEEE,5(1):46–55, 1998.
[11] E. Deelman, K. Vahi, G. Juve, M. Rynge, S. Callaghan, P. J. Maechling,R. Mayani, W. Chen, R. Ferreira da Silva, M. Livny, and K. Wenger. Pe-gasus: a workflow management system for science automation. FutureGeneration Computer Systems, 46:17–35, 2015. Funding Acknowl-edgements: NSF ACI SDCI 0722019, NSF ACI SI2-SSI 1148515 andNSF OCI-1053575.
[12] J. V. der Corput. Verteilungsfunktionen. i. mitt. In Proc. Akad. Wet.Amsterdam, 38, pages 813–821, 1935.
[13] G. F. Diamos, A. R. Kerr, S. Yalamanchili, and N. Clark. Ocelot: Adynamic optimization framework for bulk-synchronous applicationsin heterogeneous systems. In Proceedings of the 19th InternationalConference on Parallel Architectures and Compilation Techniques,PACT ’10, pages 353–364, New York, NY, USA, 2010. ACM.
[14] Edwards, H. C., and D. Sunderland. Kokkos array performance-portable manycore programming model. Proceedings of the 2012International Workshop on Programming Models and Applications forMulticores and Manycores (PMAM 12), pages 1–10, 2012.
[15] J. Halton. On the efficiency of certain quasi- random sequences ofpoints in evaluating multi- dimensional integrals, 1960.
[16] H.-C. Hege, A. Hutanu, R. Kahler, A. Merzky, T. Radke, E. Seidel,and B. Ullmer. Progressive retrieval and hierarchical visualization oflarge remote data. Scalable Computing: Practice and Experience, 6(3),2001.
[17] N. B. J. Hoberock. Thrust: A Productivity-Oriented Library for CUDA,chapter 26, pages 359–371. Morgan Kaufmann, 2012.
[18] G. Kindlmann, C. Chiw, N. Seltzer, L. Samuels, and J. Reppy. Diderot:a domain-specific language for portable parallel scientific visualizationand image analysis. IEEE Transactions on Visualization and ComputerGraphics (Proceedings VIS 2015), 22(1):867–876, Jan. 2016.
[19] F. Kjolstad, S. Kamil, J. Ragan-Kelley, D. I. W. Levin, S. Sueda,D. Chen, E. Vouga, D. M. Kaufman, G. Kanwar, W. Matusik, andS. Amarasinghe. Simit: A language for physical simulation. ACMTrans. Graph., 35(2):20:1–20:21, Mar. 2016.
[20] D. E. Knuth. The Art of Computer Programming, Volume 2 (3rd Ed.):Seminumerical Algorithms. Addison-Wesley Longman Publishing Co.,Inc., Boston, MA, USA, 1997.
[21] S. Kumar, C. Christensen, J. Schmidt, P.-T. Bremer, E. Brugger, V. Vish-wanath, P. Carns, H. Kolla, R. Grout, J. Chen, M. Berzins, G. Scorzelli,and V. Pascucci. Fast multiresolution reads of massive simulationdatasets. In J. Kunkel, T. Ludwig, and H. Meuer, editors, Supercom-puting, volume 8488 of Lecture Notes in Computer Science, pages314–330. Springer International Publishing, 2014.
[22] S. Kumar, V. Vishwanath, P. Carns, J. Levine, R. Latham, G. Scorzelli,H. Kolla, R. Grout, R. Ross, M. Papka, J. Chen, and V. Pascucci.Efficient data restructuring and aggregation for I/O acceleration inPIDX. In Proceedings of the International Conference on High Per-
formance Computing, Networking, Storage and Analysis, pages 50:1–50:11. IEEE Computer Society Press, 2012.
[23] B. Langenbrunner and J. D. Neelin. Analyzing enso teleconnections incmip models as a measure of model fidelity in simulating precipitation.Journal of Climate, 26(13):4431–4446, 2013.
[24] S. R. Lindemann and S. M. LaValle. Incremental low-discrepancylattice methods for motion planning. In Robotics and Automation, 2003.Proceedings. ICRA ’03. IEEE International Conference on, volume 3,pages 2920–2927 vol.3, Sept 2003.
[25] B. Ludascher, I. Altintas, C. Berkley, D. Higgins, E. Jaeger, M. Jones,E. A. Lee, J. Tao, and Y. Zhao. Scientific workflow managementand the kepler system. Concurrency and Computation: Practice andExperience, 18(10):1039–1065, 2006.
[26] G. Martinez, M. Gardner, and W. c. Feng. Cu2cl: A cuda-to-opencltranslator for multi- and many-core architectures. In Parallel and Dis-tributed Systems (ICPADS), 2011 IEEE 17th International Conferenceon, pages 300–307, Dec 2011.
[27] T. Maxwell. Exploratory climate data visualization and analysis usingdv3d and uvcdat. In High Performance Computing, Networking, Stor-age and Analysis (SCC), 2012 SC Companion:, pages 483–487, Nov2012.
[28] M. Mnnich and J. D. Neelin. Seasonal influence of enso on the at-lantic itcz and equatorial south america. Geophysical Research Letters,32(21):n/a–n/a, 2005. L21709.
[29] V. Pascucci and R. J. Frank. Global static indexing for real-time explo-ration of very large regular grids. In G. Johnson, editor, Proceedingsof the 2001 ACM/IEEE conference on Supercomputing, Denver, CO,USA, November 10-16, 2001, CD-ROM, page 2. ACM, 2001.
[30] V. Pascucci, G. Scorzelli, B. Summa, P.-T. Bremer, A. Gyulassy,C. Christensen, and S. Kumar. Scalable visualization and interactiveanalysis using massive data streams. Advances in Parallel Computing:Cloud Computing and Big Data, 23:212–230, 2013.
[31] V. Pascucci, G. Scorzelli, B. Summa, P.-T. Bremer, A. Gyulassy,C. Christensen, S. Philip, and S. Kumar. The ViSUS VisualizationFramework, chapter 19, pages 401–414. Chapman \& Hall/CRC Com-putational Science, 2012.
[32] e. a. R. Hornung, J. Keasler. The raja portability layer: Overview andstatus, 2014.
[33] P. Rautek, S. Bruckner, M. E. Grller, and M. Hadwiger. Vislang: Asystem for interpreted domain-specific languages for scientific visual-ization. IEEE Transactions on Visualization and Computer Graphics,20(12):2388–2396, Dec 2014.
[34] R. Rew and G. Davis. Netcdf: an interface for scientific data access.IEEE Computer Graphics and Applications, 10(4):76–82, July 1990.
[35] E. Santos, J. Poco, Y. Wei, S. Liu, B. Cook, D. N. Williams, and C. T.Silva. UV-CDAT: Analyzing climate datasets from a user’s perspective.Computing in Science and Engineering, 15(1):94–103, Jan./Feb. 2013.
[36] K. E. Taylor, R. J. Stouffer, and G. A. Meehl. An overview of cmip5and the experiment design. Bulletin of the American MeteorologicalSociety, 93(4):485–498, 2012.
[37] Y. Tian, S. Klasky, W. Yu, B. Wang, H. Abbasi, N. Podhorszki, andR. Grout. Dynam: Dynamic multiresolution data representation forlarge-scale scientific analysis. In Networking, Architecture and Storage(NAS), 2013 IEEE Eighth International Conference on, pages 115–124,July 2013.
[38] United States Environmental Protection Agency. Report to congresson black carbon. In Government Printing Office, EPA-450/R-12-001,Mar 2012.
[39] S. Van Der Walt, S. C. Colbert, and G. Varoquaux. The numpy array: astructure for efficient numerical computation. Computing in Science &Engineering, 13(2):22–30, 2011.
[40] A. B. P. Welford and B. P. Welford. Note on a method for calculatingcorrected sums of squares and products. Technometrics, pages 419–420,1962.
[41] K. Wu. Fastbit: an efficient indexing technology for acceleratingdata-intensive science. 16(1):556, 2005.
[42] C. S. Yoo, R. Sankaran, and J. H. Chen. Three-dimensional directnumerical simulation of a turbulent lifted hydrogen jet flame in heatedcoflow: flame stabilization and structure. Journal of Fluid Mechanics,pages 453–481, 2009.
10