Embed Size (px)
DESCRIPTION
In this work, we have proposed a cost effective DAQ (Data Acquisition) system design useful for localindustries by using user friendly LABVIEW (Laboratory Virtual Instrumentation Electronic Workbench).The proposed system can measure and control different industrial parameters which can be presented ingraphical icon format. The system design is proposed for 8-channels, whereas tested and recorded fortwo parameters i.e. temperature and RH (Relative Humidity). Both parameters are set as per upper andlower limits and controlled using relays. Embedded system is developed using standard microcontrollerto acquire and process the analog data and plug-in for further processing using serial interface with PCusing LABVIEW. The designed system is capable of monitoring and recording the corresponding linkagebetween temperature and humidity in industrial unit's and indicates the abnormalities within the processand control those abnormalities through relays.
Citation preview

Embedded DAQ System Design for Temperature and HumidityMeasurement
TARIQUE RAFIQUE MEMON*, IRFAN AHMED HALEPOTO**, AND TAYAB DIN MEMON**
RECEIVED ON 05.10.2012 ACCEPTED ON 20.03.2013
ABSTRACT
In this work, we have proposed a cost effective DAQ (Data Acquisition) system design useful for local
industries by using user friendly LABVIEW (Laboratory Virtual Instrumentation Electronic Workbench).
The proposed system can measure and control different industrial parameters which can be presented in
graphical icon format. The system design is proposed for 8-channels, whereas tested and recorded for
two parameters i.e. temperature and RH (Relative Humidity). Both parameters are set as per upper and
lower limits and controlled using relays. Embedded system is developed using standard microcontroller
to acquire and process the analog data and plug-in for further processing using serial interface with PC
using LABVIEW. The designed system is capable of monitoring and recording the corresponding linkage
between temperature and humidity in industrial unit's and indicates the abnormalities within the process
and control those abnormalities through relays.
Key Words: DAQ, LABVIEW, Industrial Automation, Embedded Design.
* Lecturer, Department of Electronic Engineering, Quaid-e-Awam University of Engineering, Science & Technology, Nawabshah.** Assistant Professor, Department of Electronic Engineering, Mehran University of Engineering & Technology, Jamshor.
1. INTRODUCTION
conveyor belts etc. [2]. Important aspect of DAQ
instruments includes data analysis flexibility, real time data
display, current and future trend indications etc. With the
help of easily available hardware modules and software
codes, required characteristics of DAQ instrument can be
easily achieved [3].
In this perspective, most of the industries rely on PLC
(Programmable Logic Controller) and DCS (Distributed
Control System) as an efficient DAQ systems for effective
recording and monitoring of the industrial process control
Mehran University Research Journal of Engineering & Technology, Volume 32, No. 2, April, 2013 [ISSN 0254-7821]253
DAQ system instruments are widely used to
collect the information, store or examine some
events. These instruments play very important
role in the industrial field and can be found in small to
large scale in most of the current industries like sugar
mills, oil refineries, cement factories, gas fields,
pharmaceutical companies and many more [1].
The DAQ instruments are used to measure, record and
control diverse parameters like: pressure, temperature,
velocity, and flow by using actuators, solenoid valves,

Embedded DAQ System Design for Temperature and Humidity Measurement
Mehran University Research Journal of Engineering & Technology, Volume 32, No. 2, April, 2013 [ISSN 0254-7821]254
[4]. These DAQ systems would become simpler to use,
accurate, and flexible with the use of electronic tools.
These electronic tools can be counted from simple
recorders to complicated personal computers. Currently
in industries, where sensors are used to measure
temperature, flow, pressure and other parameters, DAQ
products plays vital role a system. Nowadays, data
acquisition system in industries has been replaced by
computer control that is a process of sampling the signals
which measure physical conditions that are analog in
nature and converting them into a form of digital numerical
values that can be manipulated by computer. These
systems require hardware tools and software design to
manage and collect multiple parameters either in analog or
digital form. The Nationals Instruments are the giant
producers of DAQ devices that facilitate from small to
large scale industries [5-6]. The general block diagram of
data acquisition system which contains the set of sensors,
signal conditioning, hardware circuitry, recording
mechanism and output display is shown in Fig 1. Every
set of block is linked another set to perform specific tasks.
DAQ cards have analog and digital inputs in a form of
either voltage or current signals 4-20mA as the standard
input of the card.
The hardware card of data acquisition system has
flexibility of being installed to the personal computer
either through USB, serial, parallel port or PCI port. In
case of any additional sensor to be connected, the signal
conditioning circuit is incorporated to convert signal into
voltage or in current. Signal conditioning circuit is
normally connected with sensor for the case when the
sensor output is not compatible with DAQ card. The
signal conditioning circuit offers diverse functions like
linearization, attenuation, amplification, filtration,
isolation, and excitation [1]. Upper limits and lower limits
ranges can be set for input parameters and output signal
in order to have notification of any abnormality. For the
purpose of monitoring of input parameters and output of
the generated signal, special types of software can be
used.
In Cai, et. al. [7] have designed a DAQ system with a
single digital temperature sensor having maximum range
of 125oC. In the proposed system, we are having all analog
inputs that can measure many other parameters for example
pressure, velocity, flow etc.
The remainder of this paper proceeds as follows. In Section
2, proposed hardware design is discussed, followed by
proposed hardware implementation in Section 3. In Section
4, simulation results and observation are discussed that
are followed by conclusion in Section 5.
2. PROPOSED HARDWARE DESIGN
The proposed system design was carried out in two steps
namely hardware and software. In the following section,
both design and implementation aspects are discussed in
detail.
2.1 Proposed Hardware Design andImplementation
Proposed hardware design is shown in Fig. 2. This design
is based on 89S52 microcontroller, which belongs to theFIG. 1. GENERAL BLOCK DIAGRAM OF DAQ

Mehran University Research Journal of Engineering & Technology, Volume 32, No. 2, April, 2013 [ISSN 0254-7821]255
Embedded DAQ System Design for Temperature and Humidity Measurement
family of 8051 series of microcontrollers. 89S52
microcontroller contains all the basic accessories of
personal computer, like I/Os, RAM, ROM, CPU, UART,
widely known as a "system on chip" controller.
Conversion block shown in the model is responsible to
convert the analog signal into digital form. The digital
signal is then processed by microcontroller. In our
proposed model, analog to digital converter channel
have the flexibility of 8 analog inputs to monitor 8 diverse
parameters. For the measurement and monitoring of
temperature and RH, two parameters are used in the
implementation phase, while rest are being as optional.
ADC (Analog to Ditital Converter) and Microcontroller
are linked to collect the data and control the devices. In
order to have adjustable control on device turn ON and
turn OFF mechanism, relays have been incorporated.
The upper and lower limit of Temperature and Humidity
can be set and adjusted as per set point. Two wire serial
ports is used for interfacing, however USB can also be
used.
It is noticeable that (Fig. 2) with only 3 serial port
wires, the interface between computer and hardware
is made and 8 bit parallel output data have been
proposed. Serial communication packets were formed
to transmit and receive the data through
microcontroller. Serial packets are converted into
specially generated codes through computer program
codes. Finally any device can be turned on/off
according to the specified codes.
Corresponding flow chart of the proposed hardware
design is given in Fig. 3. The hardware contains 8
FIG. 2. HARDWARE BLOCK DIAGRAM

Embedded DAQ System Design for Temperature and Humidity Measurement
Mehran University Research Journal of Engineering & Technology, Volume 32, No. 2, April, 2013 [ISSN 0254-7821]256
channels ADC along with a microcontroller that is
capable to measure 8 different parameters.
Microcontroller performs channel selection step by step
in sequence of one through eight. At the start of the
system, microcontroller will send the control signal for
selection of channel (may be any from 1-8) so that data
from selected channel (for example 1) sensor will be
received. Once the complete data from corresponding
channel is received the interrupt signal will be generated
by ADC to update microcontroller for further
processing. Binary format of data is converted into 3
digit decimal numbers so that data can be easily taken
to computer in form of ASCII (American Standard Code
for Information Interchange) codes. However, this data
is saved temporary in RAM of microcontroller till other
channels detect the data from ADC. We have considered
three digits so that data goes from 000-999 (three digit)
however, these digits can be increased to 4 or more or
even decreased.
Similarly, another channel can be selected by
microcontroller and the data will be converted into 3 digit
format and stored into memory. Finally all the digits are
sent to LABVIEW software where these 6 digit data will
be divided into two sections of 3 digits for separate
channels.
Save the Data Into Memoryof Micro Controller
Convert th DATAInto Three Numeric
Con?gure ADC forChannel Selection
Prepare controller for dataμTransmission/Reception
(TX/RX)Collect and Convert
Into 3 Digits
Save the Data IntoMemory of
Micro Controller
*Character Received No
Yes
Send 6 Digits toSerial Port
Start
Get Data from ADC
Collect the DATA
Select Another AChennel
FIG. 3. FLOW CHART OF THE PROPOSED HARDWARE MODEL

Mehran University Research Journal of Engineering & Technology, Volume 32, No. 2, April, 2013 [ISSN 0254-7821]257
Embedded DAQ System Design for Temperature and Humidity Measurement
The comparison of standard DAQ and proposed
system is given in the Table 1. It can be seen that the
proposed system offers more than one channels, and
have upper and lower limits instead of only one as in
contemporary DAQ systems. Other important aspects
of proposed design are its simple interfaces, and cost-
effective nature that is about 5 times lesser than
contemporary designs.
3. PROPOSED HARDWAREIMPLEMENTATION
Many interfacing software tools are available to build a
communication link between hardware and software
starting from the most common one hyper terminal to
MATLAB and LABView. In this work, we have adopted
LABVIEW due to its simplicity, robust and user friendly
nature.
LABVIEW software is flexible in nature and it has built
in controls that can be customized as per application
requirement to develop front and back panel GUI.
Icons, symbols, knobs, buttons are used to design
front panel whereas programming tools can be used
to develop the back panel in LABVIEW. Various
interface standards like; RS-232, RS-485 and GPIB
(General Purpose Interface Bus) can be connected by
using wires [6].
The proposed system was designed and developed in the
LABVIEW as shown in Fig 4. In this design, various
controls have been incorporated including: visa configure
visa write, visa read, visa close, data splitter, string
converter, comparator, and selector.
4. DESIGN SIMULATION ANDRESULTS
Wet and dry bulbs are the methods to measure the humidity
appropriately by employing two temperature sensors [8].
Humidity measurement formula is already built-in function
in Formula block module of LABVIEW through which dry
and wet bulb reading can be acquired [9]. Relative humidity
table was needed for the purpose of humidity calculation
of wet and dry bulb method. standard psychometric chart
for measuring Humidity using dry and wet bulb method
was adopted [10]. Following is given the detailed
observations made so far.
TABLE 1. EXISTING DAQ STANDARDS VERSUS PROPOSED MODEL
No. Features PLC Specific Controller Proposed Design
1. User Friendly Yes Yes Yes
2. Large number of I/Os Yes No Yes
3. PID Yes No No
4. ON/OFF Controller Yes Yes Yes
5. Set Point Upper Lower Both Only One Upper Lower Both
6. Universal Inputs Yes Available in YesSome Versions
7. Total Inputs Application Specific 1 2
8. Upgrading Features Requires DAQ Cards No Upgrading Up to 8 Analog without Changing Hardware
9. Computer Interface Yes, Special No Any Interfacing Software can be Used, can be BuiltSoftware with Visual Basic, C Language and even with MATLAB
10. Cost More than 500$ $50 Component Cost Approximately $10

Embedded DAQ System Design for Temperature and Humidity Measurement
Mehran University Research Journal of Engineering & Technology, Volume 32, No. 2, April, 2013 [ISSN 0254-7821]258
4.1 Experimental Results Analysis
Using dry and wet bulb temperature in the ranges of
temperature (18-29oC) and relative humidities (55-78%),
we have obtained observations for the proposed method
using formula block in LABView. Using relative error
formula (Equation (1)) we have calculated error percentage
between the proposed method and the Psychometric
chart.
100(RE)Error Relative ×−
==nY
nXnY
(1)
where Yn is expected value and Xn is measured value.
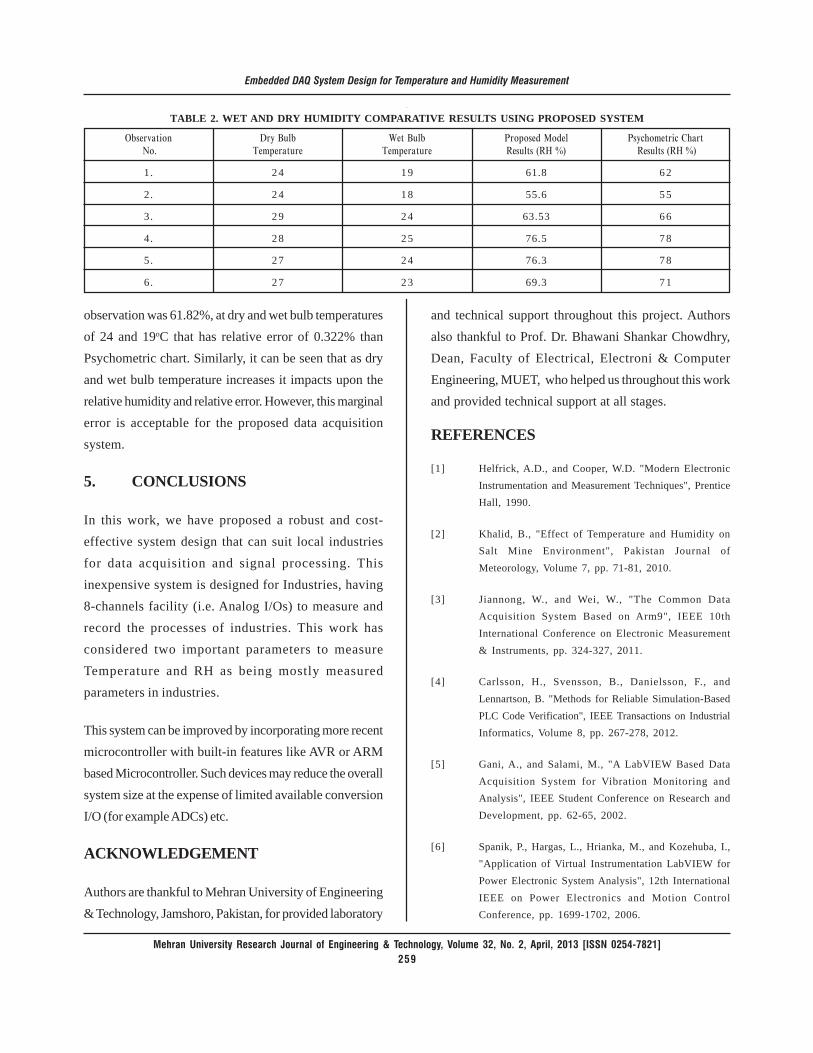
A series of results were obtained in LABVIEW by varyingthe temperature level of dry and wet bulb as shown inTable 2. The relative humidity obtained for second
FIG. 4. LABVIEW PROGRAMMING BLOCK
Mehran University Research Journal of Engineering & Technology, Volume 32, No. 2, April, 2013 [ISSN 0254-7821]259
Embedded DAQ System Design for Temperature and Humidity Measurement
observation was 61.82%, at dry and wet bulb temperaturesof 24 and 19oC that has relative error of 0.322% thanPsychometric chart. Similarly, it can be seen that as dryand wet bulb temperature increases it impacts upon therelative humidity and relative error. However, this marginalerror is acceptable for the proposed data acquisitionsystem.
5. CONCLUSIONS
In this work, we have proposed a robust and cost-effective system design that can suit local industriesfor data acquisition and signal processing. Thisinexpensive system is designed for Industries, having8-channels facility (i.e. Analog I/Os) to measure andrecord the processes of industries. This work hasconsidered two important parameters to measureTemperature and RH as being mostly measuredparameters in industries.
This system can be improved by incorporating more recentmicrocontroller with built-in features like AVR or ARMbased Microcontroller. Such devices may reduce the overallsystem size at the expense of limited available conversionI/O (for example ADCs) etc.
ACKNOWLEDGEMENT
Authors are thankful to Mehran University of Engineering& Technology, Jamshoro, Pakistan, for provided laboratory
TABLE 2. WET AND DRY HUMIDITY COMPARATIVE RESULTS USING PROPOSED SYSTEM
Observation Dry Bulb Wet Bulb Proposed Model Psychometric Chart No. Temperature Temperature Results (RH %) Results (RH %)
1. 24 19 61.8 62
2. 24 18 55.6 55
3. 29 24 63.53 66
4. 28 25 76.5 78
5. 27 24 76.3 78
6. 27 23 69.3 71
and technical support throughout this project. Authorsalso thankful to Prof. Dr. Bhawani Shankar Chowdhry,Dean, Faculty of Electrical, Electroni & ComputerEngineering, MUET, who helped us throughout this workand provided technical support at all stages.
REFERENCES
[1] Helfrick, A.D., and Cooper, W.D. "Modern ElectronicInstrumentation and Measurement Techniques", PrenticeHall, 1990.
[2] Khalid, B., "Effect of Temperature and Humidity onSalt Mine Environment", Pakistan Journal ofMeteorology, Volume 7, pp. 71-81, 2010.
[3] Jiannong, W., and Wei, W., "The Common DataAcquisition System Based on Arm9", IEEE 10thInternational Conference on Electronic Measurement& Instruments, pp. 324-327, 2011.
[4] Carlsson, H., Svensson, B., Danielsson, F., andLennartson, B. "Methods for Reliable Simulation-BasedPLC Code Verification", IEEE Transactions on IndustrialInformatics, Volume 8, pp. 267-278, 2012.
[5] Gani, A., and Salami, M., "A LabVIEW Based DataAcquisition System for Vibration Monitoring andAnalysis", IEEE Student Conference on Research andDevelopment, pp. 62-65, 2002.
[6] Spanik, P., Hargas, L., Hrianka, M., and Kozehuba, I.,"Application of Virtual Instrumentation LabVIEW forPower Electronic System Analysis", 12th InternationalIEEE on Power Electronics and Motion ControlConference, pp. 1699-1702, 2006.

Embedded DAQ System Design for Temperature and Humidity Measurement
Mehran University Research Journal of Engineering & Technology, Volume 32, No. 2, April, 2013 [ISSN 0254-7821]260
[7] Cai, C., and Zhang, W., "The Design on the Multi-
Temperature Testing System Based on the Laview",
Future BioMedical Information Engineering, IEEE
International Seminar, pp. 421-424, 2008.
[8] Monteith, J., and Owen, P., "A Thermocouple Method
for Measuring Relative Humidity in the Range 95-100%",
Journal of Scientific Instruments, Volume 35, pp. 443,
2002.
[9] Zhang, W., and Yang, S., "Humidity Measurement in
Harsh Industrial Environments", International
Conference on Networking, Sensing and Control,
pp. 649-652, 2010.
[10] Kumar, M., and Kar, I., "Non-Linear HVAC
Computations Using Least Square Support Vector
Machines", Energy Conversion and Management,
Volume 50, pp. 1411-1418, 2009.