Embed Size (px)
Citation preview

Embargoed until 11:00 a.m.
Wednesday, March 17, 2004
School Report Card Data2002–2003
Students Taking and Passing Regents
Examinations Each Year, 1996–2003
3
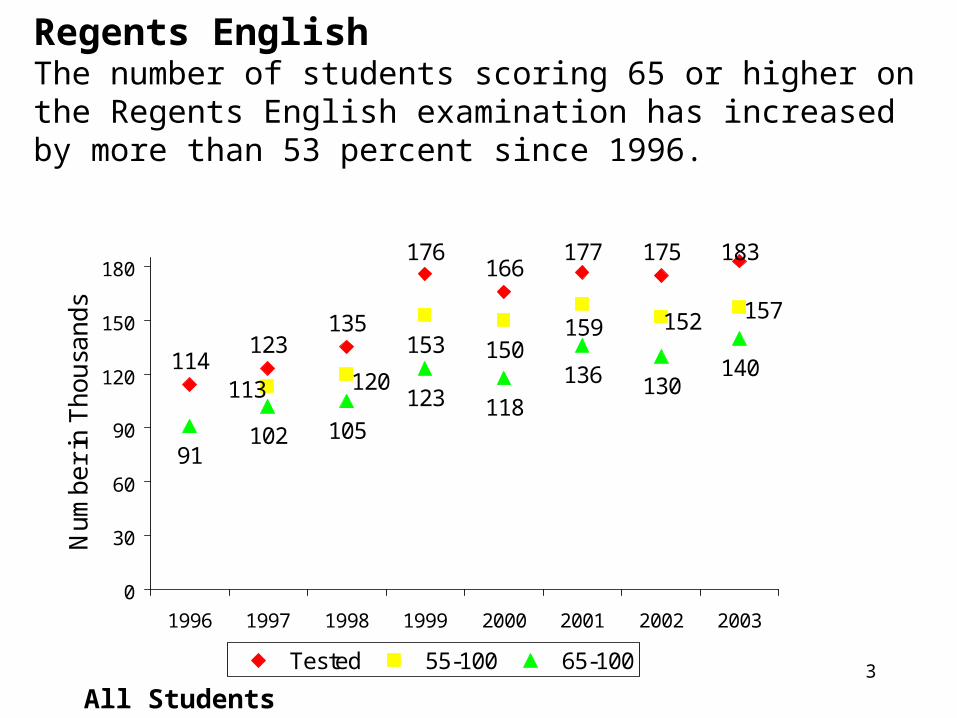
Regents EnglishThe number of students scoring 65 or higher on the Regents English examination has increased by more than 53 percent since 1996.
114123
135
176166
177 175 183
153 150
91102 105
123 118
136 130140
157
120113
159 152
0
30
60
90
120
150
180
1996 1997 1998 1999 2000 2001 2002 2003
Nu
mb
er
in T
ho
usa
nd
s
Tested 55-100 65-100
All Students
4
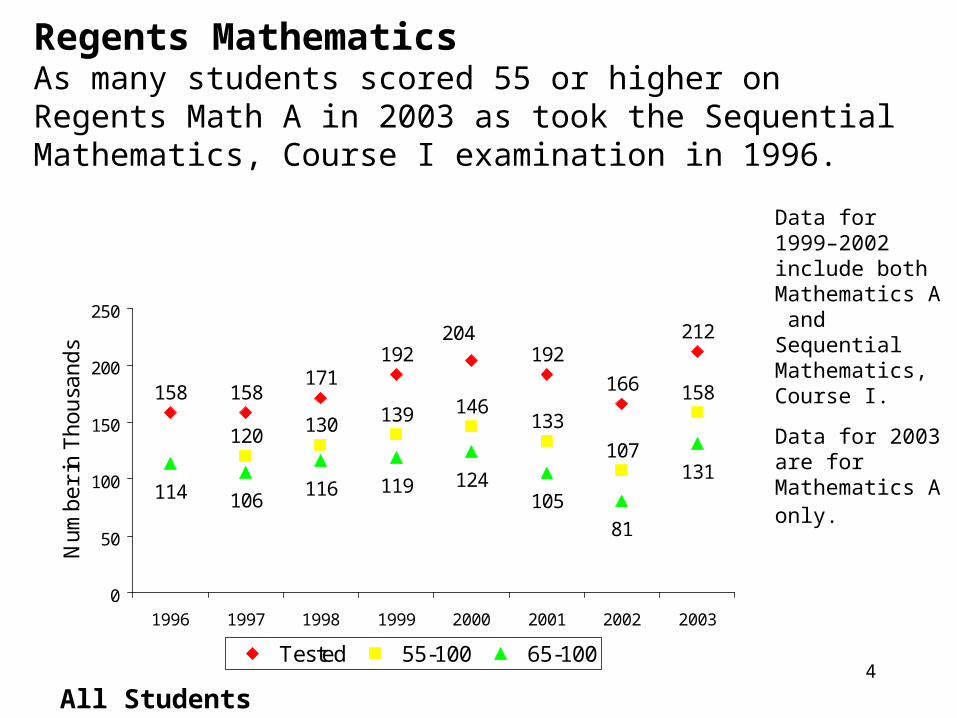
Regents MathematicsAs many students scored 55 or higher on Regents Math A in 2003 as took the Sequential Mathematics, Course I examination in 1996.
158 158171
192 192
166
212
120 130 139 146133
107
158
114 106116 119 124
105
81
131
204
0
50
100
150
200
250
1996 1997 1998 1999 2000 2001 2002 2003
Nu
mb
er
in T
ho
usa
nd
s
Tested 55-100 65-100
Data for 1999–2002 include both Mathematics A and Sequential Mathematics, Course I.
Data for 2003 are for Mathematics A only.
All Students
5
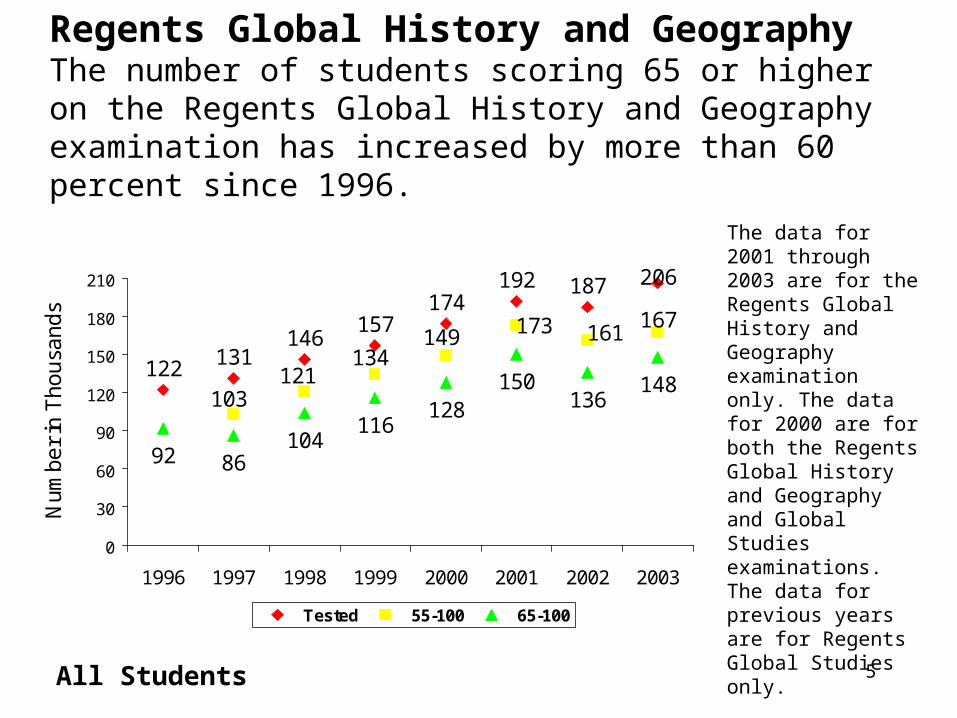
Regents Global History and GeographyThe number of students scoring 65 or higher on the Regents Global History and Geography examination has increased by more than 60 percent since 1996.
122 131146
157174
187 206
92 86104
116
150136
148
192
167161149
134121
103
173
128
0
30
60
90
120
150
180
210
1996 1997 1998 1999 2000 2001 2002 2003
Nu
mb
er
in T
ho
usa
nd
s
Tested 55-100 65-100
The data for 2001 through 2003 are for the Regents Global History and Geography examination only. The data for 2000 are for both the Regents Global History and Geography and Global Studies examinations. The data for previous years are for Regents Global Studies only.
All Students
6
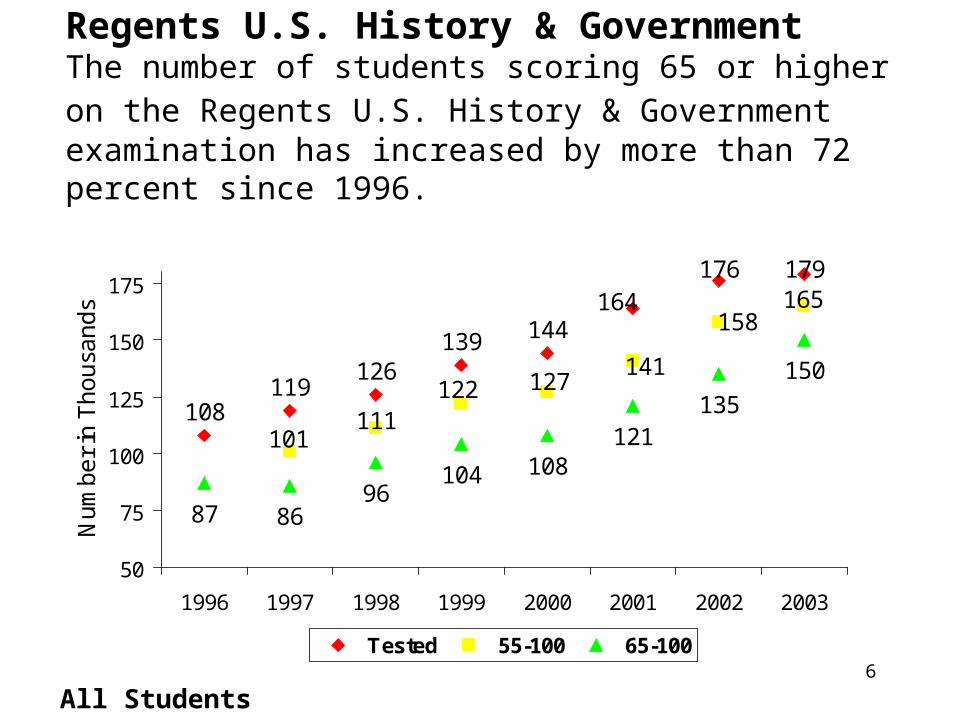
Regents U.S. History & Government The number of students scoring 65 or higher on the Regents U.S. History & Government examination has increased by more than 72 percent since 1996.
108119
126139 144
176 179
87 8696
104 108121
135
150
164 165158
141
101111
127122
50
75
100
125
150
175
1996 1997 1998 1999 2000 2001 2002 2003
Nu
mb
er
in T
ho
usa
nd
s
Tested 55-100 65-100
All Students
7
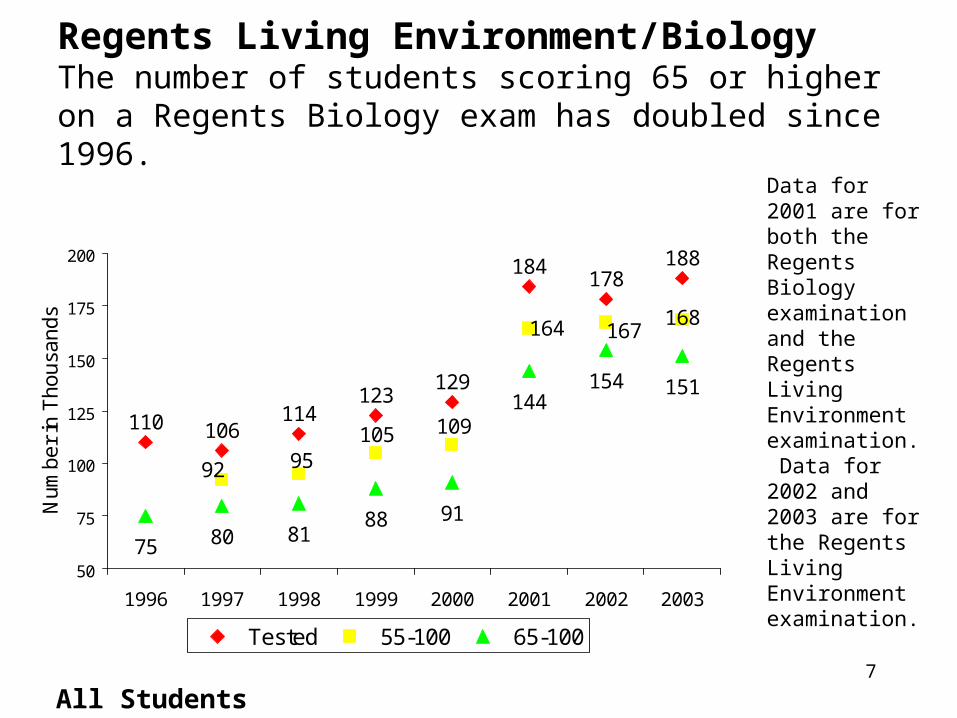
Regents Living Environment/BiologyThe number of students scoring 65 or higher on a Regents Biology exam has doubled since 1996.
110 106114
123129
184178
188
75 80 8188 91
144154 151
168167164
92 95105 109
50
75
100
125
150
175
200
1996 1997 1998 1999 2000 2001 2002 2003
Nu
mb
er
in T
ho
usa
nd
s
Tested 55-100 65-100
Data for 2001 are for both the Regents Biology examination and the Regents Living Environment examination. Data for 2002 and 2003 are for the Regents Living Environment examination.
All Students

8
Performance of the 1999Cohort by Need/Resource
Capacity Category
9
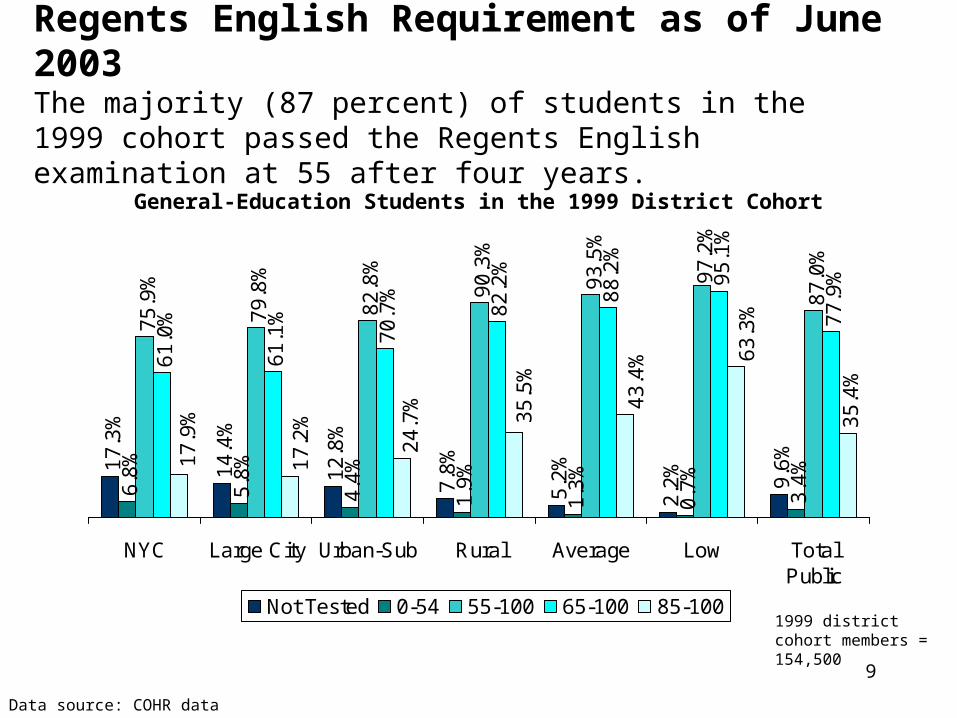
Regents English Requirement as of June 2003The majority (87 percent) of students in the 1999 cohort passed the Regents English examination at 55 after four years.
17
.3%
14
.4%
12
.8%
7.8
%
5.2
%
2.2
%
9.6
%
6.8
%
5.8
%
4.4
%
1.9
%
1.3
%
0.7
%
3.4
%
75
.9%
79
.8%
82
.8%
90
.3%
93
.5%
97
.2%
87
.0%
61
.0%
61
.1%
70
.7%
82
.2%
88
.2%
95
.1%
77
.9%
35
.4%
43
.4%
24
.7%
17
.9%
17
.2% 3
5.5
%
63
.3%
NYC Large City Urban-Sub Rural Average Low TotalPublic
Not Tested 0-54 55-100 65-100 85-100
Data source: COHR data
1999 district cohort members = 154,500
General-Education Students in the 1999 District Cohort
10
16
.8%
13
.3%
10
.6%
6.0
%
3.7
%
1.5
%
8.5
%
12
.9%
15
.9%
9.7
%
4.4
%
3.4
%
1.3
%
7.0
%
70
.4%
70
.8%
79
.7%
89
.6%
92
.9%
97
.3%
84
.5%
54
.5%
50
.4% 6
8.5
%
81
.1%
87
.2%
95
.0%
74
.9%
41
.2%
50
.6%
29
.3%
22
.4%
13
.5%
42
.7%
70
.3%
NYC Large City Urban-Sub Rural Average Low TotalPublic
Not Tested 0-54 55-100 65-100 85-100
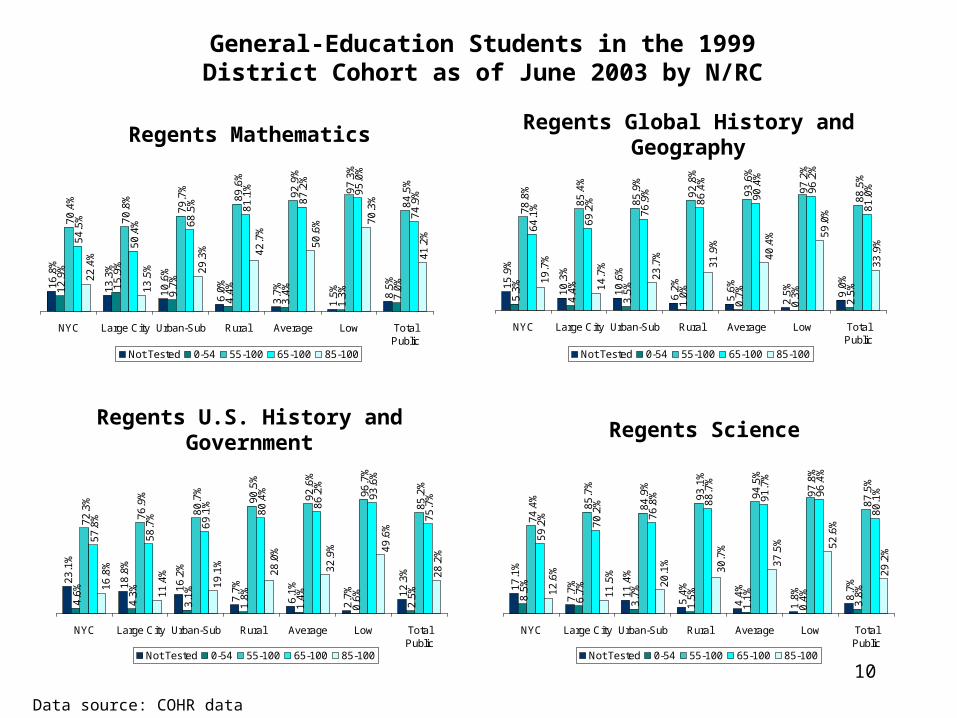
Regents Mathematics
15
.9%
10
.3%
10
.6%
6.2
%
5.6
%
2.5
%
9.0
%
5.3
%
4.4
%
3.5
%
1.0
%
0.7
%
0.3
%
2.5
%
78
.8%
85
.4%
85
.9%
92
.8%
93
.6%
97
.2%
88
.5%
64
.1%
69
.2%
76
.9%
86
.4%
90
.4%
96
.2%
81
.0%
33
.9%
40
.4%
23
.7%
19
.7%
14
.7% 3
1.9
%
59
.0%
NYC Large City Urban-Sub Rural Average Low TotalPublic
Not Tested 0-54 55-100 65-100 85-100
Regents Global History and Geography
23
.1%
18
.8%
16
.2%
7.7
%
6.1
%
2.7
% 12
.3%
4.6
%
4.3
%
3.1
%
1.8
%
1.4
%
0.6
%
2.5
%
72
.3%
76
.9%
80
.7%
90
.5%
92
.6%
96
.7%
85
.2%
57
.8%
58
.7%
69
.1%
80
.4%
86
.2%
93
.6%
75
.7%
28
.2%
32
.9%
19
.1%
16
.8%
11
.4% 2
8.0
% 49
.6%
NYC Large City Urban-Sub Rural Average Low TotalPublic
Not Tested 0-54 55-100 65-100 85-100
Regents U.S. History and Government Regents Science
17
.1%
7.7
%
11
.4%
5.4
%
4.4
%
1.8
%
8.7
%
8.5
%
6.7
%
3.7
%
1.5
%
1.1
%
0.4
%
3.8
%
74
.4%
85
.7%
84
.9%
93
.1%
94
.5%
97
.8%
87
.5%
59
.2%
70
.2%
76
.8%
88
.7%
91
.7%
96
.4%
80
.1%
29
.2%
37
.5%
20
.1%
12
.6%
11
.5% 3
0.7
% 52
.6%
NYC Large City Urban-Sub Rural Average Low TotalPublic
Not Tested 0-54 55-100 65-100 85-100
General-Education Students in the 1999 District Cohort as of June 2003 by N/RC
Data source: COHR data
11
Performance of the 1999 Cohort by Race/Ethnicity
12
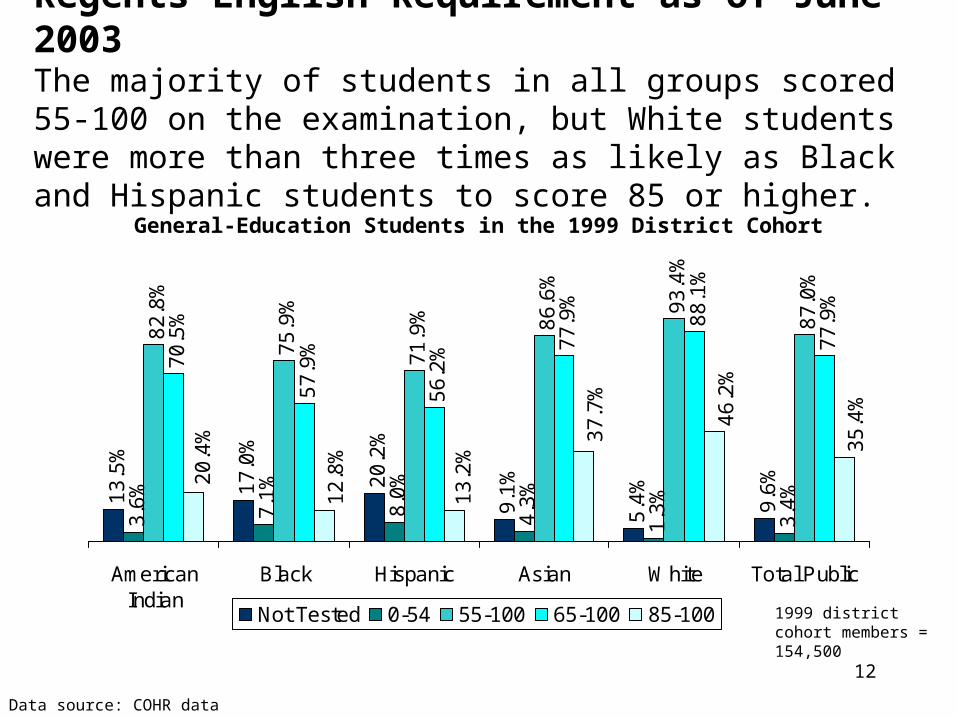
Regents English Requirement as of June 2003The majority of students in all groups scored 55-100 on the examination, but White students were more than three times as likely as Black and Hispanic students to score 85 or higher.
13
.5%
17
.0%
20
.2%
9.1
%
5.4
%
9.6
%
3.6
%
7.1
%
8.0
%
4.3
%
1.3
%
3.4
%
82
.8%
75
.9%
71
.9% 86
.6%
93
.4%
87
.0%
70
.5%
57
.9%
56
.2% 7
7.9
%
88
.1%
77
.9%
46
.2%
13
.2%
20
.4%
12
.8%
37
.7%
35
.4%
AmericanIndian
Black Hispanic Asian White Total Public
Not Tested 0-54 55-100 65-100 85-100
Data source: COHR data
1999 district cohort members = 154,500
General-Education Students in the 1999 District Cohort
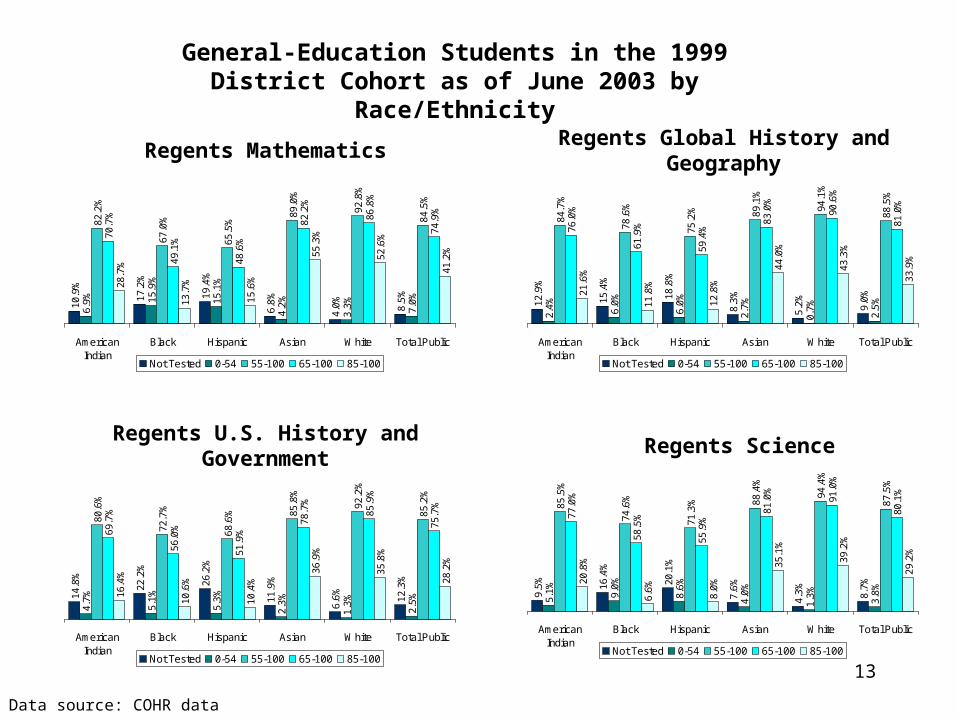
13
General-Education Students in the 1999 District Cohort as of June 2003 by Race/Ethnicity
10.9
%
17.2
%
19.4
%
6.8%
4.0% 8.5%
6.9% 15
.9%
15.1
%
4.2%
3.3% 7.0%
82.2
%
67.0
%
65.5
%
89.0
%
92.8
%
84.5
%
70.7
%
49.1
%
48.6
%
82.2
%
86.8
%
74.9
%
28.7
%
13.7
%
15.6
%
55.3
%
52.6
%
41.2
%
AmericanIndian
Black Hispanic Asian White Total Public
Not Tested 0-54 55-100 65-100 85-100
Regents Mathematics Regents Global History and Geography
Regents U.S. History and Government Regents Science
12.9
%
15.4
%
18.8
%
8.3%
5.2% 9.0%
2.4% 6.0%
6.0%
2.7%
0.7%
2.5%
84.7
%
78.6
%
75.2
% 89.1
%
94.1
%
88.5
%
76.0
%
61.9
%
59.4
%
83.0
%
90.6
%
81.0
%
21.6
%
11.8
%
12.8
%
44.0
%
43.3
%
33.9
%
AmericanIndian
Black Hispanic Asian White Total Public
Not Tested 0-54 55-100 65-100 85-100
14.8
%
22.2
%
26.2
%
11.9
%
6.6% 12
.3%
4.7%
5.1%
5.3%
2.3%
1.3%
2.5%
80.6
%
72.7
%
68.6
% 85.8
%
92.2
%
85.2
%
69.7
%
56.0
%
51.9
%
78.7
%
85.9
%
75.7
%
16.4
%
10.6
%
10.4
%
36.9
%
35.8
%
28.2
%
AmericanIndian
Black Hispanic Asian White Total Public
Not Tested 0-54 55-100 65-100 85-100
9.5% 16
.4%
20.1
%
7.6%
4.3% 8.7%
5.1% 9.0%
8.6%
4.0%
1.3% 3.8%
85.5
%
74.6
%
71.3
% 88.4
%
94.4
%
87.5
%
77.0
%
58.5
%
55.9
%
81.0
%
91.0
%
80.1
%
20.8
%
6.6%
8.0%
35.1
%
39.2
%
29.2
%
AmericanIndian
Black Hispanic Asian White Total Public
Not Tested 0-54 55-100 65-100 85-100
Data source: COHR data

14
Performance of Seniors in the 1999 Cohort
15
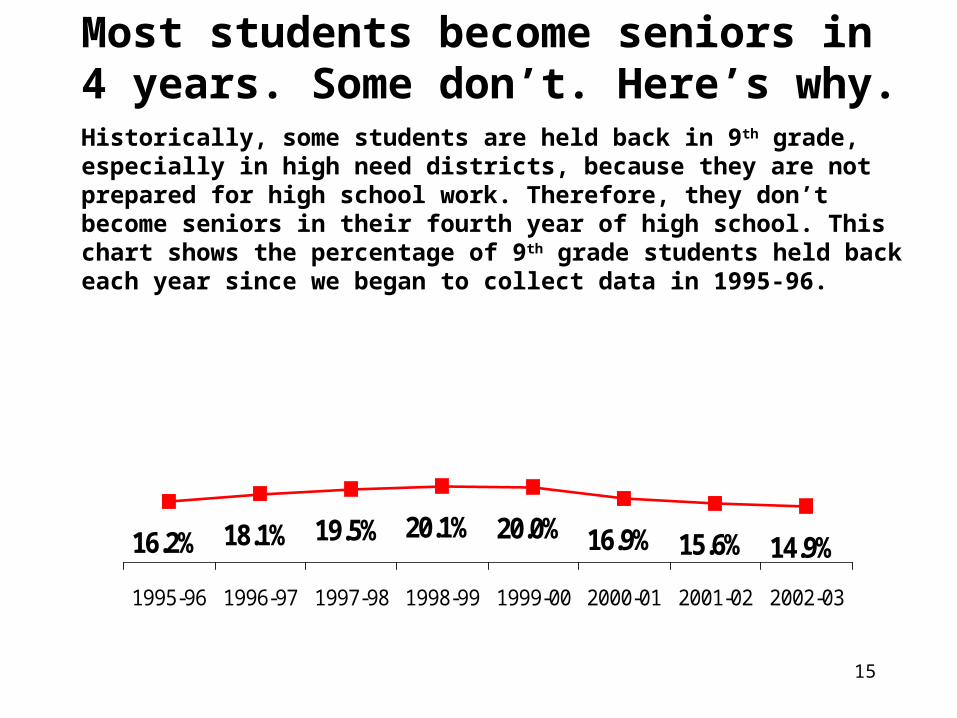
16.2% 18.1% 19.5% 20.1% 20.0% 16.9% 15.6% 14.9%
1995-96 1996-97 1997-98 1998-99 1999-00 2000-01 2001-02 2002-03
Most students become seniors in 4 years. Some don’t. Here’s why.Historically, some students are held back in 9th grade, especially in high need districts, because they are not prepared for high school work. Therefore, they don’t become seniors in their fourth year of high school. This chart shows the percentage of 9th grade students held back each year since we began to collect data in 1995-96.
16
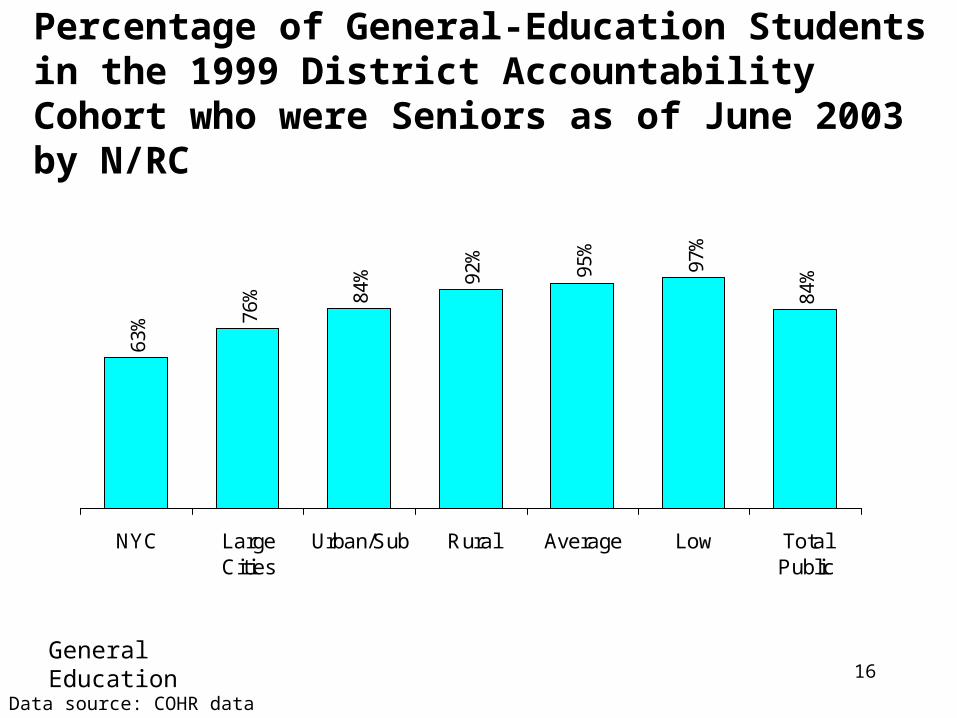
Percentage of General-Education Students in the 1999 District Accountability Cohort who were Seniors as of June 2003 by N/RC
63% 76
% 84% 92
%
95%
97%
84%
NYC LargeCities
Urban/Sub Rural Average Low TotalPublic
Data source: COHR data
General Education
17
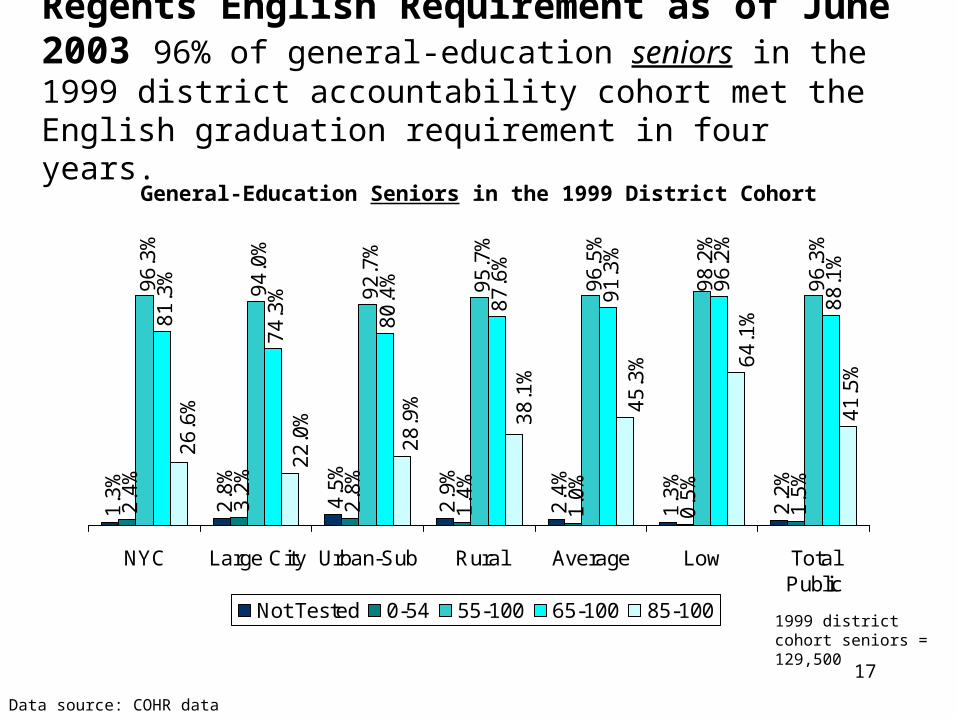
Regents English Requirement as of June 2003 96% of general-education seniors in the 1999 district accountability cohort met the English graduation requirement in four years.
1.3
%
2.8
%
4.5
%
2.9
%
2.4
%
1.3
%
2.2
%
2.4
%
3.2
%
2.8
%
1.4
%
1.0
%
0.5
%
1.5
%
96
.3%
94
.0%
92
.7%
95
.7%
96
.5%
98
.2%
96
.3%
81
.3%
74
.3%
80
.4%
87
.6%
91
.3%
96
.2%
88
.1%
41
.5%
45
.3%
28
.9%
26
.6%
22
.0% 3
8.1
%
64
.1%
NYC Large City Urban-Sub Rural Average Low TotalPublic
Not Tested 0-54 55-100 65-100 85-100
Data source: COHR data
1999 district cohort seniors = 129,500
General-Education Seniors in the 1999 District Cohort
18
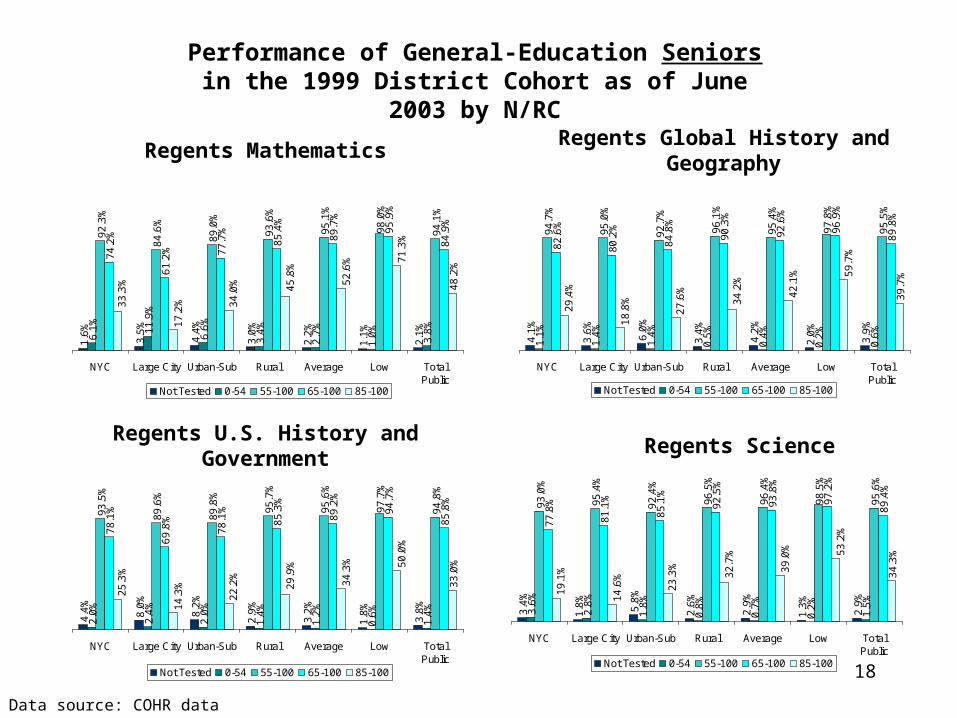
Performance of General-Education Seniors in the 1999 District Cohort as of June 2003 by N/RC
Regents Mathematics Regents Global History and Geography
Regents U.S. History and Government Regents Science
1.6
%
3.5
%
4.4
%
3.0
%
2.2
%
1.1
%
2.1
%
6.1
%
11
.9%
6.6
%
3.4
%
2.7
%
1.0
%
3.8
%
92
.3%
84
.6%
89
.0%
93
.6%
95
.1%
98
.0%
94
.1%
74
.2%
61
.2% 77
.7%
85
.4%
89
.7%
95
.9%
84
.9%
48
.2%
52
.6%
34
.0%
33
.3%
17
.2%
45
.8%
71
.3%
NYC Large City Urban-Sub Rural Average Low TotalPublic
Not Tested 0-54 55-100 65-100 85-100
4.1
%
3.6
%
6.0
%
3.4
%
4.2
%
2.0
%
3.9
%
1.1
%
1.4
%
1.4
%
0.5
%
0.4
%
0.2
%
0.6
%
94
.7%
95
.0%
92
.7%
96
.1%
95
.4%
97
.8%
95
.5%
82
.6%
80
.2%
84
.8%
90
.3%
92
.6%
96
.9%
89
.8%
39
.7%
42
.1%
27
.6%
29
.4%
18
.8% 34
.2%
59
.7%
NYC Large City Urban-Sub Rural Average Low TotalPublic
Not Tested 0-54 55-100 65-100 85-100
4.4
%
8.0
%
8.2
%
2.9
%
3.2
%
1.8
%
3.8
%
2.0
%
2.4
%
2.0
%
1.4
%
1.2
%
0.6
%
1.4
%
93
.5%
89
.6%
89
.8%
95
.7%
95
.6%
97
.7%
94
.8%
78
.1%
69
.8%
78
.1%
85
.3%
89
.2%
94
.7%
85
.8%
33
.0%
34
.3%
22
.2%
25
.3%
14
.3% 29
.9% 5
0.0
%
NYC Large City Urban-Sub Rural Average Low TotalPublic
Not Tested 0-54 55-100 65-100 85-100
3.4
%
1.8
%
5.8
%
2.6
%
2.9
%
1.3
%
2.9
%
3.6
%
2.8
%
1.8
%
0.8
%
0.7
%
0.2
%
1.5
%
93
.0%
95
.4%
92
.4%
96
.5%
96
.4%
98
.5%
95
.6%
77
.8%
81
.1%
85
.1%
92
.5%
93
.8%
97
.2%
89
.4%
34
.3%
39
.0%
23
.3%
19
.1%
14
.6% 3
2.7
% 53
.2%
NYC Large City Urban-Sub Rural Average Low TotalPublic
Not Tested 0-54 55-100 65-100 85-100
Data source: COHR data
19
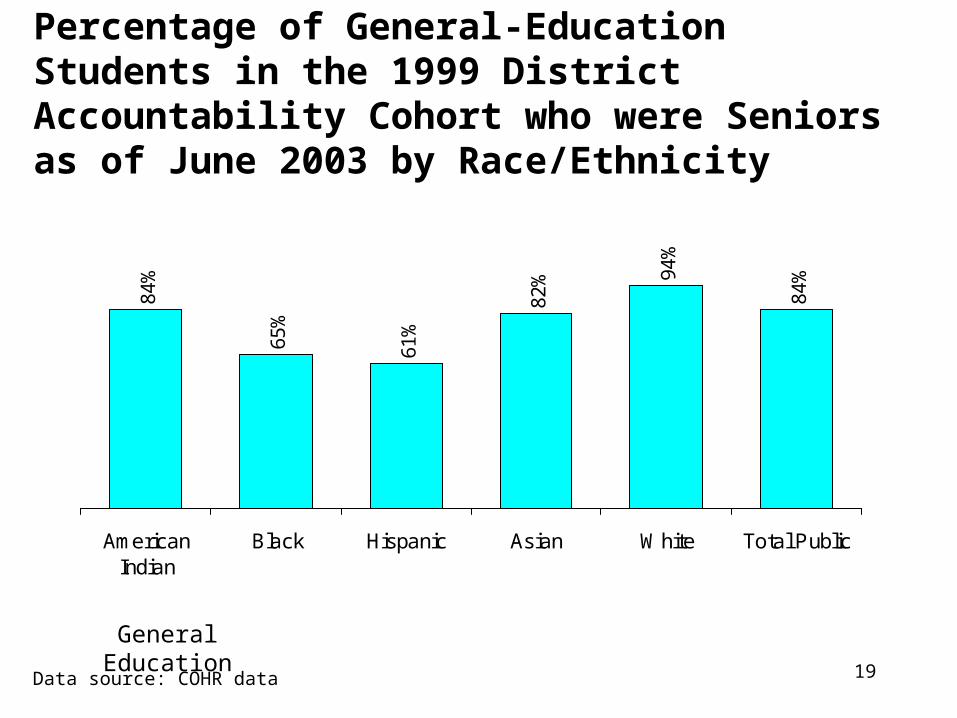
Percentage of General-Education Students in the 1999 District Accountability Cohort who were Seniors as of June 2003 by Race/Ethnicity
84%
65%
61%
82% 94
%
84%
AmericanIndian
Black Hispanic Asian White Total Public
General Education
Data source: COHR data
20
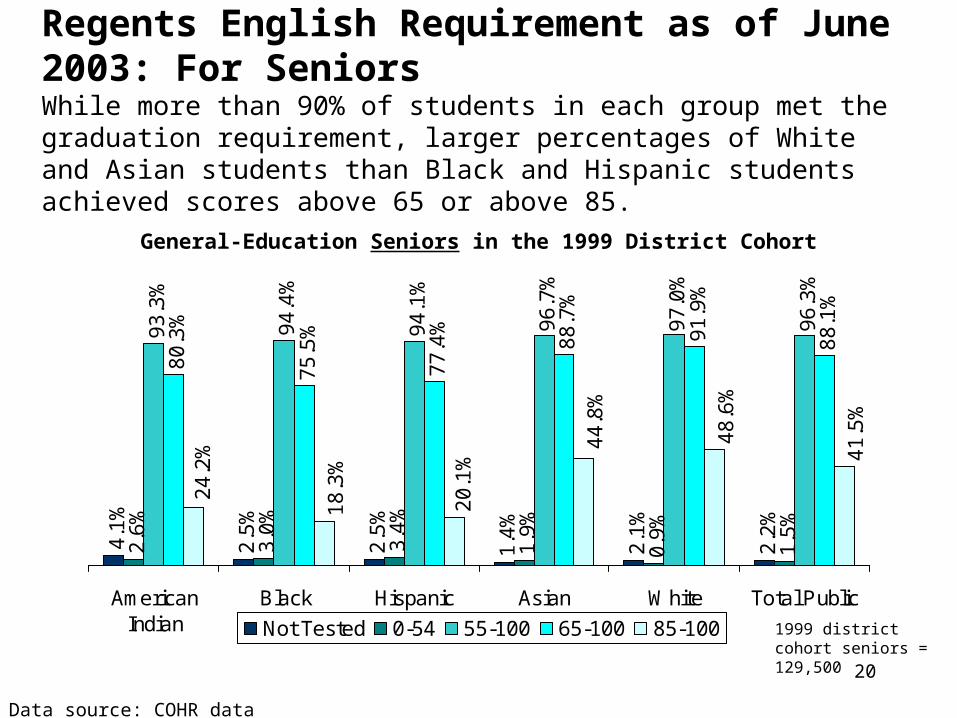
Regents English Requirement as of June 2003: For SeniorsWhile more than 90% of students in each group met the graduation requirement, larger percentages of White and Asian students than Black and Hispanic students achieved scores above 65 or above 85.
4.1
%
2.5
%
2.5
%
1.4
%
2.1
%
2.2
%
2.6
%
3.0
%
3.4
%
1.9
%
0.9
%
1.5
%
93
.3%
94
.4%
94
.1%
96
.7%
97
.0%
96
.3%
80
.3%
75
.5%
77
.4%
88
.7%
91
.9%
88
.1%
48
.6%
20
.1%
24
.2%
18
.3%
44
.8%
41
.5%
AmericanIndian
Black Hispanic Asian White Total Public
Not Tested 0-54 55-100 65-100 85-100
Data source: COHR data
1999 district cohort seniors = 129,500
General-Education Seniors in the 1999 District Cohort
21
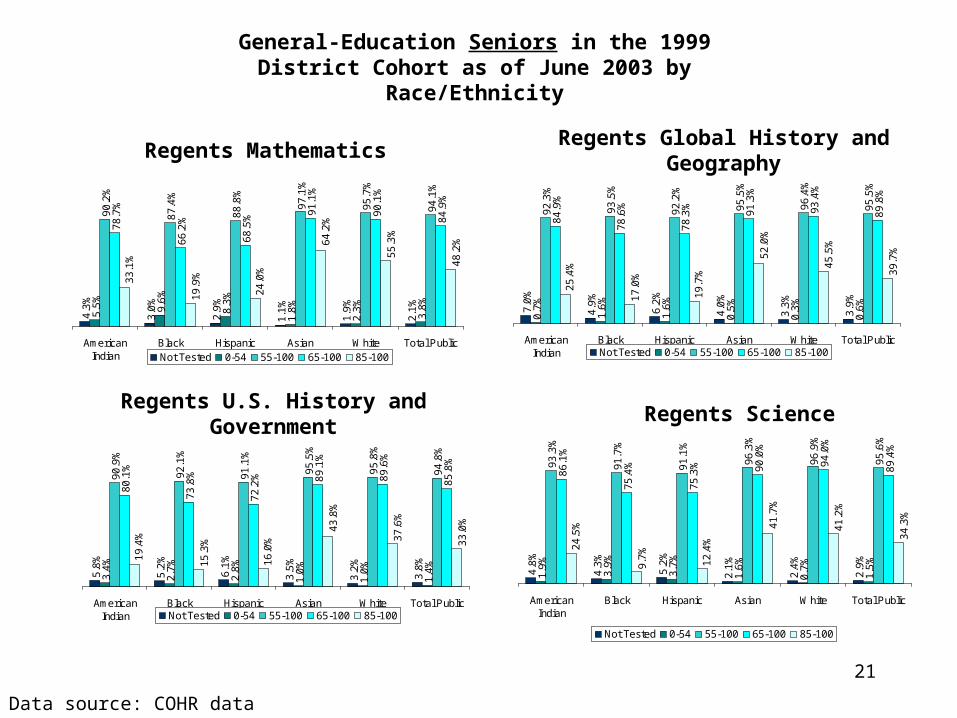
General-Education Seniors in the 1999 District Cohort as of June 2003 by Race/Ethnicity
Data source: COHR data
Regents Mathematics Regents Global History and Geography
Regents U.S. History and Government Regents Science
4.3
%
3.0
%
2.9
%
1.1
%
1.9
%
2.1
%
5.5
%
9.6
%
8.3
%
1.8
%
2.3
%
3.8
%
90
.2%
87
.4%
88
.8%
97
.1%
95
.7%
94
.1%
78
.7%
66
.2%
68
.5%
91
.1%
90
.1%
84
.9%
55
.3%
24
.0%
33
.1%
19
.9%
64
.2%
48
.2%
AmericanIndian
Black Hispanic Asian White Total Public
Not Tested 0-54 55-100 65-100 85-100
7.0
%
4.9
%
6.2
%
4.0
%
3.3
%
3.9
%
0.7
%
1.6
%
1.6
%
0.5
%
0.3
%
0.6
%
92
.3%
93
.5%
92
.2%
95
.5%
96
.4%
95
.5%
84
.9%
78
.6%
78
.3%
91
.3%
93
.4%
89
.8%
45
.5%
19
.7%
25
.4%
17
.0%
52
.0%
39
.7%
AmericanIndian
Black Hispanic Asian White Total PublicNot Tested 0-54 55-100 65-100 85-100
5.8
%
5.2
%
6.1
%
3.5
%
3.2
%
3.8
%
3.4
%
2.7
%
2.8
%
1.0
%
1.0
%
1.4
%
90
.9%
92
.1%
91
.1%
95
.5%
95
.8%
94
.8%
80
.1%
73
.8%
72
.2% 89
.1%
89
.6%
85
.8%
37
.6%
16
.0%
19
.4%
15
.3%
43
.8%
33
.0%
AmericanIndian
Black Hispanic Asian White Total PublicNot Tested 0-54 55-100 65-100 85-100
4.8
%
4.3
%
5.2
%
2.1
%
2.4
%
2.9
%
1.9
%
3.9
%
3.7
%
1.6
%
0.7
%
1.5
%
93
.3%
91
.7%
91
.1%
96
.3%
96
.9%
95
.6%
86
.1%
75
.4%
75
.3% 90
.0%
94
.0%
89
.4%
41
.2%
12
.4%24
.5%
9.7
%
41
.7%
34
.3%
AmericanIndian
Black Hispanic Asian White Total Public
Not Tested 0-54 55-100 65-100 85-100
22
Graduation Rate
23
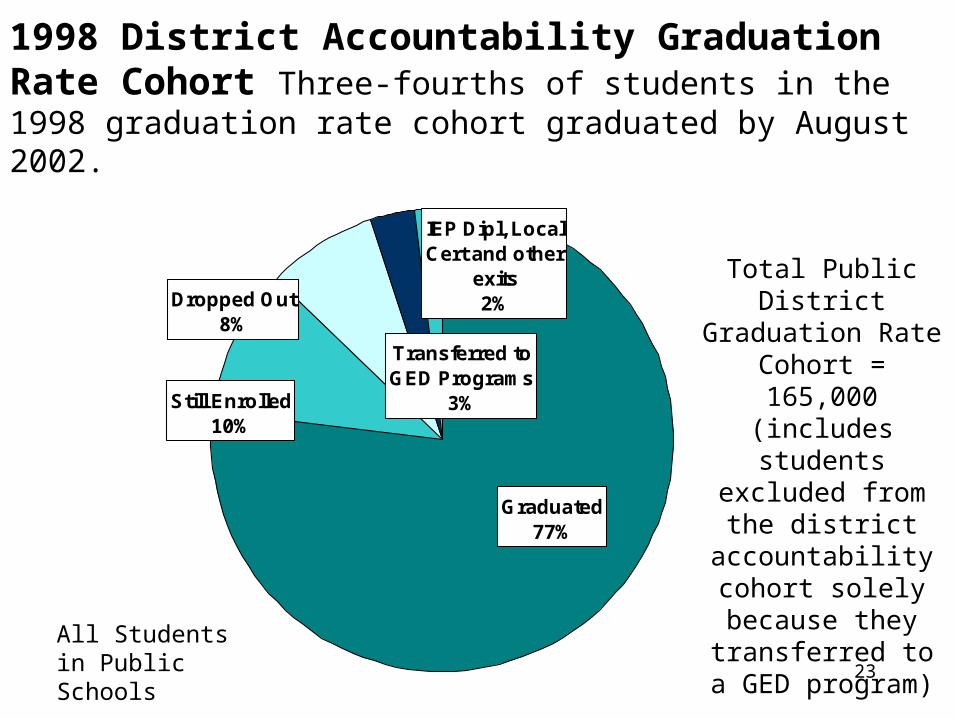
1998 District Accountability Graduation Rate Cohort Three-fourths of students in the 1998 graduation rate cohort graduated by August 2002.
IEP Dipl, Local Cert and other
exits2%
Still Enrolled10%
Dropped Out8%
Graduated77%
Transferred to GED Programs
3%
Total Public District Graduation Rate Cohort = 165,000 (includes students excluded from the
district accountability cohort solely because they
transferred to a GED program)
All Students in Public Schools
24
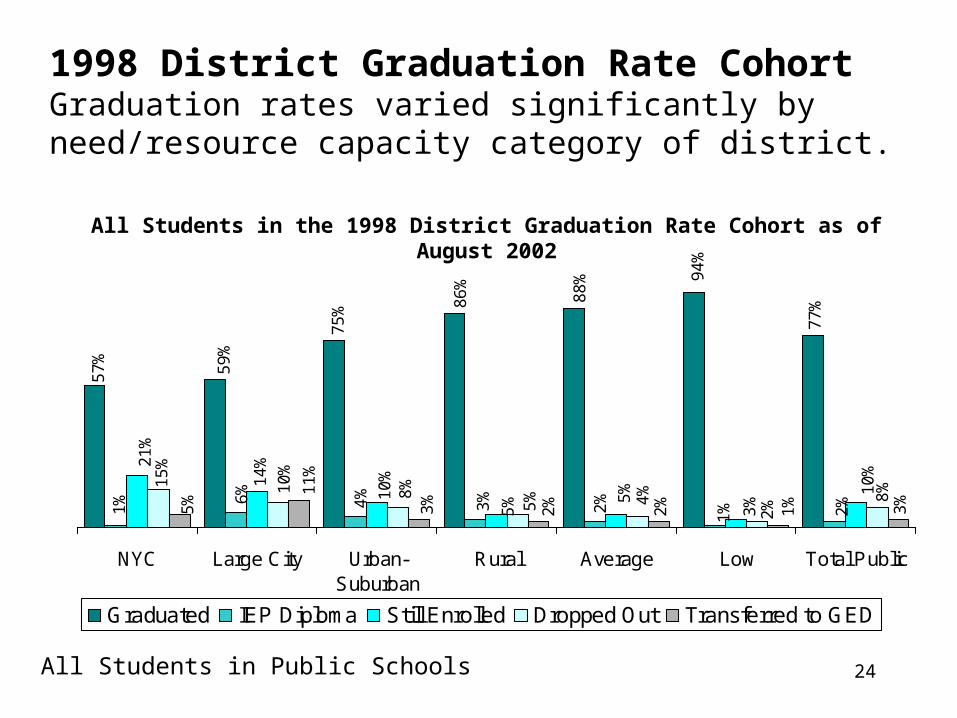
1998 District Graduation Rate CohortGraduation rates varied significantly by need/resource capacity category of district.
77
%
2% 3%
59
%
75
% 86
%
88
% 94
%
57
%
2%1% 6
%
4%
3%
2%
1%
10
%
21
%
14
%
10
%
5% 5
%
3% 8
%10
%
8%
5% 4%
2%
15
%
3%
2%
1%
11
%
5%
NYC Large City Urban-Suburban
Rural Average Low Total Public
Graduated IEP Diploma Still Enrolled Dropped Out Transferred to GED
All Students in Public Schools
All Students in the 1998 District Graduation Rate Cohort as of August 2002
25
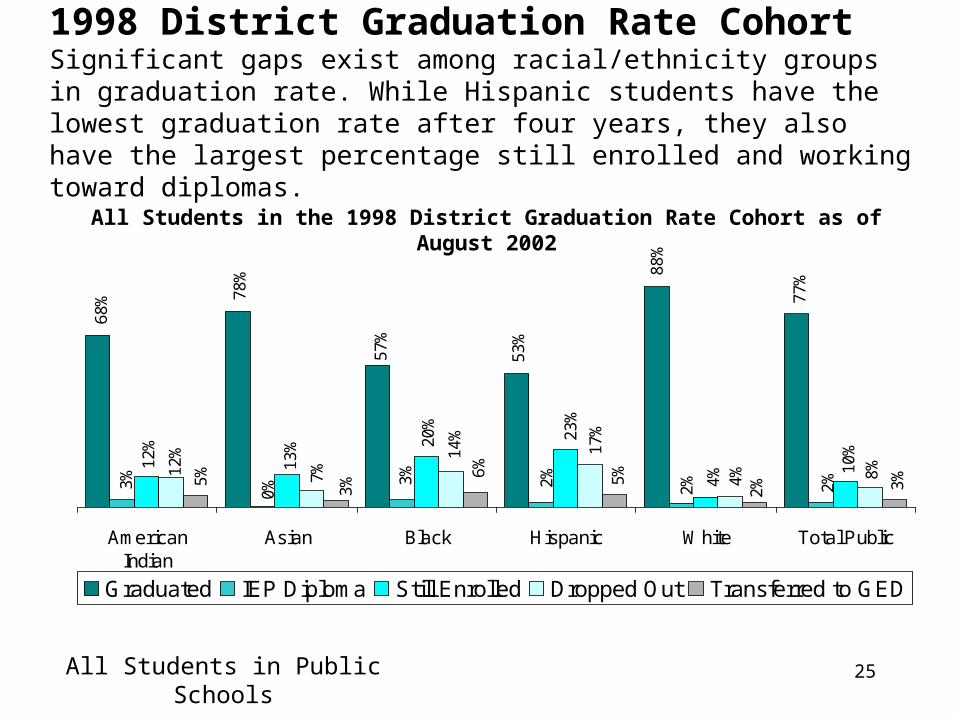
1998 District Graduation Rate CohortSignificant gaps exist among racial/ethnicity groups in graduation rate. While Hispanic students have the lowest graduation rate after four years, they also have the largest percentage still enrolled and working toward diplomas.
2%
78%
57%
53%
88%
77%
68%
3%
0%
3% 2% 2% 2%
12%
13% 20
%
23%
4%
10%
7%
14%
17%
4% 8%12%
6% 5% 3%3%
5%
AmericanIndian
Asian Black Hispanic White Total Public
Graduated IEP Diploma Still Enrolled Dropped Out Transferred to GED
All Students in Public Schools
All Students in the 1998 District Graduation Rate Cohort as of August 2002
26
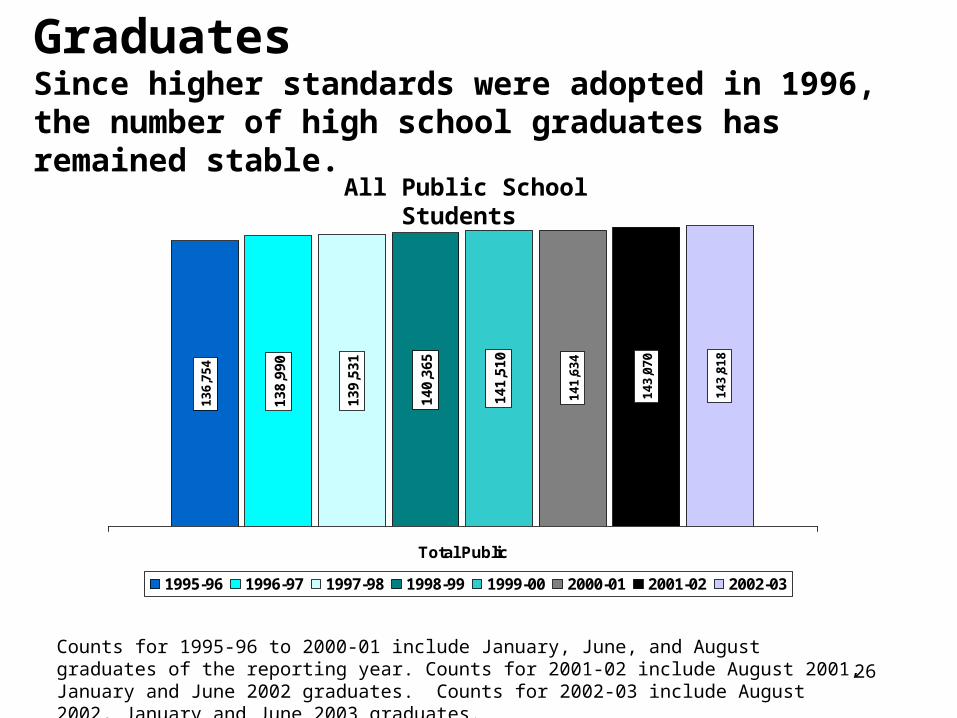
Graduates Since higher standards were adopted in 1996, the number of high school graduates has remained stable.
13
6,7
54
138,
990
139,
531
141,
510
14
1,6
34
14
3,0
70
140,
365
14
3,8
18
Total Public
1995-96 1996-97 1997-98 1998-99 1999-00 2000-01 2001-02 2002-03
All Public School Students
Counts for 1995-96 to 2000-01 include January, June, and August graduates of the reporting year. Counts for 2001-02 include August 2001, January and June 2002 graduates. Counts for 2002-03 include August 2002, January and June 2003 graduates.
27
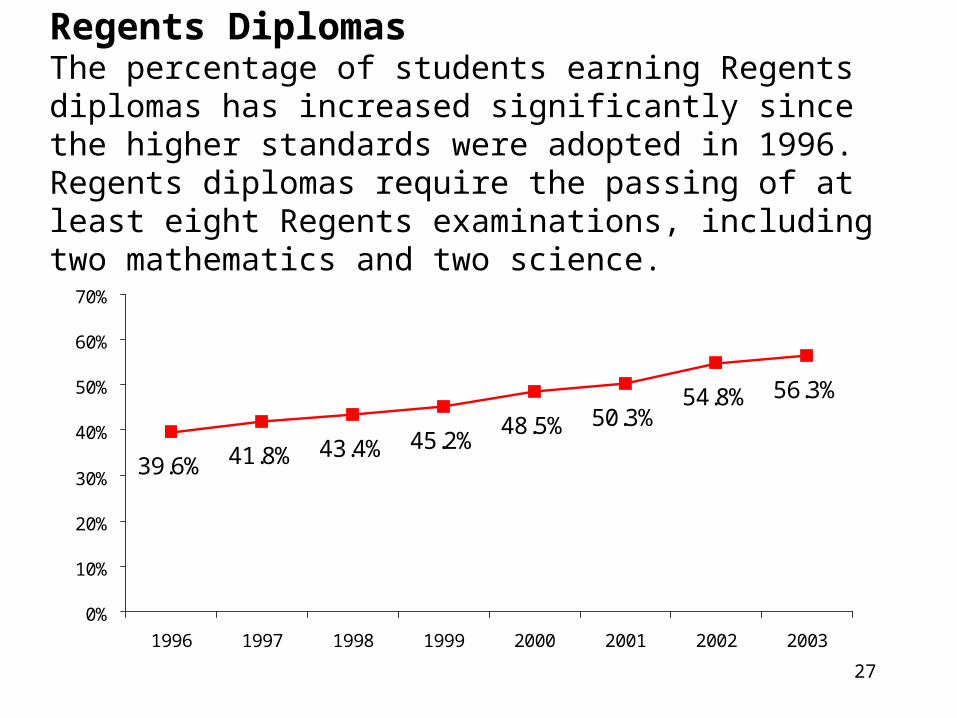
Regents DiplomasThe percentage of students earning Regents diplomas has increased significantly since the higher standards were adopted in 1996. Regents diplomas require the passing of at least eight Regents examinations, including two mathematics and two science.
39.6% 41.8% 43.4% 45.2%48.5% 50.3%
54.8% 56.3%
0%
10%
20%
30%
40%
50%
60%
70%
1996 1997 1998 1999 2000 2001 2002 2003


![Strictly embargoed until: 07.00 on [11th ] November 2015](https://img.pdfslide.us/doc/110x75/61d0c2e97d42c14e3d373803/strictly-embargoed-until-0700-on-11th-november-2015.jpg)