Embed Size (px)
Citation preview
POLL3
@ssrs_solutions | 484.840.4300 | www.ssrs.com | 1
CNN February 2018
The study was conducted for CNN via telephone by SSRS, an independent research company. Interviews were conducted from February 20, 2018 – February 23, 2018 among a sample of 1,016 respondents. The landline total
respondents were 405 and there were 611 cell phone respondents. The margin of sampling error for total respondents is +/-3.7 at the 95% confidence level. The design effect is 1.42. More information about SSRS can be
obtained by visiting www.ssrs.com. Unless otherwise noted, results beginning with the March 31-April 2, 2006 survey and ending with the April 22-25, 2017 survey are from surveys conducted by ORC International. Results
before March 31, 2006 are from surveys conducted by Gallup.
EMBARGOED FOR RELEASE: Wednesday, February 28 at noon
POLL3
@ssrs_solutions | 484.840.4300 | www.ssrs.com | 2
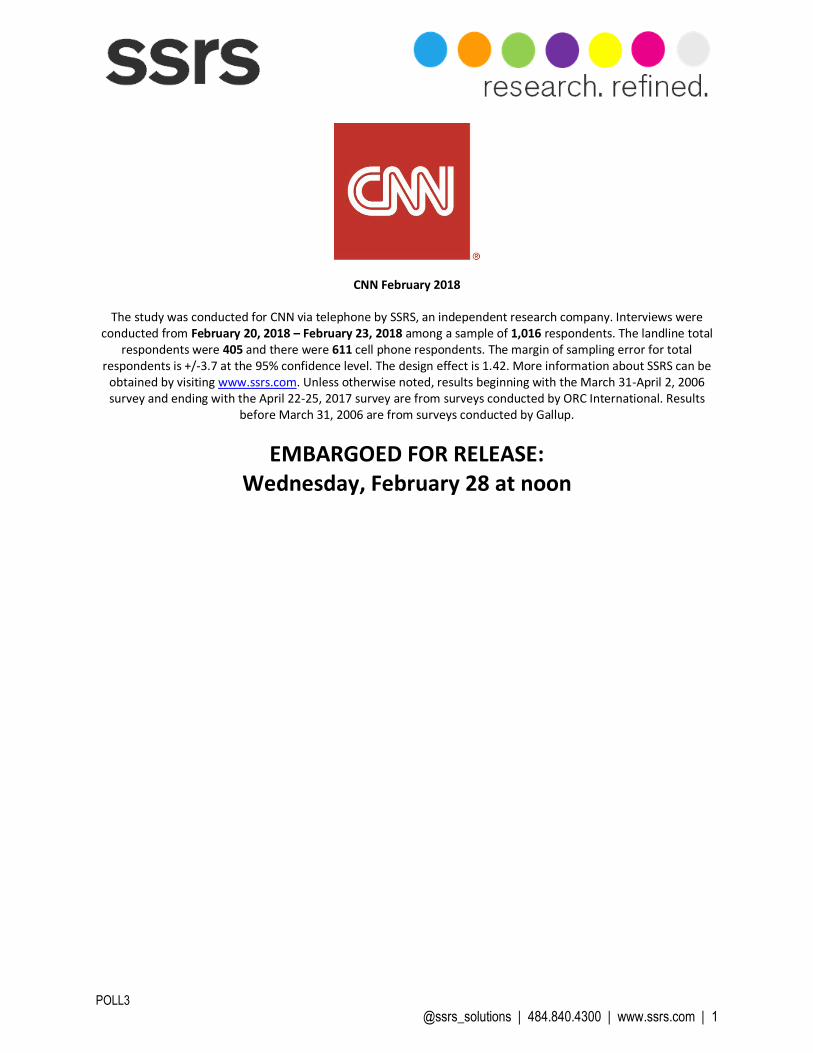
Q2. (A2) Do you approve or disapprove of the way Donald Trump is handling…?
The economy Approve Disapprove No opinion
February 20-23, 2018 46% 47% 7%
January 14-18, 2018 49% 43% 8%
December 14-17, 2017 44% 49% 6%
November 2-5, 2017 45% 46% 9%
September 17-20, 2017 45% 47% 8%
August 03-06, 2017 45% 47% 8% April 22-25, 2017 49% 47% 4%
March 1-4, 2017* 55% 41% 4%
Jan. 31 - Feb. 2, 2017 49% 43% 9%
Immigration Approve Disapprove No opinion
February 20-23, 2018 36% 60% 5%
January 14-18, 2018 38% 57% 5%
November 2-5, 2017 37% 57% 6%
October 12-15, 2017 37% 59% 5%
September 17-20, 2017 36% 60% 4%
August 03-06, 2017* 40% 55% 5%
April 22-25, 2017 41% 57% 2%
March 1-4, 2017 44% 55% 1%
Jan. 31 - Feb. 2, 2017 42% 56% 2%
*Asked of half sample.
POLL3
@ssrs_solutions | 484.840.4300 | www.ssrs.com | 3
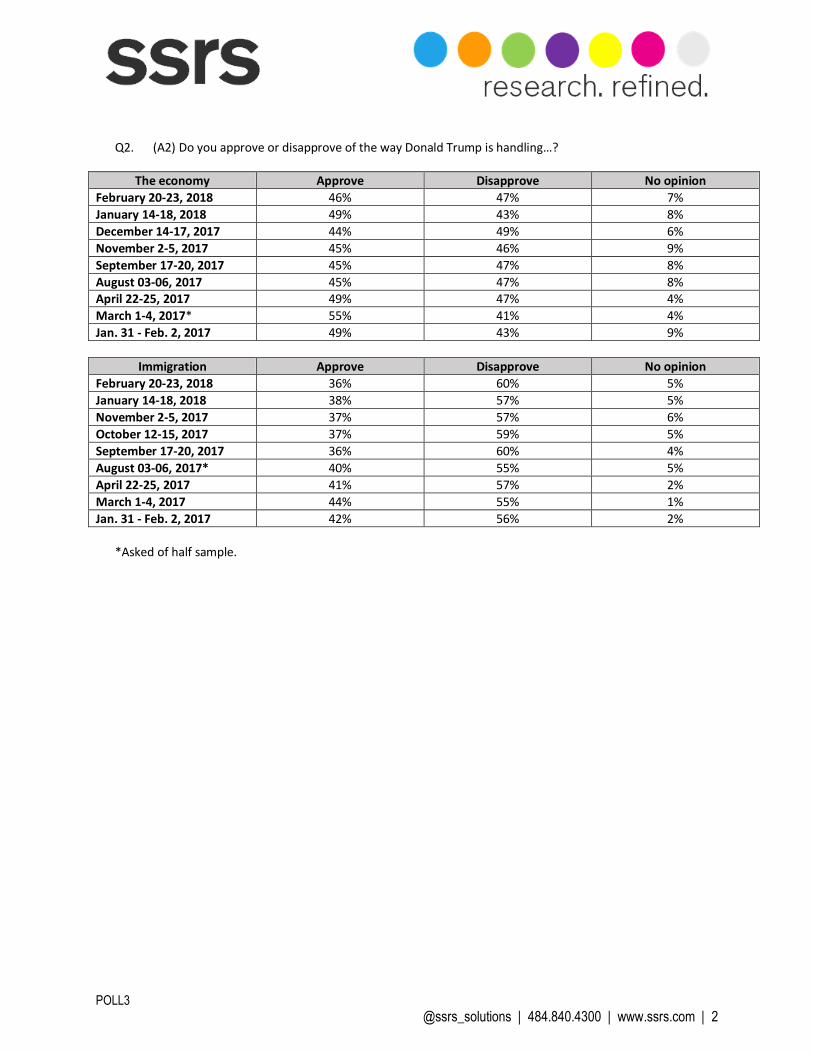
Q7. (C1) How well are things going in the country today - very well, fairly well, pretty badly or very badly?
NET Very/ Fairly well
Very well
Fairly welll
NET Pretty/
Very badly
Pretty badly
Very Badly
No opinion
February 20-23, 2018 49% 13% 36% 49% 28% 21% 2% October 12-15, 2017 46% 8% 38% 51% 30% 21% 3%
August 03-06, 2017 53% 9% 44% 45% 30% 15% 2%
April 22-25, 2017 54% 6% 48% 44% 31% 13% 1%
Jan. 31 - Feb. 2, 2017 46% 8% 38% 53% 33% 20% *
January 12-15, 2017 50% 5% 45% 50% 35% 15% 1%
November 17-20, 2016 47% 5% 42% 53% 34% 19% *
October 20-23, 2016 54% 11% 43% 46% 25% 21% *
July 29-31, 2016 46% 8% 38% 54% 28% 26% *
June 16-19, 2016 44% 6% 38% 56% 36% 20% 1%
Apr. 28-May 1, 2016 49% 9% 40% 51% 28% 23% *
Jan. 21-24, 2016 42% 6% 36% 57% 35% 22% 1%
Nov. 27 – Dec. 1, 2015 49% 5% 44% 50% 30% 20% *
August 13-16, 2015 48% 7% 41% 52% 33% 19% *
May 29-31, 2015 47% 4% 43% 52% 35% 17% *
Mar. 13-15, 2015 53% 7% 46% 46% 32% 14% *
Nov. 21-23, 2014 52% 8% 44% 48% 33% 15% *
Sept. 25-28, 2014 50% 3% 47% 49% 30% 19% 1%
Sept. 5-7, 2014 44% 4% 40% 55% 31% 24% *
May 29-June 1, 2014 47% 3% 44% 53% 35% 18% * March 7-9, 2014 45% 4% 41% 55% 36% 19% *
Nov. 18-20, 2013 41% 6% 35% 59% 37% 22% *
Sept. 6-8, 2013 46% 4% 42% 53% 34% 19 *
April 5-7, 2013 50% 7% 43% 50% 26% 24% *
Jan. 14-15, 2013 49% 3% 46% 51% 36% 15% *
April 5-7, 2013 50% 7% 43% 50% 26% 24% *
Jan. 14-15, 2013 49% 3% 46% 51% 36% 15% *

POLL3
@ssrs_solutions | 484.840.4300 | www.ssrs.com | 4
Q7. (C1) How well are things going in the country today - very well, fairly well, pretty badly or very badly? (CONTINUED)
CNN/ORC TRENDS FOR COMPARISON
Very/ fairly well
Very/ pretty badly
Very/ fairly well
Very/ pretty badly
Very/ fairly well
Very/ pretty badly
2012 Nov 16-18 43% 57% 2010 Sept 21-23 2%9 70% 2008 Oct 3-5 20% 80% 2012 Nov 2-4* 46% 53% 2010 Aug 6-10 31% 69% 2008 Aug 23-24 31% 69% 2012 Aug 7-8 36% 63% 2010 Jun 16 27% 73% 2008 July 27-29 24% 76% 2012 Apr 13-15 43% 57% 2010 Mar 19-21 32% 67% 2008 Apr 28-30 30% 70% 2012 Feb 10-13 40% 60% 2010 Jan 22-24 32% 67% 2007 Nov 2-4 42% 58% 2011 Dec 16-18 30% 70% 2009 Dec 2-3 34% 66% 2007 Apr 10-12 48% 51% 2011 Nov 11-13 25% 74% 2009 Oct 30-Nov 1 37% 63% 2007 Jan 11 57% 42% 2011Aug 24-25 28% 73% 2009 Aug 28-31 30% 69% 2006 Nov 3-5 51% 48% 2011 Aug 5-7 24% 75% 2009 May 14-17 28% 71% 2006 Oct 6-8 49% 49% 2011 May 24-26 39% 60% 2009 Apr 3-5 23% 77% 2006 Sep 29-Oct 2 51% 49% 2011 Mar 18-20 36% 63% 2009 Feb 18-19 21% 79% 2006 Aug 30-Sep 2 46% 54% 2011 Jan 21-23 43% 56% 2008 Dec 1-2 20% 79% 2006 Aug 2-3 55% 44% 2010 Dec 17-19 29% 71% 2008 Nov 6-9 16% 83% 2006 May 5-7 46% 53% 2010 Oct 27-30 25% 75% 2008 Oct 17-19 25% 75%
TRENDS CONTINUE ON THE NEXT PAGE

POLL3
@ssrs_solutions | 484.840.4300 | www.ssrs.com | 5
Trends from 1974 to May, 2004: CNN/Time or Time magazine polls; Trends from October, 2004 to Feb, 2006: CNN/USA Today/Gallup polls
Very/ fairly well
Very/ pretty badly
Very/ fairly well
Very/ pretty badly
Very/ fairly well
Very/ pretty badly
Very/ fairly well
Very/ pretty badly
Very/ fairly well
Very/ pretty badly
2006 Feb 9-12 52 47 1999 Mar 25 70 29 1994 Sep 45 53 1991 Apr 56 42 1981 Jan 26 74 2005 Nov 11-13 49 50 1999 Mar 4 73 26 1994 Sep 46 53 1991 Apr 59 41 1980 Oct 32 68 2005 Sep 8-11 50 50 1999 Jan 20-21 77 22 1994 Sep 42 57 1991 Mar 74 26 1980 Aug 30 70 2005 July 23-24 58 41 1999 Jan 7 74 25 1994 Aug 42 58 1991 Feb 58 42 1980 May 21 79 2005 April 1-2 61 38 1998 Dec 17-18 60 38 1994 Aug 45 52 1991 Jan 39 61 1980 Mar 24 76 2005 Jan 7-9 58 41 1998 Oct 14-15 78 21 1994 Aug 49 50 1990 Dec 45 55 1980 Jan 34 65 2004 Oct 29-31 55 44 1998 Sep 23-24 72 26 1994 Jul 51 48 1990 Nov 42 58 1979 Dec 36 64 2004 Oct 9-10 54 46 1998 Sep 16-17 72 25 1994 Jun 49 49 1990 Oct 38 62 1979 Oct 36 68 2004 May 12-13 60 39 1998 Aug 18 77 21 1994 Jun 56 41 1990 Oct 41 59 1979 Aug 31 70 2004 Apr 8 63 36 1998 Jul 30 68 31 1994 May 48 51 1990 Oct 42 58 1979 Apr 36 65 2004 Feb 5-6 52 47 1998 Jun 30-Jul 1 67 31 1994 May 49 50 1990 Sep 52 48 1978 Oct 56 44 2004 Jan 14-15 53 46 1998 Jun 26-Jul 5 55 44 1994 Apr 47 52 1990 Aug 55 45 1978 May 49 51 2003 Dec 30-Jan 1 49 49 1998 May 18-19 66 30 1994 Apr 53 44 1990 Jul 55 45 1978 Mar 53 47 2003 Nov 18-19 52 46 1998 Apr 8-9 70 30 1994 Mar 48 49 1990 May 61 37 1977 Nov 64 35 2003 Sep 3-4 49 49 1998 Mar 18-19 76 25 1994 Mar 49 50 1990 Apr 62 38 1977 Jul 69 31 2003 Jul 16-17 57 42 1998 Feb 4-5 74 25 1994 Feb 47 51 1990 Mar 62 38 1977 May 65 35 2003 May 21-22 60 39 1998 Jan 28-29 79 19 1994 Jan 52 47 1990 Feb 70 30 1977 Mar 69 31 2003 Mar 27 63 36 1998 Jan 22 68 31 1993 Dec 48 50 1990 Jan 67 33 1976 Oct 56 44 2003 Feb 19-20 52 47 1998 Jan 14-15 65 32 1993 Nov 45 54 1989 Oct 62 38 1976 Sep 57 44 2003 Feb 6 53 46 1997 Oct 30 67 31 1993 Oct 40 58 1989 Jun 61 39 1976 Aug 60 40 2003 Jan 15-16 49 49 1997 Sep 10-11 63 34 1993 Oct 39 58 1989 Jan 69 31 1976 Jun 50 50 2002 Dec 17-18 54 45 1997 Jul 30-31 69 29 1993 Oct 41 59 1988 Oct 70 31 1976 Apr 52 48 2002 Nov 13-14 56 42 1997 Jun 4-5 64 34 1993 Sep 47 52 1988 Sep 73 27 1976 Jan 46 55 2002 Oct 23-24 49 49 1997 May 7-8 63 35 1993 Sep 42 57 1988 Apr 64 40 1975 May 40 61 2002 Aug 28-29 57 41 1997 Apr 16-17 62 37 1993 Aug 39 58 1988 Mar 65 33 1975 Jan 23 78 2002 Jul 10-11 59 39 1997 Mar 11-12 57 41 1993 Aug 41 57 1988 Feb 60 37 1974 Sep 30 70 2002 Jun 19-20 57 41 1997 Feb 26-27 64 35 1993 Jun 41 56 1988 Jan 62 38 1974 Mar 29 71 2002 May 22-23 64 35 1997 Feb 5-6 67 33 1993 May 40 58 1987 Oct 58 42 2002 Apr 10-11 61 38 1997 Jan 8-9 63 35 1993 May 43 56 1987 Aug 61 39 2002 Mar 13-14 69 29 1996 Oct 67 32 1993 Apr 45 53 1987 May 64 37 2002 Jan 23-24 66 34 1996 Jun 61 37 1993 Mar 48 50 1987 Feb 61 40 2001 Dec 19-20 64 34 1996 Jun 62 37 1993 Feb 48 49 1987 Jan 61 39 2001 Nov 7-8 63 35 1996 Feb 53 44 1993 Feb 48 49 1986 Sep 63 37 2001 Oct 12 65 33 1996 Jan 48 50 1993 Jan 53 45 1986 Jul 69 31 2001 Sep 27 59 38 1996 Jan 48 50 1993 Jan 47 52 1986 May 65 34 2001 Sep 13 45 53 1995 Dec 54 44 1992 Oct 35 65 1986 Apr 67 32 2001 Jul 17-18 70 29 1995 Oct 46 52 1992 Sep 32 68 1985 Nov 70 31 2001 May 23-24 65 33 1995 Oct 47 51 1992 Aug 35 63 1985 Sep 67 33 2001 Feb 7-8 71 28 1995 Sep 50 49 1992 Jul 31 67 1985 Jul 70 31 2001 Jan 10-11 73 24 1995 Sep 50 49 1992 Jun 35 62 1985 Apr 69 32 2000 Nov 10 74 25 1995 Aug 47 52 1992 Jun 33 65 1984 Dec 74 26 2000 Oct 25-26 79 19 1995 Jul 51 47 1992 May 30 68 1984 Oct 74 26 2000 Oct 12-13 76 22 1995 Jun 53 47 1992 Apr 33 65 1984 Sep 71 30 2000 Oct 4-5 77 22 1995 Jun 45 51 1992 Mar 33 66 1984 Aug 68 32 2000 Sep 6-7 79 19 1995 May 50 49 1992 Feb 35 62 1984 Jan 67 32 2000 Aug 9-10 77 21 1995 Apr 46 52 1992 Jan 29 71 1983 Dec 60 40 2000 Jul 26-27 74 24 1995 Mar 52 46 1992 Jan 35 64 1983 Sep 56 45 2000 Jun 14-15 72 27 1995 Mar 49 48 1992 Jan 36 64 1983 Jun 58 41 2000 Mar 8-9 76 22 1995 Feb 54 44 1991 Dec 29 71 1983 Mar 46 55 2000 Feb 2-3 78 17 1995 Jan 58 41 1991 Nov 36 64 1982 Dec 35 65 2000 Jan 12-13 81 19 1995 Jan 56 43 1991 Oct 42 56 1982 Oct 40 60 2000 Jan 5-6 80 19 1995 Jan 54 44 1991 Oct 42 58 1982 Jun 40 60 1999 Nov 10-11 68 30 1994 Dec 55 44 1991 Sep 49 49 1982 Mar 39 62 1999 Jul 14-15 70 28 1994 Nov 49 48 1991 Aug 53 47 1981 Dec 43 58 1999 Jun 9-10 69 31 1994 Oct 50 49 1991 Jun 53 47 1981 Sep 53 47 1999 May 26-27 61 37 1994 Oct 51 47 1991 May 53 47 1981 May 51 50

POLL3
@ssrs_solutions | 484.840.4300 | www.ssrs.com | 6
On another topic… Q14. How confident are you that Congress and President Trump will enact new laws on immigration and
border security that will improve the way the country handles this issue?
Very confident
Fairly confident
Not too confident
Not confident at all
No opinion
February 20-23, 2018 16% 22% 25% 35% 3%
January 14-18, 2018 18% 22% 32% 28% 1%
September 17-20, 2017 12% 26% 23% 38% 2%
June 8-11, 2006** 11% 24% 29% 33% 3%
**QUESTION WORDING JUNE 8-11,2006: How confident are you that Congress and President Bush will enact new laws on immigration and border security that will improve the way the country handles this issue?
Q15. As you may know, a U.S. government program allows some immigrants who were brought to the U.S.
illegally as children to remain in the U.S. without risk of deportation. To qualify, immigrants had to be under the age of 30 as of 2012, have no criminal record, and be a student, in the military or have earned a high school diploma. Do you think the U.S. should:
Continue this policy and allow immigrants who meet
these qualifications to remain the U.S.
End this policy and allow immigrants to be deported even if they do meet these
qualifications
No opinion
February 20-23, 2018 83% 12% 5%
January 14-18, 2018 84% 11% 5%
December 14-17, 2017 83% 13% 4%
September 17-20, 2017 82% 14% 4%
(Respondents who believe the US should allow immigrants who meet certain qualifications to remain in the U.S. N=828) Q16. Who do you think is most responsible for that program not having been continued yet, Donald Trump,
the Republicans in Congress or the Democrats in Congress?
Trump Republicans in Congress
Democrats in Congress
All of them (vol.)
None of them (vol.)
NET Other
combination (vol.)
No opinion
February 20-23, 2018 33% 31% 17% 5% 1% 7% 7%
Q17. How likely do you think it is that the program will ultimately be continued?
NET Very/ Somewhat
likely Very likely
Somewhat likely
NET Not too/Not at
all likely
Not too likely
Not at all likely
No opinion
February 20-23, 2018 61% 17% 44% 35% 25% 10% 3%

POLL3
@ssrs_solutions | 484.840.4300 | www.ssrs.com | 7
MORE ON METHODOLOGY
A total of 1,016 adults were interviewed by telephone nationwide by live interviewers calling both landline and cell phones. Interviews were conducted in English and Spanish. Interviews were conducted February 20-23, 2018. Among the entire sample, 33% described themselves as Democrats, 23% described themselves as Republicans, and 44% described themselves as independents or members of another party. All respondents were asked questions concerning basic demographics, and the entire sample was weighted to reflect national Census figures for gender, race, age, education, region of country, and telephone usage. Results for the full sample have a margin of sampling error of +/-3.7 percentage points. For the sample of 909 registered voters, it is +/-3.9 percentage points. Crosstabs on the following pages only include results for subgroups with enough unweighted cases to produce a sampling error of +/-8.5 percentage points or less once adjusted for design effect. Some subgroups represent too small a share of the national population to produce crosstabs with an acceptable sampling error. Interviews were conducted among these subgroups, but results for groups with a design-effect adjusted sampling error larger than +/-8.5 percentage points are not displayed and instead are denoted with "N/A".

POLL3
@ssrs_solutions | 484.840.4300 | www.ssrs.com | 8
CNN/SSRS Poll -- February 20, 2018 to February 23, 2018
TABLE 002
2A. (A2a) Do you approve or disapprove of the way Donald Trump is handling The economy?
Base: Total Respondents
Trump Trump
Non- ap- disap
Total Men Women White white prove prove
===== ===== ===== ===== ===== ===== =====
Approve 46% 55% 38% 51% 37% 95% 16%
Disapprove 47% 39% 54% 42% 56% 5% 76%
Don't know/Undecided/Refused 7% 6% 8% 7% 8% 1% 8%
Sampling Error (+/-) 3.7 5.0 5.4 4.2 7.0 5.8 4.9
Total 18-34 35-49 50-64 65+ <45 45+
===== ===== ===== ===== ===== ===== =====
Approve 46% 36% 46% 53% 51% 39% 52%
Disapprove 47% 55% 44% 43% 45% 51% 43%
Don't know/Undecided/Refused 7% 9% 10% 4% 5% 10% 5%
Sampling Error (+/-) 3.7 7.9 7.6 6.4 7.0 6.1 4.4
Non- White White
coll. Coll. non- coll.
Total <$50K $50K+ grad grad. coll. grad.
===== ===== ===== ===== ===== ===== =====
Approve 46% 37% 52% 48% 43% 54% 47%
Disapprove 47% 54% 42% 46% 49% 39% 47%
Don't know/Undecided/Refused 7% 9% 6% 7% 8% 7% 6%
Sampling Error (+/-) 3.7 6.5 4.6 4.8 5.2 5.6 5.8
Indep Con
Demo- endnt Repub Lib- Mode- serva
Total crat Other lican eral rate tive
===== ===== ===== ===== ===== ===== =====
Approve 46% 12% 50% 87% 16% 44% 75%
Disapprove 47% 82% 41% 9% 77% 47% 22%
Don't know/Undecided/Refused 7% 6% 9% 4% 7% 10% 3%
Sampling Error (+/-) 3.7 6.5 5.7 7.3 7.4 5.8 6.5
Lean Lean Non-
Demo- Repub Reg. Gun Gun White
Total crat lican voter HH HH Evang
===== ===== ===== ===== ===== ===== =====
Approve 46% 18% 88% 48% 64% 30% 73%
Disapprove 47% 74% 8% 46% 31% 62% 24%
Don't know/Undecided/Refused 7% 8% 4% 6% 6% 8% 3%
Sampling Error (+/-) 3.7 5.1 5.7 3.9 5.3 5.2 7.7
POLL3
@ssrs_solutions | 484.840.4300 | www.ssrs.com | 9
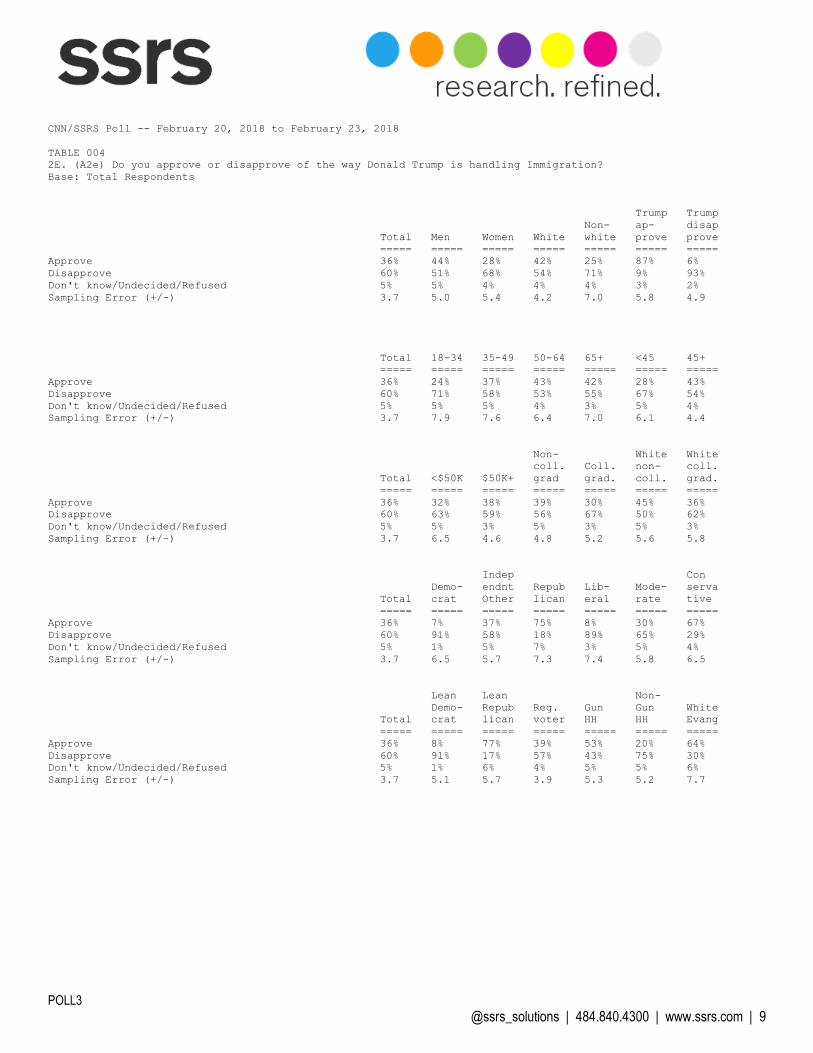
CNN/SSRS Poll -- February 20, 2018 to February 23, 2018
TABLE 004
2E. (A2e) Do you approve or disapprove of the way Donald Trump is handling Immigration?
Base: Total Respondents
Trump Trump
Non- ap- disap
Total Men Women White white prove prove
===== ===== ===== ===== ===== ===== =====
Approve 36% 44% 28% 42% 25% 87% 6%
Disapprove 60% 51% 68% 54% 71% 9% 93%
Don't know/Undecided/Refused 5% 5% 4% 4% 4% 3% 2%
Sampling Error (+/-) 3.7 5.0 5.4 4.2 7.0 5.8 4.9
Total 18-34 35-49 50-64 65+ <45 45+
===== ===== ===== ===== ===== ===== =====
Approve 36% 24% 37% 43% 42% 28% 43%
Disapprove 60% 71% 58% 53% 55% 67% 54%
Don't know/Undecided/Refused 5% 5% 5% 4% 3% 5% 4%
Sampling Error (+/-) 3.7 7.9 7.6 6.4 7.0 6.1 4.4
Non- White White
coll. Coll. non- coll.
Total <$50K $50K+ grad grad. coll. grad.
===== ===== ===== ===== ===== ===== =====
Approve 36% 32% 38% 39% 30% 45% 36%
Disapprove 60% 63% 59% 56% 67% 50% 62%
Don't know/Undecided/Refused 5% 5% 3% 5% 3% 5% 3%
Sampling Error (+/-) 3.7 6.5 4.6 4.8 5.2 5.6 5.8
Indep Con
Demo- endnt Repub Lib- Mode- serva
Total crat Other lican eral rate tive
===== ===== ===== ===== ===== ===== =====
Approve 36% 7% 37% 75% 8% 30% 67%
Disapprove 60% 91% 58% 18% 89% 65% 29%
Don't know/Undecided/Refused 5% 1% 5% 7% 3% 5% 4%
Sampling Error (+/-) 3.7 6.5 5.7 7.3 7.4 5.8 6.5
Lean Lean Non-
Demo- Repub Reg. Gun Gun White
Total crat lican voter HH HH Evang
===== ===== ===== ===== ===== ===== =====
Approve 36% 8% 77% 39% 53% 20% 64%
Disapprove 60% 91% 17% 57% 43% 75% 30%
Don't know/Undecided/Refused 5% 1% 6% 4% 5% 5% 6%
Sampling Error (+/-) 3.7 5.1 5.7 3.9 5.3 5.2 7.7

POLL3
@ssrs_solutions | 484.840.4300 | www.ssrs.com | 10
CNN/SSRS Poll -- February 20, 2018 to February 23, 2018
TABLE 022
7. (qnC1) How well are things going in the country today - very well, fairly well, pretty badly or very badly?
Base: Total Respondents
Trump Trump
Non- ap- disap
Total Men Women White white prove prove
===== ===== ===== ===== ===== ===== =====
Well (Net) 49% 59% 38% 51% 45% 83% 26%
Very well 13% 16% 10% 13% 11% 31% 3%
Fairly well 36% 43% 29% 38% 34% 52% 24%
Badly (Net) 49% 39% 59% 48% 52% 15% 72%
Pretty badly 28% 23% 33% 28% 27% 11% 39%
Very badly 21% 16% 26% 19% 25% 4% 34%
Don't know/Undecided/Refused 2% 2% 3% 1% 3% 2% 1%
Sampling Error (+/-) 3.7 5.0 5.4 4.2 7.0 5.8 4.9
Total 18-34 35-49 50-64 65+ <45 45+
===== ===== ===== ===== ===== ===== =====
Well (Net) 49% 46% 48% 52% 49% 46% 52%
Very well 13% 7% 12% 14% 19% 9% 16%
Fairly well 36% 39% 37% 38% 30% 37% 36%
Badly (Net) 49% 54% 49% 46% 47% 53% 46%
Pretty badly 28% 33% 28% 25% 24% 32% 24%
Very badly 21% 21% 21% 21% 23% 21% 22%
Don't know/Undecided/Refused 2% 1% 3% 2% 4% 2% 2%
Sampling Error (+/-) 3.7 7.9 7.6 6.4 7.0 6.1 4.4
Non- White White
coll. Coll. non- coll.
Total <$50K $50K+ grad grad. coll. grad.
===== ===== ===== ===== ===== ===== =====
Well (Net) 49% 40% 55% 50% 48% 52% 50%
Very well 13% 9% 14% 13% 13% 13% 15%
Fairly well 36% 31% 40% 37% 35% 39% 35%
Badly (Net) 49% 58% 44% 48% 49% 47% 48%
Pretty badly 28% 34% 24% 26% 30% 27% 30%
Very badly 21% 23% 20% 22% 20% 20% 19%
Don't know/Undecided/Refused 2% 2% 1% 2% 2% 1% 2%
Sampling Error (+/-) 3.7 6.5 4.6 4.8 5.2 5.6 5.8
Indep Con
Demo- endnt Repub Lib- Mode- serva
Total crat Other lican eral rate tive
===== ===== ===== ===== ===== ===== =====
Well (Net) 49% 25% 50% 82% 23% 50% 70%
Very well 13% 4% 12% 26% 3% 10% 25%
Fairly well 36% 21% 38% 56% 21% 40% 45%
Badly (Net) 49% 74% 48% 15% 77% 47% 28%
Pretty badly 28% 42% 26% 12% 42% 28% 16%
Very badly 21% 32% 22% 3% 35% 19% 12%
Don't know/Undecided/Refused 2% 1% 3% 3% * 2% 2%
Sampling Error (+/-) 3.7 6.5 5.7 7.3 7.4 5.8 6.5
Lean Lean Non-
Demo- Repub Reg. Gun Gun White
Total crat lican voter HH HH Evang
===== ===== ===== ===== ===== ===== =====
Well (Net) 49% 29% 80% 51% 61% 38% 64%
Very well 13% 4% 26% 14% 17% 9% 19%
Fairly well 36% 24% 54% 38% 44% 29% 46%
Badly (Net) 49% 70% 17% 47% 38% 59% 34%
Pretty badly 28% 39% 13% 25% 25% 31% 21%
Very badly 21% 31% 4% 22% 13% 28% 13%
Don't know/Undecided/Refused 2% 1% 3% 2% 1% 3% 1%
Sampling Error (+/-) 3.7 5.1 5.7 3.9 5.3 5.2 7.7
POLL3
@ssrs_solutions | 484.840.4300 | www.ssrs.com | 11
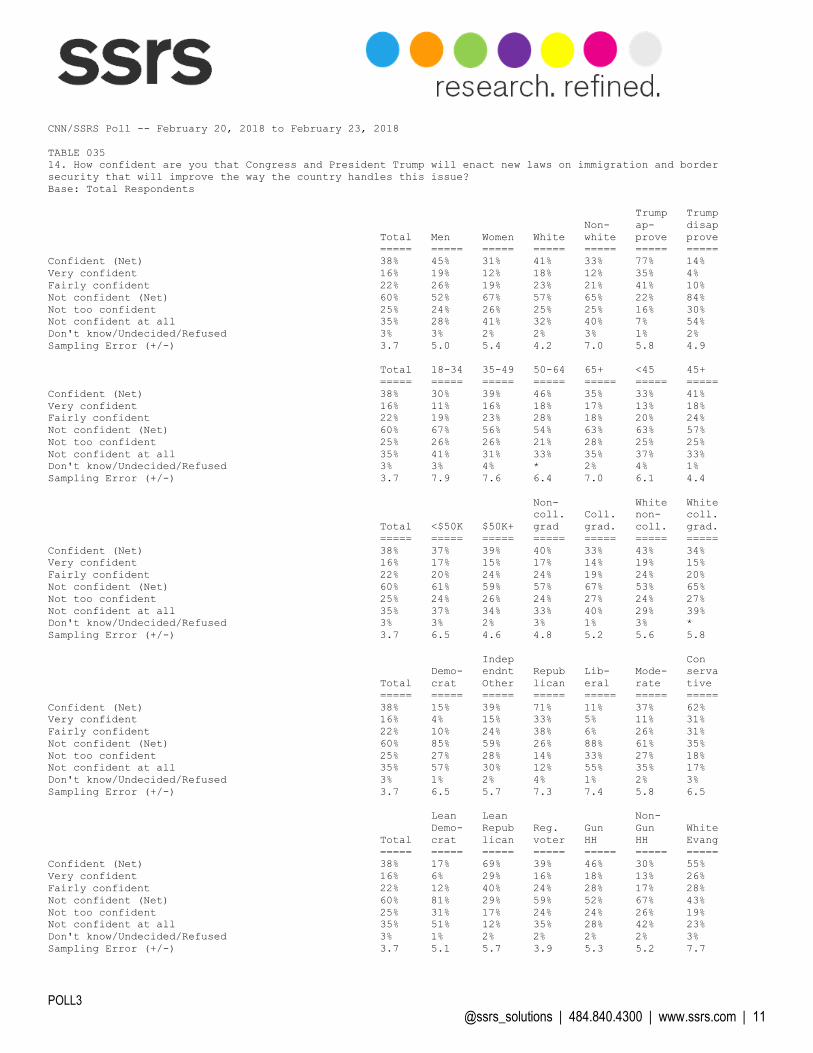
CNN/SSRS Poll -- February 20, 2018 to February 23, 2018
TABLE 035
14. How confident are you that Congress and President Trump will enact new laws on immigration and border
security that will improve the way the country handles this issue?
Base: Total Respondents
Trump Trump
Non- ap- disap
Total Men Women White white prove prove
===== ===== ===== ===== ===== ===== =====
Confident (Net) 38% 45% 31% 41% 33% 77% 14%
Very confident 16% 19% 12% 18% 12% 35% 4%
Fairly confident 22% 26% 19% 23% 21% 41% 10%
Not confident (Net) 60% 52% 67% 57% 65% 22% 84%
Not too confident 25% 24% 26% 25% 25% 16% 30%
Not confident at all 35% 28% 41% 32% 40% 7% 54%
Don't know/Undecided/Refused 3% 3% 2% 2% 3% 1% 2%
Sampling Error (+/-) 3.7 5.0 5.4 4.2 7.0 5.8 4.9
Total 18-34 35-49 50-64 65+ <45 45+
===== ===== ===== ===== ===== ===== =====
Confident (Net) 38% 30% 39% 46% 35% 33% 41%
Very confident 16% 11% 16% 18% 17% 13% 18%
Fairly confident 22% 19% 23% 28% 18% 20% 24%
Not confident (Net) 60% 67% 56% 54% 63% 63% 57%
Not too confident 25% 26% 26% 21% 28% 25% 25%
Not confident at all 35% 41% 31% 33% 35% 37% 33%
Don't know/Undecided/Refused 3% 3% 4% * 2% 4% 1%
Sampling Error (+/-) 3.7 7.9 7.6 6.4 7.0 6.1 4.4
Non- White White
coll. Coll. non- coll.
Total <$50K $50K+ grad grad. coll. grad.
===== ===== ===== ===== ===== ===== =====
Confident (Net) 38% 37% 39% 40% 33% 43% 34%
Very confident 16% 17% 15% 17% 14% 19% 15%
Fairly confident 22% 20% 24% 24% 19% 24% 20%
Not confident (Net) 60% 61% 59% 57% 67% 53% 65%
Not too confident 25% 24% 26% 24% 27% 24% 27%
Not confident at all 35% 37% 34% 33% 40% 29% 39%
Don't know/Undecided/Refused 3% 3% 2% 3% 1% 3% *
Sampling Error (+/-) 3.7 6.5 4.6 4.8 5.2 5.6 5.8
Indep Con
Demo- endnt Repub Lib- Mode- serva
Total crat Other lican eral rate tive
===== ===== ===== ===== ===== ===== =====
Confident (Net) 38% 15% 39% 71% 11% 37% 62%
Very confident 16% 4% 15% 33% 5% 11% 31%
Fairly confident 22% 10% 24% 38% 6% 26% 31%
Not confident (Net) 60% 85% 59% 26% 88% 61% 35%
Not too confident 25% 27% 28% 14% 33% 27% 18%
Not confident at all 35% 57% 30% 12% 55% 35% 17%
Don't know/Undecided/Refused 3% 1% 2% 4% 1% 2% 3%
Sampling Error (+/-) 3.7 6.5 5.7 7.3 7.4 5.8 6.5
Lean Lean Non-
Demo- Repub Reg. Gun Gun White
Total crat lican voter HH HH Evang
===== ===== ===== ===== ===== ===== =====
Confident (Net) 38% 17% 69% 39% 46% 30% 55%
Very confident 16% 6% 29% 16% 18% 13% 26%
Fairly confident 22% 12% 40% 24% 28% 17% 28%
Not confident (Net) 60% 81% 29% 59% 52% 67% 43%
Not too confident 25% 31% 17% 24% 24% 26% 19%
Not confident at all 35% 51% 12% 35% 28% 42% 23%
Don't know/Undecided/Refused 3% 1% 2% 2% 2% 2% 3%
Sampling Error (+/-) 3.7 5.1 5.7 3.9 5.3 5.2 7.7

POLL3
@ssrs_solutions | 484.840.4300 | www.ssrs.com | 12
CNN/SSRS Poll -- February 20, 2018 to February 23, 2018
TABLE 036
15. As you may know, a U.S. government program allows some immigrants who were brought to the U.S. illegally as
children to remain in the U.S. without risk of deportation. To qualify, immigrants had to be under the age of 30
as of 2012, have no criminal record, and be a student, in the military or have earned a high school diploma. Do
you think the U.S. should?
Base: Total Respondents
Trump Trump
Non- ap- disap
Total Men Women White white prove prove
===== ===== ===== ===== ===== ===== =====
Continue this policy and allow immigrants who
meet these qualifications to remain in the U.S.... 83% 80% 85% 80% 87% 64% 94%
End this policy and allow immigrants to be
deported even if they do meet these
qualifications.................................... 12% 15% 10% 15% 8% 27% 4%
Don't know/Undecided/Refused 5% 4% 5% 5% 4% 9% 2%
Sampling Error (+/-) 3.7 5.0 5.4 4.2 7.0 5.8 4.9
Total 18-34 35-49 50-64 65+ <45 45+
===== ===== ===== ===== ===== ===== =====
Continue this policy and allow immigrants who
meet these qualifications to remain in the U.S.... 83% 86% 82% 80% 83% 85% 81%
End this policy and allow immigrants to be
deported even if they do meet these
qualifications.................................... 12% 9% 14% 16% 12% 11% 14%
Don't know/Undecided/Refused 5% 5% 4% 4% 5% 4% 5%
Sampling Error (+/-) 3.7 7.9 7.6 6.4 7.0 6.1 4.4
Non- White White
coll. Coll. non- coll.
Total <$50K $50K+ grad grad. coll. grad.
===== ===== ===== ===== ===== ===== =====
Continue this policy and allow immigrants who
meet these qualifications to remain in the U.S.... 83% 88% 81% 82% 85% 79% 84%
End this policy and allow immigrants to be
deported even if they do meet these
qualifications.................................... 12% 9% 14% 14% 10% 16% 12%
Don't know/Undecided/Refused 5% 3% 5% 4% 5% 5% 4%
Sampling Error (+/-) 3.7 6.5 4.6 4.8 5.2 5.6 5.8
Indep Con
Demo- endnt Repub Lib- Mode- serva
Total crat Other lican eral rate tive
===== ===== ===== ===== ===== ===== =====
Continue this policy and allow immigrants who
meet these qualifications to remain in the U.S.... 83% 94% 83% 67% 95% 86% 69%
End this policy and allow immigrants to be
deported even if they do meet these
qualifications.................................... 12% 4% 14% 21% 4% 10% 23%
Don't know/Undecided/Refused 5% 2% 3% 12% 1% 4% 8%
Sampling Error (+/-) 3.7 6.5 5.7 7.3 7.4 5.8 6.5
Lean Lean Non-
Demo- Repub Reg. Gun Gun White
Total crat lican voter HH HH Evang
===== ===== ===== ===== ===== ===== =====
Continue this policy and allow immigrants who
meet these qualifications to remain in the U.S.... 83% 93% 69% 82% 76% 89% 73%
End this policy and allow immigrants to be
deported even if they do meet these
qualifications.................................... 12% 5% 23% 13% 19% 7% 18%
Don't know/Undecided/Refused 5% 2% 8% 5% 5% 4% 9%
Sampling Error (+/-) 3.7 5.1 5.7 3.9 5.3 5.2 7.7
POLL3
@ssrs_solutions | 484.840.4300 | www.ssrs.com | 13
CNN/SSRS Poll -- February 20, 2018 to February 23, 2018
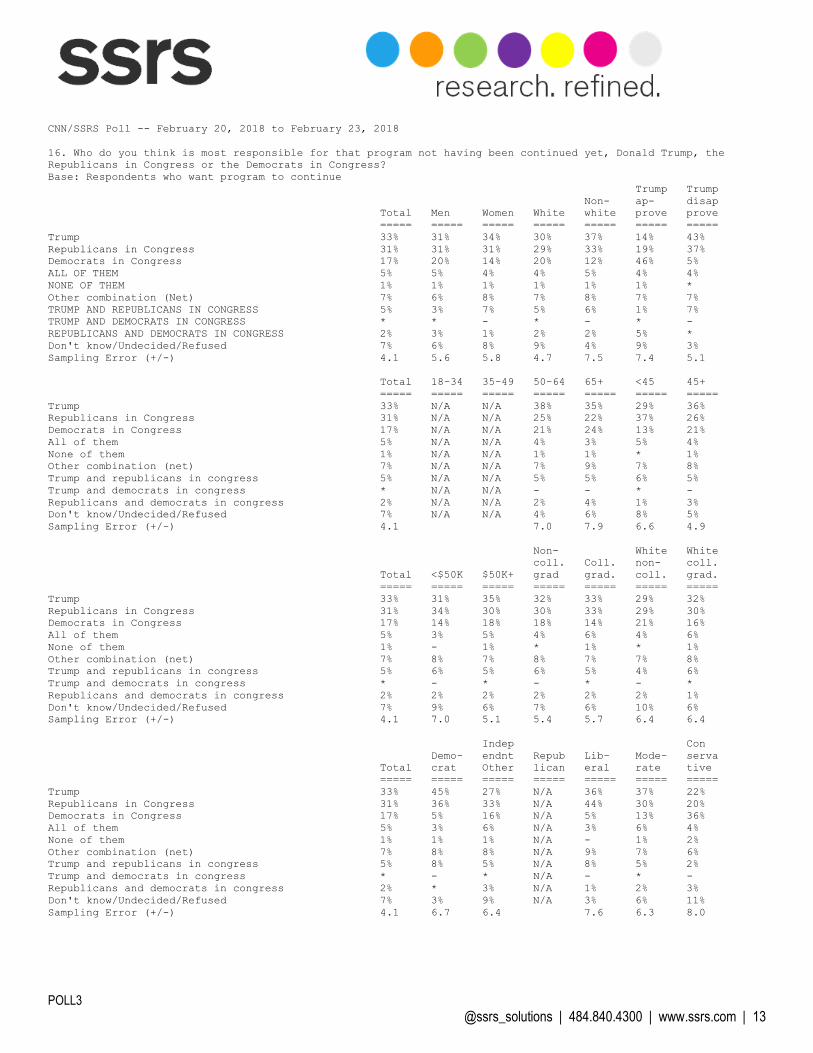
16. Who do you think is most responsible for that program not having been continued yet, Donald Trump, the
Republicans in Congress or the Democrats in Congress?
Base: Respondents who want program to continue
Trump Trump
Non- ap- disap
Total Men Women White white prove prove
===== ===== ===== ===== ===== ===== =====
Trump 33% 31% 34% 30% 37% 14% 43%
Republicans in Congress 31% 31% 31% 29% 33% 19% 37%
Democrats in Congress 17% 20% 14% 20% 12% 46% 5%
ALL OF THEM 5% 5% 4% 4% 5% 4% 4%
NONE OF THEM 1% 1% 1% 1% 1% 1% *
Other combination (Net) 7% 6% 8% 7% 8% 7% 7%
TRUMP AND REPUBLICANS IN CONGRESS 5% 3% 7% 5% 6% 1% 7%
TRUMP AND DEMOCRATS IN CONGRESS * * - * - * -
REPUBLICANS AND DEMOCRATS IN CONGRESS 2% 3% 1% 2% 2% 5% *
Don't know/Undecided/Refused 7% 6% 8% 9% 4% 9% 3%
Sampling Error (+/-) 4.1 5.6 5.8 4.7 7.5 7.4 5.1
Total 18-34 35-49 50-64 65+ <45 45+
===== ===== ===== ===== ===== ===== =====
Trump 33% N/A N/A 38% 35% 29% 36%
Republicans in Congress 31% N/A N/A 25% 22% 37% 26%
Democrats in Congress 17% N/A N/A 21% 24% 13% 21%
All of them 5% N/A N/A 4% 3% 5% 4%
None of them 1% N/A N/A 1% 1% * 1%
Other combination (net) 7% N/A N/A 7% 9% 7% 8%
Trump and republicans in congress 5% N/A N/A 5% 5% 6% 5%
Trump and democrats in congress * N/A N/A - - * -
Republicans and democrats in congress 2% N/A N/A 2% 4% 1% 3%
Don't know/Undecided/Refused 7% N/A N/A 4% 6% 8% 5%
Sampling Error (+/-) 4.1 7.0 7.9 6.6 4.9
Non- White White
coll. Coll. non- coll.
Total <$50K $50K+ grad grad. coll. grad.
===== ===== ===== ===== ===== ===== =====
Trump 33% 31% 35% 32% 33% 29% 32%
Republicans in Congress 31% 34% 30% 30% 33% 29% 30%
Democrats in Congress 17% 14% 18% 18% 14% 21% 16%
All of them 5% 3% 5% 4% 6% 4% 6%
None of them 1% - 1% * 1% * 1%
Other combination (net) 7% 8% 7% 8% 7% 7% 8%
Trump and republicans in congress 5% 6% 5% 6% 5% 4% 6%
Trump and democrats in congress * - * - * - *
Republicans and democrats in congress 2% 2% 2% 2% 2% 2% 1%
Don't know/Undecided/Refused 7% 9% 6% 7% 6% 10% 6%
Sampling Error (+/-) 4.1 7.0 5.1 5.4 5.7 6.4 6.4
Indep Con
Demo- endnt Repub Lib- Mode- serva
Total crat Other lican eral rate tive
===== ===== ===== ===== ===== ===== =====
Trump 33% 45% 27% N/A 36% 37% 22%
Republicans in Congress 31% 36% 33% N/A 44% 30% 20%
Democrats in Congress 17% 5% 16% N/A 5% 13% 36%
All of them 5% 3% 6% N/A 3% 6% 4%
None of them 1% 1% 1% N/A - 1% 2%
Other combination (net) 7% 8% 8% N/A 9% 7% 6%
Trump and republicans in congress 5% 8% 5% N/A 8% 5% 2%
Trump and democrats in congress * - * N/A - * -
Republicans and democrats in congress 2% * 3% N/A 1% 2% 3%
Don't know/Undecided/Refused 7% 3% 9% N/A 3% 6% 11%
Sampling Error (+/-) 4.1 6.7 6.4 7.6 6.3 8.0

POLL3
@ssrs_solutions | 484.840.4300 | www.ssrs.com | 14
CNN/SSRS Poll -- February 20, 2018 to February 23, 2018
16. Who do you think is most responsible for that program not having been continued yet, Donald Trump, the
Republicans in Congress or the Democrats in Congress?
Base: Respondents who want program to continue
Lean Lean Non-
Demo- Repub Reg. Gun Gun White
Total crat lican voter HH HH Evang
===== ===== ===== ===== ===== ===== =====
Trump 33% 43% 15% 33% 26% 38% N/A
Republicans in Congress 31% 39% 20% 30% 28% 33% N/A
Democrats in Congress 17% 4% 43% 18% 25% 10% N/A
All of them 5% 2% 6% 3% 5% 4% N/A
None of them 1% * 1% * 1% * N/A
Other combination (Net) 7% 8% 6% 8% 7% 8% N/A
Trump and republicans in congress 5% 8% 1% 6% 4% 7% N/A
Trump and democrats in congress * - * * * - N/A
Republicans and democrats in congress 2% * 4% 2% 3% 1% N/A
Don't know/Undecided/Refused 7% 3% 10% 7% 8% 6% N/A
Sampling Error (+/-) 4.1 5.3 7.0 4.3 6.1 5.5

POLL3
@ssrs_solutions | 484.840.4300 | www.ssrs.com | 15
CNN/SSRS Poll -- February 20, 2018 to February 23, 2018
TABLE 039
17. How likely do you think it is that the program will ultimately be continued?
Base: Total Respondents
Trump Trump
Non- ap- disap
Total Men Women White white prove prove
===== ===== ===== ===== ===== ===== =====
Likely (Net) 61% 67% 56% 64% 58% 75% 53%
Very likely 17% 21% 14% 17% 18% 26% 12%
Somewhat likely 44% 46% 42% 47% 39% 49% 42%
Not likely (Net) 35% 30% 41% 34% 39% 22% 45%
Not too likely 25% 21% 29% 23% 29% 14% 32%
Not at all likely 10% 9% 12% 10% 10% 8% 12%
Don't know/Undecided/Refused 3% 3% 3% 3% 3% 3% 2%
Sampling Error (+/-) 3.7 5.0 5.4 4.2 7.0 5.8 4.9
Total 18-34 35-49 50-64 65+ <45 45+
===== ===== ===== ===== ===== ===== =====
Likely (Net) 61% 60% 60% 64% 62% 59% 63%
Very likely 17% 14% 19% 18% 19% 17% 18%
Somewhat likely 44% 45% 40% 46% 43% 42% 45%
Not likely (Net) 35% 38% 38% 34% 33% 38% 33%
Not too likely 25% 29% 26% 24% 21% 29% 22%
Not at all likely 10% 8% 12% 10% 12% 9% 12%
Don't know/Undecided/Refused 3% 3% 3% 2% 5% 3% 3%
Sampling Error (+/-) 3.7 7.9 7.6 6.4 7.0 6.1 4.4
Non- White White
coll. Coll. non- coll.
Total <$50K $50K+ grad grad. coll. grad.
===== ===== ===== ===== ===== ===== =====
Likely (Net) 61% 54% 66% 60% 64% 63% 64%
Very likely 17% 15% 19% 18% 16% 18% 15%
Somewhat likely 44% 39% 47% 42% 48% 45% 49%
Not likely (Net) 35% 41% 33% 36% 35% 34% 34%
Not too likely 25% 28% 24% 24% 27% 22% 26%
Not at all likely 10% 13% 8% 12% 7% 12% 8%
Don't know/Undecided/Refused 3% 5% 1% 4% 2% 3% 2%
Sampling Error (+/-) 3.7 6.5 4.6 4.8 5.2 5.6 5.8
Indep Con
Demo- endnt Repub Lib- Mode- serva
Total crat Other lican eral rate tive
===== ===== ===== ===== ===== ===== =====
Likely (Net) 61% 51% 66% 71% 51% 62% 71%
Very likely 17% 9% 21% 23% 10% 18% 24%
Somewhat likely 44% 42% 45% 48% 41% 44% 47%
Not likely (Net) 35% 48% 30% 26% 47% 36% 25%
Not too likely 25% 35% 22% 18% 35% 28% 15%
Not at all likely 10% 13% 9% 9% 12% 9% 10%
Don't know/Undecided/Refused 3% 1% 4% 3% 2% 2% 5%
Sampling Error (+/-) 3.7 6.5 5.7 7.3 7.4 5.8 6.5
Lean Lean Non-
Demo- Repub Reg. Gun Gun White
Total crat lican voter HH HH Evang
===== ===== ===== ===== ===== ===== =====
Likely (Net) 61% 53% 74% 63% 70% 55% 71%
Very likely 17% 10% 28% 17% 22% 14% 18%
Somewhat likely 44% 43% 46% 46% 48% 41% 53%
Not likely (Net) 35% 45% 23% 34% 27% 42% 26%
Not too likely 25% 33% 14% 24% 19% 31% 14%
Not at all likely 10% 11% 9% 10% 8% 12% 12%
Don't know/Undecided/Refused 3% 2% 2% 3% 3% 3% 3%
Sampling Error (+/-) 3.7 5.1 5.7 3.9 5.3 5.2 7.7