Embed Size (px)
Citation preview
Embarcadero Performance Center 2.5 Expert Guide: SQL Server
Copyright © 1994-2008 Embarcadero Technologies, Inc.
Embarcadero Technologies, Inc. 100 California Street, 12th FloorSan Francisco, CA 94111 U.S.A.All rights reserved.
All brands and product names are trademarks or registered trademarks of their respective owners. This software/documentation contains proprietary information of Embarcadero Technologies, Inc.; it is provided under a license agreement containing restrictions on use and disclosure and is also protected by copyright law. Reverse engineering of the software is prohibited.
If this software/documentation is delivered to a U.S. Government Agency of the Department of Defense, then it is delivered with Restricted Rights and the following legend is applicable:
Restricted Rights Legend Use, duplication, or disclosure by the Government is subject to restrictions as set forth in subparagraph (c)(1)(ii) of DFARS 252.227-7013, Rights in Technical Data and Computer Software (October 1988).
If this software/documentation is delivered to a U.S. Government Agency not within the Department of Defense, then it is delivered with Restricted Rights, as defined in FAR 552.227-14, Rights in Data-General, including Alternate III (June 1987).
Information in this document is subject to change without notice. Revisions may be issued to advise of such changes and additions. Embarcadero Technologies, Inc. does not warrant that this documentation is error-free.
>
Microsoft SQL Server Expert Guide . . . . . . . . . . . . . . . . . . . . . . . . . . . . . . . . . . . . . . . . . . . . . . . . . . . . . . . . . . . . . . . 11
Home View Statistics . . . . . . . . . . . . . . . . . . . . . . . . . . . . . . . . . . . . . . . . . . . . . . . . . . . . . . . . . . . . . . . . . . . . . . . 11
Memory Vital Signs . . . . . . . . . . . . . . . . . . . . . . . . . . . . . . . . . . . . . . . . . . . . . . . . . . . . . . . . . . . . . . . . . . . . . . 12
Buffer Cache Hit Ratio. . . . . . . . . . . . . . . . . . . . . . . . . . . . . . . . . . . . . . . . . . . . . . . . . . . . . . . . . . . . . . . . . 12
Procedure Hit Ratio . . . . . . . . . . . . . . . . . . . . . . . . . . . . . . . . . . . . . . . . . . . . . . . . . . . . . . . . . . . . . . . . . . . 12
Ad Hoc SQL Hit Ratio . . . . . . . . . . . . . . . . . . . . . . . . . . . . . . . . . . . . . . . . . . . . . . . . . . . . . . . . . . . . . . . . . 13
Log Cache Hit Ratio . . . . . . . . . . . . . . . . . . . . . . . . . . . . . . . . . . . . . . . . . . . . . . . . . . . . . . . . . . . . . . . . . . 13
I/O Vital Signs . . . . . . . . . . . . . . . . . . . . . . . . . . . . . . . . . . . . . . . . . . . . . . . . . . . . . . . . . . . . . . . . . . . . . . . . . . 14
Total Server Reads . . . . . . . . . . . . . . . . . . . . . . . . . . . . . . . . . . . . . . . . . . . . . . . . . . . . . . . . . . . . . . . . . . . 14
Total Server Writes . . . . . . . . . . . . . . . . . . . . . . . . . . . . . . . . . . . . . . . . . . . . . . . . . . . . . . . . . . . . . . . . . . . 14
Log Flushes. . . . . . . . . . . . . . . . . . . . . . . . . . . . . . . . . . . . . . . . . . . . . . . . . . . . . . . . . . . . . . . . . . . . . . . . . 14
I/O Errors. . . . . . . . . . . . . . . . . . . . . . . . . . . . . . . . . . . . . . . . . . . . . . . . . . . . . . . . . . . . . . . . . . . . . . . . . . . 15
Contention Vital Signs. . . . . . . . . . . . . . . . . . . . . . . . . . . . . . . . . . . . . . . . . . . . . . . . . . . . . . . . . . . . . . . . . . . . 15
Blocked Users . . . . . . . . . . . . . . . . . . . . . . . . . . . . . . . . . . . . . . . . . . . . . . . . . . . . . . . . . . . . . . . . . . . . . . . 15
Deadlocks . . . . . . . . . . . . . . . . . . . . . . . . . . . . . . . . . . . . . . . . . . . . . . . . . . . . . . . . . . . . . . . . . . . . . . . . . . 16
Lock Timeouts . . . . . . . . . . . . . . . . . . . . . . . . . . . . . . . . . . . . . . . . . . . . . . . . . . . . . . . . . . . . . . . . . . . . . . . 16
Latch Waits . . . . . . . . . . . . . . . . . . . . . . . . . . . . . . . . . . . . . . . . . . . . . . . . . . . . . . . . . . . . . . . . . . . . . . . . . 16
Space Vital Signs . . . . . . . . . . . . . . . . . . . . . . . . . . . . . . . . . . . . . . . . . . . . . . . . . . . . . . . . . . . . . . . . . . . . . . . 17
Databases Low on Space . . . . . . . . . . . . . . . . . . . . . . . . . . . . . . . . . . . . . . . . . . . . . . . . . . . . . . . . . . . . . . 17
Logs Low on Space. . . . . . . . . . . . . . . . . . . . . . . . . . . . . . . . . . . . . . . . . . . . . . . . . . . . . . . . . . . . . . . . . . . 18
Users Vital Signs. . . . . . . . . . . . . . . . . . . . . . . . . . . . . . . . . . . . . . . . . . . . . . . . . . . . . . . . . . . . . . . . . . . . . . . . 18
Total Connections . . . . . . . . . . . . . . . . . . . . . . . . . . . . . . . . . . . . . . . . . . . . . . . . . . . . . . . . . . . . . . . . . . . . 18
Active Connections . . . . . . . . . . . . . . . . . . . . . . . . . . . . . . . . . . . . . . . . . . . . . . . . . . . . . . . . . . . . . . . . . . . 19
Transactions . . . . . . . . . . . . . . . . . . . . . . . . . . . . . . . . . . . . . . . . . . . . . . . . . . . . . . . . . . . . . . . . . . . . . . . . 19
Current Locks . . . . . . . . . . . . . . . . . . . . . . . . . . . . . . . . . . . . . . . . . . . . . . . . . . . . . . . . . . . . . . . . . . . . . . . 19
Network Vital Signs . . . . . . . . . . . . . . . . . . . . . . . . . . . . . . . . . . . . . . . . . . . . . . . . . . . . . . . . . . . . . . . . . . . . . . 20
Packets Received . . . . . . . . . . . . . . . . . . . . . . . . . . . . . . . . . . . . . . . . . . . . . . . . . . . . . . . . . . . . . . . . . . . . 20
Packets Sent . . . . . . . . . . . . . . . . . . . . . . . . . . . . . . . . . . . . . . . . . . . . . . . . . . . . . . . . . . . . . . . . . . . . . . . . 20
Logins . . . . . . . . . . . . . . . . . . . . . . . . . . . . . . . . . . . . . . . . . . . . . . . . . . . . . . . . . . . . . . . . . . . . . . . . . . . . . 20
Logouts . . . . . . . . . . . . . . . . . . . . . . . . . . . . . . . . . . . . . . . . . . . . . . . . . . . . . . . . . . . . . . . . . . . . . . . . . . . . 20
Memory Page Statistics . . . . . . . . . . . . . . . . . . . . . . . . . . . . . . . . . . . . . . . . . . . . . . . . . . . . . . . . . . . . . . . . . . . . . 21
Buffer Cache Hit Ratio . . . . . . . . . . . . . . . . . . . . . . . . . . . . . . . . . . . . . . . . . . . . . . . . . . . . . . . . . . . . . . . . . . . 21
Procedure Plan Hit Ratio. . . . . . . . . . . . . . . . . . . . . . . . . . . . . . . . . . . . . . . . . . . . . . . . . . . . . . . . . . . . . . . . . . 22
Ad Hoc SQL Hit Ratio . . . . . . . . . . . . . . . . . . . . . . . . . . . . . . . . . . . . . . . . . . . . . . . . . . . . . . . . . . . . . . . . . . . . 22
SQL Cache . . . . . . . . . . . . . . . . . . . . . . . . . . . . . . . . . . . . . . . . . . . . . . . . . . . . . . . . . . . . . . . . . . . . . . . . . . . . 23
Memory Usage . . . . . . . . . . . . . . . . . . . . . . . . . . . . . . . . . . . . . . . . . . . . . . . . . . . . . . . . . . . . . . . . . . . . . . . . . 23
Buffer Cache . . . . . . . . . . . . . . . . . . . . . . . . . . . . . . . . . . . . . . . . . . . . . . . . . . . . . . . . . . . . . . . . . . . . . . . . . . . 24
Session Leaders - Memory . . . . . . . . . . . . . . . . . . . . . . . . . . . . . . . . . . . . . . . . . . . . . . . . . . . . . . . . . . . . . . . . 24
Cache Usage . . . . . . . . . . . . . . . . . . . . . . . . . . . . . . . . . . . . . . . . . . . . . . . . . . . . . . . . . . . . . . . . . . . . . . . . . . 25
SQL Cache Size . . . . . . . . . . . . . . . . . . . . . . . . . . . . . . . . . . . . . . . . . . . . . . . . . . . . . . . . . . . . . . . . . . . . . . . . 25
EMBARCADERO TECHNOLOGIES > EMBARCADERO PERFORMANCE CENTER 2.5 EXPERT GUIDE: SQL SERVER 3
>
SQL Cache Free . . . . . . . . . . . . . . . . . . . . . . . . . . . . . . . . . . . . . . . . . . . . . . . . . . . . . . . . . . . . . . . . . . . . . . . . 25
Memory Detail View . . . . . . . . . . . . . . . . . . . . . . . . . . . . . . . . . . . . . . . . . . . . . . . . . . . . . . . . . . . . . . . . . . . . . 26
Buffer Cache Tab . . . . . . . . . . . . . . . . . . . . . . . . . . . . . . . . . . . . . . . . . . . . . . . . . . . . . . . . . . . . . . . . . . . . 26
SQL Cache Tab. . . . . . . . . . . . . . . . . . . . . . . . . . . . . . . . . . . . . . . . . . . . . . . . . . . . . . . . . . . . . . . . . . . . . . 26
Log Cache Tab . . . . . . . . . . . . . . . . . . . . . . . . . . . . . . . . . . . . . . . . . . . . . . . . . . . . . . . . . . . . . . . . . . . 27
Leading Sessions Tab. . . . . . . . . . . . . . . . . . . . . . . . . . . . . . . . . . . . . . . . . . . . . . . . . . . . . . . . . . . . . . . . . 28
I/O Page Statistics. . . . . . . . . . . . . . . . . . . . . . . . . . . . . . . . . . . . . . . . . . . . . . . . . . . . . . . . . . . . . . . . . . . . . . . . . . 28
Page Reads . . . . . . . . . . . . . . . . . . . . . . . . . . . . . . . . . . . . . . . . . . . . . . . . . . . . . . . . . . . . . . . . . . . . . . . . . . . 29
Page Writes. . . . . . . . . . . . . . . . . . . . . . . . . . . . . . . . . . . . . . . . . . . . . . . . . . . . . . . . . . . . . . . . . . . . . . . . . . . . 30
Read Ahead Pages . . . . . . . . . . . . . . . . . . . . . . . . . . . . . . . . . . . . . . . . . . . . . . . . . . . . . . . . . . . . . . . . . . . . . . 30
Log Flushes. . . . . . . . . . . . . . . . . . . . . . . . . . . . . . . . . . . . . . . . . . . . . . . . . . . . . . . . . . . . . . . . . . . . . . . . . . . . 31
Log Cache Reads . . . . . . . . . . . . . . . . . . . . . . . . . . . . . . . . . . . . . . . . . . . . . . . . . . . . . . . . . . . . . . . . . . . . . . . 31
Checkpoint Pages . . . . . . . . . . . . . . . . . . . . . . . . . . . . . . . . . . . . . . . . . . . . . . . . . . . . . . . . . . . . . . . . . . . . . . . 31
Full Scans . . . . . . . . . . . . . . . . . . . . . . . . . . . . . . . . . . . . . . . . . . . . . . . . . . . . . . . . . . . . . . . . . . . . . . . . . . . . . 32
Range Scans. . . . . . . . . . . . . . . . . . . . . . . . . . . . . . . . . . . . . . . . . . . . . . . . . . . . . . . . . . . . . . . . . . . . . . . . . . . 33
Index Searches . . . . . . . . . . . . . . . . . . . . . . . . . . . . . . . . . . . . . . . . . . . . . . . . . . . . . . . . . . . . . . . . . . . . . . . . . 33
Probe Scans . . . . . . . . . . . . . . . . . . . . . . . . . . . . . . . . . . . . . . . . . . . . . . . . . . . . . . . . . . . . . . . . . . . . . . . . . . . 33
Worktables Created . . . . . . . . . . . . . . . . . . . . . . . . . . . . . . . . . . . . . . . . . . . . . . . . . . . . . . . . . . . . . . . . . . . . . 33
Forwarded Record Fetches. . . . . . . . . . . . . . . . . . . . . . . . . . . . . . . . . . . . . . . . . . . . . . . . . . . . . . . . . . . . . . . . 34
Server I/O Busy Rate . . . . . . . . . . . . . . . . . . . . . . . . . . . . . . . . . . . . . . . . . . . . . . . . . . . . . . . . . . . . . . . . . . . . 34
Session Leaders - I/O . . . . . . . . . . . . . . . . . . . . . . . . . . . . . . . . . . . . . . . . . . . . . . . . . . . . . . . . . . . . . . . . . . . . 34
Total I/O . . . . . . . . . . . . . . . . . . . . . . . . . . . . . . . . . . . . . . . . . . . . . . . . . . . . . . . . . . . . . . . . . . . . . . . . . . . . . . 35
I/O Error Rate . . . . . . . . . . . . . . . . . . . . . . . . . . . . . . . . . . . . . . . . . . . . . . . . . . . . . . . . . . . . . . . . . . . . . . . . . . 35
I/O Detail View . . . . . . . . . . . . . . . . . . . . . . . . . . . . . . . . . . . . . . . . . . . . . . . . . . . . . . . . . . . . . . . . . . . . . . . . . 35
System I/O Tab . . . . . . . . . . . . . . . . . . . . . . . . . . . . . . . . . . . . . . . . . . . . . . . . . . . . . . . . . . . . . . . . . . . . . . 36
Database I/O Tab . . . . . . . . . . . . . . . . . . . . . . . . . . . . . . . . . . . . . . . . . . . . . . . . . . . . . . . . . . . . . . . . . . . . . . . 36
User I/O Tab . . . . . . . . . . . . . . . . . . . . . . . . . . . . . . . . . . . . . . . . . . . . . . . . . . . . . . . . . . . . . . . . . . . . . . . . 37
File I/O Tab . . . . . . . . . . . . . . . . . . . . . . . . . . . . . . . . . . . . . . . . . . . . . . . . . . . . . . . . . . . . . . . . . . . . . . . . . 38
Leading Sessions Tab. . . . . . . . . . . . . . . . . . . . . . . . . . . . . . . . . . . . . . . . . . . . . . . . . . . . . . . . . . . . . . . . . 39
Space Page Statistics . . . . . . . . . . . . . . . . . . . . . . . . . . . . . . . . . . . . . . . . . . . . . . . . . . . . . . . . . . . . . . . . . . . . . . . 39
Disk Free Space . . . . . . . . . . . . . . . . . . . . . . . . . . . . . . . . . . . . . . . . . . . . . . . . . . . . . . . . . . . . . . . . . . . . . . . . 40
Database Overview. . . . . . . . . . . . . . . . . . . . . . . . . . . . . . . . . . . . . . . . . . . . . . . . . . . . . . . . . . . . . . . . . . . . . . 40
Log Overview . . . . . . . . . . . . . . . . . . . . . . . . . . . . . . . . . . . . . . . . . . . . . . . . . . . . . . . . . . . . . . . . . . . . . . . . . . 41
Space Detail View . . . . . . . . . . . . . . . . . . . . . . . . . . . . . . . . . . . . . . . . . . . . . . . . . . . . . . . . . . . . . . . . . . . . . . . 42
File Groups/Files Tab . . . . . . . . . . . . . . . . . . . . . . . . . . . . . . . . . . . . . . . . . . . . . . . . . . . . . . . . . . . . . . . . . . . . 42
Virtual Log Files Tab . . . . . . . . . . . . . . . . . . . . . . . . . . . . . . . . . . . . . . . . . . . . . . . . . . . . . . . . . . . . . . . . . . 43
Tables Tab . . . . . . . . . . . . . . . . . . . . . . . . . . . . . . . . . . . . . . . . . . . . . . . . . . . . . . . . . . . . . . . . . . . . . . . . . 43
Indexes Tab. . . . . . . . . . . . . . . . . . . . . . . . . . . . . . . . . . . . . . . . . . . . . . . . . . . . . . . . . . . . . . . . . . . . . . . . . 44
Fragmentation Tab . . . . . . . . . . . . . . . . . . . . . . . . . . . . . . . . . . . . . . . . . . . . . . . . . . . . . . . . . . . . . . . . . . . 44
Disk Space Tab . . . . . . . . . . . . . . . . . . . . . . . . . . . . . . . . . . . . . . . . . . . . . . . . . . . . . . . . . . . . . . . . . . . . . . 45
EMBARCADERO TECHNOLOGIES > EMBARCADERO PERFORMANCE CENTER 2.5 EXPERT GUIDE: SQL SERVER 4
>
Users Page Statistics . . . . . . . . . . . . . . . . . . . . . . . . . . . . . . . . . . . . . . . . . . . . . . . . . . . . . . . . . . . . . . . . . . . . . . . 46
Total Connections . . . . . . . . . . . . . . . . . . . . . . . . . . . . . . . . . . . . . . . . . . . . . . . . . . . . . . . . . . . . . . . . . . . . . . . 47
Active Transactions. . . . . . . . . . . . . . . . . . . . . . . . . . . . . . . . . . . . . . . . . . . . . . . . . . . . . . . . . . . . . . . . . . . . . . 48
T-SQLBatches. . . . . . . . . . . . . . . . . . . . . . . . . . . . . . . . . . . . . . . . . . . . . . . . . . . . . . . . . . . . . . . . . . . . . . . . . . 48
Active Connections . . . . . . . . . . . . . . . . . . . . . . . . . . . . . . . . . . . . . . . . . . . . . . . . . . . . . . . . . . . . . . . . . . . . . . 48
Inactive Connections. . . . . . . . . . . . . . . . . . . . . . . . . . . . . . . . . . . . . . . . . . . . . . . . . . . . . . . . . . . . . . . . . . . . . 48
System Connections . . . . . . . . . . . . . . . . . . . . . . . . . . . . . . . . . . . . . . . . . . . . . . . . . . . . . . . . . . . . . . . . . . . . . 48
SQL Compilations . . . . . . . . . . . . . . . . . . . . . . . . . . . . . . . . . . . . . . . . . . . . . . . . . . . . . . . . . . . . . . . . . . . . . . . 49
SQL Re-Compilations . . . . . . . . . . . . . . . . . . . . . . . . . . . . . . . . . . . . . . . . . . . . . . . . . . . . . . . . . . . . . . . . . . . . 49
Auto-Param Attempts . . . . . . . . . . . . . . . . . . . . . . . . . . . . . . . . . . . . . . . . . . . . . . . . . . . . . . . . . . . . . . . . . . . . 50
Failed Auto-Param Attempts . . . . . . . . . . . . . . . . . . . . . . . . . . . . . . . . . . . . . . . . . . . . . . . . . . . . . . . . . . . . . . . 50
Users Blocked . . . . . . . . . . . . . . . . . . . . . . . . . . . . . . . . . . . . . . . . . . . . . . . . . . . . . . . . . . . . . . . . . . . . . . . . . . 51
Session Leaders - Memory . . . . . . . . . . . . . . . . . . . . . . . . . . . . . . . . . . . . . . . . . . . . . . . . . . . . . . . . . . . . . . . . 51
Session Leaders - I/O . . . . . . . . . . . . . . . . . . . . . . . . . . . . . . . . . . . . . . . . . . . . . . . . . . . . . . . . . . . . . . . . . . . . 52
Session Leaders - CPU. . . . . . . . . . . . . . . . . . . . . . . . . . . . . . . . . . . . . . . . . . . . . . . . . . . . . . . . . . . . . . . . . . . 52
Users Detail View . . . . . . . . . . . . . . . . . . . . . . . . . . . . . . . . . . . . . . . . . . . . . . . . . . . . . . . . . . . . . . . . . . . . . . . 52
Processes Tab . . . . . . . . . . . . . . . . . . . . . . . . . . . . . . . . . . . . . . . . . . . . . . . . . . . . . . . . . . . . . . . . . . . . . . 53
All Locks Tab. . . . . . . . . . . . . . . . . . . . . . . . . . . . . . . . . . . . . . . . . . . . . . . . . . . . . . . . . . . . . . . . . . . . . . . . 54
Blocking Locks Tab . . . . . . . . . . . . . . . . . . . . . . . . . . . . . . . . . . . . . . . . . . . . . . . . . . . . . . . . . . . . . . . . . . . 54
Contention Page Statistics . . . . . . . . . . . . . . . . . . . . . . . . . . . . . . . . . . . . . . . . . . . . . . . . . . . . . . . . . . . . . . . . . . . 55
Blocked Users . . . . . . . . . . . . . . . . . . . . . . . . . . . . . . . . . . . . . . . . . . . . . . . . . . . . . . . . . . . . . . . . . . . . . . . . . . 56
Page Deadlocks . . . . . . . . . . . . . . . . . . . . . . . . . . . . . . . . . . . . . . . . . . . . . . . . . . . . . . . . . . . . . . . . . . . . . . . . 56
Number of Deadlocks . . . . . . . . . . . . . . . . . . . . . . . . . . . . . . . . . . . . . . . . . . . . . . . . . . . . . . . . . . . . . . . . . . . . 57
Latch Waits . . . . . . . . . . . . . . . . . . . . . . . . . . . . . . . . . . . . . . . . . . . . . . . . . . . . . . . . . . . . . . . . . . . . . . . . . . . . 57
Log Flush Waits . . . . . . . . . . . . . . . . . . . . . . . . . . . . . . . . . . . . . . . . . . . . . . . . . . . . . . . . . . . . . . . . . . . . . . . . 58
Table Lock Escalations . . . . . . . . . . . . . . . . . . . . . . . . . . . . . . . . . . . . . . . . . . . . . . . . . . . . . . . . . . . . . . . . . . . 58
Lock Overview. . . . . . . . . . . . . . . . . . . . . . . . . . . . . . . . . . . . . . . . . . . . . . . . . . . . . . . . . . . . . . . . . . . . . . . . . . 58
CPU Busy . . . . . . . . . . . . . . . . . . . . . . . . . . . . . . . . . . . . . . . . . . . . . . . . . . . . . . . . . . . . . . . . . . . . . . . . . . . . . 59
I/O Busy . . . . . . . . . . . . . . . . . . . . . . . . . . . . . . . . . . . . . . . . . . . . . . . . . . . . . . . . . . . . . . . . . . . . . . . . . . . . . . 59
Server Idle. . . . . . . . . . . . . . . . . . . . . . . . . . . . . . . . . . . . . . . . . . . . . . . . . . . . . . . . . . . . . . . . . . . . . . . . . . . . . 59
Contention Detail View . . . . . . . . . . . . . . . . . . . . . . . . . . . . . . . . . . . . . . . . . . . . . . . . . . . . . . . . . . . . . . . . . . . 59
Locks Tab . . . . . . . . . . . . . . . . . . . . . . . . . . . . . . . . . . . . . . . . . . . . . . . . . . . . . . . . . . . . . . . . . . . . . . . . . . 60
Blocking Locks Tab . . . . . . . . . . . . . . . . . . . . . . . . . . . . . . . . . . . . . . . . . . . . . . . . . . . . . . . . . . . . . . . . . . . 61
Waits Tab . . . . . . . . . . . . . . . . . . . . . . . . . . . . . . . . . . . . . . . . . . . . . . . . . . . . . . . . . . . . . . . . . . . . . . . . . . 63
Database Page Statistics . . . . . . . . . . . . . . . . . . . . . . . . . . . . . . . . . . . . . . . . . . . . . . . . . . . . . . . . . . . . . . . . . . . . 63
Errors in Current Error Log . . . . . . . . . . . . . . . . . . . . . . . . . . . . . . . . . . . . . . . . . . . . . . . . . . . . . . . . . . . . . . . . . . . 64
Databases . . . . . . . . . . . . . . . . . . . . . . . . . . . . . . . . . . . . . . . . . . . . . . . . . . . . . . . . . . . . . . . . . . . . . . . . . . . . . 64
Files. . . . . . . . . . . . . . . . . . . . . . . . . . . . . . . . . . . . . . . . . . . . . . . . . . . . . . . . . . . . . . . . . . . . . . . . . . . . . . . . . . 64
File Groups . . . . . . . . . . . . . . . . . . . . . . . . . . . . . . . . . . . . . . . . . . . . . . . . . . . . . . . . . . . . . . . . . . . . . . . . . . . . 65
Suspect Databases . . . . . . . . . . . . . . . . . . . . . . . . . . . . . . . . . . . . . . . . . . . . . . . . . . . . . . . . . . . . . . . . . . . . . . 65
EMBARCADERO TECHNOLOGIES > EMBARCADERO PERFORMANCE CENTER 2.5 EXPERT GUIDE: SQL SERVER 5
>
Offline Databases . . . . . . . . . . . . . . . . . . . . . . . . . . . . . . . . . . . . . . . . . . . . . . . . . . . . . . . . . . . . . . . . . . . . . . . 66
Databases Needing Backup . . . . . . . . . . . . . . . . . . . . . . . . . . . . . . . . . . . . . . . . . . . . . . . . . . . . . . . . . . . . . . . 66
Databases Without Auto-Growth. . . . . . . . . . . . . . . . . . . . . . . . . . . . . . . . . . . . . . . . . . . . . . . . . . . . . . . . . . . . 66
Logs Without Auto-Growth . . . . . . . . . . . . . . . . . . . . . . . . . . . . . . . . . . . . . . . . . . . . . . . . . . . . . . . . . . . . . . . . 67
Databases Without Auto-Update Statistics . . . . . . . . . . . . . . . . . . . . . . . . . . . . . . . . . . . . . . . . . . . . . . . . . . . . 67
Databases Without Auto-Create Stats . . . . . . . . . . . . . . . . . . . . . . . . . . . . . . . . . . . . . . . . . . . . . . . . . . . . . . . 68
Database Summary . . . . . . . . . . . . . . . . . . . . . . . . . . . . . . . . . . . . . . . . . . . . . . . . . . . . . . . . . . . . . . . . . . . . . 68
Database Detail View . . . . . . . . . . . . . . . . . . . . . . . . . . . . . . . . . . . . . . . . . . . . . . . . . . . . . . . . . . . . . . . . . . . . 69
Overview Tab . . . . . . . . . . . . . . . . . . . . . . . . . . . . . . . . . . . . . . . . . . . . . . . . . . . . . . . . . . . . . . . . . . . . . . . 69
SQL Agent Tab . . . . . . . . . . . . . . . . . . . . . . . . . . . . . . . . . . . . . . . . . . . . . . . . . . . . . . . . . . . . . . . . . . . . . . 70
SQL Server Job Summary. . . . . . . . . . . . . . . . . . . . . . . . . . . . . . . . . . . . . . . . . . . . . . . . . . . . . . . . . . . 70
SQL Server Alert Summary . . . . . . . . . . . . . . . . . . . . . . . . . . . . . . . . . . . . . . . . . . . . . . . . . . . . . . . . . . 71
Backups History Tab . . . . . . . . . . . . . . . . . . . . . . . . . . . . . . . . . . . . . . . . . . . . . . . . . . . . . . . . . . . . . . . . . . 71
Backup Detail . . . . . . . . . . . . . . . . . . . . . . . . . . . . . . . . . . . . . . . . . . . . . . . . . . . . . . . . . . . . . . . . . . . . 71
Replication Tab . . . . . . . . . . . . . . . . . . . . . . . . . . . . . . . . . . . . . . . . . . . . . . . . . . . . . . . . . . . . . . . . . . . . . . 71
Index Details Tab . . . . . . . . . . . . . . . . . . . . . . . . . . . . . . . . . . . . . . . . . . . . . . . . . . . . . . . . . . . . . . . . . . . . 72
Table Details Tab . . . . . . . . . . . . . . . . . . . . . . . . . . . . . . . . . . . . . . . . . . . . . . . . . . . . . . . . . . . . . . . . . . . . 73
Network Statistics . . . . . . . . . . . . . . . . . . . . . . . . . . . . . . . . . . . . . . . . . . . . . . . . . . . . . . . . . . . . . . . . . . . . . . . . . . 74
Packets Received . . . . . . . . . . . . . . . . . . . . . . . . . . . . . . . . . . . . . . . . . . . . . . . . . . . . . . . . . . . . . . . . . . . . . . . 75
Packets Sent . . . . . . . . . . . . . . . . . . . . . . . . . . . . . . . . . . . . . . . . . . . . . . . . . . . . . . . . . . . . . . . . . . . . . . . . . . . 75
Network Reads . . . . . . . . . . . . . . . . . . . . . . . . . . . . . . . . . . . . . . . . . . . . . . . . . . . . . . . . . . . . . . . . . . . . . . . . . 75
Network Writes . . . . . . . . . . . . . . . . . . . . . . . . . . . . . . . . . . . . . . . . . . . . . . . . . . . . . . . . . . . . . . . . . . . . . . . . . 75
Network Bytes Read . . . . . . . . . . . . . . . . . . . . . . . . . . . . . . . . . . . . . . . . . . . . . . . . . . . . . . . . . . . . . . . . . . . . . 76
Network Bytes Written. . . . . . . . . . . . . . . . . . . . . . . . . . . . . . . . . . . . . . . . . . . . . . . . . . . . . . . . . . . . . . . . . . . . 76
Packet Errors . . . . . . . . . . . . . . . . . . . . . . . . . . . . . . . . . . . . . . . . . . . . . . . . . . . . . . . . . . . . . . . . . . . . . . . . . . 76
Total Traffic . . . . . . . . . . . . . . . . . . . . . . . . . . . . . . . . . . . . . . . . . . . . . . . . . . . . . . . . . . . . . . . . . . . . . . . . . . . . 76
Network I/O Wait Requests. . . . . . . . . . . . . . . . . . . . . . . . . . . . . . . . . . . . . . . . . . . . . . . . . . . . . . . . . . . . . . . . 76
Network I/O Wait Time . . . . . . . . . . . . . . . . . . . . . . . . . . . . . . . . . . . . . . . . . . . . . . . . . . . . . . . . . . . . . . . . . . . 77
OS Page Statistics . . . . . . . . . . . . . . . . . . . . . . . . . . . . . . . . . . . . . . . . . . . . . . . . . . . . . . . . . . . . . . . . . . . . . . . . . 77
Summary Tab . . . . . . . . . . . . . . . . . . . . . . . . . . . . . . . . . . . . . . . . . . . . . . . . . . . . . . . . . . . . . . . . . . . . . . . . . . 77
Processor Time . . . . . . . . . . . . . . . . . . . . . . . . . . . . . . . . . . . . . . . . . . . . . . . . . . . . . . . . . . . . . . . . . . . . . . . . . 78
Processor Speed. . . . . . . . . . . . . . . . . . . . . . . . . . . . . . . . . . . . . . . . . . . . . . . . . . . . . . . . . . . . . . . . . . . . . . . . 78
Processor . . . . . . . . . . . . . . . . . . . . . . . . . . . . . . . . . . . . . . . . . . . . . . . . . . . . . . . . . . . . . . . . . . . . . . . . . . . . . 79
Disk Time . . . . . . . . . . . . . . . . . . . . . . . . . . . . . . . . . . . . . . . . . . . . . . . . . . . . . . . . . . . . . . . . . . . . . . . . . . . . . 79
Load Average . . . . . . . . . . . . . . . . . . . . . . . . . . . . . . . . . . . . . . . . . . . . . . . . . . . . . . . . . . . . . . . . . . . . . . . . . . 79
Paged Memory Used . . . . . . . . . . . . . . . . . . . . . . . . . . . . . . . . . . . . . . . . . . . . . . . . . . . . . . . . . . . . . . . . . . . . 79
Number of Processors . . . . . . . . . . . . . . . . . . . . . . . . . . . . . . . . . . . . . . . . . . . . . . . . . . . . . . . . . . . . . . . . . . . 79
Swap Memory Used . . . . . . . . . . . . . . . . . . . . . . . . . . . . . . . . . . . . . . . . . . . . . . . . . . . . . . . . . . . . . . . . . . . . . 79
Average Disk Queue. . . . . . . . . . . . . . . . . . . . . . . . . . . . . . . . . . . . . . . . . . . . . . . . . . . . . . . . . . . . . . . . . . . . . 80
Page Faults/Sec . . . . . . . . . . . . . . . . . . . . . . . . . . . . . . . . . . . . . . . . . . . . . . . . . . . . . . . . . . . . . . . . . . . . . . . . 80
EMBARCADERO TECHNOLOGIES > EMBARCADERO PERFORMANCE CENTER 2.5 EXPERT GUIDE: SQL SERVER 6
>
Processor Queue . . . . . . . . . . . . . . . . . . . . . . . . . . . . . . . . . . . . . . . . . . . . . . . . . . . . . . . . . . . . . . . . . . . . . . . 80
Network Output Queue/Network Queue . . . . . . . . . . . . . . . . . . . . . . . . . . . . . . . . . . . . . . . . . . . . . . . . . . . . . . 81
Available Physical Memory . . . . . . . . . . . . . . . . . . . . . . . . . . . . . . . . . . . . . . . . . . . . . . . . . . . . . . . . . . . . . . . . 81
Available Paged Memory . . . . . . . . . . . . . . . . . . . . . . . . . . . . . . . . . . . . . . . . . . . . . . . . . . . . . . . . . . . . . . . . . 81
Available Swap Memory . . . . . . . . . . . . . . . . . . . . . . . . . . . . . . . . . . . . . . . . . . . . . . . . . . . . . . . . . . . . . . . . . . 82
Total Physical Memory . . . . . . . . . . . . . . . . . . . . . . . . . . . . . . . . . . . . . . . . . . . . . . . . . . . . . . . . . . . . . . . . . . . 82
Total Paged Memory/Total Swap Memory . . . . . . . . . . . . . . . . . . . . . . . . . . . . . . . . . . . . . . . . . . . . . . . . . . . . 82
Used Disk Space. . . . . . . . . . . . . . . . . . . . . . . . . . . . . . . . . . . . . . . . . . . . . . . . . . . . . . . . . . . . . . . . . . . . . . . . 82
Total Disk Space . . . . . . . . . . . . . . . . . . . . . . . . . . . . . . . . . . . . . . . . . . . . . . . . . . . . . . . . . . . . . . . . . . . . . . . . 83
Free Disk Space . . . . . . . . . . . . . . . . . . . . . . . . . . . . . . . . . . . . . . . . . . . . . . . . . . . . . . . . . . . . . . . . . . . . . . . . 83
Top Memory Process . . . . . . . . . . . . . . . . . . . . . . . . . . . . . . . . . . . . . . . . . . . . . . . . . . . . . . . . . . . . . . . . . 83
Processes Overview . . . . . . . . . . . . . . . . . . . . . . . . . . . . . . . . . . . . . . . . . . . . . . . . . . . . . . . . . . . . . . . . . . . . . 83
Top CPU Process . . . . . . . . . . . . . . . . . . . . . . . . . . . . . . . . . . . . . . . . . . . . . . . . . . . . . . . . . . . . . . . . . . . . 84
Top I/O Process . . . . . . . . . . . . . . . . . . . . . . . . . . . . . . . . . . . . . . . . . . . . . . . . . . . . . . . . . . . . . . . . . . . . . 84
Number of Logins . . . . . . . . . . . . . . . . . . . . . . . . . . . . . . . . . . . . . . . . . . . . . . . . . . . . . . . . . . . . . . . . . . . . . . . 84
Number of Processes . . . . . . . . . . . . . . . . . . . . . . . . . . . . . . . . . . . . . . . . . . . . . . . . . . . . . . . . . . . . . . . . . . . . 84
CPU Tab . . . . . . . . . . . . . . . . . . . . . . . . . . . . . . . . . . . . . . . . . . . . . . . . . . . . . . . . . . . . . . . . . . . . . . . . . . . 84
CPU Utilization . . . . . . . . . . . . . . . . . . . . . . . . . . . . . . . . . . . . . . . . . . . . . . . . . . . . . . . . . . . . . . . . . . . 84
Processor Queue Length. . . . . . . . . . . . . . . . . . . . . . . . . . . . . . . . . . . . . . . . . . . . . . . . . . . . . . . . . . . . 86
Processes Tab . . . . . . . . . . . . . . . . . . . . . . . . . . . . . . . . . . . . . . . . . . . . . . . . . . . . . . . . . . . . . . . . . . . . . . 86
I/O Tab . . . . . . . . . . . . . . . . . . . . . . . . . . . . . . . . . . . . . . . . . . . . . . . . . . . . . . . . . . . . . . . . . . . . . . . . . . . . 87
Memory Tab . . . . . . . . . . . . . . . . . . . . . . . . . . . . . . . . . . . . . . . . . . . . . . . . . . . . . . . . . . . . . . . . . . . . . . . . 87
Paging Activity . . . . . . . . . . . . . . . . . . . . . . . . . . . . . . . . . . . . . . . . . . . . . . . . . . . . . . . . . . . . . . . . . . . . 88
Cache Efficiency . . . . . . . . . . . . . . . . . . . . . . . . . . . . . . . . . . . . . . . . . . . . . . . . . . . . . . . . . . . . . . . . . . 90
Space Tab . . . . . . . . . . . . . . . . . . . . . . . . . . . . . . . . . . . . . . . . . . . . . . . . . . . . . . . . . . . . . . . . . . . . . . . . . . 91
Disk Space Free . . . . . . . . . . . . . . . . . . . . . . . . . . . . . . . . . . . . . . . . . . . . . . . . . . . . . . . . . . . . . . . . . . 91
Disk Space Detail . . . . . . . . . . . . . . . . . . . . . . . . . . . . . . . . . . . . . . . . . . . . . . . . . . . . . . . . . . . . . . . . . 91
Network Tab . . . . . . . . . . . . . . . . . . . . . . . . . . . . . . . . . . . . . . . . . . . . . . . . . . . . . . . . . . . . . . . . . . . . . . . . 91
Other Views and Statistics . . . . . . . . . . . . . . . . . . . . . . . . . . . . . . . . . . . . . . . . . . . . . . . . . . . . . . . . . . . . . . . . . . . . . . 93
Archive View . . . . . . . . . . . . . . . . . . . . . . . . . . . . . . . . . . . . . . . . . . . . . . . . . . . . . . . . . . . . . . . . . . . . . . . . . . . . . . 93
Health Index View . . . . . . . . . . . . . . . . . . . . . . . . . . . . . . . . . . . . . . . . . . . . . . . . . . . . . . . . . . . . . . . . . . . . . . . . . 94
Hot Objects . . . . . . . . . . . . . . . . . . . . . . . . . . . . . . . . . . . . . . . . . . . . . . . . . . . . . . . . . . . . . . . . . . . . . . . . . . . . . . . 94
Hot Tables. . . . . . . . . . . . . . . . . . . . . . . . . . . . . . . . . . . . . . . . . . . . . . . . . . . . . . . . . . . . . . . . . . . . . . . . . . . . . 94
Hot Code . . . . . . . . . . . . . . . . . . . . . . . . . . . . . . . . . . . . . . . . . . . . . . . . . . . . . . . . . . . . . . . . . . . . . . . . . . . . . . 95
Lock View . . . . . . . . . . . . . . . . . . . . . . . . . . . . . . . . . . . . . . . . . . . . . . . . . . . . . . . . . . . . . . . . . . . . . . . . . . . . . . . . 95
All Locks Tab. . . . . . . . . . . . . . . . . . . . . . . . . . . . . . . . . . . . . . . . . . . . . . . . . . . . . . . . . . . . . . . . . . . . . . . . . . . 96
All Locks Tab for Oracle . . . . . . . . . . . . . . . . . . . . . . . . . . . . . . . . . . . . . . . . . . . . . . . . . . . . . . . . . . . . . . . 96
All Locks Tab for SQL Server . . . . . . . . . . . . . . . . . . . . . . . . . . . . . . . . . . . . . . . . . . . . . . . . . . . . . . . . . . . 96
All Locks Tab for Sybase. . . . . . . . . . . . . . . . . . . . . . . . . . . . . . . . . . . . . . . . . . . . . . . . . . . . . . . . . . . . . . . 97
All User Locks Tab . . . . . . . . . . . . . . . . . . . . . . . . . . . . . . . . . . . . . . . . . . . . . . . . . . . . . . . . . . . . . . . . . . . . . . 98
EMBARCADERO TECHNOLOGIES > EMBARCADERO PERFORMANCE CENTER 2.5 EXPERT GUIDE: SQL SERVER 7
>
Blocking Locks Tab . . . . . . . . . . . . . . . . . . . . . . . . . . . . . . . . . . . . . . . . . . . . . . . . . . . . . . . . . . . . . . . . . . . . . . 99
Blocking Locks Tab for Oracle . . . . . . . . . . . . . . . . . . . . . . . . . . . . . . . . . . . . . . . . . . . . . . . . . . . . . . . . . . 99
Blocking Locks Tab for SQL Server . . . . . . . . . . . . . . . . . . . . . . . . . . . . . . . . . . . . . . . . . . . . . . . . . . . . . 100
Blocking Locks Tab for Sybase . . . . . . . . . . . . . . . . . . . . . . . . . . . . . . . . . . . . . . . . . . . . . . . . . . . . . . . . . 101
Locks View for DB2. . . . . . . . . . . . . . . . . . . . . . . . . . . . . . . . . . . . . . . . . . . . . . . . . . . . . . . . . . . . . . . . . . . . . 102
Applications . . . . . . . . . . . . . . . . . . . . . . . . . . . . . . . . . . . . . . . . . . . . . . . . . . . . . . . . . . . . . . . . . . . . . . . . 103
Locks Held Tab . . . . . . . . . . . . . . . . . . . . . . . . . . . . . . . . . . . . . . . . . . . . . . . . . . . . . . . . . . . . . . . . . . . . . 103
Locks Waiting Tab. . . . . . . . . . . . . . . . . . . . . . . . . . . . . . . . . . . . . . . . . . . . . . . . . . . . . . . . . . . . . . . . . . . 103
Unit of Work Tab . . . . . . . . . . . . . . . . . . . . . . . . . . . . . . . . . . . . . . . . . . . . . . . . . . . . . . . . . . . . . . . . . . . . 104
Operating System View . . . . . . . . . . . . . . . . . . . . . . . . . . . . . . . . . . . . . . . . . . . . . . . . . . . . . . . . . . . . . . . . . . . . 104
OS Page Statistics . . . . . . . . . . . . . . . . . . . . . . . . . . . . . . . . . . . . . . . . . . . . . . . . . . . . . . . . . . . . . . . . . . . . . . . . 105
Summary Tab . . . . . . . . . . . . . . . . . . . . . . . . . . . . . . . . . . . . . . . . . . . . . . . . . . . . . . . . . . . . . . . . . . . . . . . . . 106
Processor Time . . . . . . . . . . . . . . . . . . . . . . . . . . . . . . . . . . . . . . . . . . . . . . . . . . . . . . . . . . . . . . . . . . . . . . . . 106
Processor Speed. . . . . . . . . . . . . . . . . . . . . . . . . . . . . . . . . . . . . . . . . . . . . . . . . . . . . . . . . . . . . . . . . . . . . . . 107
Processor . . . . . . . . . . . . . . . . . . . . . . . . . . . . . . . . . . . . . . . . . . . . . . . . . . . . . . . . . . . . . . . . . . . . . . . . . . . . 107
Disk Time . . . . . . . . . . . . . . . . . . . . . . . . . . . . . . . . . . . . . . . . . . . . . . . . . . . . . . . . . . . . . . . . . . . . . . . . . . . . 107
Load Average . . . . . . . . . . . . . . . . . . . . . . . . . . . . . . . . . . . . . . . . . . . . . . . . . . . . . . . . . . . . . . . . . . . . . . . . . 107
Paged Memory Used . . . . . . . . . . . . . . . . . . . . . . . . . . . . . . . . . . . . . . . . . . . . . . . . . . . . . . . . . . . . . . . . . . . 107
Number of Processors . . . . . . . . . . . . . . . . . . . . . . . . . . . . . . . . . . . . . . . . . . . . . . . . . . . . . . . . . . . . . . . . . . 108
Swap Memory Used . . . . . . . . . . . . . . . . . . . . . . . . . . . . . . . . . . . . . . . . . . . . . . . . . . . . . . . . . . . . . . . . . . . . 108
Average Disk Queue. . . . . . . . . . . . . . . . . . . . . . . . . . . . . . . . . . . . . . . . . . . . . . . . . . . . . . . . . . . . . . . . . . . . 108
Page Faults/Sec . . . . . . . . . . . . . . . . . . . . . . . . . . . . . . . . . . . . . . . . . . . . . . . . . . . . . . . . . . . . . . . . . . . . . . . 108
Processor Queue . . . . . . . . . . . . . . . . . . . . . . . . . . . . . . . . . . . . . . . . . . . . . . . . . . . . . . . . . . . . . . . . . . . . . . 109
Network Output Queue/Network Queue . . . . . . . . . . . . . . . . . . . . . . . . . . . . . . . . . . . . . . . . . . . . . . . . . . . . . 109
Available Physical Memory . . . . . . . . . . . . . . . . . . . . . . . . . . . . . . . . . . . . . . . . . . . . . . . . . . . . . . . . . . . . . . . 109
Available Paged Memory . . . . . . . . . . . . . . . . . . . . . . . . . . . . . . . . . . . . . . . . . . . . . . . . . . . . . . . . . . . . . . . . 110
Available Swap Memory . . . . . . . . . . . . . . . . . . . . . . . . . . . . . . . . . . . . . . . . . . . . . . . . . . . . . . . . . . . . . . . . . 110
Total Physical Memory . . . . . . . . . . . . . . . . . . . . . . . . . . . . . . . . . . . . . . . . . . . . . . . . . . . . . . . . . . . . . . . . . . 110
Total Paged Memory/Total Swap Memory . . . . . . . . . . . . . . . . . . . . . . . . . . . . . . . . . . . . . . . . . . . . . . . . . . . 110
Used Disk Space. . . . . . . . . . . . . . . . . . . . . . . . . . . . . . . . . . . . . . . . . . . . . . . . . . . . . . . . . . . . . . . . . . . . . . . 111
Total Disk Space . . . . . . . . . . . . . . . . . . . . . . . . . . . . . . . . . . . . . . . . . . . . . . . . . . . . . . . . . . . . . . . . . . . . . . . 111
Free Disk Space . . . . . . . . . . . . . . . . . . . . . . . . . . . . . . . . . . . . . . . . . . . . . . . . . . . . . . . . . . . . . . . . . . . . . . . 111
Top Memory Process . . . . . . . . . . . . . . . . . . . . . . . . . . . . . . . . . . . . . . . . . . . . . . . . . . . . . . . . . . . . . . . . 111
Processes Overview . . . . . . . . . . . . . . . . . . . . . . . . . . . . . . . . . . . . . . . . . . . . . . . . . . . . . . . . . . . . . . . . . . . . 112
Top CPU Process . . . . . . . . . . . . . . . . . . . . . . . . . . . . . . . . . . . . . . . . . . . . . . . . . . . . . . . . . . . . . . . . . . . 112
Top I/O Process . . . . . . . . . . . . . . . . . . . . . . . . . . . . . . . . . . . . . . . . . . . . . . . . . . . . . . . . . . . . . . . . . . . . 112
Number of Logins . . . . . . . . . . . . . . . . . . . . . . . . . . . . . . . . . . . . . . . . . . . . . . . . . . . . . . . . . . . . . . . . . . . . . . 112
Number of Processes . . . . . . . . . . . . . . . . . . . . . . . . . . . . . . . . . . . . . . . . . . . . . . . . . . . . . . . . . . . . . . . . . . . 112
CPU Tab . . . . . . . . . . . . . . . . . . . . . . . . . . . . . . . . . . . . . . . . . . . . . . . . . . . . . . . . . . . . . . . . . . . . . . . . . . 112
CPU Utilization . . . . . . . . . . . . . . . . . . . . . . . . . . . . . . . . . . . . . . . . . . . . . . . . . . . . . . . . . . . . . . . . . . 113
EMBARCADERO TECHNOLOGIES > EMBARCADERO PERFORMANCE CENTER 2.5 EXPERT GUIDE: SQL SERVER 8
>
Processor Queue Length. . . . . . . . . . . . . . . . . . . . . . . . . . . . . . . . . . . . . . . . . . . . . . . . . . . . . . . . . . . 114
Processes Tab . . . . . . . . . . . . . . . . . . . . . . . . . . . . . . . . . . . . . . . . . . . . . . . . . . . . . . . . . . . . . . . . . . . . . 114
I/O Tab . . . . . . . . . . . . . . . . . . . . . . . . . . . . . . . . . . . . . . . . . . . . . . . . . . . . . . . . . . . . . . . . . . . . . . . . . . . 115
Memory Tab . . . . . . . . . . . . . . . . . . . . . . . . . . . . . . . . . . . . . . . . . . . . . . . . . . . . . . . . . . . . . . . . . . . . . . . 116
Paging Activity . . . . . . . . . . . . . . . . . . . . . . . . . . . . . . . . . . . . . . . . . . . . . . . . . . . . . . . . . . . . . . . . . . . 116
Cache Efficiency . . . . . . . . . . . . . . . . . . . . . . . . . . . . . . . . . . . . . . . . . . . . . . . . . . . . . . . . . . . . . . . . . 118
Space Tab . . . . . . . . . . . . . . . . . . . . . . . . . . . . . . . . . . . . . . . . . . . . . . . . . . . . . . . . . . . . . . . . . . . . . . . . . 119
Disk Space Free . . . . . . . . . . . . . . . . . . . . . . . . . . . . . . . . . . . . . . . . . . . . . . . . . . . . . . . . . . . . . . . . . 119
Disk Space Detail . . . . . . . . . . . . . . . . . . . . . . . . . . . . . . . . . . . . . . . . . . . . . . . . . . . . . . . . . . . . . . . . 119
Network Tab . . . . . . . . . . . . . . . . . . . . . . . . . . . . . . . . . . . . . . . . . . . . . . . . . . . . . . . . . . . . . . . . . . . . . . . 120
Session Detail View . . . . . . . . . . . . . . . . . . . . . . . . . . . . . . . . . . . . . . . . . . . . . . . . . . . . . . . . . . . . . . . . . . . . . . . 120
Oracle Session Detail View. . . . . . . . . . . . . . . . . . . . . . . . . . . . . . . . . . . . . . . . . . . . . . . . . . . . . . . . . . . . . . . 120
Session Memory Tab for Oracle . . . . . . . . . . . . . . . . . . . . . . . . . . . . . . . . . . . . . . . . . . . . . . . . . . . . . . . . 121
Session I/O Tab for Oracle . . . . . . . . . . . . . . . . . . . . . . . . . . . . . . . . . . . . . . . . . . . . . . . . . . . . . . . . . . . . 121
Session Contention Tab for Oracle . . . . . . . . . . . . . . . . . . . . . . . . . . . . . . . . . . . . . . . . . . . . . . . . . . . . . . 121
Session Objects Tab for Oracle . . . . . . . . . . . . . . . . . . . . . . . . . . . . . . . . . . . . . . . . . . . . . . . . . . . . . . . . 122
Session Network Tab for Oracle . . . . . . . . . . . . . . . . . . . . . . . . . . . . . . . . . . . . . . . . . . . . . . . . . . . . . . . . 123
Session SQL Tab for Oracle . . . . . . . . . . . . . . . . . . . . . . . . . . . . . . . . . . . . . . . . . . . . . . . . . . . . . . . . . . . 123
Session Statistics Tab for Oracle . . . . . . . . . . . . . . . . . . . . . . . . . . . . . . . . . . . . . . . . . . . . . . . . . . . . . . . 123
SQL Server Session Detail View. . . . . . . . . . . . . . . . . . . . . . . . . . . . . . . . . . . . . . . . . . . . . . . . . . . . . . . . . . . 124
Overview Tab for SQL Server . . . . . . . . . . . . . . . . . . . . . . . . . . . . . . . . . . . . . . . . . . . . . . . . . . . . . . . . . . 124
SQL Tab for SQL Server . . . . . . . . . . . . . . . . . . . . . . . . . . . . . . . . . . . . . . . . . . . . . . . . . . . . . . . . . . . . . . 126
Blocked By Tab for SQL Server . . . . . . . . . . . . . . . . . . . . . . . . . . . . . . . . . . . . . . . . . . . . . . . . . . . . . . . . 126
Blocking Tab for SQL Server. . . . . . . . . . . . . . . . . . . . . . . . . . . . . . . . . . . . . . . . . . . . . . . . . . . . . . . . . . . 128
All Locks Tab for SQL Server . . . . . . . . . . . . . . . . . . . . . . . . . . . . . . . . . . . . . . . . . . . . . . . . . . . . . . . . . . 129
Sybase Session Detail View . . . . . . . . . . . . . . . . . . . . . . . . . . . . . . . . . . . . . . . . . . . . . . . . . . . . . . . . . . . . . . 130
Overview Tab for Sybase . . . . . . . . . . . . . . . . . . . . . . . . . . . . . . . . . . . . . . . . . . . . . . . . . . . . . . . . . . . . . 130
SQL Tab for Sybase . . . . . . . . . . . . . . . . . . . . . . . . . . . . . . . . . . . . . . . . . . . . . . . . . . . . . . . . . . . . . . . . . 131
Blocked By Tab for Sybase . . . . . . . . . . . . . . . . . . . . . . . . . . . . . . . . . . . . . . . . . . . . . . . . . . . . . . . . . . . . 132
Blocking Tab for Sybase . . . . . . . . . . . . . . . . . . . . . . . . . . . . . . . . . . . . . . . . . . . . . . . . . . . . . . . . . . . . . . 132
All Locks Tab for Sybase. . . . . . . . . . . . . . . . . . . . . . . . . . . . . . . . . . . . . . . . . . . . . . . . . . . . . . . . . . . . . . 133
DB2 Session Detail View . . . . . . . . . . . . . . . . . . . . . . . . . . . . . . . . . . . . . . . . . . . . . . . . . . . . . . . . . . . . . . . . 134
Application Tab for DB2 . . . . . . . . . . . . . . . . . . . . . . . . . . . . . . . . . . . . . . . . . . . . . . . . . . . . . . . . . . . . . . 135
Unit of Work Tab for DB2 . . . . . . . . . . . . . . . . . . . . . . . . . . . . . . . . . . . . . . . . . . . . . . . . . . . . . . . . . . . . . 136
Locking Tab for DB2 . . . . . . . . . . . . . . . . . . . . . . . . . . . . . . . . . . . . . . . . . . . . . . . . . . . . . . . . . . . . . . . . . 138
Memory Tab for DB2 . . . . . . . . . . . . . . . . . . . . . . . . . . . . . . . . . . . . . . . . . . . . . . . . . . . . . . . . . . . . . . . . . 139
I/O Tab for DB2 . . . . . . . . . . . . . . . . . . . . . . . . . . . . . . . . . . . . . . . . . . . . . . . . . . . . . . . . . . . . . . . . . . . . . 140
SQL Statistics Tab for DB2 . . . . . . . . . . . . . . . . . . . . . . . . . . . . . . . . . . . . . . . . . . . . . . . . . . . . . . . . . . . . 142
Top Sessions View . . . . . . . . . . . . . . . . . . . . . . . . . . . . . . . . . . . . . . . . . . . . . . . . . . . . . . . . . . . . . . . . . . . . . . . . 143
Memory Tab . . . . . . . . . . . . . . . . . . . . . . . . . . . . . . . . . . . . . . . . . . . . . . . . . . . . . . . . . . . . . . . . . . . . . . . . . . 143
EMBARCADERO TECHNOLOGIES > EMBARCADERO PERFORMANCE CENTER 2.5 EXPERT GUIDE: SQL SERVER 9
>
Memory Tab for Oracle . . . . . . . . . . . . . . . . . . . . . . . . . . . . . . . . . . . . . . . . . . . . . . . . . . . . . . . . . . . . . . . 144
Memory Tab for SQL Server . . . . . . . . . . . . . . . . . . . . . . . . . . . . . . . . . . . . . . . . . . . . . . . . . . . . . . . . . . . 144
Memory Tab for Sybase . . . . . . . . . . . . . . . . . . . . . . . . . . . . . . . . . . . . . . . . . . . . . . . . . . . . . . . . . . . . . . 145
Memory Tab for DB2 . . . . . . . . . . . . . . . . . . . . . . . . . . . . . . . . . . . . . . . . . . . . . . . . . . . . . . . . . . . . . . . . . 146
I/O Tab . . . . . . . . . . . . . . . . . . . . . . . . . . . . . . . . . . . . . . . . . . . . . . . . . . . . . . . . . . . . . . . . . . . . . . . . . . . . . . 147
I/O Tab for Oracle . . . . . . . . . . . . . . . . . . . . . . . . . . . . . . . . . . . . . . . . . . . . . . . . . . . . . . . . . . . . . . . . . . . 147
I/O Tab for SQL Server . . . . . . . . . . . . . . . . . . . . . . . . . . . . . . . . . . . . . . . . . . . . . . . . . . . . . . . . . . . . . . . 148
I/O Tab for Sybase . . . . . . . . . . . . . . . . . . . . . . . . . . . . . . . . . . . . . . . . . . . . . . . . . . . . . . . . . . . . . . . . . . 149
I/O Tab for DB2 . . . . . . . . . . . . . . . . . . . . . . . . . . . . . . . . . . . . . . . . . . . . . . . . . . . . . . . . . . . . . . . . . . . . . 150
CPU Tab . . . . . . . . . . . . . . . . . . . . . . . . . . . . . . . . . . . . . . . . . . . . . . . . . . . . . . . . . . . . . . . . . . . . . . . . . . . . . 151
CPU Tab for Oracle. . . . . . . . . . . . . . . . . . . . . . . . . . . . . . . . . . . . . . . . . . . . . . . . . . . . . . . . . . . . . . . . . . 152
CPU Tab for SQL Server. . . . . . . . . . . . . . . . . . . . . . . . . . . . . . . . . . . . . . . . . . . . . . . . . . . . . . . . . . . . . . 152
CPU Tab for Sybase . . . . . . . . . . . . . . . . . . . . . . . . . . . . . . . . . . . . . . . . . . . . . . . . . . . . . . . . . . . . . . . . . 152
CPU Tab for DB2 . . . . . . . . . . . . . . . . . . . . . . . . . . . . . . . . . . . . . . . . . . . . . . . . . . . . . . . . . . . . . . . . . . . 153
Top SQL View . . . . . . . . . . . . . . . . . . . . . . . . . . . . . . . . . . . . . . . . . . . . . . . . . . . . . . . . . . . . . . . . . . . . . . . . . . . . 153
EMBARCADERO TECHNOLOGIES > EMBARCADERO PERFORMANCE CENTER 2.5 EXPERT GUIDE: SQL SERVER 10
Microsoft SQL Server Expert GuideThis section includes expert help for all Microsoft SQL Server statistics in the Embarcadero Performance Center views:
• Home View Statistics
• Database Page Statistics
• Contention Statistics
• I/O Page Statistics
• Memory Page Statistics
• Network Statistics
• OS Page Statistics
• Space Page Statistics
• Users Page Statistics
Home View StatisticsThe Embarcadero Performance Center Home view lets you review availability and overall performance of all monitored databases from a single window. Statistics on the Home view are organized into the following categories:
• Contention Vital Signs
• I/O Vital Signs
• Memory Vital Signs
• Network Vital Signs
• Space Vital Signs
• Users Vital Signs
Related TopicsDatabase Page Statistics
Contention Statistics
I/O Page Statistics
Memory Page Statistics
Network Statistics
OS Page Statistics
Space Page Statistics
Top SQL Page Statistics
Users Page Statistics
EMBARCADERO TECHNOLOGIES > EMBARCADERO PERFORMANCE CENTER 2.5 EXPERT GUIDE: SQL SERVER 11
MICROSOFT SQL SERVER EXPERT GUIDE > HOME VIEW STATISTICS
Memory Vital SignsThe following memory statistics are on the SQL Server Home view:
• Ad Hoc SQL Hit Ratio
• Buffer Cache Hit Ratio
• Log Cache Hit Ratio
• Procedure Plan Hit Ratio
Buffer Cache Hit Ratio• Metrics
• Troubleshooting
Data read from memory will produce end-user response times many times faster than when that same data is read from disk. Keeping physical I/Os to an absolute minimum is one of the purposes of the SQL Server buffer/data cache.
The buffer cache hit ratio is a terrific indicator of how often user requests for data are satisfied through memory vs. being physically read from disk.
TIP: Click this statistic to drill down to the Buffer Cache tab of the Memory Detail view.
MetricsTo help ensure excellent performance, you want to keep your cache hit ratio in the neighborhood of 90% or higher. However, you should be aware that every server has its own 'personality' and might exhibit excellent performance with below average readings for the cache hit ratio. You should also be aware that excessive logical I/O activity can produce a very high cache hit ratio while actually degrading overall database performance.
Consistently viewed low readings (60% or lower) might require tuning attention on the part of the DBA.
TroubleshootingEnsure SQL Server is configured to use as much physical memory as possible by checking the Max Server memory configuration option. Also, consider increasing your SQL Server Min. Memory parameter to allocate more memory to SQL Server. (Note that to obtain optimal values for these parameters, an option is to install more physical RAM to your server.) Check for any large objects that are pinned in memory that could possibly be removed.
Often a user process is taking a large amount of memory due to an inordinate amount of I/O.
Procedure Hit Ratio• Metrics
• Troubleshooting
The SQL Server procedure cache is used to hold the execution plans for all Transact-SQL statements currently executing in the server. When a user executes a Transact-SQL statement, SQL Server looks in the procedure cache for a query plan to use.
This statistic is the percentage of query plan requests generated by stored procedures that are found in the procedure cache area. The percentage of times that a statement's plan and definition can be referenced in memory, the better the procedure execution time.
TIP: Click this statistic to drill down to the SQL Cache tab of the Memory Detail view.
EMBARCADERO TECHNOLOGIES > EMBARCADERO PERFORMANCE CENTER 2.5 EXPERT GUIDE: SQL SERVER 12
MICROSOFT SQL SERVER EXPERT GUIDE > HOME VIEW STATISTICS
MetricsA high procedure cache hit rate is a desirable thing. You should strive for a hit ratio between 95-100%, with 95% being a good performance benchmark for code reference. Note that when a database is first started, the procedure cache hit rate will not be at an optimal level because all code being used will be relatively new, and as such, must be read in from disk and placed into the cache. If, however, after a solid hour or two of steady database time, the procedure cache hit rate has not increased to desirable levels, you should look into the possibility of increasing the amount of memory allocated to the cache.
TroubleshootingFirst, ensure SQL Server is configured to use as much physical memory as possible by checking the Max Server Memory configuration option. Also, consider increasing your SQL Server Min Memory parameter to allocate more memory to SQL Server. (Note that to obtain optimal values for these parameters, an option is to install more physical RAM to your server.) Check for any large objects that are pinned in memory that could possibly be removed.
Ad Hoc SQL Hit Ratio• Metrics
• Troubleshooting
When an ad hoc SQL statement is issued, the query plan is then stored in the SQL Server procedure cache area. If the identical ad hoc statement is launched in the future, SQL Server uses the query plan already stored in the procedure cache if it is still there. The Ad Hoc SQL Hit Ratio statistic defines the percentage of times that a query plan for an ad hoc SQL statement is found in the procedure cache.
TIP: Click this statistic to drill down to the SQL Cache tab of the Memory Detail view.
MetricsA high ad hoc hit rate is desirable, but is harder to maintain at a high level than something like a procedure cache hit rate. Therefore, an 80% or greater ad hoc cache hit rate is a good performance benchmark for code reference. Note that when a database is first started, the ad hoc cache hit rate will not be at an optimal level because all code being used will be relatively new, and as such, must be read in from disk and placed into the cache. If, however, after a solid hour or two of steady database time, the ad hoc cache hit rate has not increased to desirable levels, you should look into the possibility of increasing the amount of memory allocated to the cache.
TroubleshootingFirst, ensure SQL Server is configured to use as much physical memory as possible by checking the Max Server Memory configuration option. Also, consider increasing your SQL Server Min Memory parameter to allocate more memory to SQL Server. (To obtain optimal values for these parameters, an option is to install more physical RAM to your server.) Check for any large objects that are pinned in memory that could possibly be removed.
Log Cache Hit Ratio• Metrics
• Troubleshooting
The Log Cache Hit Ratio represents the percentage of log cache reads satisfied from the log cache.
TIP: Click this statistic to drill down to the Log Cache tab of the Memory Detail view.
MetricsNone.
EMBARCADERO TECHNOLOGIES > EMBARCADERO PERFORMANCE CENTER 2.5 EXPERT GUIDE: SQL SERVER 13
MICROSOFT SQL SERVER EXPERT GUIDE > HOME VIEW STATISTICS
TroubleshootingA low percentage on this statistic is not necessarily a bad sign, as it is possible that the information needed from the log will not be readily available in memory.
I/O Vital SignsThe following I/O statistics are on the SQL Server Home view:
• I/O Errors
• Log Flushes
• Total Server Reads
• Total Server Writes
TIP: Click any of these statistics to open the I/O performance category view.
Total Server Reads• Metrics
Total Server Reads reflect total number of physical reads performed by the database server since the last refresh inside Embarcadero Performance Center.
MetricsLarge numbers of physical reads could reflect a data or procedure cache that is too small. You should examine the data and procedure cache hit rates to determine the overall effectiveness of logical vs. physical I/O.
Total Server Writes• Metrics
The Total Server Writes value reflects the total number of physical writes performed by the database server since the last refresh inside Embarcadero Performance Center.
MetricsNone.
Log Flushes• Metrics
The Log Flushes statistic represents the total number of log pages for all databases written to disk by the log writer process. A log flush occurs when SQL Server writes all changes from the database's log cache out to the database's log files on disk.
MetricsIncreasing numbers observed for log flushes should not cause concern unless the I/O subsystem of the server appears overwhelmed. In addition, to minimize I/O contention between a database and its accompanying log, it is wise to place database files and log files on separate disks.
EMBARCADERO TECHNOLOGIES > EMBARCADERO PERFORMANCE CENTER 2.5 EXPERT GUIDE: SQL SERVER 14
MICROSOFT SQL SERVER EXPERT GUIDE > HOME VIEW STATISTICS
I/O Errors• Metrics
• Troubleshooting
I/O Error Rate reflects total number of I/O errors (errors during read and write operations) encountered by the server since the last refresh inside Performance Center. I/O Error Rate is a percentage based on Total I/O (the sum the physical reads and writes).
MetricsYou should observe few, if any errors.
TroubleshootingIf you notice any errors, you should check the SQL Server error log for details.
Contention Vital SignsThe following contention statistics are on the SQL Server Home view:
• Blocked Users
• Deadlocks
• Latch Waits
• Lock Timeouts
Blocked Users• Metrics
• Troubleshooting
A single blocking user has the potential to stop work for nearly all other processes on a small system, and can cause major headaches even on large systems. Blocks are most often caused by user processes holding exclusive locks and not releasing them via a proper COMMIT frequency. Unless a process times out via an application timeout mechanism, or the process has specified a timeout period via the SET LOCK_TIMEOUT command, a process waiting for a lock will wait indefinitely.
MetricsYou should immediately investigate any indicator above zero, before the situation has a chance to mushroom.
TroubleshootingOnce discovered, a blocking lock situation can normally be quickly remedied - the DBA issues a KILL against the offending process, which eliminates the user's stranglehold on the objects they were accessing. Then other user processes, almost always, complete in an instant. Discovering the blocked lock situation is made easier by using tools like Performance Center, but preventing the blocking lock situation in the first place is where it gets tricky. The DBA can drill down into Users Detail and see all current blocking locks, learning exactly which sessions are holding the currently restrictive locks.
The culprit of blocking lock scenarios is usually the application design, or the SQL being used within the application itself. Properly coding an application to reference database objects in an efficient order, and then using the right SQL to get the job done, is an art. The key to avoiding lock contention is to process user transactions in the quickest and most efficient manner possible - something not always easy to do.
EMBARCADERO TECHNOLOGIES > EMBARCADERO PERFORMANCE CENTER 2.5 EXPERT GUIDE: SQL SERVER 15
MICROSOFT SQL SERVER EXPERT GUIDE > HOME VIEW STATISTICS
By default, all processes wait indefinitely for locks in SQL Server. You can change this behavior by using the SET LOCK_TIMEOUT command, which limits the number of seconds that a process will wait for a lock before timing out.
DeadlocksThe Deadlocks statistic represents the number of deadlocks per second detected by SQL Server. Deadlocks occur when processes cannot proceed because they are waiting on a set of resources held by each other or held by other processes.
TIP: Click this statistic to open the Contention performance category view.
MetricsConsistently seeing deadlock counts greater than zero will indicate that some user processes are experiencing delays in completing their work. When SQL Server identifies a deadlock, it resolves the situation by choosing the process that can break the deadlock. This process is termed the deadlock victim. SQL Server rolls back the deadlock victim's transaction, and then notifies the process’ application by returning an error message. It also cancels the process’ request and allows the transactions of the remaining processes to continue.
SQL Server always attempts to choose the least expensive thread running the transaction as the deadlock victim.
TroubleshootingBecause SQL Server automatically resolves deadlock situations, you should do proactive work to prevent them in the first place.
The culprit of most blocking lock and deadlock scenarios is usually the application design, or the SQL being used within the application itself. Properly coding an application to reference database objects in an efficient order, and then using the right SQL to get the job done, is an art. The key to avoiding lock contention is to process user transactions in the quickest and most efficient manner possible - something not always easy to do.
You can change default deadlock behavior by using the SET DEADLOCK_PRIORITY command, which reprioritizes a process’ position in a deadlock situation.
Lock Timeouts• Metrics
Number of lock requests per second that timed out, including internal requests for NOWAIT locks.
TIP: Click this statistic to open the Contention performance category view.
MetricsNone.
Latch Waits• Metrics
• Troubleshooting
The Latch Waits statistic represents the number of latches per second that could not be satisfied immediately by SQL Server. Latches can be thought of as lightweight, mini-locks that are used to protect actions and resources used inside transactions.
TIP: Click this statistic to drill down to the Waits tab of the Contention Detail view.
EMBARCADERO TECHNOLOGIES > EMBARCADERO PERFORMANCE CENTER 2.5 EXPERT GUIDE: SQL SERVER 16
MICROSOFT SQL SERVER EXPERT GUIDE > HOME VIEW STATISTICS
MetricsLatch waits rarely impact performance, however seeing latch waits with high wait time might indicate an area that needs further investigation.
TroubleshootingWait events can be hard to interpret at times. If you see a particular event that has caused a lot of wait time, you can review the information in this link (Microsoft Knowledge Base Article - 244455) to help understand the cause and potential remedy:
http://support.microsoft.com/default.aspx?scid=kb;en-us;Q244455
Space Vital Signs
The following space statistics are on the SQL Server Home view.
• Databases Low on Space
• Logs Low on Space
TIP: Click either of these statistics to open the Space performance category view.
Databases Low on SpaceA SQL server contains many databases, some of which are devoted to system-level activities (the master and tempdb databases, for example) and others that hold user data. The Databases Low on Space statistic indicates databases that have fallen below a recommended percentage of free space.
MetricsThis might or might not be a problem. Some databases are not dynamic in nature (meaning they are not expected to grow in size) and are sized so very little free space is present. However, growing databases are another situation and might require DBA intervention if their free space amounts run low.
TroubleshootingIf the percent used amount of a database is approaching problematic levels, there are three ways a DBA can rectify the situation:
1 The DBA can resize the current file(s) used by the database via an ALTER DATABASE … MODIFY FILE command
2 The DBA can add a new file to the database via the ALTER DATABASE … ADD FILE command.
3 The DBA can modify the file(s) used by the database to automatically grow by using the ALTER DATABASE … MODIFY FILE … FILEGROWTH command. You should also ensure that the MAXSIZE setting for each file is set appropriately.
Of course, the DBA should also ensure that enough physical space exists on the server to accommodate additional database space.
EMBARCADERO TECHNOLOGIES > EMBARCADERO PERFORMANCE CENTER 2.5 EXPERT GUIDE: SQL SERVER 17
MICROSOFT SQL SERVER EXPERT GUIDE > HOME VIEW STATISTICS
Logs Low on SpaceEach database in SQL Server has a transaction log, which is a serial record of all modifications that have occurred in a database as well as the transactions that caused each change. The Logs Low on Space statistic indicates transaction logs that have fallen below a recommended percentage of free space.
MetricsIf any log’s used space exceeds the Performance Center recommended thresholds, then the DBA should take action to ensure that the log does not run out of available free space.
TroubleshootingThere are several things a DBA can do to ensure that a database’s log does not run out of available free space:
1 First, most transactional-oriented databases should have their logs assigned to a separate physical drive than the database. Reasons for doing so include:
• It prevents competition for space between the log and the database itself.
• It allows the log to be monitored for space more effectively.
• It improves performance.
2 If the database is not critical in nature, you can set the truncate log on checkpoint option trunc log on chkpt, which will eliminate any non-active space in the log when a database checkpoint occurs.
3 Critical databases needing higher levels of recovery should have schedules established that regular perform transaction log dumps. Doing so ensures better recovery scenarios as well as a reduced risk of the transaction log running out of space.
4 If a critical transaction log becomes full, it might be impossible to use standard procedures to dump transactions and reclaim space. The dump operation will likely have to incorporate the no log or truncate only options.
5 If a transaction log continuously approaches dangerously low levels of free space, then the DBA should allow the underlying file(s) of the log to automatically grow to meet the demand. This can be accomplished by using the ALTER DATABASE … MODIFY FILE … FILEGROWTH command. You should also ensure that the MAXSIZE setting for each file is set appropriately.
The DBA should also be on the lookout for large load or data modification operations that do not make use of prudently timed commit points. A single, large transaction has the ability to overwhelm any transaction log since only non-active space in the transaction log is removed from log dumps or truncation operations.
Users Vital SignsThe following users statistics are on the SQL Server Home view:
• Active Connections
• Current Locks
• Total Connections
• Transactions
Total Connections• Metrics
• Troubleshooting
EMBARCADERO TECHNOLOGIES > EMBARCADERO PERFORMANCE CENTER 2.5 EXPERT GUIDE: SQL SERVER 18
MICROSOFT SQL SERVER EXPERT GUIDE > HOME VIEW STATISTICS
Every connection to SQL Server spawns one or more processes, each uniquely identified by what SQL Server calls a SPID. The Total Connections display shows the number of user and system processes currently reported in the SQL Server instance. This number includes both active and inactive processes.
TIP: Click this statistic to drill down to the Processes tab of the Users Detail view.
MetricsYou should view the total number of connections in light of the maximum number of processes allowed to connect to SQL Server. The user connections parameter specifies the maximum number of user processes that can simultaneously connect to a SQL Server instance.
TroubleshootingIf the total number of connections approaches the number of user connections limit then:
1 Edit the configuration file for SQL Server.
2 Increase the amount of user connections to a higher value.
3 Cycle SQL Server when possible to allow the new value to take effect.
Active ConnectionsThe Active Connections statistic represents the total number of active and open threads reported on the server. This number displays the number of processes actively performing work.
TIP: Click this statistic to drill down to the Processes tab of the Users Detail view.
MetricsNone.
Transactions• Metrics
This statistic represents the total number of active transactions in the SQL Server instance that have not yet been committed, or are waiting on a blocking lock to complete.
TIP: Click this statistic to open the Users performance category view.
NOTE: Embarcadero Performance Center displays this statistic on the Users performance category view as Active Transactions.
MetricsNone.
Current LocksThis statistic represents the total number of granted, converting, and waiting lock requests.
TIP: Click this statistic to drill down to the All Lock tab of the Locks view.
EMBARCADERO TECHNOLOGIES > EMBARCADERO PERFORMANCE CENTER 2.5 EXPERT GUIDE: SQL SERVER 19
MICROSOFT SQL SERVER EXPERT GUIDE > HOME VIEW STATISTICS
Network Vital SignsThe following network statistics are on the SQL Server Home view:
• Logins
• Logouts
• Packets Received
• Packets Sent
TIP: Click any of these statistics to open the Network performance category view.
Packets Received• Metrics
SQL Server counts incoming packets from the time the server is initiated. This statistic displays the delta count of all incoming packets received over the network since the last Embarcadero Performance Center sampling.
MetricsNone.
Packets Sent• Metrics
SQL Server counts outgoing packets from the time the server is initiated. This statistic displays the delta count of all outbound packets written to the network the last Embarcadero Performance Center sampling.
MetricsNone.
Logins• Metrics
This statistic represents the total number of logins started per second.
MetricsNone.
Logouts• Metrics
This statistic represents the total number of logout operations started per second.
MetricsNone.
EMBARCADERO TECHNOLOGIES > EMBARCADERO PERFORMANCE CENTER 2.5 EXPERT GUIDE: SQL SERVER 20
MICROSOFT SQL SERVER EXPERT GUIDE > MEMORY PAGE STATISTICS
Memory Page StatisticsThe Memory view includes the following statistics:
• Ad Hoc SQL Hit Ratio
• Buffer Cache
• Buffer Cache Hit Ratio
• Buffer Cache Usage
• Memory Usage
• Procedure Hit Ratio
• Session Leaders - Memory
• SQL Cache
• SQL Cache Usage
Related TopicsMemory Detail View
Home View Statistics
Database Page Statistics
Contention Statistics
I/O Page Statistics
Network Statistics
OS Page Statistics
Space Page Statistics
Top SQL Page Statistics
Users Page Statistics
Buffer Cache Hit Ratio• Metrics
• Troubleshooting
Data read from memory will produce end-user response times many times faster than when that same data is read from disk. Keeping physical I/Os to an absolute minimum is one of the purposes of the SQL Server buffer/data cache.
The buffer cache hit ratio is a terrific indicator of how often user requests for data are satisfied through memory vs. being physically read from disk.
TIP: Click this statistic to drill down to the Buffer Cache tab of the Memory Detail view.
EMBARCADERO TECHNOLOGIES > EMBARCADERO PERFORMANCE CENTER 2.5 EXPERT GUIDE: SQL SERVER 21
MICROSOFT SQL SERVER EXPERT GUIDE > MEMORY PAGE STATISTICS
MetricsTo help ensure excellent performance, you want to keep your cache hit ratio in the neighborhood of 90% or higher. However, you should be aware that every server has its own 'personality' and might exhibit excellent performance with below average readings for the cache hit ratio. You should also be aware that excessive logical I/O activity can produce a very high cache hit ratio while actually degrading overall database performance.
Consistently viewed low readings (60% or lower) might require tuning attention on the part of the DBA.
TroubleshootingEnsure SQL Server is configured to use as much physical memory as possible by checking the Max Server memory configuration option. Also, consider increasing your SQL Server Min. Memory parameter to allocate more memory to SQL Server. (Note that to obtain optimal values for these parameters, an option is to install more physical RAM to your server.) Check for any large objects that are pinned in memory that could possibly be removed.
Often a user process is taking a large amount of memory due to an inordinate amount of I/O.
Procedure Plan Hit Ratio• Metrics
• Troubleshooting
The SQL Server procedure cache is used to hold the execution plans for all Transact-SQL statements currently executing in the server. When a user executes a Transact-SQL statement, SQL Server looks in the procedure cache for a query plan to use.
This statistic is the percentage of query plan requests generated by stored procedures that are found in the procedure cache area. The percentage of times that a statement's plan and definition can be referenced in memory, the better the procedure execution time.
TIP: Click this statistic to drill down to the SQL Cache tab of the Memory Detail view.
MetricsA high procedure cache hit rate is a desirable thing. You should strive for a hit ratio between 95-100%, with 95% being a good performance benchmark for code reference. Note that when a database is first started, the procedure cache hit rate will not be at an optimal level because all code being used will be relatively new, and as such, must be read in from disk and placed into the cache. If, however, after a solid hour or two of steady database time, the procedure cache hit rate has not increased to desirable levels, you should look into the possibility of increasing the amount of memory allocated to the cache.
TroubleshootingFirst, ensure SQL Server is configured to use as much physical memory as possible by checking the Max Server Memory configuration option. Also, consider increasing your SQL Server Min Memory parameter to allocate more memory to SQL Server. (Note that to obtain optimal values for these parameters, an option is to install more physical RAM to your server.) Check for any large objects that are pinned in memory that could possibly be removed.
Ad Hoc SQL Hit Ratio• Metrics
• Troubleshooting
EMBARCADERO TECHNOLOGIES > EMBARCADERO PERFORMANCE CENTER 2.5 EXPERT GUIDE: SQL SERVER 22
MICROSOFT SQL SERVER EXPERT GUIDE > MEMORY PAGE STATISTICS
When an ad hoc SQL statement is issued, the query plan is then stored in the SQL Server procedure cache area. If the identical ad hoc statement is launched in the future, SQL Server uses the query plan already stored in the procedure cache if it is still there. This statistic defines the percentage of times that a query plan for an ad hoc SQL statement is found in the procedure cache.
TIP: Click this statistic to drill down to the SQL Cache tab of the Memory Detail view.
MetricsA high ad hoc hit rate is desirable, but is harder to maintain at a high level than something like a procedure cache hit rate. Therefore, an 80% or greater ad hoc cache hit rate is a good performance benchmark for code reference. Note that when a database is first started, the ad hoc cache hit rate will not be at an optimal level because all code being used will be relatively new, and as such, must be read in from disk and placed into the cache. If, however, after a solid hour or two of steady database time, the ad hoc cache hit rate has not increased to desirable levels, you should look into the possibility of increasing the amount of memory allocated to the cache.
TroubleshootingFirst, ensure SQL Server is configured to use as much physical memory as possible by checking the Max Server Memory configuration option. Also, consider increasing your SQL Server Min Memory parameter to allocate more memory to SQL Server. (To obtain optimal values for these parameters, an option is to install more physical RAM to your server.) Check for any large objects that are pinned in memory that could possibly be removed.
SQL Cache• Metrics
The total percentage of memory that SQL Server is using in its SQL/procedure cache. Microsoft has begun to transition from the term “procedure cache” to “SQL cache” to define this area of memory. The reason being that in SQL Server's past, this area was devoted exclusively to holding query plans for stored procedures only.
The SQL Cache (procedure cache) is the part of the SQL Server memory pool that is used to store execution plans for Transact-SQL batches, stored procedures, and triggers. Execution plans record the steps that SQL Server must take to produce the results specified by the Transact-SQL statements contained in the batches, stored procedures, or triggers.
MetricsNone.
Memory Usage• Metrics
• Troubleshooting
SQL Server is allocated memory at start up that will fall between the range of two configurable parameters: Min Memory and Max Memory. This statistic shows you the amount of SQL Server memory allocated at present. In a normal SQL Server system, this number fluctuates as SQL Server uses more memory and releases unused memory back to the operating system. SQL Server also works in conjunction with the Windows memory manager, deallocating space when it detects that the operating system is unable to satisfy memory requests of other operating system processes.
MetricsAn excessively high memory allocation may mean that the SQL Server instance is working in a memory deficient environment.
EMBARCADERO TECHNOLOGIES > EMBARCADERO PERFORMANCE CENTER 2.5 EXPERT GUIDE: SQL SERVER 23
MICROSOFT SQL SERVER EXPERT GUIDE > MEMORY PAGE STATISTICS
TroubleshootingIncrease the Max Memory parameter to provide SQL Server with more memory resources. Note that this may require adding physical RAM to the machine to satisfy the requests of both SQL Server and the Windows operating system.
Buffer Cache• Metrics
• Troubleshooting
The total amount of memory, in megabytes, that is allocated for the SQL Server buffer cache. Each instance of SQL Server has its own buffer cache where it stores recently used data pages to reduce physical I/O. The goal is to make the buffer cache large enough to maximize the ratio of logical reads to physical reads, but not so large that excessive memory swapping starts generating physical I/O to the pagefile. (Instances of SQL Server 2000 do this automatically under the default configuration settings.)
TIP: Click either of these statistics to drill down to the Buffer Cache tab of the Memory Detail view.
MetricsA percentage used consistently remaining close to 100% indicates a deficient amount of memory available to SQL Server.
TroubleshootingFirst, ensure SQL Server is configured to use as much physical memory as possible by checking the Max Server Memory configuration option. Also, consider increasing your SQL Server Min Memory parameter to allocate more memory to SQL Server. (Note that to obtain optimal values for these parameters, an option is to install more physical RAM to your server.) Check for any large objects that are pinned in memory that could possibly be removed.
Session Leaders - Memory• Metrics
• Troubleshooting
It is not uncommon for one or two users to cause the majority of runtime problems that plague a database. The problem could be a runaway process, an untuned batch procedure, or other user-initiated operation. Frequently, user connections can get out of hand with memory consumption, and extreme cases have caused headaches at both the database and operating system level.
The leading memory session's display identifies the top users in the server with respect to memory consumption.
MetricsIf your SQL Server machine does not have an overabundance of memory, you should periodically check to see who your heavy memory users are along with the total percentage of memory each takes up. If you see one or two users who have more than 5-15% of the total memory usage, you should investigate the sessions further to see what activities they are performing.
TroubleshootingYou can use the Session Leaders - Memory statistic to find the users with the greatest current allocations of overall memory. Runaway processes can be immediately terminated from within the Embarcadero Performance Center Client.
EMBARCADERO TECHNOLOGIES > EMBARCADERO PERFORMANCE CENTER 2.5 EXPERT GUIDE: SQL SERVER 24
MICROSOFT SQL SERVER EXPERT GUIDE > MEMORY PAGE STATISTICS
Cache Usage• Metrics
• Troubleshooting
The total MB of space that SQL Server is using in the buffer cache. Each instance of SQL Server has its own buffer cache where it stores recently used data pages to reduce physical I/O. The goal is to make the buffer cache large enough to maximize the ratio of logical reads to physical reads, but not so large that excessive memory swapping starts generating physical I/O to the pagefile. (Instances of SQL Server 2000 do this automatically under the default configuration settings.)
MetricsA percentage used consistently remaining close to 100% indicates a deficient amount of memory available to SQL Server.
TroubleshootingFirst, ensure SQL Server is configured to use as much physical memory as possible by checking the Max Server Memory configuration option. Also, consider increasing your SQL Server Min Memory parameter to allocate more memory to SQL Server. (Note that to obtain optimal values for these parameters, an option is to install more physical RAM to your server.) Check for any large objects that are pinned in memory that could possibly be removed.
SQL Cache Size• Metrics
The total MB of space that SQL Server is using in its SQL/procedure cache. Microsoft has begun to transition from the term “procedure cache” to “SQL cache” to define this area of memory. The reason being that in SQL Server's past, this area was devoted exclusively to holding query plans for stored procedures only.
The SQL Cache (procedure cache) is the part of the SQL Server memory pool that is used to store execution plans for Transact-SQL batches, stored procedures, and triggers. Execution plans record the steps that SQL Server must take to produce the results specified by the Transact-SQL statements contained in the batches, stored procedures, or triggers.
MetricsNone.
SQL Cache Free• Metrics
The total MB of space that is free in the SQL Server SQL/procedure cache. Microsoft has begun transitioning from the term “procedure cache” to “SQL cache” to define this area of memory. In the past this area was devoted exclusively to holding query plans for stored procedures only, but this is no longer the case.
The SQL Cache (procedure cache) is responsible for storing exection plans for Transact-SQL batches, stored procedures, and triggers. Execution plans record the steps that SQL Server must take to produce the results specified by the Transact-SQL statements contained in the batches, stored procedures, or triggers.
MetriicsNone.
EMBARCADERO TECHNOLOGIES > EMBARCADERO PERFORMANCE CENTER 2.5 EXPERT GUIDE: SQL SERVER 25
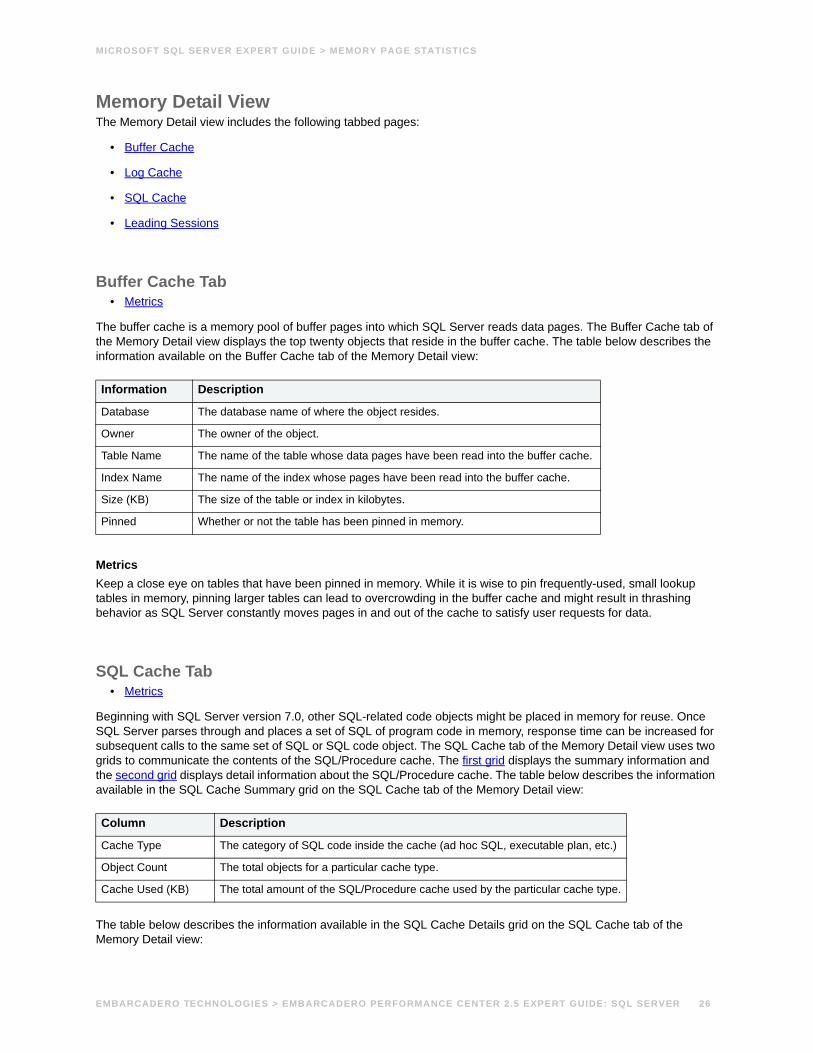
MICROSOFT SQL SERVER EXPERT GUIDE > MEMORY PAGE STATISTICS
Memory Detail ViewThe Memory Detail view includes the following tabbed pages:
• Buffer Cache
• Log Cache
• SQL Cache
• Leading Sessions
Buffer Cache Tab• Metrics
The buffer cache is a memory pool of buffer pages into which SQL Server reads data pages. The Buffer Cache tab of the Memory Detail view displays the top twenty objects that reside in the buffer cache. The table below describes the information available on the Buffer Cache tab of the Memory Detail view:
MetricsKeep a close eye on tables that have been pinned in memory. While it is wise to pin frequently-used, small lookup tables in memory, pinning larger tables can lead to overcrowding in the buffer cache and might result in thrashing behavior as SQL Server constantly moves pages in and out of the cache to satisfy user requests for data.
SQL Cache Tab• Metrics
Beginning with SQL Server version 7.0, other SQL-related code objects might be placed in memory for reuse. Once SQL Server parses through and places a set of SQL of program code in memory, response time can be increased for subsequent calls to the same set of SQL or SQL code object. The SQL Cache tab of the Memory Detail view uses two grids to communicate the contents of the SQL/Procedure cache. The first grid displays the summary information and the second grid displays detail information about the SQL/Procedure cache. The table below describes the information available in the SQL Cache Summary grid on the SQL Cache tab of the Memory Detail view:
The table below describes the information available in the SQL Cache Details grid on the SQL Cache tab of the Memory Detail view:
Information Description
Database The database name of where the object resides.
Owner The owner of the object.
Table Name The name of the table whose data pages have been read into the buffer cache.
Index Name The name of the index whose pages have been read into the buffer cache.
Size (KB) The size of the table or index in kilobytes.
Pinned Whether or not the table has been pinned in memory.
Column Description
Cache Type The category of SQL code inside the cache (ad hoc SQL, executable plan, etc.)
Object Count The total objects for a particular cache type.
Cache Used (KB) The total amount of the SQL/Procedure cache used by the particular cache type.
EMBARCADERO TECHNOLOGIES > EMBARCADERO PERFORMANCE CENTER 2.5 EXPERT GUIDE: SQL SERVER 26
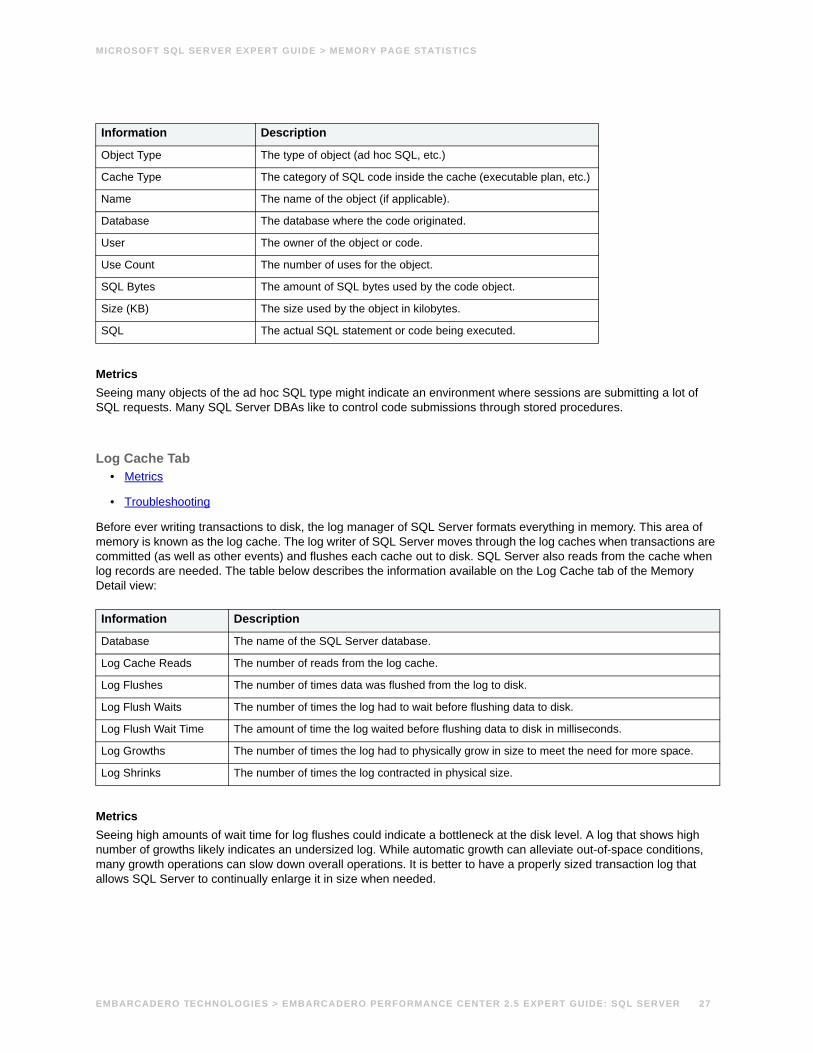
MICROSOFT SQL SERVER EXPERT GUIDE > MEMORY PAGE STATISTICS
MetricsSeeing many objects of the ad hoc SQL type might indicate an environment where sessions are submitting a lot of SQL requests. Many SQL Server DBAs like to control code submissions through stored procedures.
Log Cache Tab• Metrics
• Troubleshooting
Before ever writing transactions to disk, the log manager of SQL Server formats everything in memory. This area of memory is known as the log cache. The log writer of SQL Server moves through the log caches when transactions are committed (as well as other events) and flushes each cache out to disk. SQL Server also reads from the cache when log records are needed. The table below describes the information available on the Log Cache tab of the Memory Detail view:
MetricsSeeing high amounts of wait time for log flushes could indicate a bottleneck at the disk level. A log that shows high number of growths likely indicates an undersized log. While automatic growth can alleviate out-of-space conditions, many growth operations can slow down overall operations. It is better to have a properly sized transaction log that allows SQL Server to continually enlarge it in size when needed.
Information Description
Object Type The type of object (ad hoc SQL, etc.)
Cache Type The category of SQL code inside the cache (executable plan, etc.)
Name The name of the object (if applicable).
Database The database where the code originated.
User The owner of the object or code.
Use Count The number of uses for the object.
SQL Bytes The amount of SQL bytes used by the code object.
Size (KB) The size used by the object in kilobytes.
SQL The actual SQL statement or code being executed.
Information Description
Database The name of the SQL Server database.
Log Cache Reads The number of reads from the log cache.
Log Flushes The number of times data was flushed from the log to disk.
Log Flush Waits The number of times the log had to wait before flushing data to disk.
Log Flush Wait Time The amount of time the log waited before flushing data to disk in milliseconds.
Log Growths The number of times the log had to physically grow in size to meet the need for more space.
Log Shrinks The number of times the log contracted in physical size.
EMBARCADERO TECHNOLOGIES > EMBARCADERO PERFORMANCE CENTER 2.5 EXPERT GUIDE: SQL SERVER 27
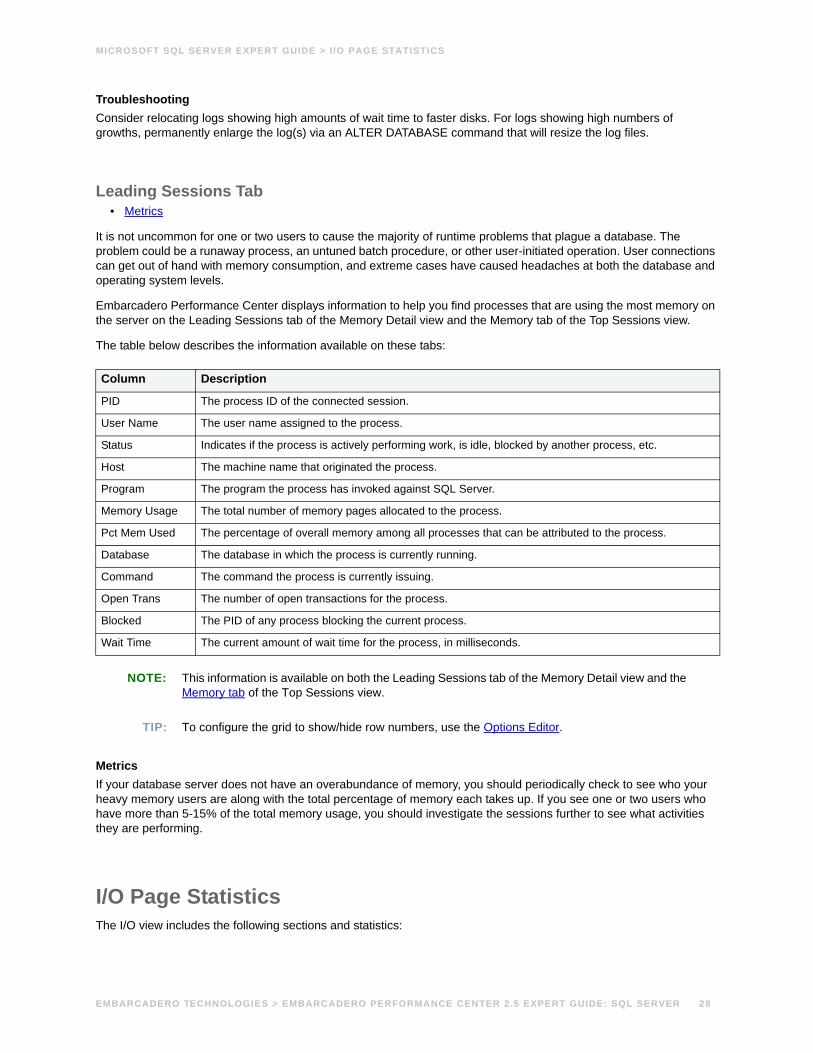
MICROSOFT SQL SERVER EXPERT GUIDE > I /O PAGE STATISTICS
TroubleshootingConsider relocating logs showing high amounts of wait time to faster disks. For logs showing high numbers of growths, permanently enlarge the log(s) via an ALTER DATABASE command that will resize the log files.
Leading Sessions Tab• Metrics
It is not uncommon for one or two users to cause the majority of runtime problems that plague a database. The problem could be a runaway process, an untuned batch procedure, or other user-initiated operation. User connections can get out of hand with memory consumption, and extreme cases have caused headaches at both the database and operating system levels.
Embarcadero Performance Center displays information to help you find processes that are using the most memory on the server on the Leading Sessions tab of the Memory Detail view and the Memory tab of the Top Sessions view.
The table below describes the information available on these tabs:
NOTE: This information is available on both the Leading Sessions tab of the Memory Detail view and the Memory tab of the Top Sessions view.
TIP: To configure the grid to show/hide row numbers, use the Options Editor.
MetricsIf your database server does not have an overabundance of memory, you should periodically check to see who your heavy memory users are along with the total percentage of memory each takes up. If you see one or two users who have more than 5-15% of the total memory usage, you should investigate the sessions further to see what activities they are performing.
I/O Page StatisticsThe I/O view includes the following sections and statistics:
Column Description
PID The process ID of the connected session.
User Name The user name assigned to the process.
Status Indicates if the process is actively performing work, is idle, blocked by another process, etc.
Host The machine name that originated the process.
Program The program the process has invoked against SQL Server.
Memory Usage The total number of memory pages allocated to the process.
Pct Mem Used The percentage of overall memory among all processes that can be attributed to the process.
Database The database in which the process is currently running.
Command The command the process is currently issuing.
Open Trans The number of open transactions for the process.
Blocked The PID of any process blocking the current process.
Wait Time The current amount of wait time for the process, in milliseconds.
EMBARCADERO TECHNOLOGIES > EMBARCADERO PERFORMANCE CENTER 2.5 EXPERT GUIDE: SQL SERVER 28
MICROSOFT SQL SERVER EXPERT GUIDE > I /O PAGE STATISTICS
• Checkpoint Pages
• Forwarded Record Fetches
• Full Scans
• I/O Error Rate
• Index Searches
• Log Cache Reads
• Log Flushes
• Page Reads
• Page Writes
• Probe Scans
• Range Scans
• Read Ahead Pages
• Server I/O Busy Rate
• Session Leaders - I/O
• Worktables Created
Related TopicsI/O Detail View
Home View Statistics
Database Page Statistics
Contention Statistics
Memory Page Statistics
Network Statistics
OS Page Statistics
Space Page Statistics
Top SQL Page Statistics
Users Page Statistics
Page Reads• Metrics
• Troubleshooting
The Page Reads statistic represents that number of physical database page reads that are issued per second by SQL Server.
TIP: Click this statistic to drill down to the Systems I/O tab of the I/O Detail view.
EMBARCADERO TECHNOLOGIES > EMBARCADERO PERFORMANCE CENTER 2.5 EXPERT GUIDE: SQL SERVER 29
MICROSOFT SQL SERVER EXPERT GUIDE > I /O PAGE STATISTICS
MetricsPage reads are to be expected, especially after initial server start up. This is because SQL Server must first satisfy requests for data and meta-data by reading information in from physical disk. Numerous page reads can also be expected if the physical server does not contain an adequate amount of memory to hold repetitively requested blocks of information.
No hard-and-fast rules exist for how many page reads per second is too much. You can cross-reference this statistic with the physical server disk statistics to see if physical page reads and accompanying physical disk I/O is approaching the server’s premium capacity levels. And because logical I/O is always many times faster than physical I/O, you should also evaluate the buffer cache hit ratio to determine overall memory vs. physical read efficiency.
TroubleshootingIf you find that the server is becoming overworked from a physical I/O standpoint, there are several courses of action you can take:
• Examine index usage to ensure that unnecessary table scans are not occurring.
• Check the physical database design to see if table objects have been over-normalized.
• Ensure that SQL Server is configured to use sufficient amounts of memory. Examine the min server memory (MB) and max server memory (MB) parameters to see if SQL Server is constrained on either end of the memory spectrum.
• Check for large pinned table objects that could be using excessive amounts of space in the buffer cache.
• Last, but not least, investigate the possibility of adding more RAM to the physical server.
Page Writes• Metrics
The Page Writes statistic represents the number of physical database page writes issued by SQL Server. Page Writes take place during operations such as checkpoints, lazywriter writes, index creations, and BCP routines.
TIP: Click this statistic to drill down to the Systems I/O tab of the I/O Detail view.
MetricsPage Writes can give you an idea of overall physical write activity, however there are a number of statistics that pertain specifically to certain write activities like checkpoints, etc., that you can examine to determine the amount of physical writes caused by distinct SQL Server processes.
With respect to performance, response times experienced by SQL Server users are normally not impacted by write operations unless the writes are synchronous in nature. These are typically BCPs, database recovery operations, and index creations.
Read Ahead Pages• Metrics
The Read Ahead Pages statistic represents the number of physical database page read in anticipation of use by SQL Server. If SQL Server senses that database pages are being read in a sequential manner, it will institute a pre-fetch mechanism that moves pages into the buffer cache before they are actually needed by a process.
TIP: Click this statistic to drill down to the Systems I/O tab of the I/O Detail view.
EMBARCADERO TECHNOLOGIES > EMBARCADERO PERFORMANCE CENTER 2.5 EXPERT GUIDE: SQL SERVER 30
MICROSOFT SQL SERVER EXPERT GUIDE > I /O PAGE STATISTICS
MetricsIf data is accessed sequentially (for example, through the use of a clustered index), the read ahead mechanism of SQL Server can increase performance by needed database pages already in the buffer cache before they are actually requested.
However, because the read ahead mechanism is typically triggered by full table or index range scans, if the read ahead pages are actually required to satisfy a user’s query, then performance might actually suffer. In these cases, the judicious use of indexes is a better route to take.
Log Flushes• Metrics
• Troubleshooting
The Log Flushes statistic represents the total number of log pages for all databases written to disk by the log writer process. A log flush occurs when SQL Server writes all changes from the database’s log cache out to the database’s log files on disk.
TIP: Click this statistic to open the Contention performance category view.
MetricsIncreasing numbers observed for log flushes should not cause concern unless the I/O subsystem of the server appears overwhelmed. In addition, to minimize I/O contention between a database and its accompanying log, it is wise to place database files and log files on separate disks.
TroubleshootingIf you have placed a very active database on the same physical file as its log, you can look into moving the log to a separate physical device by adding new log files to a new drive and subsequently removing the old log files when they are not being used.
Log Cache Reads• Metrics
The Log Cache Reads statistic represents the reads performed per second through the log manager cache. Before ever writing transactions to disk, the log manager of SQL Server formats them in memory. This area of memory is known as the log cache and only contains log records for SQL Server 2000 and later. The log writer of SQL Server moves through the log caches when transactions are committed (as well as other events) and flushes each cache out to disk.
MetricsNone.
Checkpoint Pages• Metrics
• Troubleshooting
EMBARCADERO TECHNOLOGIES > EMBARCADERO PERFORMANCE CENTER 2.5 EXPERT GUIDE: SQL SERVER 31
MICROSOFT SQL SERVER EXPERT GUIDE > I /O PAGE STATISTICS
The Checkpoint Pages statistic represents the number of pages flushed to disk per second by a checkpoint or other operation that require all dirty (modified) pages to be flushed.
TIP: Click this statistic to open the Contention performance category view.
MetricsCheckpoint operations are used by SQL Server to minimize the amount of work the server must perform when databases are recovered during system startup. Checkpoints periodically write out modified pages that are found in the buffer cache to disk. Afterwards, SQL Server records the operation in the log to signify that the operation succeeded.
Checkpoints can be explicitly performed by a database owner issuing the checkpoint command. SQL Server also performs checkpoints automatically for databases that have the trunc log on chkpt option set.
Large SQL Servers have the potential to generate lots of checkpoint write operations. Although SQL Server will do what it can to minimize checkpoint activity, you can also set the recovery interval server parameter to influence how often checkpoints should run.
TroubleshootingIf you believe excessive checkpoint activity is occurring, you can take the following steps:
• Set the recovery interval server parameter to a larger value with sp_configure.
• Restart SQL Server so the change will take affect or use the RECONFIGURE option to make the change immediately.
Full Scans• Metrics
• Troubleshooting
The Full Scans statistic represents the total number of full table or index scans per second.
MetricsFull scans occur if a table is inadequately indexed or if SQL Server truly needs to access all rows in a table or index to satisfy a query. Other operations that can cause full scans include UPDATE STATISTICS calls.
Unnecessary scans on large tables is something to avoid, and can be a signal to you as a DBA to investigate the use of more indexes and to review SQL access through EXPLAIN plans. Small table scans are actually a good thing because SQL Server can often cache the entire table in a single I/O operation. Large numbers of index scans are normally desirable too, because it typically indicates the fastest possible resolution to data access requests.
TroubleshootingHere are some methods you can use to avoid unnecessary large table scans:
• Try not to use SQL statements that include the NOT IN, NOT LIKE, <>, IS NULL operators because they typically suppress the use of indexes.
• When referencing concatenated indexes with queries, be sure the leading column in the index is used. If it is not, the index will not be used at all.
• Avoid using functions in WHERE predicates.
EMBARCADERO TECHNOLOGIES > EMBARCADERO PERFORMANCE CENTER 2.5 EXPERT GUIDE: SQL SERVER 32
MICROSOFT SQL SERVER EXPERT GUIDE > I /O PAGE STATISTICS
Range Scans• Metrics
The Range Scans statistic represents the total number of qualified range scans through indexes per second.
MetricsLarge numbers of index scans are normally desirable, because it typically indicates the fastest possible resolution to data access requests is being taken.
Index Searches• Metrics
The Index Searches statistic represents the total number of index searches per second. Index searches are normally used to start range scans, for single index record fetches and can be used to reposition an index.
TIP: Click this statistic to drill down to the Systems I/O tab of the I/O Detail view.
MetricsLarge numbers of index searches are normally desirable because they typically indicate the fastest possible resolution to data access requests is being taken.
Probe Scans• Metrics
The Probe Scans statistic represents the total number of probe scans per second. Probe scans are used in SQL Server to directly find rows in an index or base table.
TIP: Click this statistic to open the Contention performance category view.
MetricsLarge numbers of probe scans are normally desirable, because they typically indicate the fastest possible resolution to data access requests is being taken.
Worktables Created• Metrics
The Worktables Created statistic represents the total number of work tables created per second. Worktables are used many times by SQL Server to perform a logical operation specified in an end user SQL statement. GROUP BY, ORDER BY, or UNION queries can cause worktables to be created as can specific CREATE statements used in Transact SQL processing.
Worktables are built in the tempdb database and are dropped automatically at the end of the statement or procedure run.
TIP: Click this statistic to open the Contention performance category view.
EMBARCADERO TECHNOLOGIES > EMBARCADERO PERFORMANCE CENTER 2.5 EXPERT GUIDE: SQL SERVER 33
MICROSOFT SQL SERVER EXPERT GUIDE > I /O PAGE STATISTICS
MetricsThe only thing to keep in mind with respect to worktables is that the tempdb database should be large enough to hold large worktables.
Forwarded Record Fetches• Metrics
• Troubleshooting
The Forwarded Record Fetches statistic represents the total number of records per second fetched by reading forwarded record pointers.
SQL Server moves rows in a table under certain conditions. One situation might arise when you update a row in a table that has a variable-length column to a larger size that no longer fits on its original page. Another situation would be if SQL Server moves a row when the clustered index column changes.
TIP: Click this statistic to open the Contention performance category view.
MetricsWhen SQL Server creates a forwarding pointer, it remains in place unless one of two things happens. The first is when a row shrinks enough to move back to its original location. The second is when the entire database shrinks. When a database file shrinks, SQL Server reassigns the row identifiers, which are used as the row locators, so the shrink process never generates forwarded rows.
Forwarded records can reduce performance at times because additional I/O is involved to first obtain the record pointer to the relocated row, and then the row itself is read.
TroubleshootingIf consistent numbers are present for Forward Record Fetches, examine your databases to see which tables have forwarded records.
To see the total count of forwarded records in a table, you can enable trace flag 2509, and then execute the DBCC CHECKTABLE command. The output should display the number of forwarded records in that table. Tables with many forwarded records could be candidates for table reorganization.
Server I/O Busy Rate• Metrics
The Server I/O Busy or I/O Busy statistic represents the time in milliseconds that the database server has spent performing input and output operations since the last refresh in Embarcadero Performance Center.
TIP: Click this statistic to drill down to the Systems I/O tab of the I/O Detail view.
MetricsNone.
Session Leaders - I/O• Metrics
EMBARCADERO TECHNOLOGIES > EMBARCADERO PERFORMANCE CENTER 2.5 EXPERT GUIDE: SQL SERVER 34
MICROSOFT SQL SERVER EXPERT GUIDE > I /O PAGE STATISTICS
Heavy I/O activity in a system can indicate that the user connections are contributing somewhat equally to the overall load. More often than not, however, one or two user connections are responsible for 75% or more of the I/O activity. Your system may be running a large batch load or other typical processes, which are perfectly okay. On the other hand, it may be a runaway process or other rogue connection, which you need to track down and possibly eliminate.
The leading I/O session's display lets you see who the leading sessions are in your system with respect to I/O.
NOTE: This statistic displays on both the Users performance category view and the I/O performance category view.
TIP: Click this statistic to drill down to the Systems I/O tab of the I/O Detail view.
TIP: Click an item in the chart to open the Overview tab of the Session Detail view.
MetricsOne or two users consuming more than 75% of the total I/O load can indicate a runaway or improper process. You can drill into the I/O activity of all users and quickly see if this is the case.
Total I/OThe Total I/O statistic represents the total number of physical reads and writes.
MetricsNone.
I/O Error Rate• Metrics
• Troubleshooting
I/O Error Rate reflects total number of I/O errors (errors during read and write operations) encountered by the server since the last refresh inside Performance Center. I/O Error Rate is a percentage based on Total I/O (the sum the physical reads and writes).
TIP: Click this statistic to drill down to the User I/O tab of the I/O Detail view.
MetricsYou should observe few, if any errors.
TroubleshootingIf you notice any errors, you should check the SQL Server error log for details.
I/O Detail ViewThe I/O Detail view includes the following tabbed pages:
• Database I/O
• File I/O
EMBARCADERO TECHNOLOGIES > EMBARCADERO PERFORMANCE CENTER 2.5 EXPERT GUIDE: SQL SERVER 35
MICROSOFT SQL SERVER EXPERT GUIDE > I /O PAGE STATISTICS
• Leading Sessions
• System I/O
• User I/O
System I/O Tab• Metrics
• Troubleshooting
SQL Server performs many system-related I/O functions to keep data moving into and out of the server. The System I/O tab of the I/O Detail view details space-related I/O operations. The table below describes the information available in the System I/O tab:
MetricsIncreasing numbers for extent and page allocation, and freespace operations likely indicates aggressive volumes of data being inserted or modified in SQL Server.
Page splits cause additional overhead in the form of CPU usage and I/O. Observing large numbers of page splits can signal a resource bottleneck in your server.
TroubleshootingTo avoid page splits, you can look into tuning the FILLFACTOR property of an index, which controls the percentage of the index page that is filled during creation. The default, 100, tells SQL Server to completely fill each page, whereas lower numbers tell SQL Server to leave room for additional index rows or updates to existing rows.
Database I/O TabSQL Server performs many system-related I/O functions to keep data moving into and out of the server. The Database I/O tab of the I/O Detail view details maintenance-related I/O operations. The table below describes the information available in the Database I/O tab
Information Description
Pages/Extents Allocated The number of space extents that SQL Server allocated. Rapidly increasing numbers for these statistics indicates that SQL Server is receiving large volumes of incoming data and is allocating space to make room.
Page/Extent Deallocations This indicates that SQL Server is reclaiming space from database objects due to shrinking database volumes.
Freespace Scans The number of scans performed by SQL Server to locate free space for an incoming record.
Page Splits When data is inserted or updated in a table, SQL Server might reorganize the storage of the data in the table's index pages. When an index page becomes full, but a DML operation demands room on that page, SQL Server moves about half the rows to a new page to accommodate the request. This reorganization is known as a page split. Performance for DML actions can be impaired from page split operations. In addition, more index pages can make for longer index scan times.
Information Description
Database The name of the database.
DBCC Logical Scans The number of logical read scan bytes per second caused by DBCC operations.
EMBARCADERO TECHNOLOGIES > EMBARCADERO PERFORMANCE CENTER 2.5 EXPERT GUIDE: SQL SERVER 36
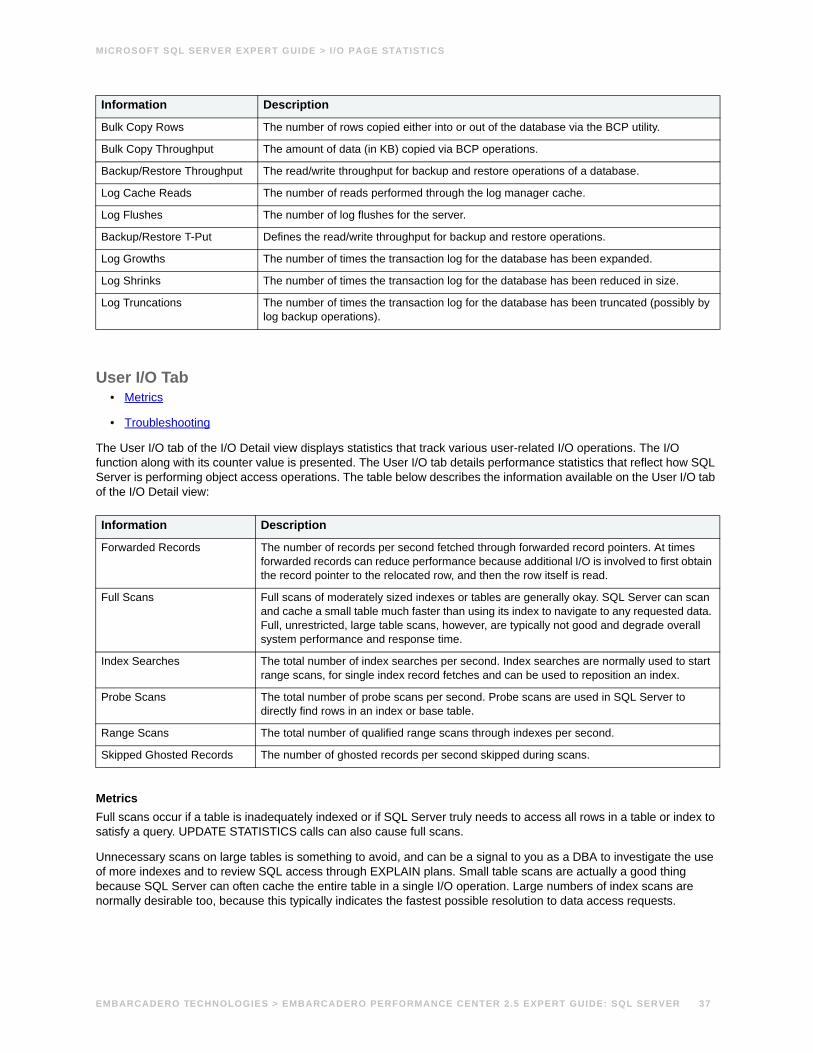
MICROSOFT SQL SERVER EXPERT GUIDE > I /O PAGE STATISTICS
User I/O Tab• Metrics
• Troubleshooting
The User I/O tab of the I/O Detail view displays statistics that track various user-related I/O operations. The I/O function along with its counter value is presented. The User I/O tab details performance statistics that reflect how SQL Server is performing object access operations. The table below describes the information available on the User I/O tab of the I/O Detail view:
MetricsFull scans occur if a table is inadequately indexed or if SQL Server truly needs to access all rows in a table or index to satisfy a query. UPDATE STATISTICS calls can also cause full scans.
Unnecessary scans on large tables is something to avoid, and can be a signal to you as a DBA to investigate the use of more indexes and to review SQL access through EXPLAIN plans. Small table scans are actually a good thing because SQL Server can often cache the entire table in a single I/O operation. Large numbers of index scans are normally desirable too, because this typically indicates the fastest possible resolution to data access requests.
Bulk Copy Rows The number of rows copied either into or out of the database via the BCP utility.
Bulk Copy Throughput The amount of data (in KB) copied via BCP operations.
Backup/Restore Throughput The read/write throughput for backup and restore operations of a database.
Log Cache Reads The number of reads performed through the log manager cache.
Log Flushes The number of log flushes for the server.
Backup/Restore T-Put Defines the read/write throughput for backup and restore operations.
Log Growths The number of times the transaction log for the database has been expanded.
Log Shrinks The number of times the transaction log for the database has been reduced in size.
Log Truncations The number of times the transaction log for the database has been truncated (possibly by log backup operations).
Information Description
Forwarded Records The number of records per second fetched through forwarded record pointers. At times forwarded records can reduce performance because additional I/O is involved to first obtain the record pointer to the relocated row, and then the row itself is read.
Full Scans Full scans of moderately sized indexes or tables are generally okay. SQL Server can scan and cache a small table much faster than using its index to navigate to any requested data. Full, unrestricted, large table scans, however, are typically not good and degrade overall system performance and response time.
Index Searches The total number of index searches per second. Index searches are normally used to start range scans, for single index record fetches and can be used to reposition an index.
Probe Scans The total number of probe scans per second. Probe scans are used in SQL Server to directly find rows in an index or base table.
Range Scans The total number of qualified range scans through indexes per second.
Skipped Ghosted Records The number of ghosted records per second skipped during scans.
Information Description
EMBARCADERO TECHNOLOGIES > EMBARCADERO PERFORMANCE CENTER 2.5 EXPERT GUIDE: SQL SERVER 37
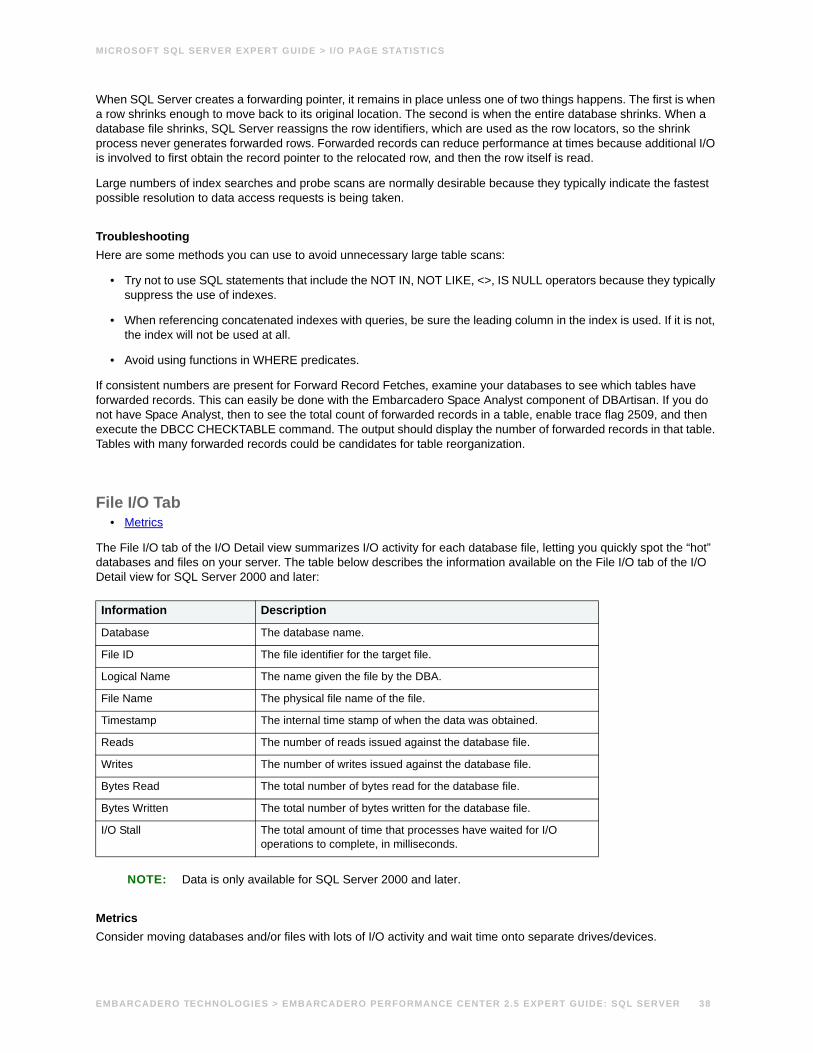
MICROSOFT SQL SERVER EXPERT GUIDE > I /O PAGE STATISTICS
When SQL Server creates a forwarding pointer, it remains in place unless one of two things happens. The first is when a row shrinks enough to move back to its original location. The second is when the entire database shrinks. When a database file shrinks, SQL Server reassigns the row identifiers, which are used as the row locators, so the shrink process never generates forwarded rows. Forwarded records can reduce performance at times because additional I/O is involved to first obtain the record pointer to the relocated row, and then the row itself is read.
Large numbers of index searches and probe scans are normally desirable because they typically indicate the fastest possible resolution to data access requests is being taken.
TroubleshootingHere are some methods you can use to avoid unnecessary large table scans:
• Try not to use SQL statements that include the NOT IN, NOT LIKE, <>, IS NULL operators because they typically suppress the use of indexes.
• When referencing concatenated indexes with queries, be sure the leading column in the index is used. If it is not, the index will not be used at all.
• Avoid using functions in WHERE predicates.
If consistent numbers are present for Forward Record Fetches, examine your databases to see which tables have forwarded records. This can easily be done with the Embarcadero Space Analyst component of DBArtisan. If you do not have Space Analyst, then to see the total count of forwarded records in a table, enable trace flag 2509, and then execute the DBCC CHECKTABLE command. The output should display the number of forwarded records in that table. Tables with many forwarded records could be candidates for table reorganization.
File I/O Tab• Metrics
The File I/O tab of the I/O Detail view summarizes I/O activity for each database file, letting you quickly spot the “hot” databases and files on your server. The table below describes the information available on the File I/O tab of the I/O Detail view for SQL Server 2000 and later:
NOTE: Data is only available for SQL Server 2000 and later.
MetricsConsider moving databases and/or files with lots of I/O activity and wait time onto separate drives/devices.
Information Description
Database The database name.
File ID The file identifier for the target file.
Logical Name The name given the file by the DBA.
File Name The physical file name of the file.
Timestamp The internal time stamp of when the data was obtained.
Reads The number of reads issued against the database file.
Writes The number of writes issued against the database file.
Bytes Read The total number of bytes read for the database file.
Bytes Written The total number of bytes written for the database file.
I/O Stall The total amount of time that processes have waited for I/O operations to complete, in milliseconds.
EMBARCADERO TECHNOLOGIES > EMBARCADERO PERFORMANCE CENTER 2.5 EXPERT GUIDE: SQL SERVER 38
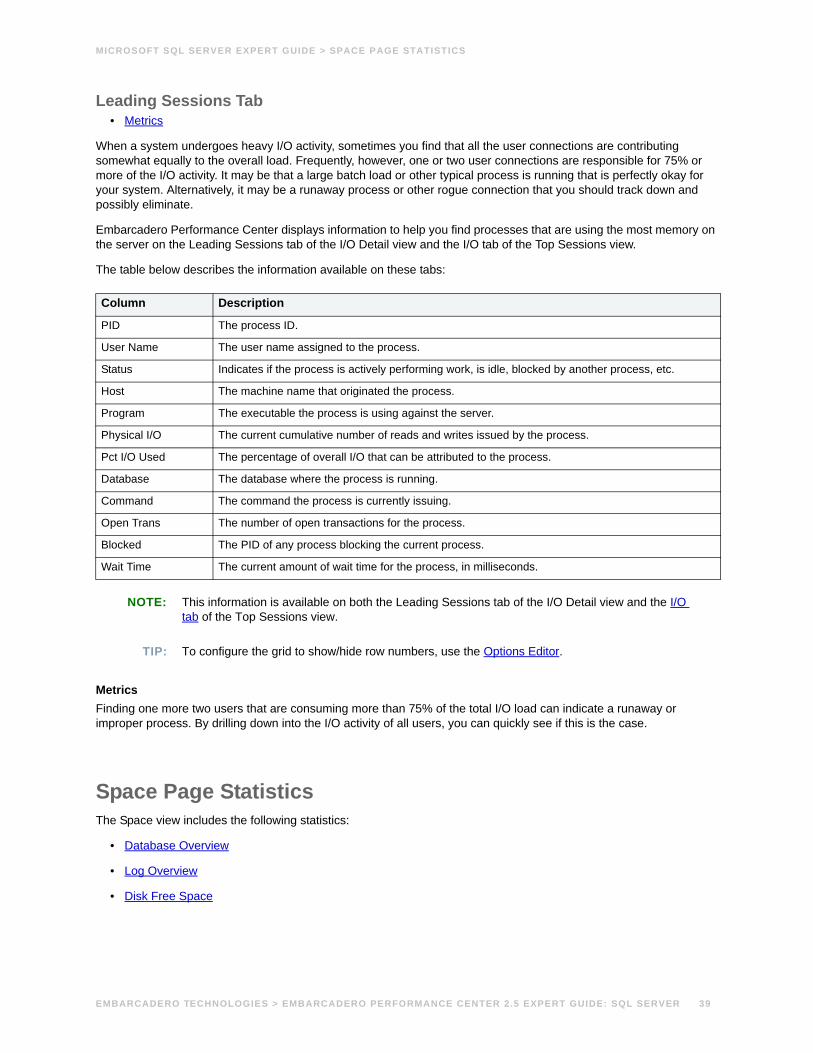
MICROSOFT SQL SERVER EXPERT GUIDE > SPACE PAGE STATISTICS
Leading Sessions Tab• Metrics
When a system undergoes heavy I/O activity, sometimes you find that all the user connections are contributing somewhat equally to the overall load. Frequently, however, one or two user connections are responsible for 75% or more of the I/O activity. It may be that a large batch load or other typical process is running that is perfectly okay for your system. Alternatively, it may be a runaway process or other rogue connection that you should track down and possibly eliminate.
Embarcadero Performance Center displays information to help you find processes that are using the most memory on the server on the Leading Sessions tab of the I/O Detail view and the I/O tab of the Top Sessions view.
The table below describes the information available on these tabs:
NOTE: This information is available on both the Leading Sessions tab of the I/O Detail view and the I/O tab of the Top Sessions view.
TIP: To configure the grid to show/hide row numbers, use the Options Editor.
MetricsFinding one more two users that are consuming more than 75% of the total I/O load can indicate a runaway or improper process. By drilling down into the I/O activity of all users, you can quickly see if this is the case.
Space Page StatisticsThe Space view includes the following statistics:
• Database Overview
• Log Overview
• Disk Free Space
Column Description
PID The process ID.
User Name The user name assigned to the process.
Status Indicates if the process is actively performing work, is idle, blocked by another process, etc.
Host The machine name that originated the process.
Program The executable the process is using against the server.
Physical I/O The current cumulative number of reads and writes issued by the process.
Pct I/O Used The percentage of overall I/O that can be attributed to the process.
Database The database where the process is running.
Command The command the process is currently issuing.
Open Trans The number of open transactions for the process.
Blocked The PID of any process blocking the current process.
Wait Time The current amount of wait time for the process, in milliseconds.
EMBARCADERO TECHNOLOGIES > EMBARCADERO PERFORMANCE CENTER 2.5 EXPERT GUIDE: SQL SERVER 39
MICROSOFT SQL SERVER EXPERT GUIDE > SPACE PAGE STATISTICS
Related TopicsSpace Detail View
Home View Statistics
Database Page Statistics
Contention Statistics
I/O Page Statistics
Memory Page Statistics
Network Statistics
OS Page Statistics
Top SQL Page Statistics
Users Page Statistics
Disk Free Space• Metrics
• Troubleshooting
The Disk Free Space statistic provides a summary of the total database and log space used per server disk drive, as well as a summary of free disk space for each server drive.
MetricsIf any database or transaction log file has been set up to automatically grow, the DBA should ensure there is enough server disk space to accommodate any new, additional requests for space.
TroubleshootingIf you see any drive that has reached zero free space (or is close), you might want to add new files, on other disks with abundant free space, to any databases or transaction logs so that no out-of-space errors result.
Database Overview• Metrics
• Troubleshooting
A SQL server contains many databases, some of which are devoted to system-level activities (the master and tempdb databases, for example) and others that hold user data. The Databases Low on Space statistic represents a count of databases that have fallen below the Performance Center recommended free space limit.
TIP: Click this category heading to drill down to the Fragmentation tab of the Space Detail view.
MetricsIf a database’s free space goes below the Performance Center recommended threshold, (and either the database or transaction log does not have their automatic growth property enabled or the files have reached their growth limit) then the DBA should take action to ensure that the database or transaction log does not run out of available free space.
EMBARCADERO TECHNOLOGIES > EMBARCADERO PERFORMANCE CENTER 2.5 EXPERT GUIDE: SQL SERVER 40
MICROSOFT SQL SERVER EXPERT GUIDE > SPACE PAGE STATISTICS
TroubleshootingIf the percent used amount of a database is approaching problematic levels, then there are three ways a DBA can rectify the situation:
1 The DBA can resize the current file(s) used by the database via an ALTER DATABASE … MODIFY FILE command.
2 The DBA can add a new file to the database via the ALTER DATABASE … ADD FILE command.
3 The DBA can modify the file(s) used by the database to automatically grow by using the ALTER DATABASE … MODIFY FILE … FILEGROWTH command. You should also ensure that the MAXSIZE setting of each file is set appropriately.
Of course, the DBA should also ensure that enough physical space exists on the server to accommodate additional database space.
Log Overview• Metrics
• Troubleshooting
A SQL server contains many databases, some of which are devoted to system-level activities (the master and tempdb databases, for example) and others that hold user data. The Log Overview statistic represents a count of database transaction logs that have fallen below the Performance Center recommended free space limit.
MetricsIf a database’s transaction log free space goes below the Performance Center recommended threshold, (and the transaction log does not have their automatic growth property enabled or the files have reached their growth limit) then the DBA should take action to ensure that the transaction log does not run out of available free space.
TroubleshootingThere are several things a DBA can do to ensure that a database’s log does not run out of available free space:
1 First, most transactional-oriented databases should have their logs assigned to a separate physical drive than the database. Reasons for doing so include:
• It prevents competition for space between the log and the database itself.
• It allows the log to be monitored for space more effectively.
• It improves performance.
2 If the database is not critical in nature, you can set the truncate log on checkpoint option (trunc log on chkpt), which will eliminate any non-active space in the log when a database checkpoint occurs.
3 Critical databases needing higher levels of recovery should have schedules established that regular perform transaction log dumps. Doing so ensures better recovery scenarios as well as a reduced risk of the transaction log running out of space.
4 If a critical transaction log becomes full, it might be impossible to use standard procedures to dump transactions and reclaim space. The dump operation will likely have to incorporate the no log or truncate only options.
5 If a transaction log continuously approaches dangerously low levels of free space, then the DBA should allow the underlying file(s) of the log to automatically grow to meet the demand. This can be accomplished by using the ALTER DATABASE … MODIFY FILE … FILEGROWTH command. You should also ensure that the MAXSIZE setting for each file is set appropriately.
EMBARCADERO TECHNOLOGIES > EMBARCADERO PERFORMANCE CENTER 2.5 EXPERT GUIDE: SQL SERVER 41
MICROSOFT SQL SERVER EXPERT GUIDE > SPACE PAGE STATISTICS
The DBA should also be on the lookout for large load or data modification operations that do not make use of prudently timed commit points. A single, large transaction has the ability to overwhelm any transaction log since only non-active space in the transaction log is removed from log dumps or truncation operations.
Space Detail ViewThe Space Detail view includes the following tabbed pages:
• Disk Space
• Indexes
• File Groups/Files
• Fragmentation
• Tables
• Virtual Log Files
File Groups/Files Tab• Metrics
• Troubleshooting
SQL Server manages physical storage space through files and file groups. The file groups tab displays detailed information regarding storage usage in each of the SQL Server file groups.The File Groups/Files tab of the Space Detail view displays space measures for the file groups and files of a particular database. The first grid presents file group information and the second grid displays data for the individual files in a database. The table below describes the information available in the File Group Summary grid on the File Group/Files tab of the Space Detail view:
The table below describes the information available in the Files Summary section of the Files tabin the File Summary grid on the File Group/Files tab of the Space Detail view:
Information Description
File Group The name of the file group.
Files The number of files that make up the file group.
Size (MB) The total physical size of the file group.
Table Reserved The amount of reserved space consumed by tables.
Index Reserved The amount of reserved space consumed by indexes.
Information Description
Logical Name The nickname given to the file by the DBA.
File Group The name of the file group.
File Name The physical name of the file.
File Name The name and location of the file.
Size (MB) The total physical size of the file.
Growth This indicates if the file can automatically grow in size.
Growth Amount This indicates how much the file will grow in size.
EMBARCADERO TECHNOLOGIES > EMBARCADERO PERFORMANCE CENTER 2.5 EXPERT GUIDE: SQL SERVER 42
MICROSOFT SQL SERVER EXPERT GUIDE > SPACE PAGE STATISTICS
MetricsUnless space is tight on a server, it is normally wise practice to allow your files to automatically grow to meet demand for more incoming data. It is also smart to physically separate your database and log files onto separate physical drives.
TroubleshootingTo let your files automatically grow until out of space, you can easily do this by setting the file's growth option in Embarcadero’s DBArtisan or Embarcadero’s Rapid SQL, or by using the ALTER DATABASE... MODIFY FILE command.
Virtual Log Files Tab• Metrics
The Virtual Log Files tab of the Space Detail view displays an internal structure of sorts for a each database's log. The presented information is helpful when trying to shrink a database's log because you can see how much of the log is active and exactly where the active portion resides. The table below describes the information available on the Virtual Log Files tab of the Space Detail view:
MetricsNone.
Tables Tab• Metrics
Tables and indexes consume the storage in all databases. The Tables tab displays summary information regarding table and index storage for all databases.
The Tables tab of the Space Detail view displays the space details for tables in a selected database. The table below describes the information available on the Tables tab of the Space Detail view:
Max Size This indicates the maximum file size that the file can grow.
Total Extents The total number of extents taken up by the file.
Used Extents The actual number of used extents in the file.
Information Description
Database Name The name of database.
File Name The name of the log file.
Status This indicates if this portion of the log is active or inactive (not being used).
Size The size of this portion of the log in MBs.
Column Description
Owner The owner of the table.
Table Name The name of the table.
File Group The file group where the table resides.
Information Description
EMBARCADERO TECHNOLOGIES > EMBARCADERO PERFORMANCE CENTER 2.5 EXPERT GUIDE: SQL SERVER 43
MICROSOFT SQL SERVER EXPERT GUIDE > SPACE PAGE STATISTICS
MetricsNegative numbers viewed for index space information can be caused by inaccuracies contained in the SQL Server data dictionary. Frequently, running a DBCC UPDATEUSAGE command against the database resolves the problem. However, there are bugs in SQL Server that sometimes caused erroneous numbers to the reported for the reserved space amounts used by tables and indexes.
Indexes Tab• Metrics
Tables and indexes consume the storage in all databases. The Database Object Detail grid displays object space details for the database selected in the Database Object Summary grid.
The Indexes tab of the Space Detail view displays the space details for indexes in a selected database. The table below describes the information available on the Indexes tab of the Space Detail view:
MetricsNegative numbers viewed for index space information can be caused by inaccuracies contained in the SQL Server data dictionary. Frequently, running a DBCC UPDATEUSAGE command against the database resolves the problem. However, there are bugs in SQL Server that sometimes caused erroneous numbers to the reported for the reserved space amounts used by tables and indexes.
Fragmentation Tab• Metrics
• Troubleshooting
Rows The number of rows in the table.
Reserved (KB) The amount of space reserved for the table in kilobytes.
Used (KB) The amount of space the table is using.
Free (KB) The amount of free space that the table possesses.
% of Database The percentage of the database that the table consumes.
Information Description
Table Name The owner/table that is the parent of the index.
Index Name The name of the index.
Index Type The type of index (clustered, etc.)
File Group The file group where the object resides.
Reserved (KB) The amount of space reserved by the object in kilobytes.
Used (KB) The amount of space used by the object in kilobytes.
Free (KB) The amount of free space used by the object in kilobytes.
% of Database The percentage of the database that the index consumes.
Column Description
EMBARCADERO TECHNOLOGIES > EMBARCADERO PERFORMANCE CENTER 2.5 EXPERT GUIDE: SQL SERVER 44
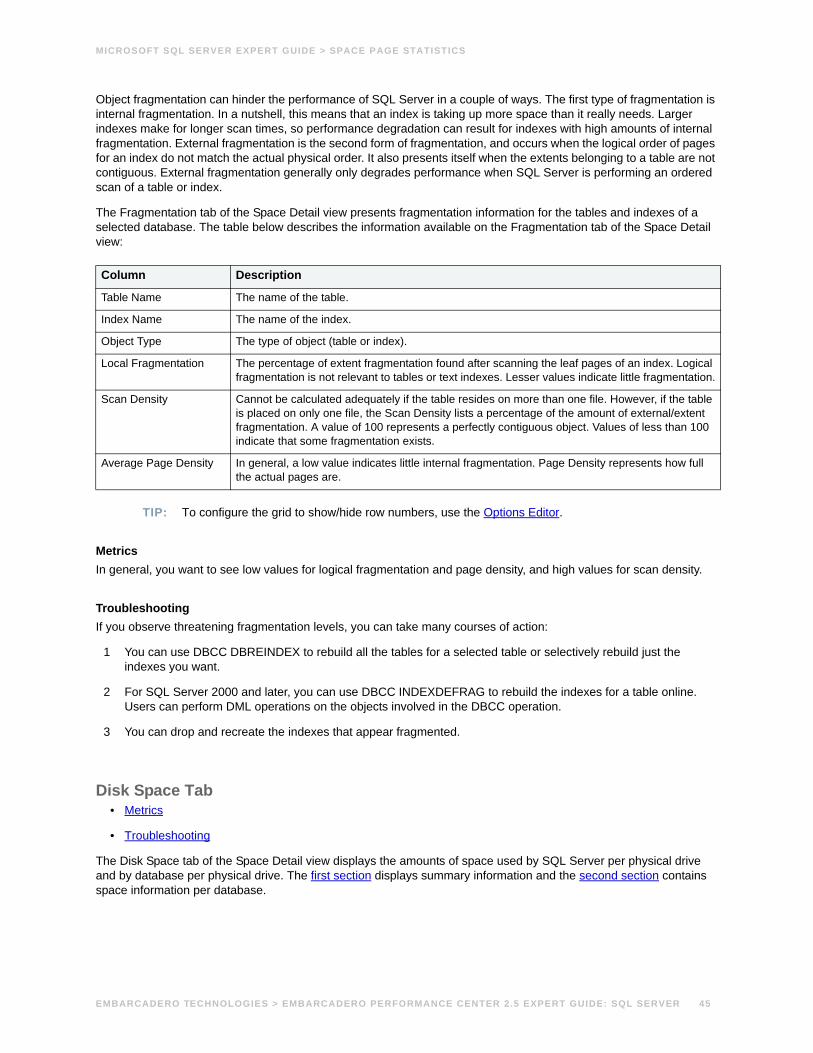
MICROSOFT SQL SERVER EXPERT GUIDE > SPACE PAGE STATISTICS
Object fragmentation can hinder the performance of SQL Server in a couple of ways. The first type of fragmentation is internal fragmentation. In a nutshell, this means that an index is taking up more space than it really needs. Larger indexes make for longer scan times, so performance degradation can result for indexes with high amounts of internal fragmentation. External fragmentation is the second form of fragmentation, and occurs when the logical order of pages for an index do not match the actual physical order. It also presents itself when the extents belonging to a table are not contiguous. External fragmentation generally only degrades performance when SQL Server is performing an ordered scan of a table or index.
The Fragmentation tab of the Space Detail view presents fragmentation information for the tables and indexes of a selected database. The table below describes the information available on the Fragmentation tab of the Space Detail view:
TIP: To configure the grid to show/hide row numbers, use the Options Editor.
MetricsIn general, you want to see low values for logical fragmentation and page density, and high values for scan density.
TroubleshootingIf you observe threatening fragmentation levels, you can take many courses of action:
1 You can use DBCC DBREINDEX to rebuild all the tables for a selected table or selectively rebuild just the indexes you want.
2 For SQL Server 2000 and later, you can use DBCC INDEXDEFRAG to rebuild the indexes for a table online. Users can perform DML operations on the objects involved in the DBCC operation.
3 You can drop and recreate the indexes that appear fragmented.
Disk Space Tab• Metrics
• Troubleshooting
The Disk Space tab of the Space Detail view displays the amounts of space used by SQL Server per physical drive and by database per physical drive. The first section displays summary information and the second section contains space information per database.
Column Description
Table Name The name of the table.
Index Name The name of the index.
Object Type The type of object (table or index).
Local Fragmentation The percentage of extent fragmentation found after scanning the leaf pages of an index. Logical fragmentation is not relevant to tables or text indexes. Lesser values indicate little fragmentation.
Scan Density Cannot be calculated adequately if the table resides on more than one file. However, if the table is placed on only one file, the Scan Density lists a percentage of the amount of external/extent fragmentation. A value of 100 represents a perfectly contiguous object. Values of less than 100 indicate that some fragmentation exists.
Average Page Density In general, a low value indicates little internal fragmentation. Page Density represents how full the actual pages are.
EMBARCADERO TECHNOLOGIES > EMBARCADERO PERFORMANCE CENTER 2.5 EXPERT GUIDE: SQL SERVER 45
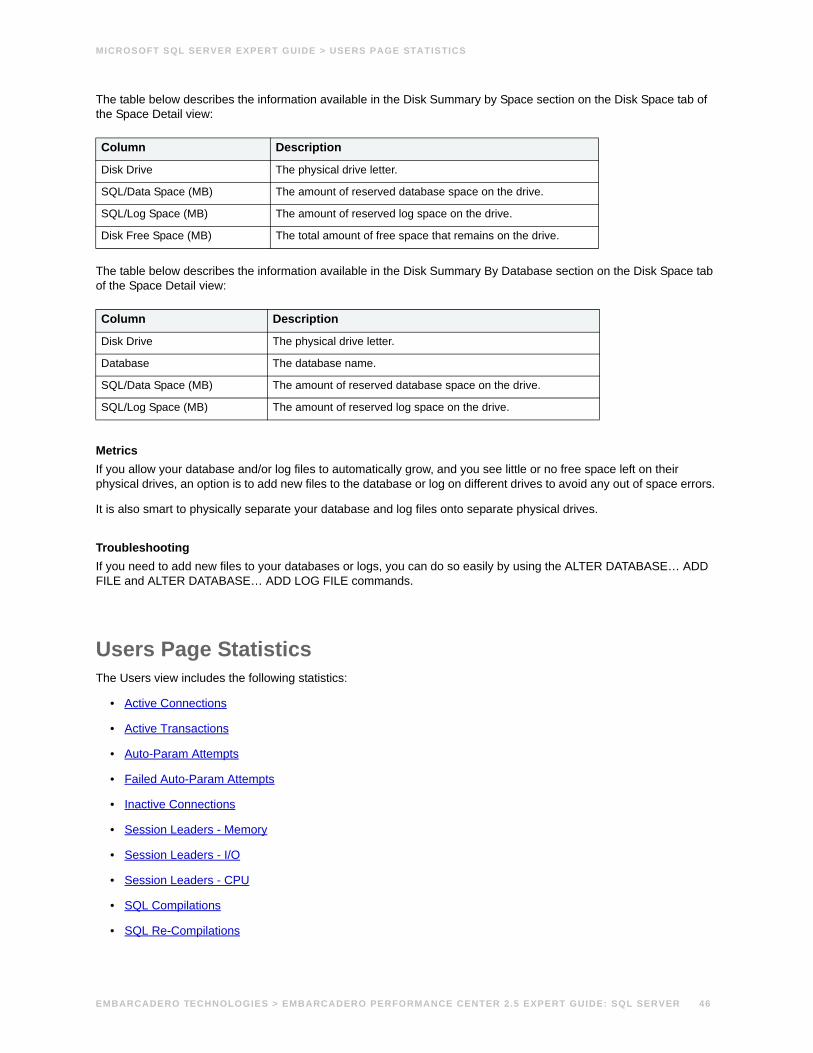
MICROSOFT SQL SERVER EXPERT GUIDE > USERS PAGE STATISTICS
The table below describes the information available in the Disk Summary by Space section on the Disk Space tab of the Space Detail view:
The table below describes the information available in the Disk Summary By Database section on the Disk Space tab of the Space Detail view:
MetricsIf you allow your database and/or log files to automatically grow, and you see little or no free space left on their physical drives, an option is to add new files to the database or log on different drives to avoid any out of space errors.
It is also smart to physically separate your database and log files onto separate physical drives.
TroubleshootingIf you need to add new files to your databases or logs, you can do so easily by using the ALTER DATABASE… ADD FILE and ALTER DATABASE… ADD LOG FILE commands.
Users Page StatisticsThe Users view includes the following statistics:
• Active Connections
• Active Transactions
• Auto-Param Attempts
• Failed Auto-Param Attempts
• Inactive Connections
• Session Leaders - Memory
• Session Leaders - I/O
• Session Leaders - CPU
• SQL Compilations
• SQL Re-Compilations
Column Description
Disk Drive The physical drive letter.
SQL/Data Space (MB) The amount of reserved database space on the drive.
SQL/Log Space (MB) The amount of reserved log space on the drive.
Disk Free Space (MB) The total amount of free space that remains on the drive.
Column Description
Disk Drive The physical drive letter.
Database The database name.
SQL/Data Space (MB) The amount of reserved database space on the drive.
SQL/Log Space (MB) The amount of reserved log space on the drive.
EMBARCADERO TECHNOLOGIES > EMBARCADERO PERFORMANCE CENTER 2.5 EXPERT GUIDE: SQL SERVER 46
MICROSOFT SQL SERVER EXPERT GUIDE > USERS PAGE STATISTICS
• System Connections
• T-SQL Batches
• Total Connections
• Users Blocked
Related TopicsUsers Detail View
Home View Statistics
Database Page Statistics
Contention Statistics
I/O Page Statistics
Memory Page Statistics
Network Statistics
OS Page Statistics
Space Page Statistics
Top SQL Page Statistics
Total Connections• Metrics
• Troubleshooting
Every connection to SQL Server spawns one or more processes, each uniquely identified by what SQL Server calls a SPID. The Total Connections display shows the number of user and system processes currently reported in the SQL Server instance. This number includes both active and inactive processes.
TIP: Click this statistic to drill down to the Processes tab of the Users Detail view.
MetricsYou should view the total number of connections in light of the maximum number of processes allowed to connect to SQL Server. The user connections parameter specifies the maximum number of user processes that can simultaneously connect to a SQL Server instance.
TroubleshootingIf the total number of connections approaches the number of user connections limit then:
1 Edit the configuration file for SQL Server.
2 Increase the amount of user connections to a higher value.
3 Cycle SQL Server when possible to allow the new value to take effect.
EMBARCADERO TECHNOLOGIES > EMBARCADERO PERFORMANCE CENTER 2.5 EXPERT GUIDE: SQL SERVER 47
MICROSOFT SQL SERVER EXPERT GUIDE > USERS PAGE STATISTICS
Active Transactions• Metrics
The active transactions statistic represents a count of the number of in-process transactions for SQL Server.
TIP: Click this statistic to drill down to the Processes tab of the Users Detail view.
MetricsNone.
T-SQLBatches• Metrics
The T-SQL batches statistic refers to the number of transact SQL batches processed by SQL Server.
MetricsNone.
Active Connections• Metrics
The Active Connections statistic represents the total number of active and open threads reported on the server. This number displays the number of processes actively performing work.
TIP: Click this statistic to drill down to the Processes tab of the Users Detail view.
MetricsNone.
Inactive Connections• Metrics
The Inactive Connections statistic represents the total number of threads logged on to the server that are idle at the current time.
TIP: Click this statistic to drill down to the Processes tab of the Users Detail view.
MetricsNone.
System Connections• Metrics
EMBARCADERO TECHNOLOGIES > EMBARCADERO PERFORMANCE CENTER 2.5 EXPERT GUIDE: SQL SERVER 48
MICROSOFT SQL SERVER EXPERT GUIDE > USERS PAGE STATISTICS
The System Connections statistic represents the total number of threads logged on to the server that are SQL Server internal processes.
TIP: Click this statistic to drill down to the Processes tab of the Users Detail view.
MetricsNone.
• Troubleshooting
SQL Compilations• Metrics
• Troubleshooting
The number of SQL compilations performed per second, indicating the number of times the compile code path is entered. This also includes compiles due to recompiles. When SQL Server user activity levels become stable, this value reaches a steady state.
MetricsBecause compilation is a significant part of a query's turnaround time, you should strive to have as many compilations stored in the cache as possible. If this number does not stabilize in direct proportion to user activity stabilizing, you should investigate your SQL Cache to see if it has adequate memory assigned to it.
TroubleshootingIf you discover that the SQL Cache area is undersized, first ensure SQL Server is configured to use as much physical memory as possible by checking the Max Server Memory configuration option. Also, consider increasing your SQL Server Min Memory parameter to allocate more memory to SQL Server. (Note that to obtain optimal values for these parameters, one option is to install more physical RAM to your server.) Check for any large objects that are pinned in memory that could possibly be removed.
SQL Re-Compilations• Metrics
• Troubleshooting
The SQL re-compilations statistic represents the total number of recompiles triggered per second in a SQL Server instance. Recompiles occur when SQL Server determines that the currently defined execution plan for an executing stored procedure might no longer be the best possible plan. SQL Server pauses the query execution and recompiles the stored procedure.
MetricsRecompiles slow down the process that is executing the procedure and increase the load on the CPU. By extension, the more recompiles that are occurring on your system, the more overall load increases, resulting in poor performance. In general, you want to keep the number of recompiles low. The most common reasons SQL Server would issue a recompile are: Running sp_recompile against any table referenced in the stored procedure, significant data changes in a referenced table, schema changes to referenced objects, the use of the WITH RECOMPILE clause in the CREATE PROCEDURE or EXECUTE statement, and a plan no longer available in the system cache.
EMBARCADERO TECHNOLOGIES > EMBARCADERO PERFORMANCE CENTER 2.5 EXPERT GUIDE: SQL SERVER 49
MICROSOFT SQL SERVER EXPERT GUIDE > USERS PAGE STATISTICS
TroubleshootingTry to practice coding standards that eliminate the most frequent causes detailed above. Also, try to:
• Use temporary tables only in the stored procedure that created them.
• Minimize creating temporary tables in control block structures.
• Use the KEEP PLAN option on references to static temporary tables.
• Issue the CREATE TABLE statement before any other references to the created table.
• Minimize the use of temporary tables.
Auto-Param Attempts• Metrics
• Troubleshooting
Auto-parameterization occurs when an instance of SQL Server attempts to reuse a cached plan for a previously executed query that is similar to, but not the same as, the current query. This statistic shows the number of auto-parameterization attempts per second and includes failed, safe, and unsafe auto-parameterizations.
MetricsSQL Server's ability to match new SQL statements with existing, unused execution plans is increased when parameters or parameter markers are used in Transact-SQL statements. If an SQL statement is executed without parameters, SQL Server parameterizes the statement internally to increase the possibility of matching it against an existing execution plan. A high number for this statistic shows that SQL Server is efficiently reusing existing cached plans.
TroubleshootingYou can increase the ability of the relational engine to match complex SQL statements to existing, unused execution plans, by explicitly specify the parameters using either sp_executesql or parameter markers in your T-SQL code.
Failed Auto-Param Attempts• Metrics
• Troubleshooting
Auto-parameterization occurs when an instance of SQL Server attempts to reuse a cached plan for a previously executed query that is similar to, but not the same as, the current query. The Failed Auto-Param Attempts statistic shows the number of failed auto-parameterization attempts per second.
MetricsSQL Server's ability to match new SQL statements with existing, unused execution plans increases when parameters or parameter markers are used in Transact-SQL statements. If an SQL statement is executed without parameters, SQL Server parameterizes the statement internally to increase the possibility of matching it against an existing execution plan. A small number for this statistic shows that SQL Server is efficiently reusing existing cached plans.
TroubleshootingYou can increase the ability of the relational engine to match complex SQL statements to existing, unused execution plans, by explicitly specify the parameters using either sp_executesql or parameter markers in your T-SQL code. Doing so helps lower this number.
EMBARCADERO TECHNOLOGIES > EMBARCADERO PERFORMANCE CENTER 2.5 EXPERT GUIDE: SQL SERVER 50
MICROSOFT SQL SERVER EXPERT GUIDE > USERS PAGE STATISTICS
Users Blocked• Metrics
• Troubleshooting
A single blocking user has the potential to stop work for nearly all other processes on a small system, and can cause major headaches even on large systems. Blocks are most often caused by user processes holding exclusive locks and not releasing them via a proper COMMIT frequency. Unless a process times out via an application timeout mechanism, or the process has specified a timeout period via the SET LOCK_TIMEOUT command, a process waiting for a lock will wait indefinitely.
TIP: Click this statistic to drill down to the Processes tab of the Users Detail view.
MetricsYou should immediately investigate any indicator above zero, before the situation has a chance to mushroom. If this number is consistently greater than zero, investigate by using the Blocking Locks tab of the Locks view.
TroubleshootingOnce discovered, a blocking lock situation can normally be quickly remedied - the DBA issues a KILL against the offending process, which eliminates the user's stranglehold on the objects they were accessing. Other user processes then almost always complete in an instant. Discovering the blocked lock situation is made easier by using tools like Performance Center, but preventing the blocking lock situation in the first place is where it gets tricky. The DBA can drill down into user detail and view all current blocking locks to see exactly which sessions are holding the currently restrictive locks.
The culprit of blocking lock scenarios is usually the application design, or the SQL being used within the application itself. Properly coding an application to reference database objects in an efficient order, and then using the right SQL to get the job done, is an art. The key to avoiding lock contention is to process user transactions in the quickest and most efficient manner possible - something not always easy to do.
By default, all processes wait indefinitely for locks in SQL Server. You can change this behavior by using the SET LOCK_TIMEOUT command, which limits the number of seconds that a process will wait for a lock before timing out.
Session Leaders - Memory• Metrics
• Troubleshooting
It is not uncommon for one or two users to cause the majority of runtime problems that plague a database. The problem could be a runaway process, an untuned batch procedure, or other user-initiated operation. Frequently, user connections can get out of hand with memory consumption, and extreme cases have caused headaches at both the database and operating system levels.
The leading memory session's display identifies the top users in the server with respect to memory consumption.
NOTE: This statistic displays on both the Memory performance category view and the Users performance category view.
MetricsIf your SQL Server machine does not have an overabundance of memory, you should periodically check to see who your heavy memory users are along with the total percentage of memory each takes up. If you see one or two users who have more than 5-15% of the total memory usage, you should investigate the sessions further to see what activities they are performing.
EMBARCADERO TECHNOLOGIES > EMBARCADERO PERFORMANCE CENTER 2.5 EXPERT GUIDE: SQL SERVER 51
MICROSOFT SQL SERVER EXPERT GUIDE > USERS PAGE STATISTICS
TroubleshootingYou can use the Session Leaders - Memory statistic to find the users with the greatest current allocations of overall memory. Runaway processes can be immediately terminated from within the Embarcadero Performance Center Client.
Session Leaders - I/O• Metrics
When a system undergoes heavy I/O activity, sometimes you finds that all the user connections are contributing somewhat equally to the overall load. More often than not, however, one or two user connections are responsible for 75% or more of the I/O activity. This may be because It may be that a large batch load or other typical process is running that is perfectly okay for your system. Or it may be a runaway process or other rogue connection that needs to be tracked down and possibly eliminated.
The leading I/O session's display allows you to see who runs the leading sessions in your system with respect to I/O.
NOTE: This statistic displays on both the I/O performance category view and the Users performance category view.
TIP: Click this statistic to drill down to the Leading Sessions tab of the I/O Detail view.
MetricsFinding one more two users that are consuming more than 75% of the total I/O load can indicate a runaway or improper process. By drilling down into the I/O activity of all users, you can quickly see if this is the case.
Session Leaders - CPU• Metrics
It is not uncommon for one or two users to cause the majority of runtime problems that plague a database. The problem could be a runaway process, an untuned batch procedure, or other user-initiated operation. Often, user connections can get out of hand with CPU use, and extreme cases have caused headaches at both the database and operating system levels.
The leading CPU session's display allows you to see who runs the leading sessions are in your system with respect to CPU usage.
MetricsFinding one or two users who use the majority of the CPU can indicate runaway or improper processes. By drilling down into the CPU activity of all users, you can quickly see if this is the case.
Users Detail ViewThe Users view Detail includes the following tabbed pages:
• All Locks
• Blocking Locks
• Processes
EMBARCADERO TECHNOLOGIES > EMBARCADERO PERFORMANCE CENTER 2.5 EXPERT GUIDE: SQL SERVER 52
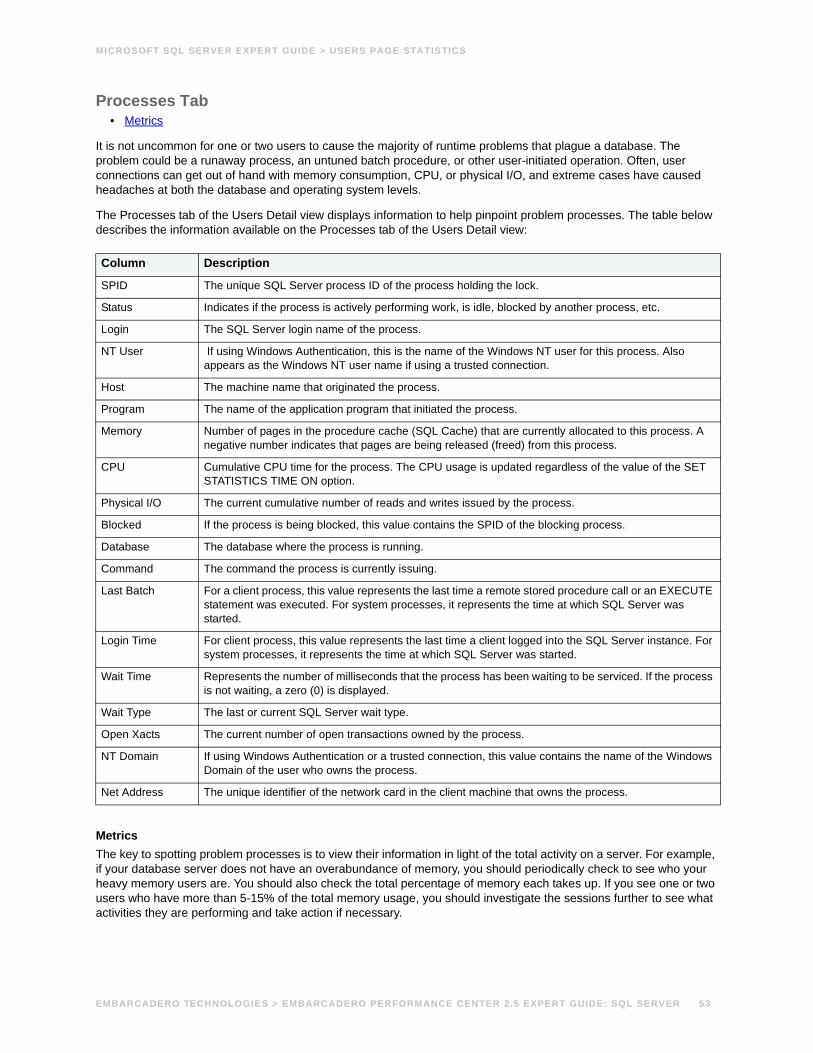
MICROSOFT SQL SERVER EXPERT GUIDE > USERS PAGE STATISTICS
Processes Tab• Metrics
It is not uncommon for one or two users to cause the majority of runtime problems that plague a database. The problem could be a runaway process, an untuned batch procedure, or other user-initiated operation. Often, user connections can get out of hand with memory consumption, CPU, or physical I/O, and extreme cases have caused headaches at both the database and operating system levels.
The Processes tab of the Users Detail view displays information to help pinpoint problem processes. The table below describes the information available on the Processes tab of the Users Detail view:
MetricsThe key to spotting problem processes is to view their information in light of the total activity on a server. For example, if your database server does not have an overabundance of memory, you should periodically check to see who your heavy memory users are. You should also check the total percentage of memory each takes up. If you see one or two users who have more than 5-15% of the total memory usage, you should investigate the sessions further to see what activities they are performing and take action if necessary.
Column Description
SPID The unique SQL Server process ID of the process holding the lock.
Status Indicates if the process is actively performing work, is idle, blocked by another process, etc.
Login The SQL Server login name of the process.
NT User If using Windows Authentication, this is the name of the Windows NT user for this process. Also appears as the Windows NT user name if using a trusted connection.
Host The machine name that originated the process.
Program The name of the application program that initiated the process.
Memory Number of pages in the procedure cache (SQL Cache) that are currently allocated to this process. A negative number indicates that pages are being released (freed) from this process.
CPU Cumulative CPU time for the process. The CPU usage is updated regardless of the value of the SET STATISTICS TIME ON option.
Physical I/O The current cumulative number of reads and writes issued by the process.
Blocked If the process is being blocked, this value contains the SPID of the blocking process.
Database The database where the process is running.
Command The command the process is currently issuing.
Last Batch For a client process, this value represents the last time a remote stored procedure call or an EXECUTE statement was executed. For system processes, it represents the time at which SQL Server was started.
Login Time For client process, this value represents the last time a client logged into the SQL Server instance. For system processes, it represents the time at which SQL Server was started.
Wait Time Represents the number of milliseconds that the process has been waiting to be serviced. If the process is not waiting, a zero (0) is displayed.
Wait Type The last or current SQL Server wait type.
Open Xacts The current number of open transactions owned by the process.
NT Domain If using Windows Authentication or a trusted connection, this value contains the name of the Windows Domain of the user who owns the process.
Net Address The unique identifier of the network card in the client machine that owns the process.
EMBARCADERO TECHNOLOGIES > EMBARCADERO PERFORMANCE CENTER 2.5 EXPERT GUIDE: SQL SERVER 53
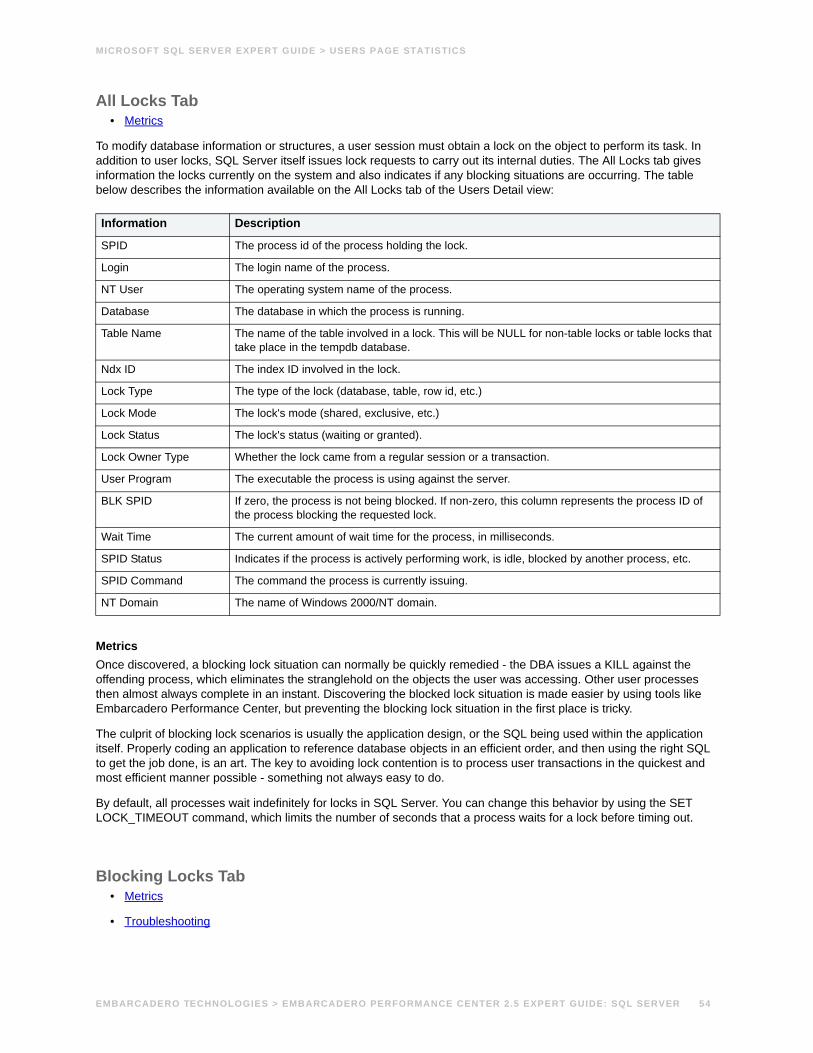
MICROSOFT SQL SERVER EXPERT GUIDE > USERS PAGE STATISTICS
All Locks Tab• Metrics
To modify database information or structures, a user session must obtain a lock on the object to perform its task. In addition to user locks, SQL Server itself issues lock requests to carry out its internal duties. The All Locks tab gives information the locks currently on the system and also indicates if any blocking situations are occurring. The table below describes the information available on the All Locks tab of the Users Detail view:
MetricsOnce discovered, a blocking lock situation can normally be quickly remedied - the DBA issues a KILL against the offending process, which eliminates the stranglehold on the objects the user was accessing. Other user processes then almost always complete in an instant. Discovering the blocked lock situation is made easier by using tools like Embarcadero Performance Center, but preventing the blocking lock situation in the first place is tricky.
The culprit of blocking lock scenarios is usually the application design, or the SQL being used within the application itself. Properly coding an application to reference database objects in an efficient order, and then using the right SQL to get the job done, is an art. The key to avoiding lock contention is to process user transactions in the quickest and most efficient manner possible - something not always easy to do.
By default, all processes wait indefinitely for locks in SQL Server. You can change this behavior by using the SET LOCK_TIMEOUT command, which limits the number of seconds that a process waits for a lock before timing out.
Blocking Locks Tab• Metrics
• Troubleshooting
Information Description
SPID The process id of the process holding the lock.
Login The login name of the process.
NT User The operating system name of the process.
Database The database in which the process is running.
Table Name The name of the table involved in a lock. This will be NULL for non-table locks or table locks that take place in the tempdb database.
Ndx ID The index ID involved in the lock.
Lock Type The type of the lock (database, table, row id, etc.)
Lock Mode The lock's mode (shared, exclusive, etc.)
Lock Status The lock's status (waiting or granted).
Lock Owner Type Whether the lock came from a regular session or a transaction.
User Program The executable the process is using against the server.
BLK SPID If zero, the process is not being blocked. If non-zero, this column represents the process ID of the process blocking the requested lock.
Wait Time The current amount of wait time for the process, in milliseconds.
SPID Status Indicates if the process is actively performing work, is idle, blocked by another process, etc.
SPID Command The command the process is currently issuing.
NT Domain The name of Windows 2000/NT domain.
EMBARCADERO TECHNOLOGIES > EMBARCADERO PERFORMANCE CENTER 2.5 EXPERT GUIDE: SQL SERVER 54
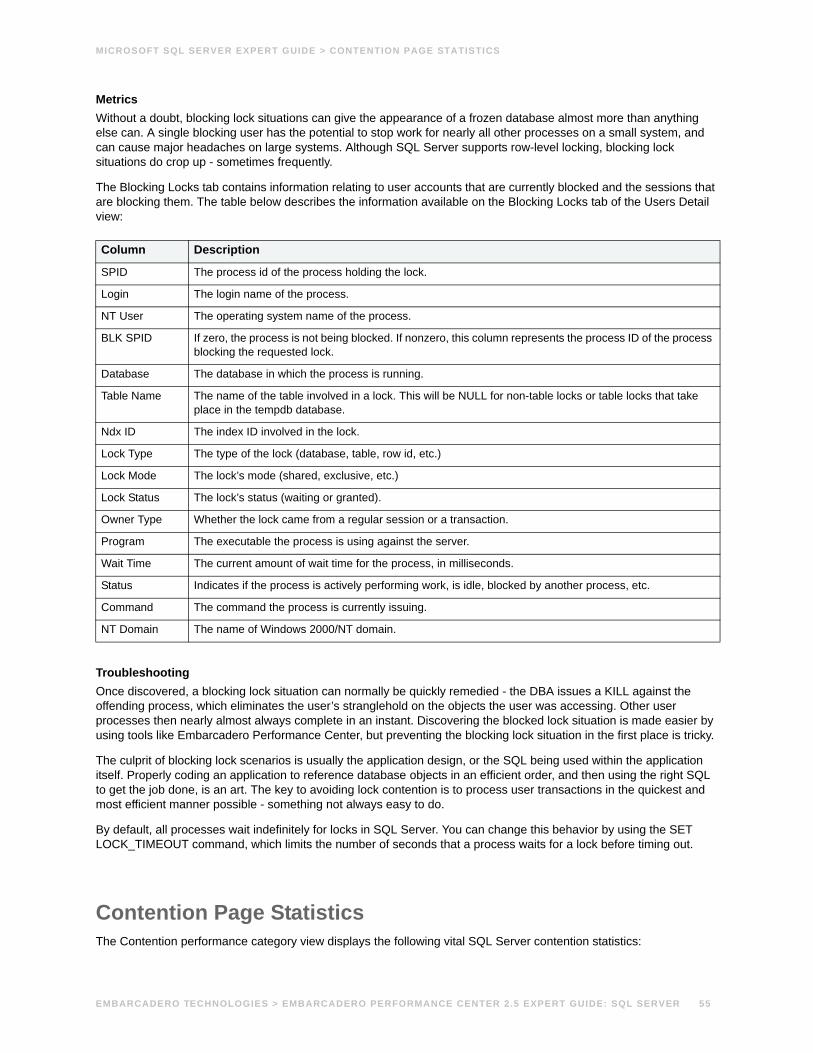
MICROSOFT SQL SERVER EXPERT GUIDE > CONTENTION PAGE STATISTICS
MetricsWithout a doubt, blocking lock situations can give the appearance of a frozen database almost more than anything else can. A single blocking user has the potential to stop work for nearly all other processes on a small system, and can cause major headaches on large systems. Although SQL Server supports row-level locking, blocking lock situations do crop up - sometimes frequently.
The Blocking Locks tab contains information relating to user accounts that are currently blocked and the sessions that are blocking them. The table below describes the information available on the Blocking Locks tab of the Users Detail view:
TroubleshootingOnce discovered, a blocking lock situation can normally be quickly remedied - the DBA issues a KILL against the offending process, which eliminates the user’s stranglehold on the objects the user was accessing. Other user processes then nearly almost always complete in an instant. Discovering the blocked lock situation is made easier by using tools like Embarcadero Performance Center, but preventing the blocking lock situation in the first place is tricky.
The culprit of blocking lock scenarios is usually the application design, or the SQL being used within the application itself. Properly coding an application to reference database objects in an efficient order, and then using the right SQL to get the job done, is an art. The key to avoiding lock contention is to process user transactions in the quickest and most efficient manner possible - something not always easy to do.
By default, all processes wait indefinitely for locks in SQL Server. You can change this behavior by using the SET LOCK_TIMEOUT command, which limits the number of seconds that a process waits for a lock before timing out.
Contention Page StatisticsThe Contention performance category view displays the following vital SQL Server contention statistics:
Column Description
SPID The process id of the process holding the lock.
Login The login name of the process.
NT User The operating system name of the process.
BLK SPID If zero, the process is not being blocked. If nonzero, this column represents the process ID of the process blocking the requested lock.
Database The database in which the process is running.
Table Name The name of the table involved in a lock. This will be NULL for non-table locks or table locks that take place in the tempdb database.
Ndx ID The index ID involved in the lock.
Lock Type The type of the lock (database, table, row id, etc.)
Lock Mode The lock’s mode (shared, exclusive, etc.)
Lock Status The lock’s status (waiting or granted).
Owner Type Whether the lock came from a regular session or a transaction.
Program The executable the process is using against the server.
Wait Time The current amount of wait time for the process, in milliseconds.
Status Indicates if the process is actively performing work, is idle, blocked by another process, etc.
Command The command the process is currently issuing.
NT Domain The name of Windows 2000/NT domain.
EMBARCADERO TECHNOLOGIES > EMBARCADERO PERFORMANCE CENTER 2.5 EXPERT GUIDE: SQL SERVER 55
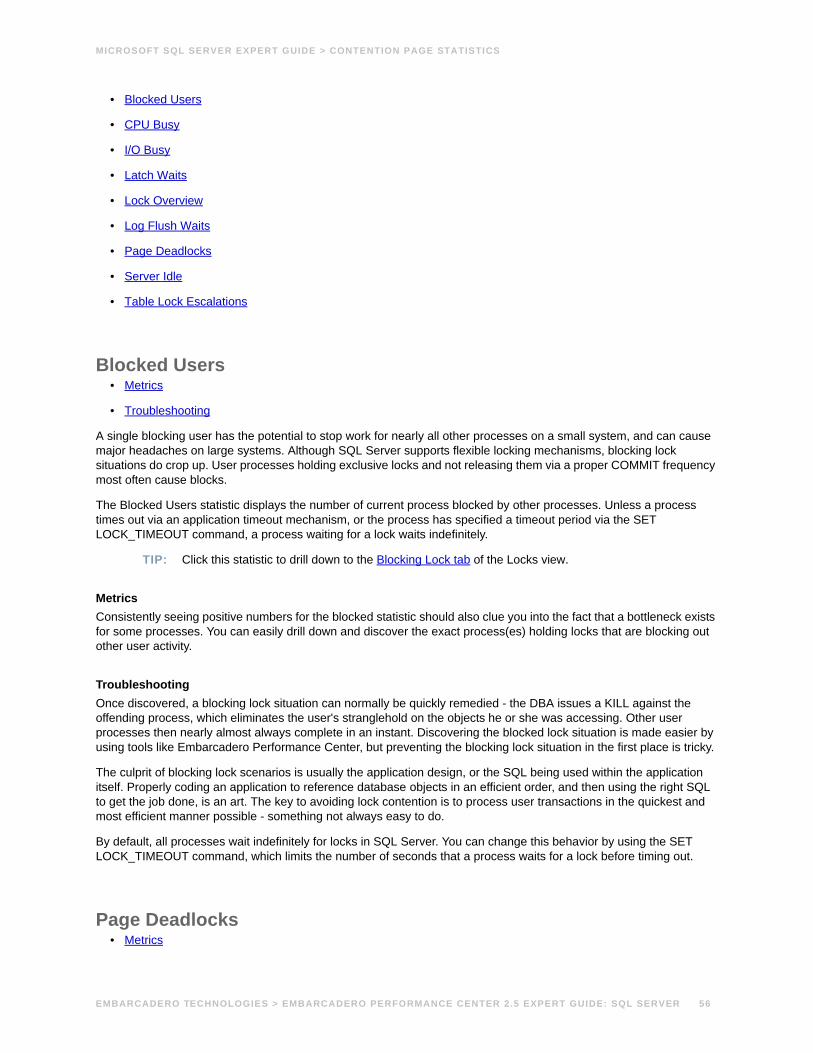
MICROSOFT SQL SERVER EXPERT GUIDE > CONTENTION PAGE STATISTICS
• Blocked Users
• CPU Busy
• I/O Busy
• Latch Waits
• Lock Overview
• Log Flush Waits
• Page Deadlocks
• Server Idle
• Table Lock Escalations
Blocked Users• Metrics
• Troubleshooting
A single blocking user has the potential to stop work for nearly all other processes on a small system, and can cause major headaches on large systems. Although SQL Server supports flexible locking mechanisms, blocking lock situations do crop up. User processes holding exclusive locks and not releasing them via a proper COMMIT frequency most often cause blocks.
The Blocked Users statistic displays the number of current process blocked by other processes. Unless a process times out via an application timeout mechanism, or the process has specified a timeout period via the SET LOCK_TIMEOUT command, a process waiting for a lock waits indefinitely.
TIP: Click this statistic to drill down to the Blocking Lock tab of the Locks view.
MetricsConsistently seeing positive numbers for the blocked statistic should also clue you into the fact that a bottleneck exists for some processes. You can easily drill down and discover the exact process(es) holding locks that are blocking out other user activity.
TroubleshootingOnce discovered, a blocking lock situation can normally be quickly remedied - the DBA issues a KILL against the offending process, which eliminates the user's stranglehold on the objects he or she was accessing. Other user processes then nearly almost always complete in an instant. Discovering the blocked lock situation is made easier by using tools like Embarcadero Performance Center, but preventing the blocking lock situation in the first place is tricky.
The culprit of blocking lock scenarios is usually the application design, or the SQL being used within the application itself. Properly coding an application to reference database objects in an efficient order, and then using the right SQL to get the job done, is an art. The key to avoiding lock contention is to process user transactions in the quickest and most efficient manner possible - something not always easy to do.
By default, all processes wait indefinitely for locks in SQL Server. You can change this behavior by using the SET LOCK_TIMEOUT command, which limits the number of seconds that a process waits for a lock before timing out.
Page Deadlocks• Metrics
EMBARCADERO TECHNOLOGIES > EMBARCADERO PERFORMANCE CENTER 2.5 EXPERT GUIDE: SQL SERVER 56
MICROSOFT SQL SERVER EXPERT GUIDE > CONTENTION PAGE STATISTICS
• Troubleshooting
The Page Deadlocks statistic represents the number of deadlocks per second detected by SQL Server. Page Deadlocks occur when processes cannot proceed because they are waiting on a set of resources held by each other or held by other processes.
MetricsConsistently seeing page deadlock counts greater than zero indicates that some user processes are experiencing delays completing their work. When SQL Server identifies a page deadlock, it resolves the situation by choosing the process that can break the deadlock. This process is termed the deadlock victim. SQL Server rolls back the deadlock victim's transaction, and then notifies the process' application by returning an error message. It also cancels the process' request and allows the transactions of the remaining processes to continue.
SQL Server always attempts to choose the least expensive thread running the transaction as the deadlock victim.
TroubleshootingBecause SQL Server automatically resolves deadlock situations, you should work proactively to prevent them in the first place.
The culprit of most blocking lock and deadlock scenarios is usually the application design, or the SQL being used within the application itself. Properly coding an application to reference database objects in an efficient order, and then using the right SQL to get the job done, is an art. The key to avoiding lock contention is to process user transactions in the quickest and most efficient manner possible - something not always easy to do.
You can change default deadlock behavior by using the SET DEADLOCK_PRIORITY command, which reprioritizes a process' position in a deadlock situation.
Number of DeadlocksThe number of deadlocks statistic is the measure of the lock requests per second that resulted in a deadlock.
The culprit of most blocking lock and deadlock scenarios is usually the application design, or the SQL being used within the application itself. Properly coding an application to reference database objects in an efficient order, and then using the right SQL to get the job done, is an art. The key to avoiding lock contention is to process user transactions in the quickest and most efficient manner possible - something not always easy to do.
You can change default deadlock behavior by using the SET DEADLOCK_PRIORITY command, which reprioritizes a process' position in a deadlock situation.
Latch Waits• Metrics
The Latch Waits statistic represents the number of latches per second that could not be satisfied immediately by SQL Server. Latches can be thought of as lightweight, mini-locks that are used to protect actions and resources used inside transactions.
TIP: Click this statistic to drill down to the Waits tab of the Contention Detail view.
MetricsUnless accompanied by long wait times, latch waits should not pose too much of a performance problem in normal SQL Server installations.
EMBARCADERO TECHNOLOGIES > EMBARCADERO PERFORMANCE CENTER 2.5 EXPERT GUIDE: SQL SERVER 57
MICROSOFT SQL SERVER EXPERT GUIDE > CONTENTION PAGE STATISTICS
Log Flush Waits• Metrics
• Troubleshooting
The Log Flush Waits statistic represents the number of commits per second waiting for a log flush. SQL Server records every modification to data in a database's log cache. After a transaction is committed, SQL Server writes everything from the database's log cache to the physical log files. Before a process invoking the COMMIT can continue work, it must wait until a log flush finishes. Reduced performance results when a process must wait for a log flush to complete.
TIP: Click this statistic to drill down to the Waits tab of the Contention Detail view.
MetricsLog flush waits with no measurable wait time are not considered worrisome. Waits accompanied by considerable wait times are an indicator of contention that degrades overall performance.
TroubleshootingDrilling down into the log flush detail quickly identifies databases that are experiencing log flush waits. Placing these logs on faster physical devices (and separating them from their parent database) should reduce wait activity.
Table Lock Escalations• Metrics
The Table Lock Escalations statistic represents the number of times locks on a table were escalated.
TIP: Click this statistic to drill down to the All Lock tab of the Locks view.
MetricsMany table lock escalations could indicate contention problems. If increasing numbers of table lock escalations are viewed at the same time as blocking or deadlock problems, the application design could be at fault.
Lock Overview• Metrics
• Troubleshooting
The Lock Overview tab displays the total number of acquired locks and blocking locks being experienced per database.
MetricsConsistently seeing positive numbers for the blocked statistic should also clue you into the fact that a bottleneck exists for some processes. You can easily drill down and discover the exact process(es) holding locks that are blocking out other user activity.
Another situation to look for with respect to locking is when the total number of acquired locks reaches the maximum lock limit currently set on SQL Server.
EMBARCADERO TECHNOLOGIES > EMBARCADERO PERFORMANCE CENTER 2.5 EXPERT GUIDE: SQL SERVER 58
MICROSOFT SQL SERVER EXPERT GUIDE > CONTENTION PAGE STATISTICS
TroubleshootingOnce discovered, a blocking lock situation can normally be quickly remedied - the DBA issues a KILL against the offending process, which eliminates the user’s stranglehold on the objects the user was accessing. Other user processes then almost always complete in an instant. Discovering the blocked lock situation is made easier by using tools like Embarcadero Performance Center, but preventing the blocking lock situation in the first place is tricky.
The culprit of blocking lock scenarios is usually the application design, or the SQL being used within the application itself. Properly coding an application to reference database objects in an efficient order, and then using the right SQL to get the job done, is an art. The key to avoiding lock contention is to process user transactions in the quickest and most efficient manner possible - something not always easy to do.
By default, all processes wait indefinitely for locks in SQL Server. You can change this behavior by using the SET LOCK_TIMEOUT command, which limits the number of seconds that a process waits for a lock before timing out.
If the total amount of acquired/requested locks has exceeded the maximum allowed on SQL Server, you should increase the configuration parameter locks.
CPU Busy• Metrics
The CPU Busy statistic represents the time in milliseconds that the CPU has spent working since the last refresh in Embarcadero Performance Center.
MetricsNone.
I/O Busy• Metrics
The Server I/O Busy statistic represents the time in milliseconds that SQL Server has spent performing input and output operations since the last refresh in Embarcadero Performance Center.
MetricsNone.
Server Idle• Metrics
The Server Idle statistic represents the time in milliseconds that SQL Server has spent idle since the last refresh in Embarcadero Performance Center.
MetricsNone.
Contention Detail ViewThe following tabbed pages are available on the Contention Detail view:
EMBARCADERO TECHNOLOGIES > EMBARCADERO PERFORMANCE CENTER 2.5 EXPERT GUIDE: SQL SERVER 59
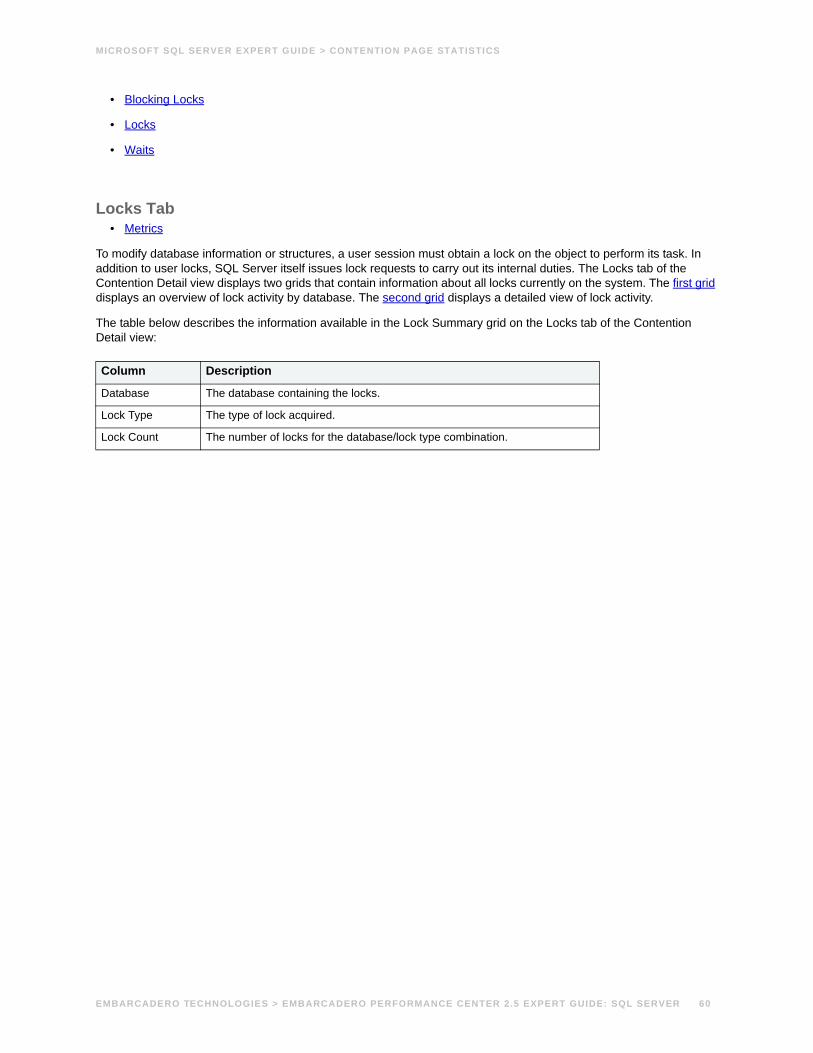
MICROSOFT SQL SERVER EXPERT GUIDE > CONTENTION PAGE STATISTICS
• Blocking Locks
• Locks
• Waits
Locks Tab• Metrics
To modify database information or structures, a user session must obtain a lock on the object to perform its task. In addition to user locks, SQL Server itself issues lock requests to carry out its internal duties. The Locks tab of the Contention Detail view displays two grids that contain information about all locks currently on the system. The first grid displays an overview of lock activity by database. The second grid displays a detailed view of lock activity.
The table below describes the information available in the Lock Summary grid on the Locks tab of the Contention Detail view:
Column Description
Database The database containing the locks.
Lock Type The type of lock acquired.
Lock Count The number of locks for the database/lock type combination.
EMBARCADERO TECHNOLOGIES > EMBARCADERO PERFORMANCE CENTER 2.5 EXPERT GUIDE: SQL SERVER 60
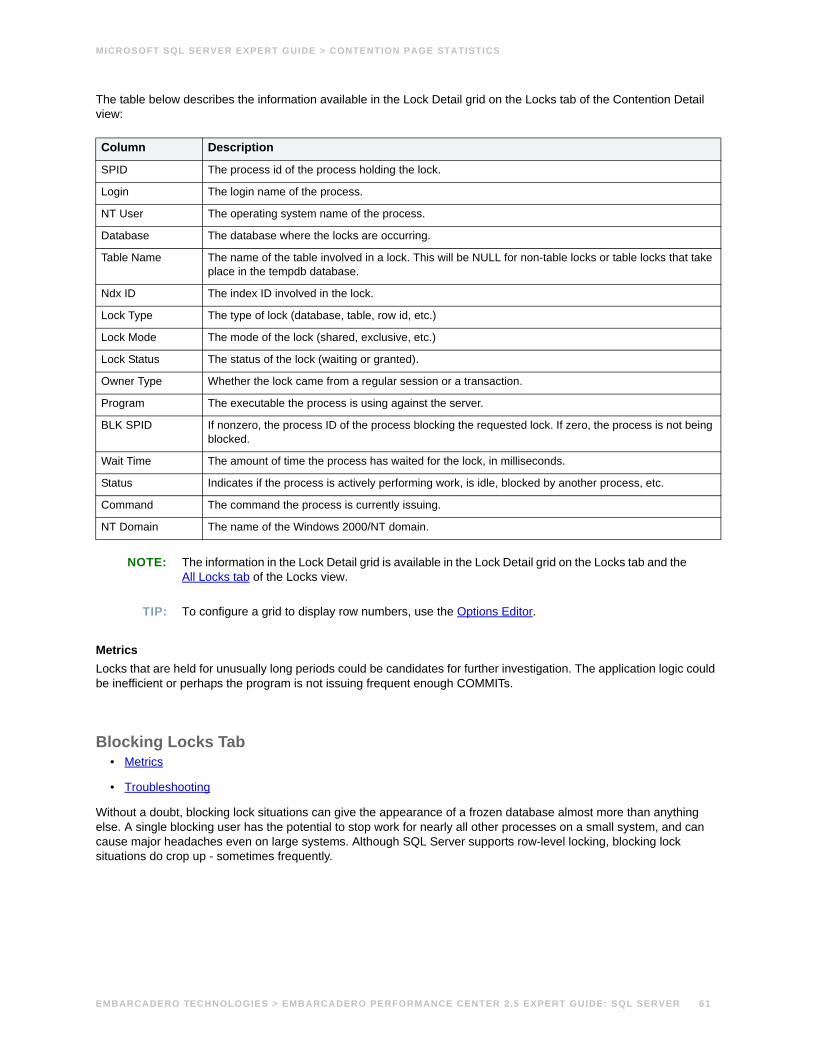
MICROSOFT SQL SERVER EXPERT GUIDE > CONTENTION PAGE STATISTICS
The table below describes the information available in the Lock Detail grid on the Locks tab of the Contention Detail view:
NOTE: The information in the Lock Detail grid is available in the Lock Detail grid on the Locks tab and the All Locks tab of the Locks view.
TIP: To configure a grid to display row numbers, use the Options Editor.
MetricsLocks that are held for unusually long periods could be candidates for further investigation. The application logic could be inefficient or perhaps the program is not issuing frequent enough COMMITs.
Blocking Locks Tab• Metrics
• Troubleshooting
Without a doubt, blocking lock situations can give the appearance of a frozen database almost more than anything else. A single blocking user has the potential to stop work for nearly all other processes on a small system, and can cause major headaches even on large systems. Although SQL Server supports row-level locking, blocking lock situations do crop up - sometimes frequently.
Column Description
SPID The process id of the process holding the lock.
Login The login name of the process.
NT User The operating system name of the process.
Database The database where the locks are occurring.
Table Name The name of the table involved in a lock. This will be NULL for non-table locks or table locks that take place in the tempdb database.
Ndx ID The index ID involved in the lock.
Lock Type The type of lock (database, table, row id, etc.)
Lock Mode The mode of the lock (shared, exclusive, etc.)
Lock Status The status of the lock (waiting or granted).
Owner Type Whether the lock came from a regular session or a transaction.
Program The executable the process is using against the server.
BLK SPID If nonzero, the process ID of the process blocking the requested lock. If zero, the process is not being blocked.
Wait Time The amount of time the process has waited for the lock, in milliseconds.
Status Indicates if the process is actively performing work, is idle, blocked by another process, etc.
Command The command the process is currently issuing.
NT Domain The name of the Windows 2000/NT domain.
EMBARCADERO TECHNOLOGIES > EMBARCADERO PERFORMANCE CENTER 2.5 EXPERT GUIDE: SQL SERVER 61
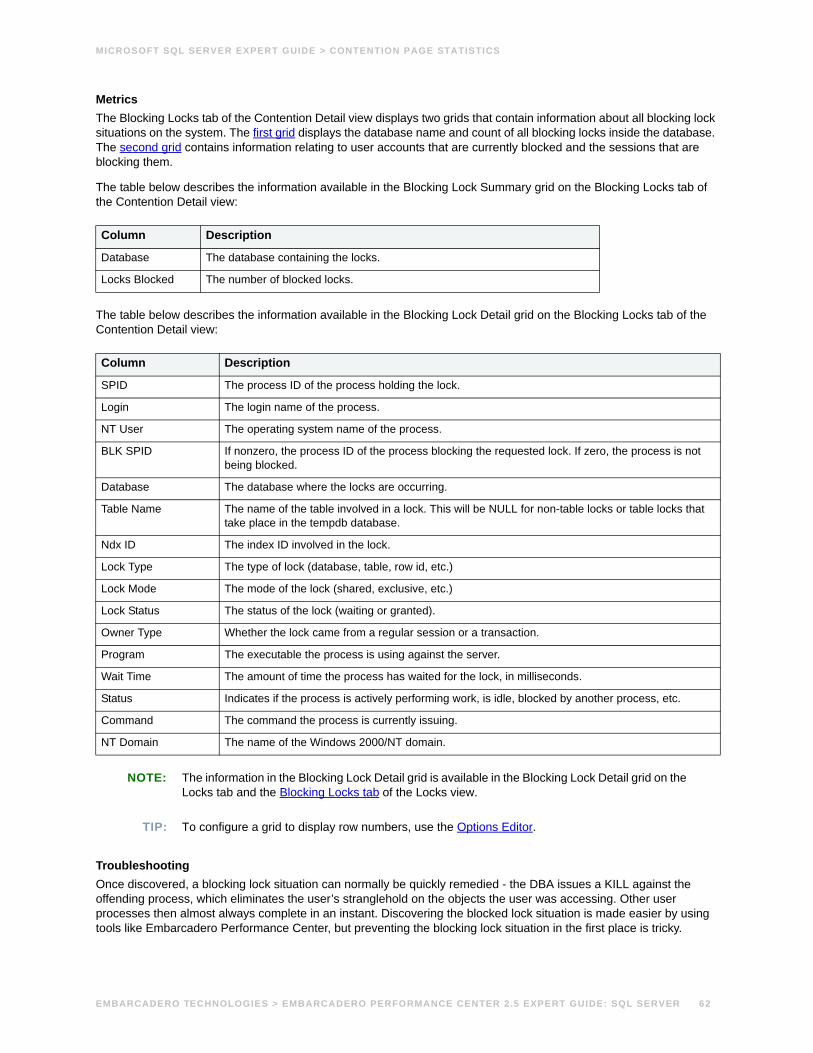
MICROSOFT SQL SERVER EXPERT GUIDE > CONTENTION PAGE STATISTICS
MetricsThe Blocking Locks tab of the Contention Detail view displays two grids that contain information about all blocking lock situations on the system. The first grid displays the database name and count of all blocking locks inside the database. The second grid contains information relating to user accounts that are currently blocked and the sessions that are blocking them.
The table below describes the information available in the Blocking Lock Summary grid on the Blocking Locks tab of the Contention Detail view:
The table below describes the information available in the Blocking Lock Detail grid on the Blocking Locks tab of the Contention Detail view:
NOTE: The information in the Blocking Lock Detail grid is available in the Blocking Lock Detail grid on the Locks tab and the Blocking Locks tab of the Locks view.
TIP: To configure a grid to display row numbers, use the Options Editor.
TroubleshootingOnce discovered, a blocking lock situation can normally be quickly remedied - the DBA issues a KILL against the offending process, which eliminates the user’s stranglehold on the objects the user was accessing. Other user processes then almost always complete in an instant. Discovering the blocked lock situation is made easier by using tools like Embarcadero Performance Center, but preventing the blocking lock situation in the first place is tricky.
Column Description
Database The database containing the locks.
Locks Blocked The number of blocked locks.
Column Description
SPID The process ID of the process holding the lock.
Login The login name of the process.
NT User The operating system name of the process.
BLK SPID If nonzero, the process ID of the process blocking the requested lock. If zero, the process is not being blocked.
Database The database where the locks are occurring.
Table Name The name of the table involved in a lock. This will be NULL for non-table locks or table locks that take place in the tempdb database.
Ndx ID The index ID involved in the lock.
Lock Type The type of lock (database, table, row id, etc.)
Lock Mode The mode of the lock (shared, exclusive, etc.)
Lock Status The status of the lock (waiting or granted).
Owner Type Whether the lock came from a regular session or a transaction.
Program The executable the process is using against the server.
Wait Time The amount of time the process has waited for the lock, in milliseconds.
Status Indicates if the process is actively performing work, is idle, blocked by another process, etc.
Command The command the process is currently issuing.
NT Domain The name of the Windows 2000/NT domain.
EMBARCADERO TECHNOLOGIES > EMBARCADERO PERFORMANCE CENTER 2.5 EXPERT GUIDE: SQL SERVER 62
MICROSOFT SQL SERVER EXPERT GUIDE > DATABASE PAGE STATISTICS
The culprit of blocking lock scenarios is usually the application design, or the SQL being used within the application itself. Properly coding an application to reference database objects in an efficient order, and then using the right SQL to get the job done, is an art. The key to avoiding lock contention is to process user transactions in the quickest and most efficient manner possible - something not always easy to do.
By default, all processes wait indefinitely for locks in SQL Server. You can change this behavior by using the SET LOCK_TIMEOUT command, which limits the number of seconds that a process waits for a lock before timing out.
Waits Tab• Metrics
Understanding where SQL Server is delayed in its processing can yield big benefits in increasing overall response time. The Waits tab of the Contention Detail view contains two grids that display wait information. The first grid is a summary of various wait type categories, along with their overall wait counts and wait times. The second grid displays individual wait statistics, along with their individual wait counts and wait times.
TIP: To configure a grid to display row numbers, use the Options Editor.
MetricsWaits could not be causing actual delays in SQL Server processing unless they are accompanied by substantial wait times. The ones displaying high wait times are the ones likely to be causing transactional and system slowdowns.
Database Page StatisticsThe Database view includes the following statistics:
• Database Summary
• Databases
• Databases Needing Backup
• Databases Without Auto-Create Statistics
• Databases Without Auto-Growth
• Databases Without Auto-Update Statistics
• Errors in Current Error Log
• Files
• File Groups
• Logs Without Auto-Growth
• Offline Databases
• Suspect Databases
Related TopicsDatabase Detail View
Home View Statistics
Contention Statistics
EMBARCADERO TECHNOLOGIES > EMBARCADERO PERFORMANCE CENTER 2.5 EXPERT GUIDE: SQL SERVER 63
MICROSOFT SQL SERVER EXPERT GUIDE > ERRORS IN CURRENT ERROR LOG
I/O Page Statistics
Memory Page Statistics
Network Statistics
OS Page Statistics
Space Page Statistics
Top SQL Page Statistics
Users Page Statistics
Errors in Current Error Log• Metrics
• Troubleshooting
SQL Server records various system events in its system or error log. The majority of messages placed into the log are informational in nature, however since some contain critical messages, you should immediately review them. This section indicates the number of actual error messages in the most recent error log so you know if there are potential events that require your attention.
TIP: Click this statistic to open the I/O performance category view.
MetricsYou should investigate any positive values for errors.
TroubleshootingIf non-zero values are found for this statistic, you should drill down into the current error log and examine the detail found that accompanies each error issued by SQL Server.
Databases• Metrics
The Database statistic represents total number of databases defined on a SQL Server.
TIP: Click this statistic to drill down to the SQL Cache tab of the Memory Detail view.
MetricsNone.
Files• Metrics
The Files statistic represents total number of files (both database and log) defined on a SQL Server.
TIP: Click this statistic to open the Memory performance category view.
EMBARCADERO TECHNOLOGIES > EMBARCADERO PERFORMANCE CENTER 2.5 EXPERT GUIDE: SQL SERVER 64
MICROSOFT SQL SERVER EXPERT GUIDE > ERRORS IN CURRENT ERROR LOG
MetricsNone.
File Groups• Metrics
The File Groups statistic represents total number of file groups (that contain both database and log files) defined on a SQL Server.
TIP: Click this statistic to open the Memory performance category view.
MetricsNone.
Suspect Databases• Metrics
• Troubleshooting
The Suspect Databases statistic represents the number of databases SQL Server has marked as suspect. Databases are marked suspect by SQL Server if they fail during automatic recovery, which is performed at server startup. If serious damage is experienced by a database during regular uptime, SQL server will also mark a database as suspect.
MetricsYou should not find any suspect databases on any production server. You should immediately investigate any non-zero numbers, for this statistic.
TroubleshootingThe steps to handling a suspect database will vary from one installation to another. However, here are some general guidelines you can use to troubleshoot a suspect database:
• Begin by examining the SQL Server error log for clues as to what caused the database to be marked as suspect.
• It is not unusual for a server to run out of physical disk space on drives used by SQL Server. When this happens, recovery for databases can sometimes fail with the end result being SQL Server marking a database as suspect. To remedy this situation, you should free up space on the identified drives or add files to the newly marked suspect database. For SQL Server 2000, this can be accomplished by utilizing the following stored procedures: sp_add_data_file_recover_suspect_db and sp_add_log_file_recover_suspect_db. For version 7.0 of SQL Server, you will need to use the sp_resetstatus stored procedure to reset the suspect status flag for the database in question, use the alter database command to add new datafiles to the database, and then stop/start the SQL Server.
• Many times, suspect databases are caused by SQL Server not being able to access a database or log file. This happens if a particular physical hard drive has become unavailable, but also can occur if another operating system process has obtained exclusive access to a file. If this scenario proves to be true, once you have ensured that the file(s) are available once again to the operating system, you can use the sp_resetstatus stored procedure to reset the suspect status flag for the database and then stop/start the SQL Server.
If none of these solutions are possible, you will likely have to restore your database using the last full and transaction log backups.
EMBARCADERO TECHNOLOGIES > EMBARCADERO PERFORMANCE CENTER 2.5 EXPERT GUIDE: SQL SERVER 65
MICROSOFT SQL SERVER EXPERT GUIDE > ERRORS IN CURRENT ERROR LOG
Offline Databases• Metrics
• Troubleshooting
The Offline Databases statistic represents the number of databases SQL Server has offline, meaning that no database modifications can occur.
TIP: Click this statistic to open the I/O performance category view.
MetricsYou should not find any offline databases on any production server. You should immediately investigate any non-zero numbers, for this statistic.
TroubleshootingShould an offline database be found by Performance Center, you can easily place it back online by utilizing either the sp_dboption stored procedure or the alter database command.
Databases Needing Backup• Metrics
• Troubleshooting
The Databases Needing Backup statistic represents the number of databases in SQL Server that have not been backed up for more than seven days. This statistic excludes the pubs, tempdb, Northwind, msdb, and model databases.
TIP: Click this statistic to open the I/O performance category view.
MetricsTo ensure proper protection for most databases, it is recommended that even the most static databases be backed up at least once a week. You should frequently backup critical, dynamic databases and include transaction log backups to enable point-in-time recovery ability.
TroubleshootingAny critical databases found with obsolete or no backups should immediately be backed up. Moreover, to ensure proper data protection for each database, you should institute a planned backup schedule. The timing and repetition of the backups depend on the critical recovery needs of each database.
Databases Without Auto-Growth• Metrics
• Troubleshooting
Beginning in SQL Server 7.0, a DBA was given the ability to tell SQL Server to automatically grow a database in size when more space was required. This feature can save a critical transaction or other database request from failing due to a lack of free space in the database. It is recommended that critical databases have this feature enabled.
EMBARCADERO TECHNOLOGIES > EMBARCADERO PERFORMANCE CENTER 2.5 EXPERT GUIDE: SQL SERVER 66
MICROSOFT SQL SERVER EXPERT GUIDE > ERRORS IN CURRENT ERROR LOG
The Databases Without Auto-Growth statistic provides a count of databases that do not have their automatic growth property enabled.
TIP: Click this statistic to drill down to the Blocking Lock tab of the Locks view.
MetricsStatic databases (those not expected to grow in size) will likely not need their auto-growth property enabled. Growing, dynamic databases should almost always be allowed to automatically grow when needed.
TroubleshootingIf any critical, dynamic database is found to not have its auto-growth feature enabled, then the DBA can modify the file(s) used by the database to automatically grow by using the ALTER DATABASE … MODIFY FILE … FILEGROWTH command. You should also ensure that the MAXSIZE setting of each file is set appropriately.
Logs Without Auto-Growth• Metrics
• Troubleshooting
Beginning in SQL Server 7.0, a DBA was given the ability to tell SQL Server to automatically grow a database or transaction log in size when more space was required. This feature can save a critical transaction or other database request from failing due to a lack of free space in the database or transaction log. It is recommended that critical databases and their transaction logs have this feature enabled.
The Logs Without Auto-Growth statistic provides a count of transaction logs that do not have their automatic growth property enabled.
TIP: Click this statistic to open the Contention performance category view.
MetricsStatic databases (those not expected to grow in size) will likely not need their transaction log’s auto-growth property enabled. Growing, dynamic databases should almost always have their transaction log be set to automatically grow when needed.
TroubleshootingIf any critical, dynamic database is found to not have their transaction log auto-growth feature enabled, then the DBA can modify the file(s) used by the database’s transaction log to automatically grow by using the ALTER DATABASE … MODIFY FILE … FILEGROWTH command. You should also ensure that the MAXSIZE setting for each file is set appropriately.
Databases Without Auto-Update Statistics• Metrics
• Troubleshooting
The Databases Without Auto-Update Statistics statistic represents the total number of databases defined on SQL Server that do not have the AUTO_UPDATE_STATISTICS option enabled.
TIP: Click this statistic to open the Contention performance category view.
EMBARCADERO TECHNOLOGIES > EMBARCADERO PERFORMANCE CENTER 2.5 EXPERT GUIDE: SQL SERVER 67
MICROSOFT SQL SERVER EXPERT GUIDE > ERRORS IN CURRENT ERROR LOG
MetricsWhen the AUTO_UPDATE_STATISTICS option is enabled, SQL Server automatically updates existing statistics when the statistics become out-of-date because data in the tables has changed enough to affect the optimizer's decision-making process.
TroubleshootingIf possible, a DBA should keep databases in AUTO_UPDATE_STATISTICS mode. If a database is found without this option set, you can easily change its auto-update statistics to true by using the command:
EXEC sp_dboption '(database name)',
Databases Without Auto-Create Stats• Metrics
• Troubleshooting
The Databases Without Auto-Create Stats statistic represents the total number of databases defined on SQL Server that do not have the AUTO_CREATE_STATISTICS option enabled.
TIP: Click this statistic to open the Contention performance category view.
MetricsWhen the AUTO_CREATE_STATISTICS option is enabled, statistics are automatically created on columns used in a SQL query predicate. Keeping object statistics fresh in the SQL Server data dictionary improves query performance because the optimizer can better determine how to evaluate a query and return the requested data. If the statistics are not used, SQL Server should automatically delete them.
TroubleshootingIf possible, a DBA should keep their databases in AUTO_CREATE_STATISTICS mode. If a database is found without this option set, you can easily change it by using the command:
EXEC sp_dboption '<database name>','auto create statistics',true
Database Summary• Metrics
• Troubleshooting
The Database Summary gives a bird's eye view of situations that could require a DBA's attention.
TIP: Click the table heading to drill down to the Overview tab of the Database Detail view.
MetricsYou should investigate any blocking lock situations and databases that are using an inappropriate amount of memory, CPU, or I/O. In addition, you should reserve off-hours submissions for various utilities such as DBCCs, BCPs, or backup and restore operations.
EMBARCADERO TECHNOLOGIES > EMBARCADERO PERFORMANCE CENTER 2.5 EXPERT GUIDE: SQL SERVER 68
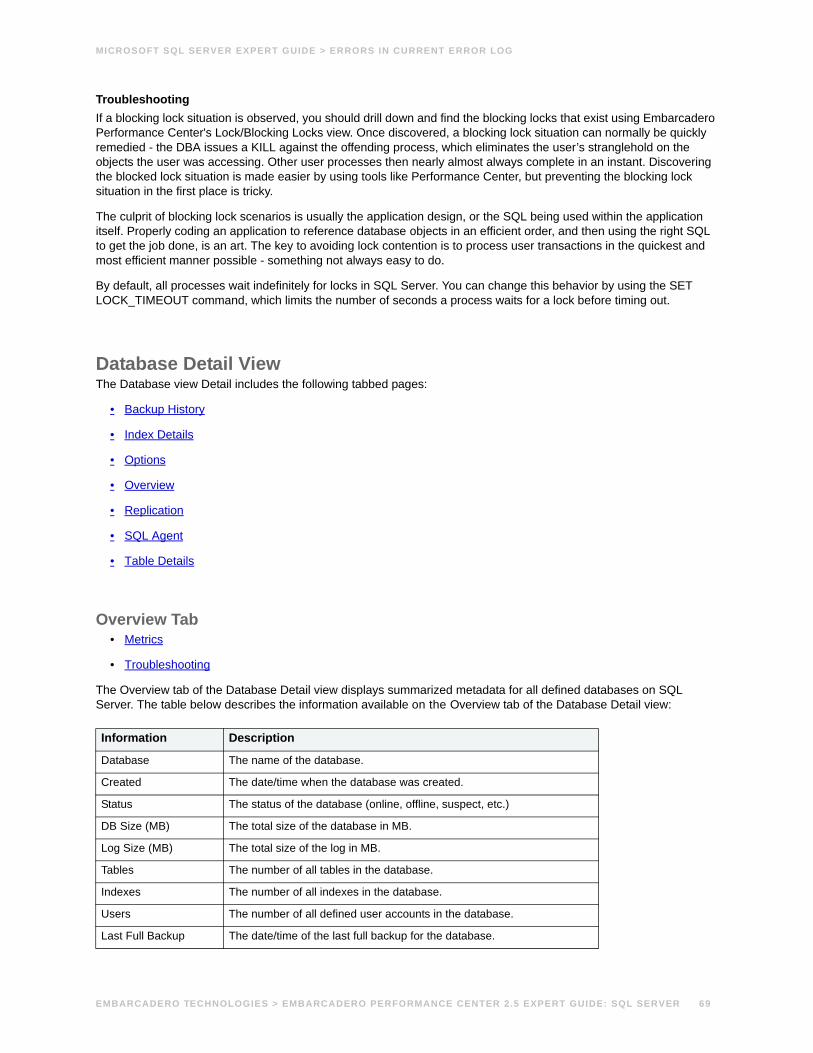
MICROSOFT SQL SERVER EXPERT GUIDE > ERRORS IN CURRENT ERROR LOG
TroubleshootingIf a blocking lock situation is observed, you should drill down and find the blocking locks that exist using Embarcadero Performance Center's Lock/Blocking Locks view. Once discovered, a blocking lock situation can normally be quickly remedied - the DBA issues a KILL against the offending process, which eliminates the user’s stranglehold on the objects the user was accessing. Other user processes then nearly almost always complete in an instant. Discovering the blocked lock situation is made easier by using tools like Performance Center, but preventing the blocking lock situation in the first place is tricky.
The culprit of blocking lock scenarios is usually the application design, or the SQL being used within the application itself. Properly coding an application to reference database objects in an efficient order, and then using the right SQL to get the job done, is an art. The key to avoiding lock contention is to process user transactions in the quickest and most efficient manner possible - something not always easy to do.
By default, all processes wait indefinitely for locks in SQL Server. You can change this behavior by using the SET LOCK_TIMEOUT command, which limits the number of seconds a process waits for a lock before timing out.
Database Detail ViewThe Database view Detail includes the following tabbed pages:
• Backup History
• Index Details
• Options
• Overview
• Replication
• SQL Agent
• Table Details
Overview Tab• Metrics
• Troubleshooting
The Overview tab of the Database Detail view displays summarized metadata for all defined databases on SQL Server. The table below describes the information available on the Overview tab of the Database Detail view:
Information Description
Database The name of the database.
Created The date/time when the database was created.
Status The status of the database (online, offline, suspect, etc.)
DB Size (MB) The total size of the database in MB.
Log Size (MB) The total size of the log in MB.
Tables The number of all tables in the database.
Indexes The number of all indexes in the database.
Users The number of all defined user accounts in the database.
Last Full Backup The date/time of the last full backup for the database.
EMBARCADERO TECHNOLOGIES > EMBARCADERO PERFORMANCE CENTER 2.5 EXPERT GUIDE: SQL SERVER 69
MICROSOFT SQL SERVER EXPERT GUIDE > ERRORS IN CURRENT ERROR LOG
MetricsThe following are things to take note of:
• Any critical database that shows a last full backup date that is older than the database’s required backup needs.
• Any database that shows a status of offline or suspect.
• Any growing database that does not have its database or log files set to automatically grow in size.
• Any dynamic database that does not have its object statistics set to automatically update.
TroubleshootingDepending on the situation, you should take the following actions:
For databases that require a full backup, perform a full backup of the database when appropriate.
For suspect databases, the steps to handling will vary from one installation to another. However, here are some general guidelines you can use to troubleshoot a suspect database:
• Begin by examining the SQL Server error log for clues as to what caused the database to be marked as suspect.
• It is not unusual for a server to run out of physical disk space on drives used by SQL Server. When this happens, recovery for databases can sometimes fail with the end result being SQL Server marking a database as suspect. To remedy this situation, you should free up space on the identified drives or add files to the newly marked suspect database. For SQL Server 2000, this can be accomplished by utilizing the following stored procedures: sp_add_data_file_recover_suspect_db and sp_add_log_file_recover_suspect_db. For SQL Server version 7.0, you will need to use the sp_resetstatus stored procedure to reset the suspect status flag for the database in question, use the alter database command to add new datafiles to the database, and then stop/start SQL Server.
• Many times, suspect databases are caused by SQL Server not being able to access a database or log file. This happens if a particular physical hard drive has become unavailable, but also can occur if another operating system process has obtained exclusive access to a file. If this scenario proves to be true, once you have ensured that the file(s) are available once again to the operating system, you can use the sp_resetstatus stored procedure to reset the suspect status flag for the database and then stop/start SQL Server.
Should an offline database be found by Performance Center, you can easily place it back online by utilizing either the sp_dboption stored procedure or the alter database command.
If any critical, dynamic database or log is found to not have their auto-growth feature enabled, then the DBA can modify the file(s) used by the database to automatically grow by using the ALTER DATABASE … MODIFY FILE … FILEGROWTH command. You should also ensure that the MAXSIZE setting for each file is set appropriately.
If possible, a DBA should keep their databases in AUTO_CREATE_STATISTICS and AUTO_UPDATE_STATISTICS mode. If a database is found without this option set, you can easily change it by using the following commands:
EXEC sp_dboption '<database name>','auto create statistics',true
EXEC sp_dboption '<database name>','auto update statistics',true
SQL Agent TabSQL Server provides the ability to submit and run jobs as well as be notified about certain SQL Server-related events. The SQL Agent tab of the Database Detail view displays information regarding the status of the server’s SQL Agent as well as details for all jobs and alerts that are defined to the system.
SQL Server Job Summary• Metrics
EMBARCADERO TECHNOLOGIES > EMBARCADERO PERFORMANCE CENTER 2.5 EXPERT GUIDE: SQL SERVER 70
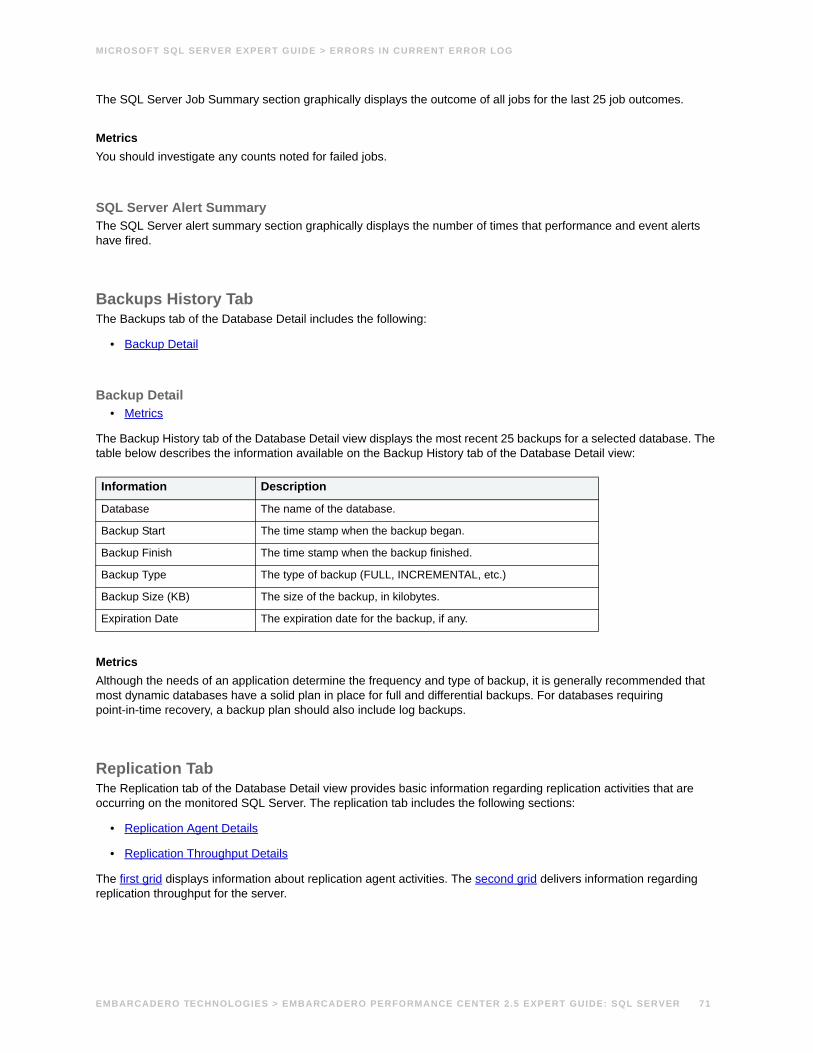
MICROSOFT SQL SERVER EXPERT GUIDE > ERRORS IN CURRENT ERROR LOG
The SQL Server Job Summary section graphically displays the outcome of all jobs for the last 25 job outcomes.
MetricsYou should investigate any counts noted for failed jobs.
SQL Server Alert SummaryThe SQL Server alert summary section graphically displays the number of times that performance and event alerts have fired.
Backups History TabThe Backups tab of the Database Detail includes the following:
• Backup Detail
Backup Detail• Metrics
The Backup History tab of the Database Detail view displays the most recent 25 backups for a selected database. The table below describes the information available on the Backup History tab of the Database Detail view:
MetricsAlthough the needs of an application determine the frequency and type of backup, it is generally recommended that most dynamic databases have a solid plan in place for full and differential backups. For databases requiring point-in-time recovery, a backup plan should also include log backups.
Replication TabThe Replication tab of the Database Detail view provides basic information regarding replication activities that are occurring on the monitored SQL Server. The replication tab includes the following sections:
• Replication Agent Details
• Replication Throughput Details
The first grid displays information about replication agent activities. The second grid delivers information regarding replication throughput for the server.
Information Description
Database The name of the database.
Backup Start The time stamp when the backup began.
Backup Finish The time stamp when the backup finished.
Backup Type The type of backup (FULL, INCREMENTAL, etc.)
Backup Size (KB) The size of the backup, in kilobytes.
Expiration Date The expiration date for the backup, if any.
EMBARCADERO TECHNOLOGIES > EMBARCADERO PERFORMANCE CENTER 2.5 EXPERT GUIDE: SQL SERVER 71
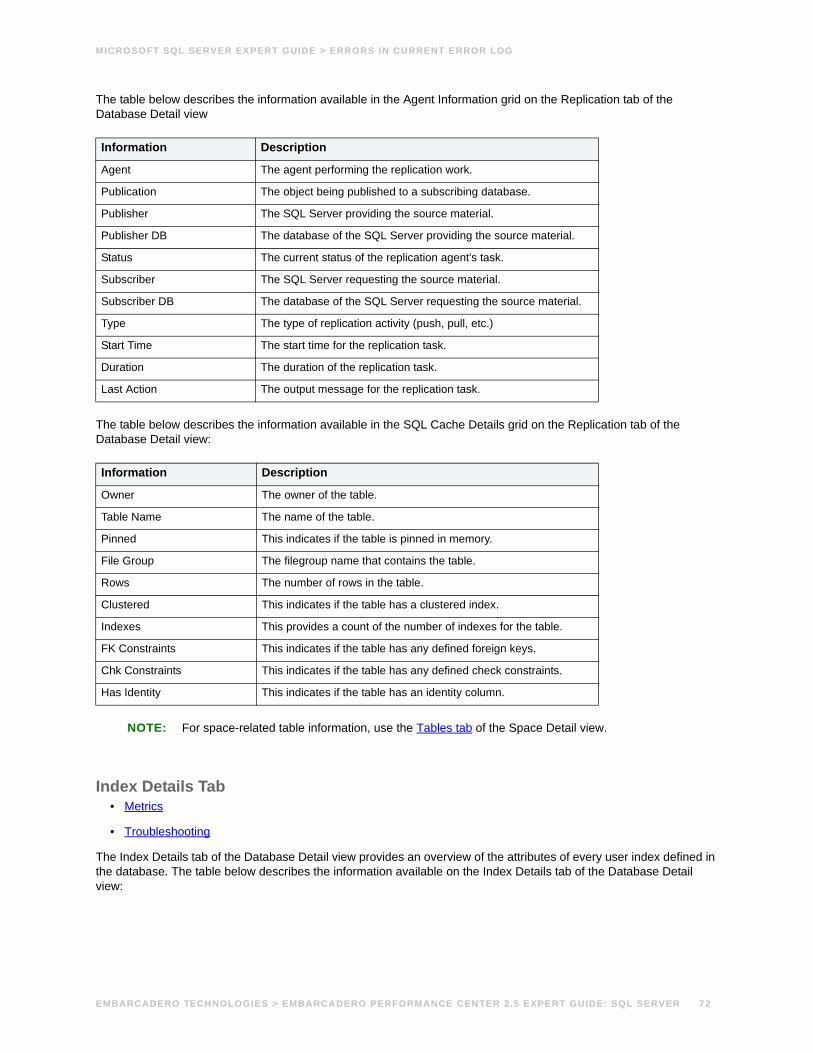
MICROSOFT SQL SERVER EXPERT GUIDE > ERRORS IN CURRENT ERROR LOG
The table below describes the information available in the Agent Information grid on the Replication tab of the Database Detail view
The table below describes the information available in the SQL Cache Details grid on the Replication tab of the Database Detail view:
NOTE: For space-related table information, use the Tables tab of the Space Detail view.
Index Details Tab• Metrics
• Troubleshooting
The Index Details tab of the Database Detail view provides an overview of the attributes of every user index defined in the database. The table below describes the information available on the Index Details tab of the Database Detail view:
Information Description
Agent The agent performing the replication work.
Publication The object being published to a subscribing database.
Publisher The SQL Server providing the source material.
Publisher DB The database of the SQL Server providing the source material.
Status The current status of the replication agent's task.
Subscriber The SQL Server requesting the source material.
Subscriber DB The database of the SQL Server requesting the source material.
Type The type of replication activity (push, pull, etc.)
Start Time The start time for the replication task.
Duration The duration of the replication task.
Last Action The output message for the replication task.
Information Description
Owner The owner of the table.
Table Name The name of the table.
Pinned This indicates if the table is pinned in memory.
File Group The filegroup name that contains the table.
Rows The number of rows in the table.
Clustered This indicates if the table has a clustered index.
Indexes This provides a count of the number of indexes for the table.
FK Constraints This indicates if the table has any defined foreign keys.
Chk Constraints This indicates if the table has any defined check constraints.
Has Identity This indicates if the table has an identity column.
EMBARCADERO TECHNOLOGIES > EMBARCADERO PERFORMANCE CENTER 2.5 EXPERT GUIDE: SQL SERVER 72
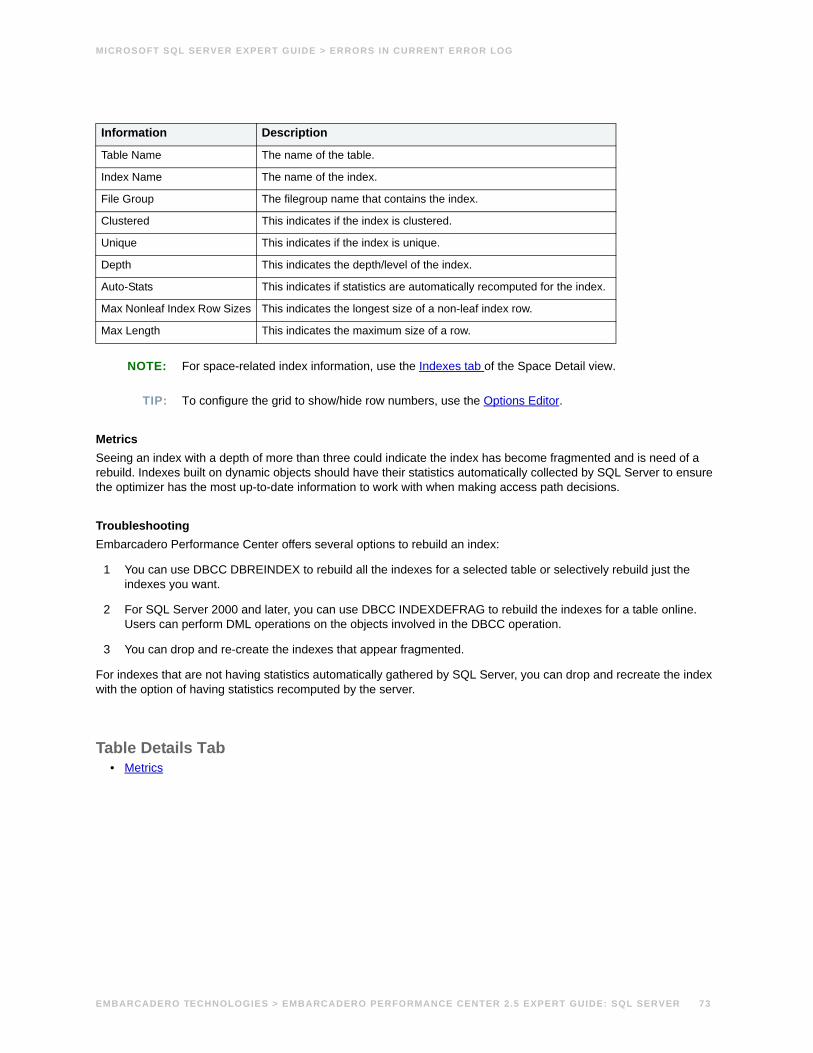
MICROSOFT SQL SERVER EXPERT GUIDE > ERRORS IN CURRENT ERROR LOG
NOTE: For space-related index information, use the Indexes tab of the Space Detail view.
TIP: To configure the grid to show/hide row numbers, use the Options Editor.
Metrics Seeing an index with a depth of more than three could indicate the index has become fragmented and is need of a rebuild. Indexes built on dynamic objects should have their statistics automatically collected by SQL Server to ensure the optimizer has the most up-to-date information to work with when making access path decisions.
Troubleshooting Embarcadero Performance Center offers several options to rebuild an index:
1 You can use DBCC DBREINDEX to rebuild all the indexes for a selected table or selectively rebuild just the indexes you want.
2 For SQL Server 2000 and later, you can use DBCC INDEXDEFRAG to rebuild the indexes for a table online. Users can perform DML operations on the objects involved in the DBCC operation.
3 You can drop and re-create the indexes that appear fragmented.
For indexes that are not having statistics automatically gathered by SQL Server, you can drop and recreate the index with the option of having statistics recomputed by the server.
Table Details Tab• Metrics
Information Description
Table Name The name of the table.
Index Name The name of the index.
File Group The filegroup name that contains the index.
Clustered This indicates if the index is clustered.
Unique This indicates if the index is unique.
Depth This indicates the depth/level of the index.
Auto-Stats This indicates if statistics are automatically recomputed for the index.
Max Nonleaf Index Row Sizes This indicates the longest size of a non-leaf index row.
Max Length This indicates the maximum size of a row.
EMBARCADERO TECHNOLOGIES > EMBARCADERO PERFORMANCE CENTER 2.5 EXPERT GUIDE: SQL SERVER 73
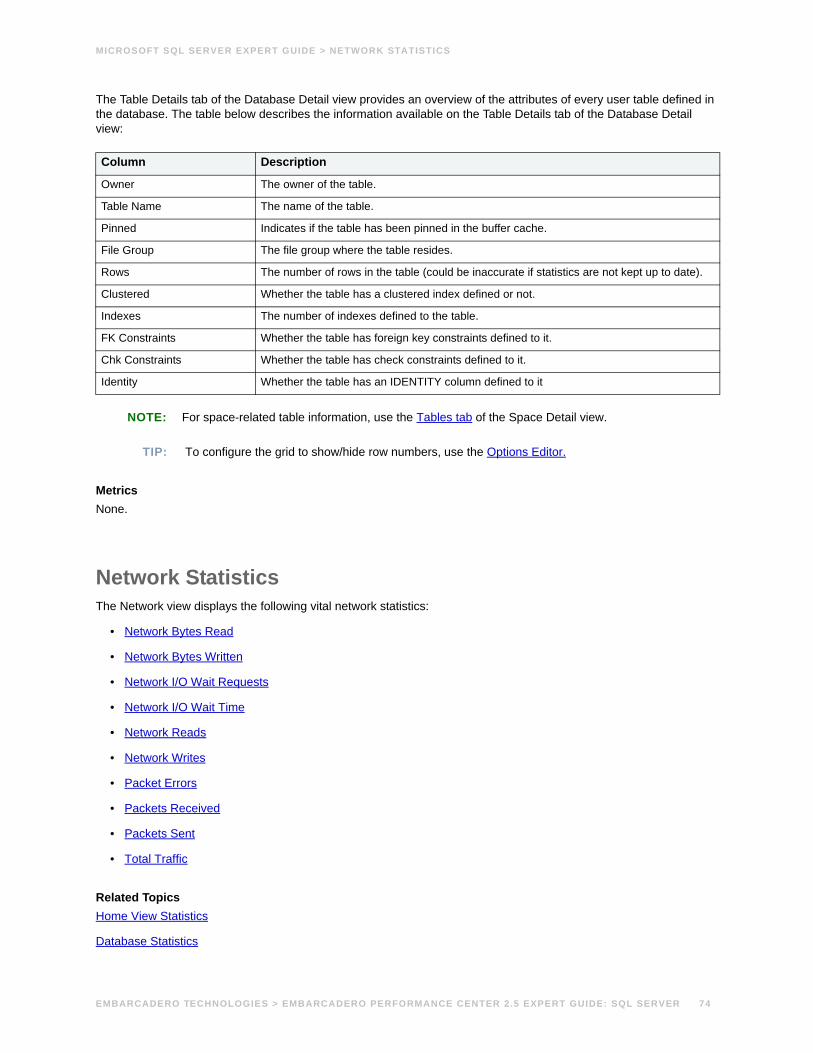
MICROSOFT SQL SERVER EXPERT GUIDE > NETWORK STATISTICS
The Table Details tab of the Database Detail view provides an overview of the attributes of every user table defined in the database. The table below describes the information available on the Table Details tab of the Database Detail view:
NOTE: For space-related table information, use the Tables tab of the Space Detail view.
TIP: To configure the grid to show/hide row numbers, use the Options Editor.
Metrics None.
Network StatisticsThe Network view displays the following vital network statistics:
• Network Bytes Read
• Network Bytes Written
• Network I/O Wait Requests
• Network I/O Wait Time
• Network Reads
• Network Writes
• Packet Errors
• Packets Received
• Packets Sent
• Total Traffic
Related TopicsHome View Statistics
Database Statistics
Column Description
Owner The owner of the table.
Table Name The name of the table.
Pinned Indicates if the table has been pinned in the buffer cache.
File Group The file group where the table resides.
Rows The number of rows in the table (could be inaccurate if statistics are not kept up to date).
Clustered Whether the table has a clustered index defined or not.
Indexes The number of indexes defined to the table.
FK Constraints Whether the table has foreign key constraints defined to it.
Chk Constraints Whether the table has check constraints defined to it.
Identity Whether the table has an IDENTITY column defined to it
EMBARCADERO TECHNOLOGIES > EMBARCADERO PERFORMANCE CENTER 2.5 EXPERT GUIDE: SQL SERVER 74
MICROSOFT SQL SERVER EXPERT GUIDE > NETWORK STATISTICS
Contention Statistics
I/O Statistics
Memory Statistics
Space Statistics
Users Statistics
Packets Received• Metrics
SQL Server counts incoming packets from the time the server is initiated. This statistic displays the delta count of all incoming packets received over the network since the last Embarcadero Performance Center sampling.
MetricsNone.
Packets Sent• Metrics
SQL Server counts outgoing packets from the time the server is initiated. This statistic displays the delta count of all outbound packets written to the network since the last Embarcadero Performance Center sampling.
MetricsNone.
Network Reads• Metrics
The number of network reads performed by SQL Server since the last Embarcadero Performance Center sampling.
MetricsNone.
Network Writes• Metrics
The number of network writes performed by SQL Server since the last Embarcadero Performance Center sampling.
MetricsNone.
EMBARCADERO TECHNOLOGIES > EMBARCADERO PERFORMANCE CENTER 2.5 EXPERT GUIDE: SQL SERVER 75
MICROSOFT SQL SERVER EXPERT GUIDE > NETWORK STATISTICS
Network Bytes Read• Metrics
The number of bytes that SQL Server read from the network since the last Embarcadero Performance Center sampling.
MetricsNone.
Network Bytes Written• Metrics
The number of bytes that SQL Server wrote to the network since the last Embarcadero Performance Center sampling.
MetricsNone.
Packet Errors• Metrics
• Troubleshooting
SQL Server counts packet errors from the time the server is first initiated. This statistic displays the delta count of all packet errors that occurred since the last Embarcadero Performance Center sampling.
MetricsThis value should remain low relative to your overall network stability and efficiency. Networks with great amounts of congestion and other traffic problems causes these errors to occur.
TroubleshootingIn the event that packet errors continues to remain elevated beyond what you would expect in your particular environment, contact a Network Administrator for assistance in tracking the problem.
Total Traffic• Metrics
The total number of packets that SQL Server received and sent over the network since the last Embarcadero Performance Center sampling.
MetricsNone.
Network I/O Wait Requests• Metrics
EMBARCADERO TECHNOLOGIES > EMBARCADERO PERFORMANCE CENTER 2.5 EXPERT GUIDE: SQL SERVER 76
MICROSOFT SQL SERVER EXPERT GUIDE > OS PAGE STATISTICS
The total number of times that SQL Server generated an I/O wait request since the last Embarcadero Performance Center sampling.
MetricsNone.
Network I/O Wait Time• Metrics
• Troubleshooting
The number of milliseconds that SQL Server remained in a wait state due to Network I/O Wait Requests since the last Embarcadero Performance Center sampling.
MetricsNone.
OS Page StatisticsIn many scenarios, an optimally tuned database may not perform well because there are constraints imposed by the system where the database is running. These constraints may include processes competing with the database sever for resources (CPU, I/O, or Memory), a slow CPU, insufficient or slow I/O devices, and insufficient memory. The OS Statistics page of Performance Center lets you examine operating system metrics for the following platforms:
• AIX
• HP-UX
NOTE: To view processor info and swap disk info on an HP-UX box, you need to login as ROOT in the OS login.
• Linux
• Solaris
• Unix
• Windows XP, 2000, and NT
Summary TabThe OS Summary tab displays the following statistics to communicate the general overall performance levels of the operating system:
• Disk Time
• Load Average
• Processor Time
• Paged Memory Used (Windows)
• Swap Memory Used (AIX, HP-UX, Linux, Solaris, Unix)
EMBARCADERO TECHNOLOGIES > EMBARCADERO PERFORMANCE CENTER 2.5 EXPERT GUIDE: SQL SERVER 77
MICROSOFT SQL SERVER EXPERT GUIDE > OS PAGE STATISTICS
• Average Disk Queue
• Network Output Queue (Windows)
• Network Queue (Solaris)
• Page Faults/Sec
• Processor Queue
• Processor Speed
• Processor
• Available Paged Memory (Windows)
• Available Physical Memory
• Available Swap Memory (AIX, HP-UX, Linux, Solaris, Unix)
• Total Paged Memory (Windows)
• Total Physical Memory
• Total Swap Memory (AIX, HP-UX, Linux, Solaris, Unix)
• Free Disk Space
• Total Disk Space
• Used Disk Space
• Number of Logins
• Number of Processes
• Number of Processors
• Top CPU Process
• Top I/O Process
• Top Memory Process
Processor TimeThe Processor Time statistic indicates the percentage of time the processor is working. This counter is a primary indicator of processor activity.
MetricsIf your computer seems to be running sluggishly, this statistic could be displaying a high percentage.
TroubleshootingUpgrade to a processor with a larger L2 cache, a faster processor, or install an additional processor.
Processor SpeedThe Processor Speed statistic displays the speed of the active processor in MHz. The speed is approximate.
EMBARCADERO TECHNOLOGIES > EMBARCADERO PERFORMANCE CENTER 2.5 EXPERT GUIDE: SQL SERVER 78
MICROSOFT SQL SERVER EXPERT GUIDE > OS PAGE STATISTICS
ProcessorThe Processor Statistic displays the type of processor currently in use, for example, GenuineIntel.
Disk TimeThe Disk Time statistic is the percentage of elapsed time that the selected disk drive/device was busy servicing read or write requests.
MetricsYou should avoid consistently seeing values for this statistic greater then 90%.
TroubleshootingAdd more disk drives and partition the files among all of the drives.
Load AverageThe Load Average statistic represents the system load averages over the last 1, 5, and 15 minutes.
MetricsHigh load averages usually mean that the system is being used heavily and the response time is correspondingly slow.
Paged Memory UsedThe Paged Memory Used statistic is the ratio of Commit Memory Bytes to the Commit Limit. Committed memory is where memory space has been reserved in the paging file if it needs to be written to disk. The commit limit is determined by the size of the paging file. As the paging file increases, so does the commit limit.
NOTE: This statistic is available for the Windows platform.
MetricsThis value displays the current percentage value only and not an average. If the percentage of paged memory used is above 90%, you may be running out of memory.
TroubleshootingIncrease the size of page file.
Number of ProcessorsThis statistic displays the number of processors currently in use.
Swap Memory UsedThe Swap Memory Used statistic is the percentage of swap space currently in use.
EMBARCADERO TECHNOLOGIES > EMBARCADERO PERFORMANCE CENTER 2.5 EXPERT GUIDE: SQL SERVER 79
MICROSOFT SQL SERVER EXPERT GUIDE > OS PAGE STATISTICS
MetricsIf the percentage of swap memory used is above 90%, you may be running out of memory.
TroubleshootingIncrease the size of your swap files.
Average Disk QueueThe Average Disk Queue statistic is the average number of both read and write requests that were queued for the selected disk during the sample interval.
MetricsThis metric is useful in identifying I/O related bottlenecks. If the disk queue lengths for certain disks are consistently much higher than others, you may need to redistribute the load among available disks. If the disk queues lengths for all disks are consistently large, and you see a high amount of I/O activity, your disks may be inefficient.
TroubleshootingSome things you can do if you have problems with this statistic include:
• Redistribute the data on the disk with the large average disk queue to other disks.
• Upgrade to faster disk(s).
Page Faults/SecThe Page Faults/Sec statistic is the overall rate faulted pages are handled by the processor. It is measured in numbers of pages faulted per second. A page fault occurs when a process requires code or data that is not in its working set. This counter includes both hard faults and soft faults.
MetricsThis counter displays the difference between the values observed in the last two samples, divided by the duration of the sample interval.
TroubleshootingIf the number of page faults remains consistently high, you can check with your Windows System Administrator for further investigation. Often, large numbers of page faults are not a problem so long as they are soft faults. However, hard faults, that require disk access, can cause delays.
Processor QueueThe Processor Queue Length statistic is the number of threads in the processor queue.
MetricsUnlike the disk counters, this counter shows ready threads only, not threads that are running. There is a single queue for processor time even on computers with multiple processors. Therefore, if a computer has multiple processors, you need to divide this value by the number of processors servicing the workload. A sustained processor queue of less than 10 threads per processor is normally acceptable, dependent of the workload.
EMBARCADERO TECHNOLOGIES > EMBARCADERO PERFORMANCE CENTER 2.5 EXPERT GUIDE: SQL SERVER 80
MICROSOFT SQL SERVER EXPERT GUIDE > OS PAGE STATISTICS
TroubleshootingA sustained high value in the Processor Queue could indicate that a processor bottleneck has developed due to threads of a process requiring more process cycles than are available. If this is the case, you should look at installing a faster (or an additional) processor.
Network Output Queue/Network QueueThe Network Output Queue Length statistic is the number of threads in the processor queue.
NOTE: The name of this statistic depends on the platform of the operating system.
MetricsUnlike the disk counters, this counter shows ready threads only, not threads that are running. There is a single queue for processor time even on computers with multiple processors. Therefore, if a computer has multiple processors, you need to divide this value by the number of processors servicing the workload. A sustained processor queue of less than 10 threads per processor is normally acceptable, dependent of the workload.
TroubleshootingA sustained high value in the Processor Queue Length could indicate that a processor bottleneck has developed due to threads of a process requiring more process cycles than are available. If this is the case, you should look at installing a faster (or an additional) processor.
Available Physical MemoryThe Available Physical Memory statistic represents the amount of RAM available to all processes.
MetricsThis counter displays the last observed value only and not an average. Use this value with the Total physical memory and paging metrics (Memory details page). If the available physical memory is very small compared to this value, and the paging activity is high, your system may be running low on memory.
TroubleshootingSome things you can do if you have problems with this statistic include:
• Check the running processes to see if there are any memory leaks.
• Stop any services that are not required.
• Install additional RAM.
Available Paged MemoryThe Available Paged Memory statistic shows the amount of virtual memory available for the processes.
NOTE: This statistic is available for the Windows platform.
MetricsIf the available virtual memory is less than 10% of the total virtual memory, your system may run out of memory.
EMBARCADERO TECHNOLOGIES > EMBARCADERO PERFORMANCE CENTER 2.5 EXPERT GUIDE: SQL SERVER 81
MICROSOFT SQL SERVER EXPERT GUIDE > OS PAGE STATISTICS
TroubleshootingIncrease the size of page file.
Available Swap MemoryThe Available Swap Memory statistic represents the amount of virtual memory available for the processes.
MetricsIf the available Available Swap Memory is less than 10% of the total Swap Memory, your system may run out of memory.
TroubleshootingIncrease the size of swap files.
Total Physical MemoryThe Total Physical Memory statistic shows the amount of physical memory installed on your computer.
MetricsThis is an informational metric and displays the total amount installed on the machine. Use this value with the available physical memory and paging metrics (Memory details page). If the available physical memory is very small compared to this value, and the paging activity is high, your system may be running low on memory.
Total Paged Memory/Total Swap MemoryThe Total Paged Memory statistic shows the maximum amount of virtual memory available to all processes.
NOTE: The name of this statistic depends on the platform of the operating system.
MetricsIt is recommended that this value is between 1.5 to 3 times the amount of RAM on the system.
Used Disk SpaceThe Used Disk Space statistic shows the amount of allocated space, in megabytes on all logical disk drives.
TroubleshootingThere are many things a DBA can do to ensure that a database does not encounter a space problem due to physical space limitations:
• If a database currently resides on a disk that has little free space, you can add more files to the database. Of course, you should add the new files to other physical hard disks that can accommodate a growing database.
• You should examine hard disks with shrinking disk space to see if you can relocate or delete files to allow more free space.
EMBARCADERO TECHNOLOGIES > EMBARCADERO PERFORMANCE CENTER 2.5 EXPERT GUIDE: SQL SERVER 82
MICROSOFT SQL SERVER EXPERT GUIDE > OS PAGE STATISTICS
Total Disk SpaceTotal Disk Space displays the total allocated and unallocated space, in megabytes on all logical disk drives.
TroubleshootingThere are many things a DBA can do to ensure that a database does not encounter a space problem due to physical space limitations, here are two:
1 If a database currently resides on a disk that has little free space, you can add more files to the database. Of course, you should add the new files to other physical hard disks that can accommodate a growing database.
2 You should examine hard disks with shrinking disk space to see if you can relocate or delete files to allow more free space.
Free Disk SpaceThe Free Disk Space statistic shows the unallocated space, in megabytes on all logical disk drives.
TroubleshootingThere are many things a DBA can do to ensure that a database does not encounter a space problem due to physical space limitations:
• If a database currently resides on a disk that has little free space, you can add more files to the database. Of course, you should add the new files to other physical hard disks that can accommodate a growing database.
• You should examine hard disks with shrinking disk space to see if you can relocate or delete files to allow more free space.
Top Memory ProcessTop Memory Process shows the current process that is consuming the most amount of memory. The information displayed is dependent on the platform of the operating system. Information displayed includes the name of the process, process ID, amount of memory consumed expressed in KB, amount of CPU expressed as a percentage, the amount of Major Page Faults, and the amount of I/O expressed in KB/sec.
MetricsIf you are running out of memory on the system, this is a quick way to identify the top memory user. If the displayed process is using a significant portion of the total memory, it could be causing the memory issues.
Processes OverviewThe Processes Overview of the OS Summary includes the following sections:
• Top CPU Process
• Top I/O Process
• Top Memory Process
EMBARCADERO TECHNOLOGIES > EMBARCADERO PERFORMANCE CENTER 2.5 EXPERT GUIDE: SQL SERVER 83
MICROSOFT SQL SERVER EXPERT GUIDE > OS PAGE STATISTICS
Top CPU ProcessTop CPU Process shows the current process that is consuming the most amount of CPU. The information displayed is dependent on the platform of the operating system. Information displayed includes the name of the process, process ID, amount of memory consumed expressed in KB, amount of CPU expressed as a percentage, the amount of Major Page Faults, and the amount of I/O expressed in KB/sec.
MetricsIf the amount of CPU time used by this process is close to 100% and the CPU usage is very high, this process may be the bottleneck on the server.
TroubleshootingInvestigate the process further to see if it is in an inconsistent state. Also, look at minimum requirements for CPU speed for the process. You may need to upgrade your CPU.
Top I/O ProcessThe Top I/O Process statistic shows the current process that is consuming the most amount of CPU. The information displayed is dependent on the platform of the operating system. Information displayed includes the name of the process, process ID, amount of memory consumed expressed in KB, amount of CPU expressed as a percentage, the amount of Major Page Faults, and the amount of I/O expressed in KB/sec.
Number of LoginsThis statistic displays the total number of logins on the server.
Number of ProcessesThis statistic displays the total number of processes on the server.
CPU TabThe CPU tab of the OS Detail includes the following sections:
• Context Switches/Sec
• CPU Utilization
• Interrupts/Sec
• Processor Queue Length
CPU UtilizationThe CPU Utilization section includes the following information:
• % Privileged Time
• % User Time
EMBARCADERO TECHNOLOGIES > EMBARCADERO PERFORMANCE CENTER 2.5 EXPERT GUIDE: SQL SERVER 84
MICROSOFT SQL SERVER EXPERT GUIDE > OS PAGE STATISTICS
% Privileged TimeThe % Privileged Time statistic is the percentage of elapsed time that the process threads spent executing code in privileged mode.
NOTE: For Windows systems, when a Windows system service is called, the service will often run in privileged mode to gain access to system-private data. Such data is protected from access by threads executing in user mode. Calls to the system can be explicit or implicit, such as page faults or interrupts. These kernel commands, are considered privileged to keep the low-level commands executing and prevent a system freeze. Unlike some early operating systems, Windows uses process boundaries for subsystem protection in addition to the traditional protection of user and privileged modes. Some work done by Windows on behalf of the application might appear in other subsystem processes in addition to the privileged time in the process.
MetricsThe ideal range should be 0-40% (less than 40% indicates excessive system activity).
TroubleshootingIf your CPU consistently runs at less than 40% you may need to upgrade your system to include a faster processor(s).
% User TimeThe % User Time statistic is the percentage of elapsed time the processor spends in the user mode. User mode is a restricted processing mode designed for applications, environment subsystems, and integral subsystems. The alternative, privileged mode, is designed for operating system components and allows direct access to hardware and all memory. The operating system switches application threads to privileged mode to access operating system services. This counter displays the average busy time as a percentage of the sample time.
MetricsIf the Privileged Time is high in conjunction with Physical Disk Reads, consider upgrading the disk I/O subsystem.
Interrupts/SecThe Interrupts/Sec statistic is the average rate, in incidents per second, at which the processor received and serviced hardware interrupts. It does not include deferred procedure calls (DPCs), which are counted separately. This value is an indirect indicator of the activity of devices that generate interrupts, such as the system clock, the mouse, disk drivers, data communication lines, network interface cards, and other peripheral devices. These devices normally interrupt the processor when they have completed a task or require attention. Normal thread execution is suspended. The system clock typically interrupts the processor every ten milliseconds, creating a background of interrupt activity. This counter displays the difference between the values observed in the last two samples, divided by the duration of the sample interval.
MetricsThe ideal rage should be 0-5000. A number greater then 5000 indicates possible excessive hardware interrupts; justification is dependent on device activity.
Context Switches/SecThe Context Switches/Sec section shows the combined rate at which all processors on the computer are switched from one thread to another. Context switches occur when a running thread voluntarily relinquishes the processor, is preempted by a higher priority ready thread, or switches between user-mode and privileged (kernel) mode to use an Executive or subsystem service.
EMBARCADERO TECHNOLOGIES > EMBARCADERO PERFORMANCE CENTER 2.5 EXPERT GUIDE: SQL SERVER 85
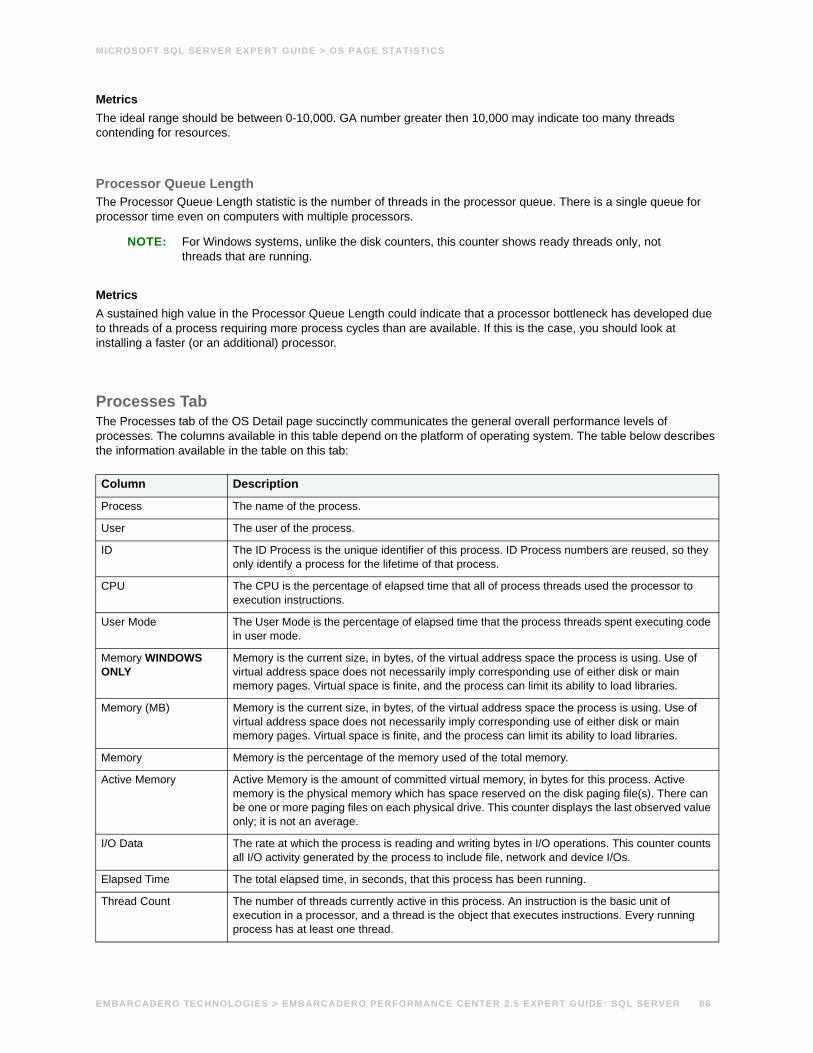
MICROSOFT SQL SERVER EXPERT GUIDE > OS PAGE STATISTICS
MetricsThe ideal range should be between 0-10,000. GA number greater then 10,000 may indicate too many threads contending for resources.
Processor Queue LengthThe Processor Queue Length statistic is the number of threads in the processor queue. There is a single queue for processor time even on computers with multiple processors.
NOTE: For Windows systems, unlike the disk counters, this counter shows ready threads only, not threads that are running.
MetricsA sustained high value in the Processor Queue Length could indicate that a processor bottleneck has developed due to threads of a process requiring more process cycles than are available. If this is the case, you should look at installing a faster (or an additional) processor.
Processes TabThe Processes tab of the OS Detail page succinctly communicates the general overall performance levels of processes. The columns available in this table depend on the platform of operating system. The table below describes the information available in the table on this tab:
Column Description
Process The name of the process.
User The user of the process.
ID The ID Process is the unique identifier of this process. ID Process numbers are reused, so they only identify a process for the lifetime of that process.
CPU The CPU is the percentage of elapsed time that all of process threads used the processor to execution instructions.
User Mode The User Mode is the percentage of elapsed time that the process threads spent executing code in user mode.
Memory WINDOWS ONLY
Memory is the current size, in bytes, of the virtual address space the process is using. Use of virtual address space does not necessarily imply corresponding use of either disk or main memory pages. Virtual space is finite, and the process can limit its ability to load libraries.
Memory (MB) Memory is the current size, in bytes, of the virtual address space the process is using. Use of virtual address space does not necessarily imply corresponding use of either disk or main memory pages. Virtual space is finite, and the process can limit its ability to load libraries.
Memory Memory is the percentage of the memory used of the total memory.
Active Memory Active Memory is the amount of committed virtual memory, in bytes for this process. Active memory is the physical memory which has space reserved on the disk paging file(s). There can be one or more paging files on each physical drive. This counter displays the last observed value only; it is not an average.
I/O Data The rate at which the process is reading and writing bytes in I/O operations. This counter counts all I/O activity generated by the process to include file, network and device I/Os.
Elapsed Time The total elapsed time, in seconds, that this process has been running.
Thread Count The number of threads currently active in this process. An instruction is the basic unit of execution in a processor, and a thread is the object that executes instructions. Every running process has at least one thread.
EMBARCADERO TECHNOLOGIES > EMBARCADERO PERFORMANCE CENTER 2.5 EXPERT GUIDE: SQL SERVER 86
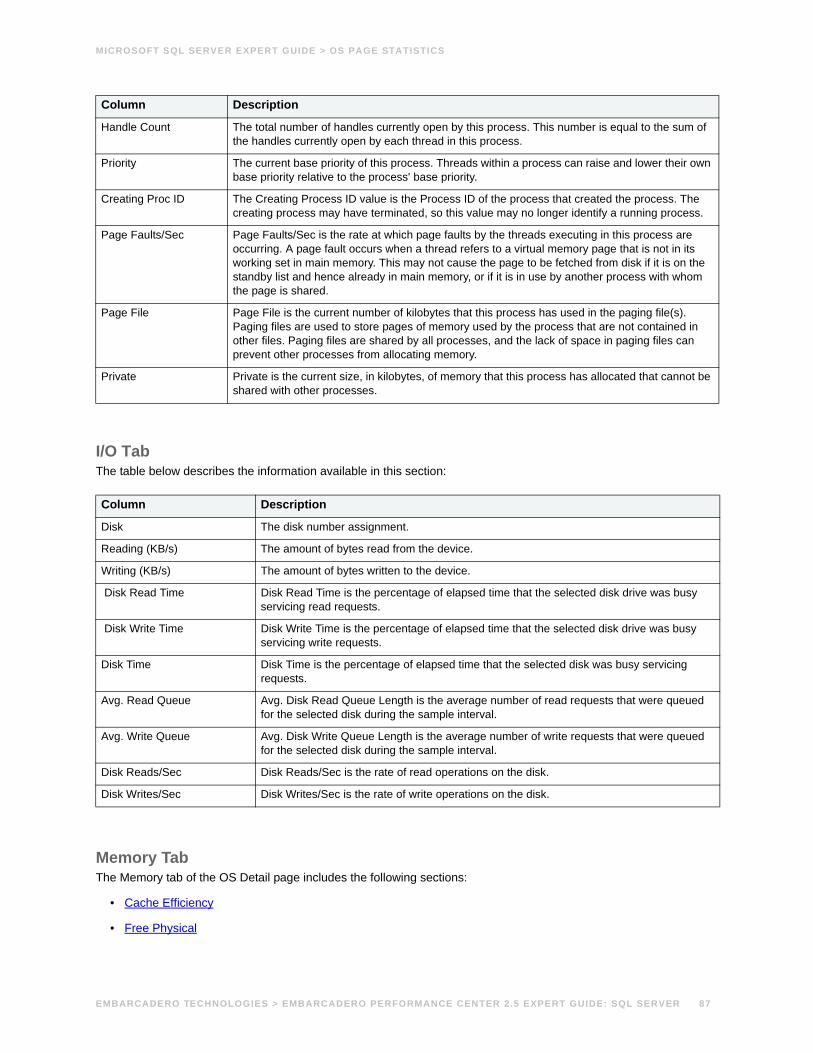
MICROSOFT SQL SERVER EXPERT GUIDE > OS PAGE STATISTICS
I/O TabThe table below describes the information available in this section:
Memory TabThe Memory tab of the OS Detail page includes the following sections:
• Cache Efficiency
• Free Physical
Handle Count The total number of handles currently open by this process. This number is equal to the sum of the handles currently open by each thread in this process.
Priority The current base priority of this process. Threads within a process can raise and lower their own base priority relative to the process' base priority.
Creating Proc ID The Creating Process ID value is the Process ID of the process that created the process. The creating process may have terminated, so this value may no longer identify a running process.
Page Faults/Sec Page Faults/Sec is the rate at which page faults by the threads executing in this process are occurring. A page fault occurs when a thread refers to a virtual memory page that is not in its working set in main memory. This may not cause the page to be fetched from disk if it is on the standby list and hence already in main memory, or if it is in use by another process with whom the page is shared.
Page File Page File is the current number of kilobytes that this process has used in the paging file(s). Paging files are used to store pages of memory used by the process that are not contained in other files. Paging files are shared by all processes, and the lack of space in paging files can prevent other processes from allocating memory.
Private Private is the current size, in kilobytes, of memory that this process has allocated that cannot be shared with other processes.
Column Description
Disk The disk number assignment.
Reading (KB/s) The amount of bytes read from the device.
Writing (KB/s) The amount of bytes written to the device.
Disk Read Time Disk Read Time is the percentage of elapsed time that the selected disk drive was busy servicing read requests.
Disk Write Time Disk Write Time is the percentage of elapsed time that the selected disk drive was busy servicing write requests.
Disk Time Disk Time is the percentage of elapsed time that the selected disk was busy servicing requests.
Avg. Read Queue Avg. Disk Read Queue Length is the average number of read requests that were queued for the selected disk during the sample interval.
Avg. Write Queue Avg. Disk Write Queue Length is the average number of write requests that were queued for the selected disk during the sample interval.
Disk Reads/Sec Disk Reads/Sec is the rate of read operations on the disk.
Disk Writes/Sec Disk Writes/Sec is the rate of write operations on the disk.
Column Description
EMBARCADERO TECHNOLOGIES > EMBARCADERO PERFORMANCE CENTER 2.5 EXPERT GUIDE: SQL SERVER 87
MICROSOFT SQL SERVER EXPERT GUIDE > OS PAGE STATISTICS
• Free Paged
• Paging Activity
• Page Faults
• Total Physical
• Total Paged
Paging ActivityThe Paging Activity section includes the following statistics:
• Pages Input/Sec
• Pages Output/Sec
Pages Input/SecThe Pages Input/Sec statistic is the number of pages read from disk to resolve hard page faults. Hard page faults occur when a process requires code or data that is not in its working set or elsewhere in physical memory, and must be retrieved from disk.
MetricsThis value was designed as a primary indicator of the kinds of faults that cause system-wide delays. It includes pages retrieved to satisfy faults in the file system cache (usually requested by applications) and in non-cached mapped memory files. This counter counts numbers of pages, and can be compared to other counts of pages, such as Memory: Page Faults/sec, without conversion. This counter displays the difference between the values observed in the last two samples, divided by the duration of the sample interval.
TroubleshootingAlthough it never hurts to have as much physical memory as your system can handle, there are some things you can check within your system to alleviate the memory bottleneck.
• Check to see if you have any drivers or protocols that are running but not being used. They use space in all memory pools even if they are idle.
• Check to see if you have additional space on your disk drive that you could use to expand the size of your page file. Normally, the bigger the initial size of your page file, the better, in performance terms.
Pages Output/SecThe Pages Output/Sec statistic is the number of pages written to disk to free up space in physical memory. Pages are written back to disk only if they are changed in physical memory. A high rate of pages output might indicate a memory shortage.
MetricsWindows NT writes more pages back to disk to free up space when low in physical memory. This counter counts numbers of pages, and can be compared to other counts of pages, without conversion. This counter displays the difference between the values observed in the last two samples, divided by the duration of the sample interval.
TroubleshootingAlthough it never hurts to have as much physical memory as your system can handle, there are some things you can check within your system to alleviate the memory bottleneck.
EMBARCADERO TECHNOLOGIES > EMBARCADERO PERFORMANCE CENTER 2.5 EXPERT GUIDE: SQL SERVER 88
MICROSOFT SQL SERVER EXPERT GUIDE > OS PAGE STATISTICS
• Check to see if you have any drivers or protocols that are running but not being used. They use space in all memory pools even if they are idle.
• Check to see if you have additional space on your disk drive that you could use to expand the size of your page file. Normally, the bigger the initial size of your page file, the better, in performance terms.
Free PhysicalThe Free Physical statistic is the amount of physical memory that is uncommitted.
MetricsNone.
Free PagedThe Free Paged statistic is the amount of uncommitted virtual memory.
MetricsNone.
Total PhysicalThe Total Physical statistic is the total physical memory available.
MetricsNone.
Total PagedThe Total Paged statistic is the amount of total virtual memory, in bytes. Used Memory is the physical memory that has space reserved on the disk paging file(s). There can be one or more paging files on each physical drive.
MetricsNone.
Page Faults/SecThe Page Faults/Sec statistic is the overall rate faulted pages are handled by the processor. It is measured in numbers of pages faulted per second. A page fault occurs when a process requires code or data that is not in its working set. This counter includes both hard faults and soft faults.
MetricsThis counter displays the difference between the values observed in the last two samples, divided by the duration of the sample interval.
TroubleshootingIf the number of page faults remains consistently high, you can check with your Windows System Administrator for further investigation. Often, large numbers of page faults are not a problem so long as they are soft faults. However, hard faults, that require disk access, can cause delays.
EMBARCADERO TECHNOLOGIES > EMBARCADERO PERFORMANCE CENTER 2.5 EXPERT GUIDE: SQL SERVER 89
MICROSOFT SQL SERVER EXPERT GUIDE > OS PAGE STATISTICS
Cache EfficiencyThe Cache Efficiency section of the Memory tab succinctly communicates the general overall performance levels of the server's memory. The following statistics are available in this section:
• Copy Read Hits%
• Data Map Hits%
• MDL Read Hits%
• Pin Read Hits%
Copy Read Hits %The Copy Read Hits % statistic is the percentage of cache copy read requests that hit the cache and does not require a disk read to provide access to the page in the cache.
MetricsWhen the page is pinned in the memory, the page's physical address in the file system cache will not be altered. A copy read is a file read operation where a page in the cache is copied to the application's buffer. Because this value reflects hits, it ideally should be close to 100%. An amount below 100% indicates misses.
TroubleshootingAdding physical memory to a server results in a larger file system cache, which is generally more efficient. Defragmenting disks also helps, putting related pages in the cache together and thereby improving the cache hit rate
Data Map Hits %The Data Map Hits % statistic is the percentage of data maps in the file system cache that could be resolved without having to retrieve a page from the disk.
MetricsBecause this value reflects hits, it ideally should be close to 100%. An amount below 100% indicates misses.
TroubleshootingAdding physical memory to a server results in a larger file system cache, which is generally more efficient. Defragmenting disks also helps, putting related pages in the cache together and thereby improving the cache hit rate.
MDL Read Hits %The MDL Read Hits % statistic is the percentage of Memory Descriptor List Read requests to the file system cache that hit the cache and does not require disk access to provide memory access to the pages in the cache.
MetricsBecause this value reflects hits, it ideally should be close to 100%. An amount below 100% indicates misses.
TroubleshootingAdding physical memory to a server results in a larger file system cache, which is generally more efficient. Defragmenting disks also helps, putting related pages in the cache together and thereby improving the cache hit rate.
EMBARCADERO TECHNOLOGIES > EMBARCADERO PERFORMANCE CENTER 2.5 EXPERT GUIDE: SQL SERVER 90
MICROSOFT SQL SERVER EXPERT GUIDE > OS PAGE STATISTICS
Pin Read Hits %The Pin Read Hits % statistic is the percentage of pin read requests that hit the file system cache and does not require a disk read in order to provide access to the page in the file system cache.
MetricsBecause this value reflects hits, it ideally should be close to 100%. An amount below 100% indicates misses.
TroubleshootingAdding physical memory to a server results in a larger file system cache, which is generally more efficient. Defragmenting disks also helps, putting related pages in the cache together and thereby improving the cache hit rate.
Space TabThe Space tab of the OS Detail page includes the following sections:
• Disk Space Free
• Disk Space Detail
Disk Space FreeThe Disk Space Free metric displays the amount of free disk space in megabytes.
MetricNone.
Disk Space Detail The Disk Space Detail section of the Space tab succinctly communicates the general overall performance levels of the server’s disks and space allotment. The table below describes the statistics in this section:
Network TabThe Network tab of the OS Detail page succinctly communicates the general overall performance levels of the server's networking. The statistics available in this section depend on the platform of operating system. The table below describes the information available in this section:
Statistic Description
Partition The drive letter of the disk.
Local Filesystem The name of the file system.
Type The type of file system.
Total Space Total size of the disk/device's capacity expressed in MBs.
Used Space Amount of MBs currently allocated on the particular disk/device.
Free Space Amount of MBs currently unallocated and free on the particular disk/device.
Capacity The percentage of space used on the device.
Mounted On The mount point of the device.
EMBARCADERO TECHNOLOGIES > EMBARCADERO PERFORMANCE CENTER 2.5 EXPERT GUIDE: SQL SERVER 91
MICROSOFT SQL SERVER EXPERT GUIDE > OS PAGE STATISTICS
Column Description
Network Interface The name of network interface.
INET Address/Address The IP address assigned to the network interface.
Pkts Sent/Sec The number of packets sent per second.
Pkts Received/Sec The number of packets received per second.
Sent (KB/Sec) The number of bytes sent per second.
Received (KB/Sec) The number of bytes received per second.
Out Pkts Discarded The number of outbound packets discarded.
In Pkts Discarded The number of inbound packets discarded.
Out Pkt Errors The number of outbound packet errors.
In Pkt Errors The number of inbound packet errors.
Queue Length The queue length.
Collisions The number of collisions.
Packets Discarded The number of packets discarded.
EMBARCADERO TECHNOLOGIES > EMBARCADERO PERFORMANCE CENTER 2.5 EXPERT GUIDE: SQL SERVER 92
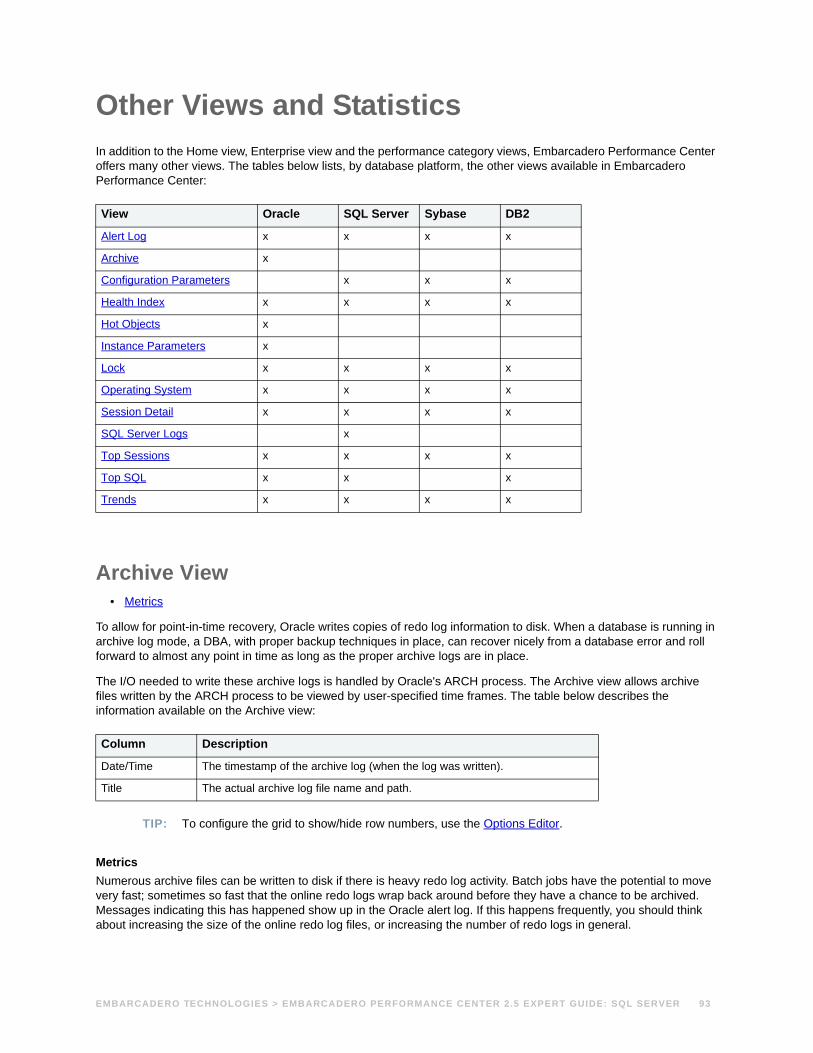
Other Views and StatisticsIn addition to the Home view, Enterprise view and the performance category views, Embarcadero Performance Center offers many other views. The tables below lists, by database platform, the other views available in Embarcadero Performance Center:
Archive View• Metrics
To allow for point-in-time recovery, Oracle writes copies of redo log information to disk. When a database is running in archive log mode, a DBA, with proper backup techniques in place, can recover nicely from a database error and roll forward to almost any point in time as long as the proper archive logs are in place.
The I/O needed to write these archive logs is handled by Oracle's ARCH process. The Archive view allows archive files written by the ARCH process to be viewed by user-specified time frames. The table below describes the information available on the Archive view:
TIP: To configure the grid to show/hide row numbers, use the Options Editor.
MetricsNumerous archive files can be written to disk if there is heavy redo log activity. Batch jobs have the potential to move very fast; sometimes so fast that the online redo logs wrap back around before they have a chance to be archived. Messages indicating this has happened show up in the Oracle alert log. If this happens frequently, you should think about increasing the size of the online redo log files, or increasing the number of redo logs in general.
View Oracle SQL Server Sybase DB2
Alert Log x x x x
Archive x
Configuration Parameters x x x
Health Index x x x x
Hot Objects x
Instance Parameters x
Lock x x x x
Operating System x x x x
Session Detail x x x x
SQL Server Logs x
Top Sessions x x x x
Top SQL x x x
Trends x x x x
Column Description
Date/Time The timestamp of the archive log (when the log was written).
Title The actual archive log file name and path.
EMBARCADERO TECHNOLOGIES > EMBARCADERO PERFORMANCE CENTER 2.5 EXPERT GUIDE: SQL SERVER 93
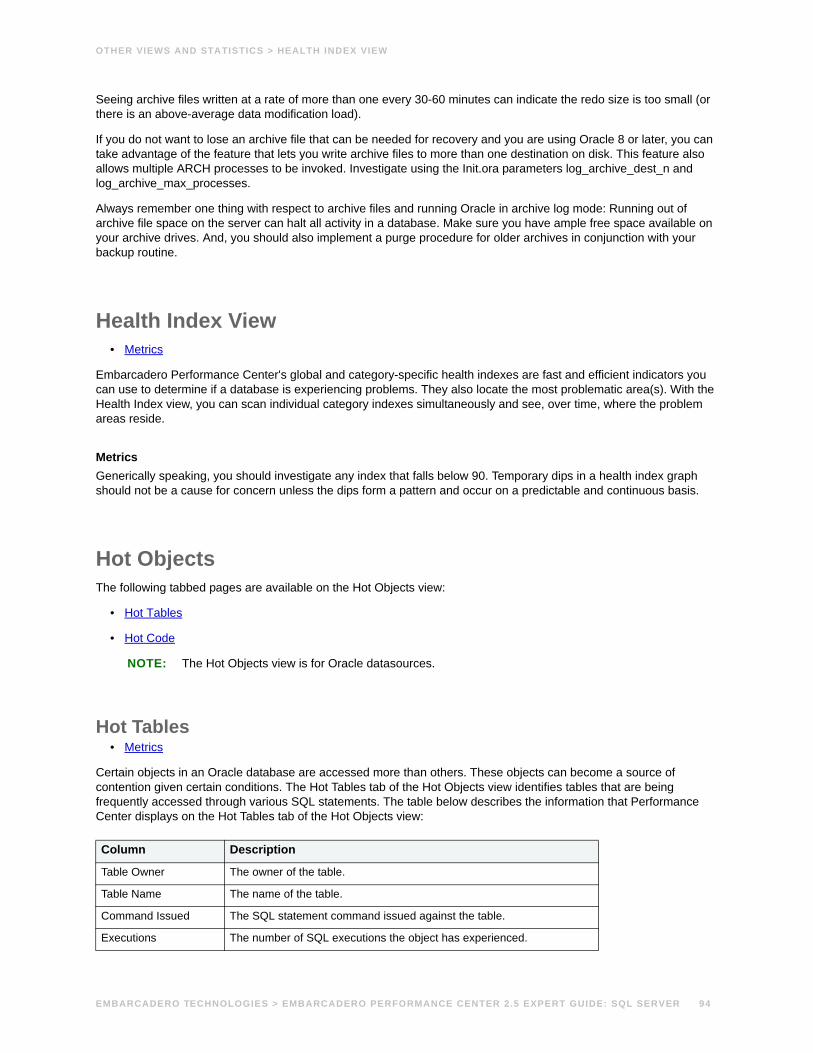
OTHER VIEWS AND STATISTICS > HEALTH INDEX VIEW
Seeing archive files written at a rate of more than one every 30-60 minutes can indicate the redo size is too small (or there is an above-average data modification load).
If you do not want to lose an archive file that can be needed for recovery and you are using Oracle 8 or later, you can take advantage of the feature that lets you write archive files to more than one destination on disk. This feature also allows multiple ARCH processes to be invoked. Investigate using the Init.ora parameters log_archive_dest_n and log_archive_max_processes.
Always remember one thing with respect to archive files and running Oracle in archive log mode: Running out of archive file space on the server can halt all activity in a database. Make sure you have ample free space available on your archive drives. And, you should also implement a purge procedure for older archives in conjunction with your backup routine.
Health Index View • Metrics
Embarcadero Performance Center's global and category-specific health indexes are fast and efficient indicators you can use to determine if a database is experiencing problems. They also locate the most problematic area(s). With the Health Index view, you can scan individual category indexes simultaneously and see, over time, where the problem areas reside.
MetricsGenerically speaking, you should investigate any index that falls below 90. Temporary dips in a health index graph should not be a cause for concern unless the dips form a pattern and occur on a predictable and continuous basis.
Hot ObjectsThe following tabbed pages are available on the Hot Objects view:
• Hot Tables
• Hot Code
NOTE: The Hot Objects view is for Oracle datasources.
Hot Tables• Metrics
Certain objects in an Oracle database are accessed more than others. These objects can become a source of contention given certain conditions. The Hot Tables tab of the Hot Objects view identifies tables that are being frequently accessed through various SQL statements. The table below describes the information that Performance Center displays on the Hot Tables tab of the Hot Objects view:
Column Description
Table Owner The owner of the table.
Table Name The name of the table.
Command Issued The SQL statement command issued against the table.
Executions The number of SQL executions the object has experienced.
EMBARCADERO TECHNOLOGIES > EMBARCADERO PERFORMANCE CENTER 2.5 EXPERT GUIDE: SQL SERVER 94
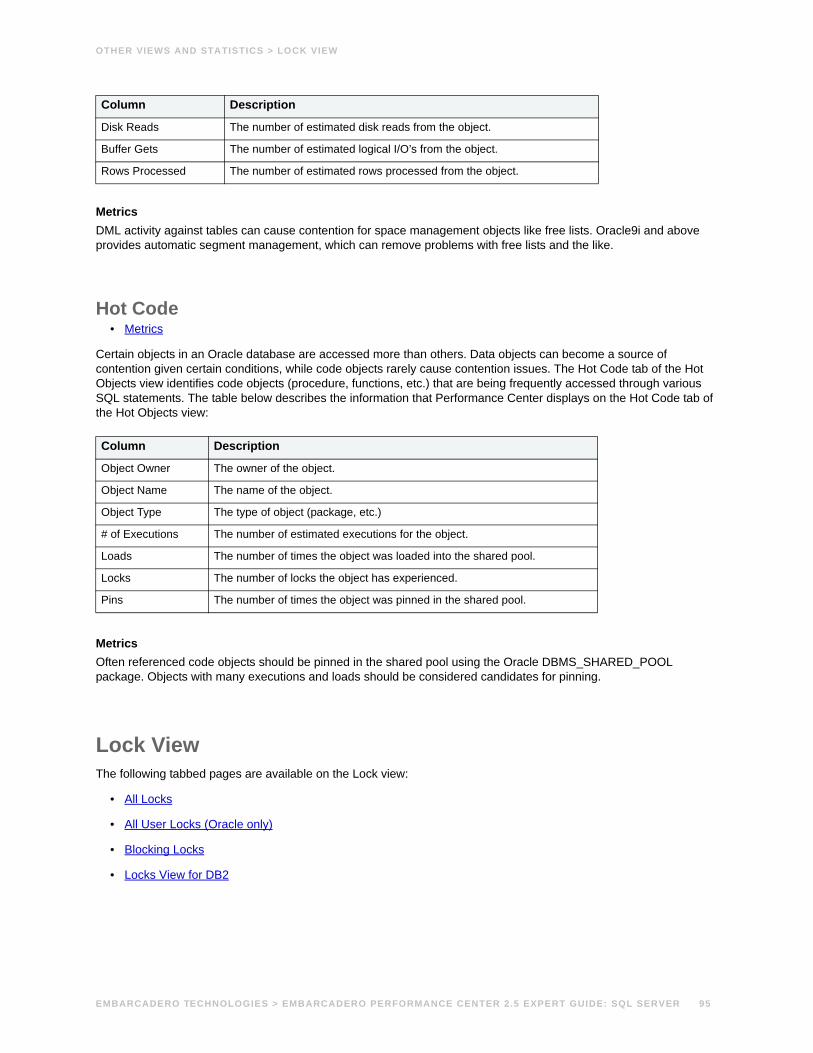
OTHER VIEWS AND STATISTICS > LOCK VIEW
MetricsDML activity against tables can cause contention for space management objects like free lists. Oracle9i and above provides automatic segment management, which can remove problems with free lists and the like.
Hot Code• Metrics
Certain objects in an Oracle database are accessed more than others. Data objects can become a source of contention given certain conditions, while code objects rarely cause contention issues. The Hot Code tab of the Hot Objects view identifies code objects (procedure, functions, etc.) that are being frequently accessed through various SQL statements. The table below describes the information that Performance Center displays on the Hot Code tab of the Hot Objects view:
MetricsOften referenced code objects should be pinned in the shared pool using the Oracle DBMS_SHARED_POOL package. Objects with many executions and loads should be considered candidates for pinning.
Lock ViewThe following tabbed pages are available on the Lock view:
• All Locks
• All User Locks (Oracle only)
• Blocking Locks
• Locks View for DB2
Disk Reads The number of estimated disk reads from the object.
Buffer Gets The number of estimated logical I/O’s from the object.
Rows Processed The number of estimated rows processed from the object.
Column Description
Object Owner The owner of the object.
Object Name The name of the object.
Object Type The type of object (package, etc.)
# of Executions The number of estimated executions for the object.
Loads The number of times the object was loaded into the shared pool.
Locks The number of locks the object has experienced.
Pins The number of times the object was pinned in the shared pool.
Column Description
EMBARCADERO TECHNOLOGIES > EMBARCADERO PERFORMANCE CENTER 2.5 EXPERT GUIDE: SQL SERVER 95
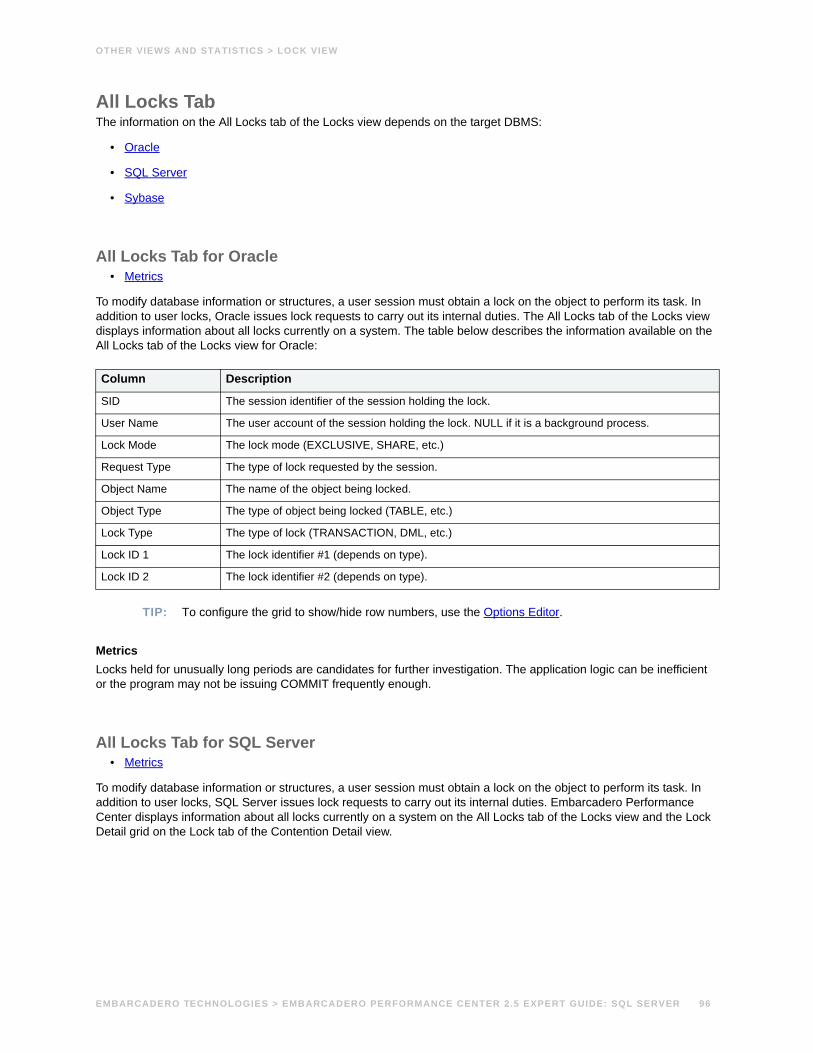
OTHER VIEWS AND STATISTICS > LOCK VIEW
All Locks TabThe information on the All Locks tab of the Locks view depends on the target DBMS:
• Oracle
• SQL Server
• Sybase
All Locks Tab for Oracle• Metrics
To modify database information or structures, a user session must obtain a lock on the object to perform its task. In addition to user locks, Oracle issues lock requests to carry out its internal duties. The All Locks tab of the Locks view displays information about all locks currently on a system. The table below describes the information available on the All Locks tab of the Locks view for Oracle:
TIP: To configure the grid to show/hide row numbers, use the Options Editor.
MetricsLocks held for unusually long periods are candidates for further investigation. The application logic can be inefficient or the program may not be issuing COMMIT frequently enough.
All Locks Tab for SQL Server• Metrics
To modify database information or structures, a user session must obtain a lock on the object to perform its task. In addition to user locks, SQL Server issues lock requests to carry out its internal duties. Embarcadero Performance Center displays information about all locks currently on a system on the All Locks tab of the Locks view and the Lock Detail grid on the Lock tab of the Contention Detail view.
Column Description
SID The session identifier of the session holding the lock.
User Name The user account of the session holding the lock. NULL if it is a background process.
Lock Mode The lock mode (EXCLUSIVE, SHARE, etc.)
Request Type The type of lock requested by the session.
Object Name The name of the object being locked.
Object Type The type of object being locked (TABLE, etc.)
Lock Type The type of lock (TRANSACTION, DML, etc.)
Lock ID 1 The lock identifier #1 (depends on type).
Lock ID 2 The lock identifier #2 (depends on type).
EMBARCADERO TECHNOLOGIES > EMBARCADERO PERFORMANCE CENTER 2.5 EXPERT GUIDE: SQL SERVER 96
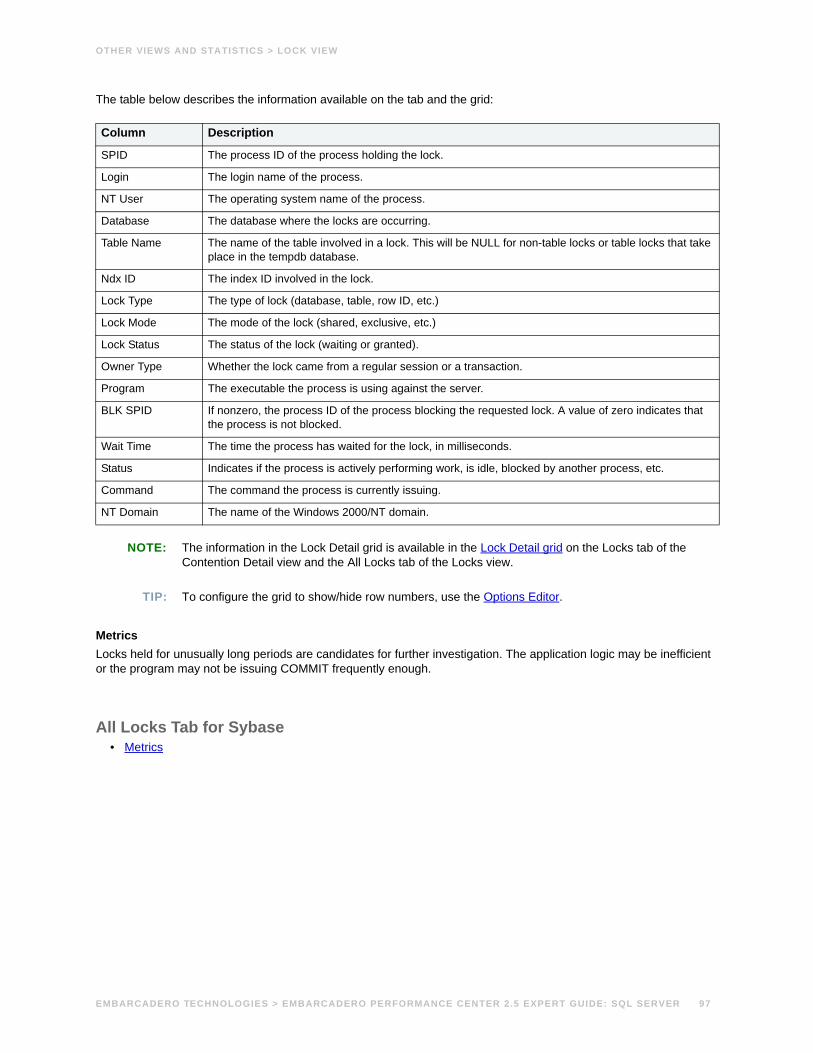
OTHER VIEWS AND STATISTICS > LOCK VIEW
The table below describes the information available on the tab and the grid:
NOTE: The information in the Lock Detail grid is available in the Lock Detail grid on the Locks tab of the Contention Detail view and the All Locks tab of the Locks view.
TIP: To configure the grid to show/hide row numbers, use the Options Editor.
MetricsLocks held for unusually long periods are candidates for further investigation. The application logic may be inefficient or the program may not be issuing COMMIT frequently enough.
All Locks Tab for Sybase• Metrics
Column Description
SPID The process ID of the process holding the lock.
Login The login name of the process.
NT User The operating system name of the process.
Database The database where the locks are occurring.
Table Name The name of the table involved in a lock. This will be NULL for non-table locks or table locks that take place in the tempdb database.
Ndx ID The index ID involved in the lock.
Lock Type The type of lock (database, table, row ID, etc.)
Lock Mode The mode of the lock (shared, exclusive, etc.)
Lock Status The status of the lock (waiting or granted).
Owner Type Whether the lock came from a regular session or a transaction.
Program The executable the process is using against the server.
BLK SPID If nonzero, the process ID of the process blocking the requested lock. A value of zero indicates that the process is not blocked.
Wait Time The time the process has waited for the lock, in milliseconds.
Status Indicates if the process is actively performing work, is idle, blocked by another process, etc.
Command The command the process is currently issuing.
NT Domain The name of the Windows 2000/NT domain.
EMBARCADERO TECHNOLOGIES > EMBARCADERO PERFORMANCE CENTER 2.5 EXPERT GUIDE: SQL SERVER 97
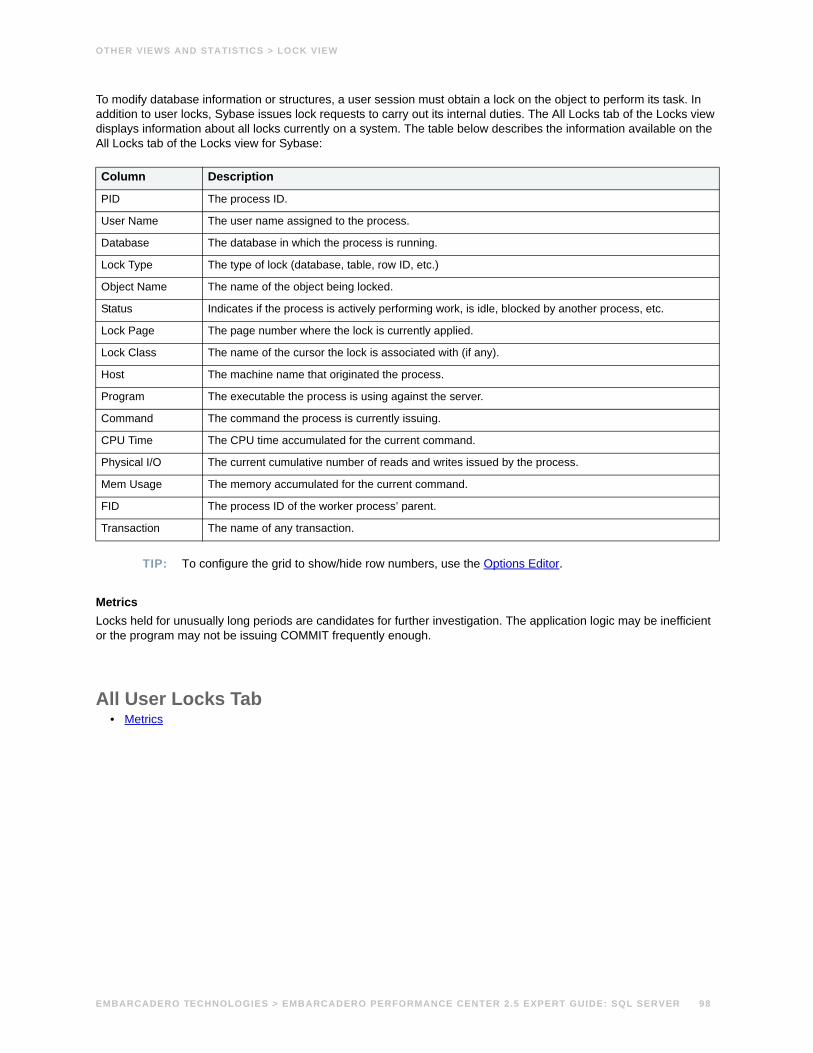
OTHER VIEWS AND STATISTICS > LOCK VIEW
To modify database information or structures, a user session must obtain a lock on the object to perform its task. In addition to user locks, Sybase issues lock requests to carry out its internal duties. The All Locks tab of the Locks view displays information about all locks currently on a system. The table below describes the information available on the All Locks tab of the Locks view for Sybase:
TIP: To configure the grid to show/hide row numbers, use the Options Editor.
MetricsLocks held for unusually long periods are candidates for further investigation. The application logic may be inefficient or the program may not be issuing COMMIT frequently enough.
All User Locks Tab• Metrics
Column Description
PID The process ID.
User Name The user name assigned to the process.
Database The database in which the process is running.
Lock Type The type of lock (database, table, row ID, etc.)
Object Name The name of the object being locked.
Status Indicates if the process is actively performing work, is idle, blocked by another process, etc.
Lock Page The page number where the lock is currently applied.
Lock Class The name of the cursor the lock is associated with (if any).
Host The machine name that originated the process.
Program The executable the process is using against the server.
Command The command the process is currently issuing.
CPU Time The CPU time accumulated for the current command.
Physical I/O The current cumulative number of reads and writes issued by the process.
Mem Usage The memory accumulated for the current command.
FID The process ID of the worker process’ parent.
Transaction The name of any transaction.
EMBARCADERO TECHNOLOGIES > EMBARCADERO PERFORMANCE CENTER 2.5 EXPERT GUIDE: SQL SERVER 98
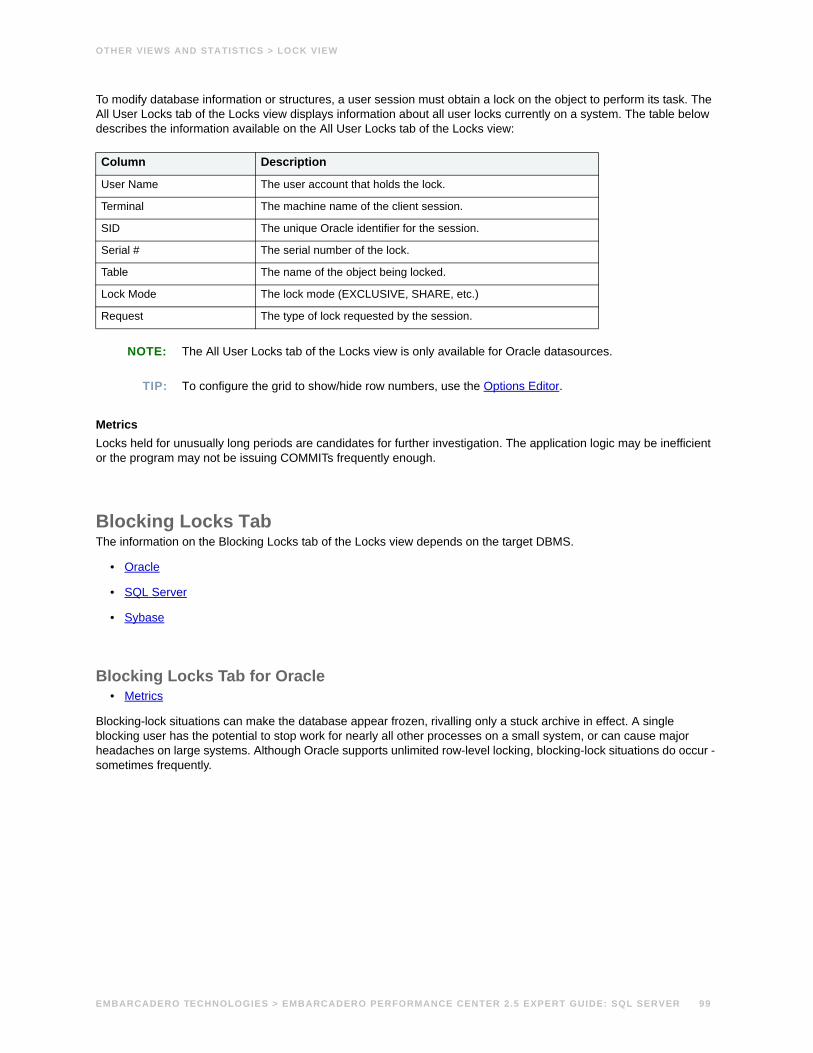
OTHER VIEWS AND STATISTICS > LOCK VIEW
To modify database information or structures, a user session must obtain a lock on the object to perform its task. The All User Locks tab of the Locks view displays information about all user locks currently on a system. The table below describes the information available on the All User Locks tab of the Locks view:
NOTE: The All User Locks tab of the Locks view is only available for Oracle datasources.
TIP: To configure the grid to show/hide row numbers, use the Options Editor.
MetricsLocks held for unusually long periods are candidates for further investigation. The application logic may be inefficient or the program may not be issuing COMMITs frequently enough.
Blocking Locks TabThe information on the Blocking Locks tab of the Locks view depends on the target DBMS.
• Oracle
• SQL Server
• Sybase
Blocking Locks Tab for Oracle• Metrics
Blocking-lock situations can make the database appear frozen, rivalling only a stuck archive in effect. A single blocking user has the potential to stop work for nearly all other processes on a small system, or can cause major headaches on large systems. Although Oracle supports unlimited row-level locking, blocking-lock situations do occur - sometimes frequently.
Column Description
User Name The user account that holds the lock.
Terminal The machine name of the client session.
SID The unique Oracle identifier for the session.
Serial # The serial number of the lock.
Table The name of the object being locked.
Lock Mode The lock mode (EXCLUSIVE, SHARE, etc.)
Request The type of lock requested by the session.
EMBARCADERO TECHNOLOGIES > EMBARCADERO PERFORMANCE CENTER 2.5 EXPERT GUIDE: SQL SERVER 99
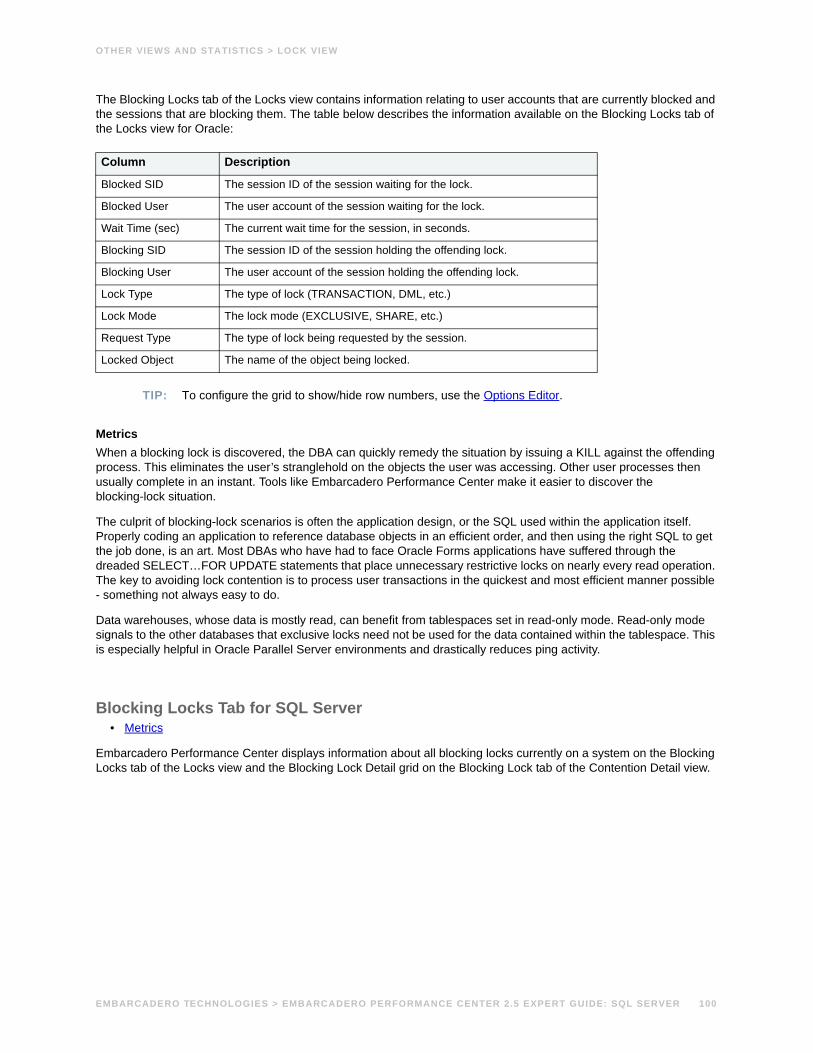
OTHER VIEWS AND STATISTICS > LOCK VIEW
The Blocking Locks tab of the Locks view contains information relating to user accounts that are currently blocked and the sessions that are blocking them. The table below describes the information available on the Blocking Locks tab of the Locks view for Oracle:
TIP: To configure the grid to show/hide row numbers, use the Options Editor.
MetricsWhen a blocking lock is discovered, the DBA can quickly remedy the situation by issuing a KILL against the offending process. This eliminates the user’s stranglehold on the objects the user was accessing. Other user processes then usually complete in an instant. Tools like Embarcadero Performance Center make it easier to discover the blocking-lock situation.
The culprit of blocking-lock scenarios is often the application design, or the SQL used within the application itself. Properly coding an application to reference database objects in an efficient order, and then using the right SQL to get the job done, is an art. Most DBAs who have had to face Oracle Forms applications have suffered through the dreaded SELECT…FOR UPDATE statements that place unnecessary restrictive locks on nearly every read operation. The key to avoiding lock contention is to process user transactions in the quickest and most efficient manner possible - something not always easy to do.
Data warehouses, whose data is mostly read, can benefit from tablespaces set in read-only mode. Read-only mode signals to the other databases that exclusive locks need not be used for the data contained within the tablespace. This is especially helpful in Oracle Parallel Server environments and drastically reduces ping activity.
Blocking Locks Tab for SQL Server• Metrics
Embarcadero Performance Center displays information about all blocking locks currently on a system on the Blocking Locks tab of the Locks view and the Blocking Lock Detail grid on the Blocking Lock tab of the Contention Detail view.
Column Description
Blocked SID The session ID of the session waiting for the lock.
Blocked User The user account of the session waiting for the lock.
Wait Time (sec) The current wait time for the session, in seconds.
Blocking SID The session ID of the session holding the offending lock.
Blocking User The user account of the session holding the offending lock.
Lock Type The type of lock (TRANSACTION, DML, etc.)
Lock Mode The lock mode (EXCLUSIVE, SHARE, etc.)
Request Type The type of lock being requested by the session.
Locked Object The name of the object being locked.
EMBARCADERO TECHNOLOGIES > EMBARCADERO PERFORMANCE CENTER 2.5 EXPERT GUIDE: SQL SERVER 100
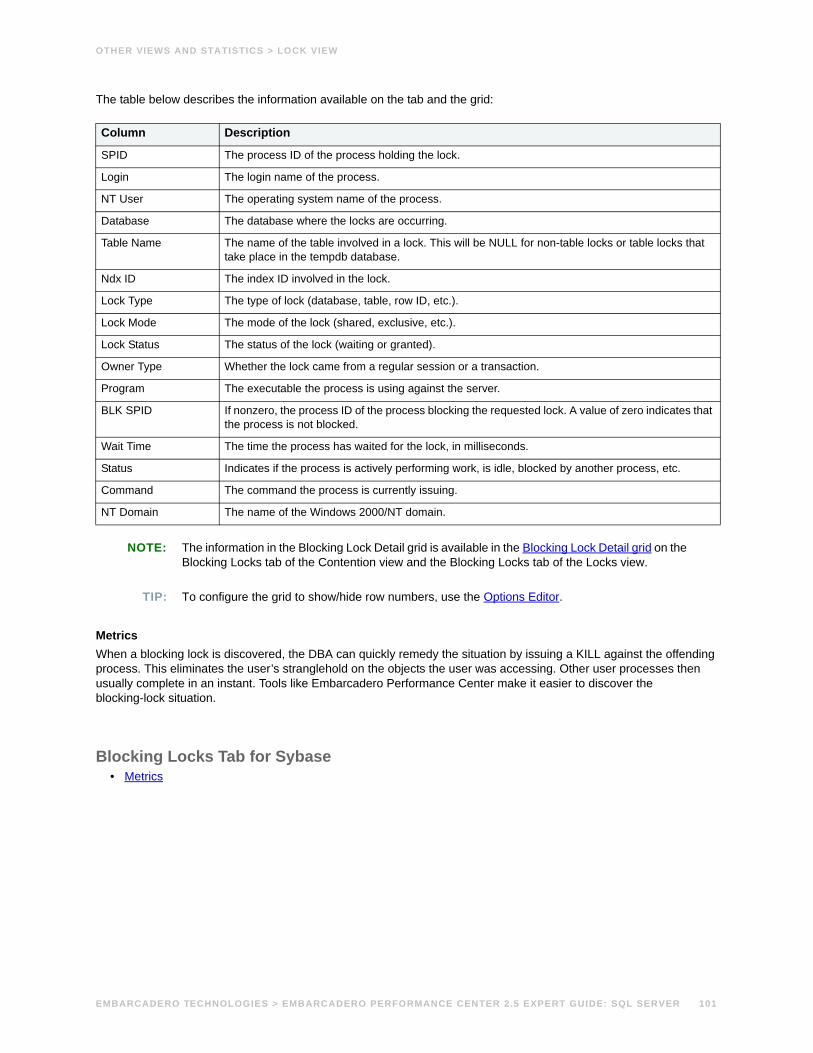
OTHER VIEWS AND STATISTICS > LOCK VIEW
The table below describes the information available on the tab and the grid:
NOTE: The information in the Blocking Lock Detail grid is available in the Blocking Lock Detail grid on the Blocking Locks tab of the Contention view and the Blocking Locks tab of the Locks view.
TIP: To configure the grid to show/hide row numbers, use the Options Editor.
MetricsWhen a blocking lock is discovered, the DBA can quickly remedy the situation by issuing a KILL against the offending process. This eliminates the user’s stranglehold on the objects the user was accessing. Other user processes then usually complete in an instant. Tools like Embarcadero Performance Center make it easier to discover the blocking-lock situation.
Blocking Locks Tab for Sybase• Metrics
Column Description
SPID The process ID of the process holding the lock.
Login The login name of the process.
NT User The operating system name of the process.
Database The database where the locks are occurring.
Table Name The name of the table involved in a lock. This will be NULL for non-table locks or table locks that take place in the tempdb database.
Ndx ID The index ID involved in the lock.
Lock Type The type of lock (database, table, row ID, etc.).
Lock Mode The mode of the lock (shared, exclusive, etc.).
Lock Status The status of the lock (waiting or granted).
Owner Type Whether the lock came from a regular session or a transaction.
Program The executable the process is using against the server.
BLK SPID If nonzero, the process ID of the process blocking the requested lock. A value of zero indicates that the process is not blocked.
Wait Time The time the process has waited for the lock, in milliseconds.
Status Indicates if the process is actively performing work, is idle, blocked by another process, etc.
Command The command the process is currently issuing.
NT Domain The name of the Windows 2000/NT domain.
EMBARCADERO TECHNOLOGIES > EMBARCADERO PERFORMANCE CENTER 2.5 EXPERT GUIDE: SQL SERVER 101
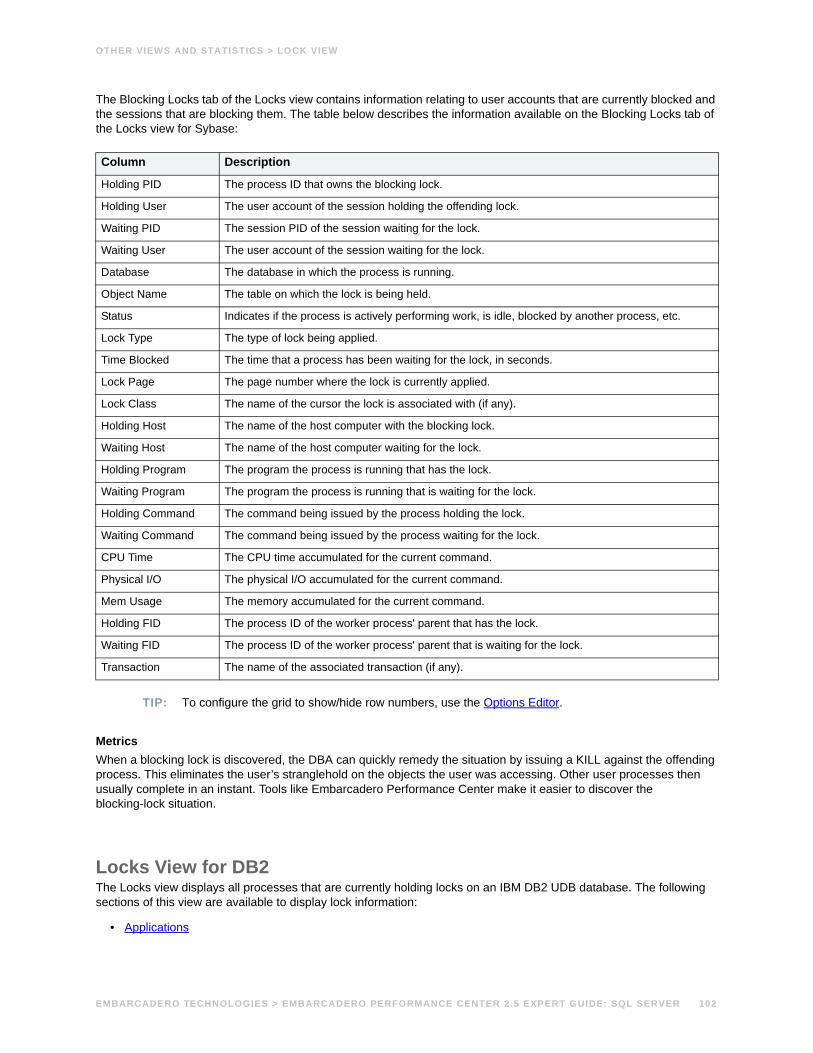
OTHER VIEWS AND STATISTICS > LOCK VIEW
The Blocking Locks tab of the Locks view contains information relating to user accounts that are currently blocked and the sessions that are blocking them. The table below describes the information available on the Blocking Locks tab of the Locks view for Sybase:
TIP: To configure the grid to show/hide row numbers, use the Options Editor.
MetricsWhen a blocking lock is discovered, the DBA can quickly remedy the situation by issuing a KILL against the offending process. This eliminates the user’s stranglehold on the objects the user was accessing. Other user processes then usually complete in an instant. Tools like Embarcadero Performance Center make it easier to discover the blocking-lock situation.
Locks View for DB2The Locks view displays all processes that are currently holding locks on an IBM DB2 UDB database. The following sections of this view are available to display lock information:
• Applications
Column Description
Holding PID The process ID that owns the blocking lock.
Holding User The user account of the session holding the offending lock.
Waiting PID The session PID of the session waiting for the lock.
Waiting User The user account of the session waiting for the lock.
Database The database in which the process is running.
Object Name The table on which the lock is being held.
Status Indicates if the process is actively performing work, is idle, blocked by another process, etc.
Lock Type The type of lock being applied.
Time Blocked The time that a process has been waiting for the lock, in seconds.
Lock Page The page number where the lock is currently applied.
Lock Class The name of the cursor the lock is associated with (if any).
Holding Host The name of the host computer with the blocking lock.
Waiting Host The name of the host computer waiting for the lock.
Holding Program The program the process is running that has the lock.
Waiting Program The program the process is running that is waiting for the lock.
Holding Command The command being issued by the process holding the lock.
Waiting Command The command being issued by the process waiting for the lock.
CPU Time The CPU time accumulated for the current command.
Physical I/O The physical I/O accumulated for the current command.
Mem Usage The memory accumulated for the current command.
Holding FID The process ID of the worker process' parent that has the lock.
Waiting FID The process ID of the worker process' parent that is waiting for the lock.
Transaction The name of the associated transaction (if any).
EMBARCADERO TECHNOLOGIES > EMBARCADERO PERFORMANCE CENTER 2.5 EXPERT GUIDE: SQL SERVER 102
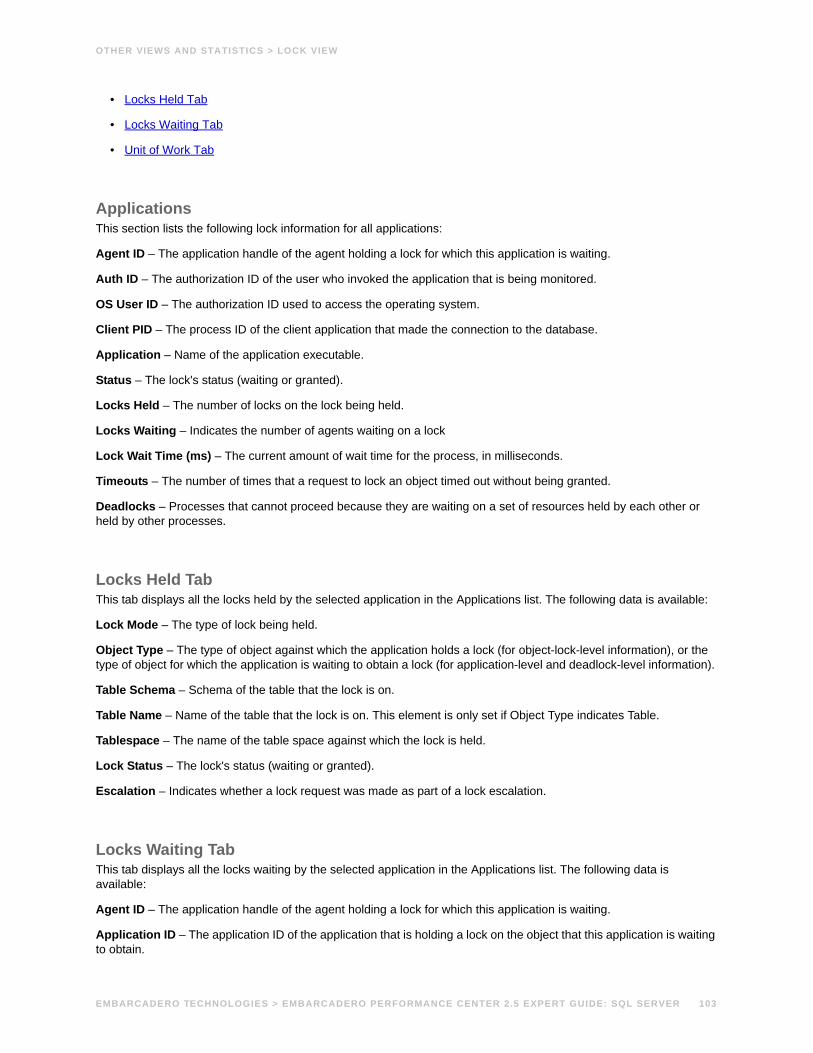
OTHER VIEWS AND STATISTICS > LOCK VIEW
• Locks Held Tab
• Locks Waiting Tab
• Unit of Work Tab
ApplicationsThis section lists the following lock information for all applications:
Agent ID – The application handle of the agent holding a lock for which this application is waiting.
Auth ID – The authorization ID of the user who invoked the application that is being monitored.
OS User ID – The authorization ID used to access the operating system.
Client PID – The process ID of the client application that made the connection to the database.
Application – Name of the application executable.
Status – The lock's status (waiting or granted).
Locks Held – The number of locks on the lock being held.
Locks Waiting – Indicates the number of agents waiting on a lock
Lock Wait Time (ms) – The current amount of wait time for the process, in milliseconds.
Timeouts – The number of times that a request to lock an object timed out without being granted.
Deadlocks – Processes that cannot proceed because they are waiting on a set of resources held by each other or held by other processes.
Locks Held TabThis tab displays all the locks held by the selected application in the Applications list. The following data is available:
Lock Mode – The type of lock being held.
Object Type – The type of object against which the application holds a lock (for object-lock-level information), or the type of object for which the application is waiting to obtain a lock (for application-level and deadlock-level information).
Table Schema – Schema of the table that the lock is on.
Table Name – Name of the table that the lock is on. This element is only set if Object Type indicates Table.
Tablespace – The name of the table space against which the lock is held.
Lock Status – The lock's status (waiting or granted).
Escalation – Indicates whether a lock request was made as part of a lock escalation.
Locks Waiting TabThis tab displays all the locks waiting by the selected application in the Applications list. The following data is available:
Agent ID – The application handle of the agent holding a lock for which this application is waiting.
Application ID – The application ID of the application that is holding a lock on the object that this application is waiting to obtain.
EMBARCADERO TECHNOLOGIES > EMBARCADERO PERFORMANCE CENTER 2.5 EXPERT GUIDE: SQL SERVER 103
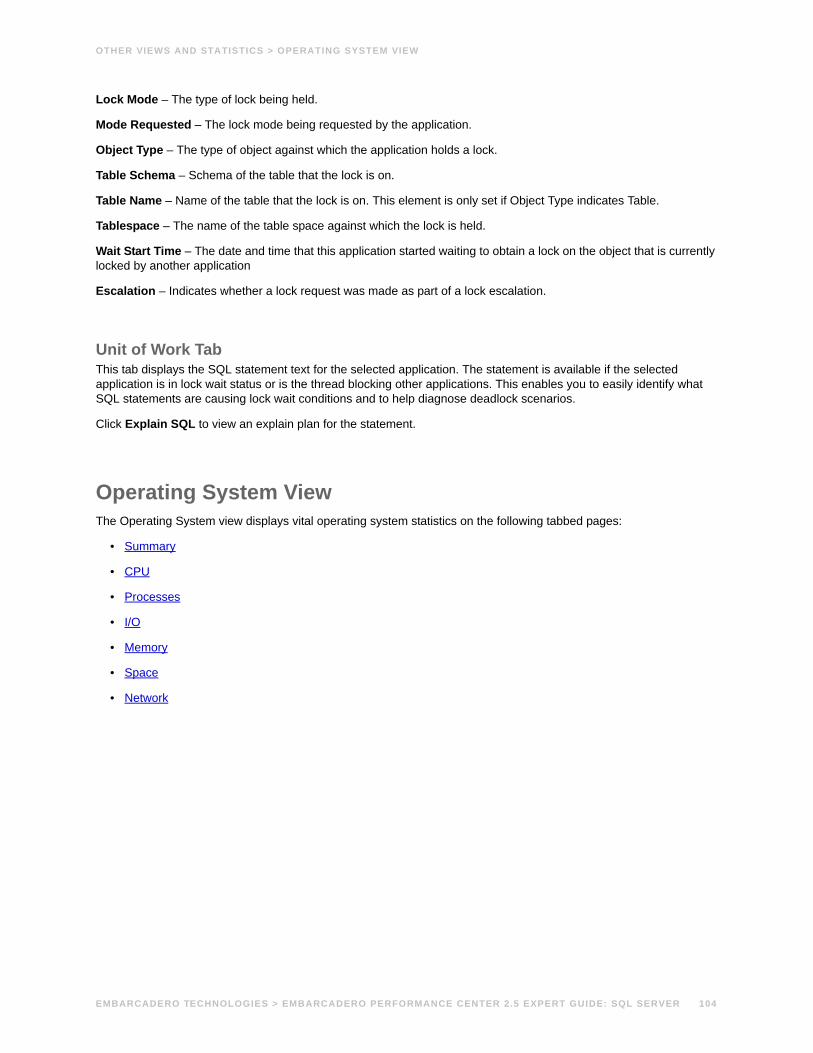
OTHER VIEWS AND STATISTICS > OPERATING SYSTEM VIEW
Lock Mode – The type of lock being held.
Mode Requested – The lock mode being requested by the application.
Object Type – The type of object against which the application holds a lock.
Table Schema – Schema of the table that the lock is on.
Table Name – Name of the table that the lock is on. This element is only set if Object Type indicates Table.
Tablespace – The name of the table space against which the lock is held.
Wait Start Time – The date and time that this application started waiting to obtain a lock on the object that is currently locked by another application
Escalation – Indicates whether a lock request was made as part of a lock escalation.
Unit of Work TabThis tab displays the SQL statement text for the selected application. The statement is available if the selected application is in lock wait status or is the thread blocking other applications. This enables you to easily identify what SQL statements are causing lock wait conditions and to help diagnose deadlock scenarios.
Click Explain SQL to view an explain plan for the statement.
Operating System ViewThe Operating System view displays vital operating system statistics on the following tabbed pages:
• Summary
• CPU
• Processes
• I/O
• Memory
• Space
• Network
EMBARCADERO TECHNOLOGIES > EMBARCADERO PERFORMANCE CENTER 2.5 EXPERT GUIDE: SQL SERVER 104
OTHER VIEWS AND STATISTICS > OS PAGE STATISTICS
To use integrated security, or gather certain operating system statistics, there are two main things to know:
1 You must enable the Embarcadero Performance Center Server for operating system monitoring. To enable it, you must select the Enable operating system monitoring check box on the Machine tab of the Datasource Properties dialog box.
2 You must supply the credentials necessary to view these statistics. To be able to view performance counters on a remote computer, Microsoft requires specific permissions on the remote computer that you want to monitor.
Because the Embarcadero Performance Center Server collects data using the registry, monitoring a remote computer requires the use of the Remote Registry Service. If the service stops due to failure, the system restarts it automatically only once. Therefore, if the service stops again, you must manually restart it. You can change this default behavior by modifying the properties for Remote Registry Service. To access service properties, see Services under Services and Applications in Computer Management or see Administrative Tools. You can also check the Event Viewer’s Application and System Logs for events that might have stopped the service.
Remote data collection also requires access to specific registry subkeys and system files. To provide remote access to the registry to collect data on remote systems, Microsoft requires that users have a minimum of Read access to the Winreg subkey in HKEY_LOCAL_MACHINE\SYSTEM\CurrentControlSet\Control\SecurePipeServers. By default, members of the Administrators group have Full Control access and members of the Backup Operators group have Read access. Microsoft also requires that users have Read access to the registry subkey that stores counter names and descriptions used by System Monitor, HKEY_LOCAL_MACHINE\SOFTWARE\Microsoft\Windows NT\CurrentVersion\Perflib\LanguageID, where LanguageID is the numeric code for the spoken language for the operating system installation. (For English, the subkey is Perflib\009.) By default, Microsoft gives Full Control access to the System account and members of the Administrators and Creator Owners groups. Therefore, a local user on a server who is not logged in as an administrator cannot see performance counters.
In addition, users might also require read access to the files that supply counter names and descriptions to the registry, Perfc*.dat and Perfh*.dat. (where the asterisk is a wildcard character representing the specific language code; for English, these are Perfc009.dat and Perfh009.dat.) If these files reside on an NTFS volume, to have access to them, the access control lists (ACLs) on these files must specify that the user has such access. By default, members of the Administrators and Interactive groups have sufficient access.
OS Page StatisticsIn many scenarios, an optimally tuned database may not perform well because there are constraints imposed by the system where the database is running. These constraints may include processes competing with the database sever for resources (CPU, I/O, or Memory), a slow CPU, insufficient or slow I/O devices, and insufficient memory. The OS Statistics page of Performance Center lets you examine operating system metrics for the following platforms:
• AIX
• HP-UX
NOTE: To view processor info and swap disk info on an HP-UX box, you need to login as ROOT in the OS login.
• Linux
• Solaris
• Unix
• Windows XP, 2000, and NT
EMBARCADERO TECHNOLOGIES > EMBARCADERO PERFORMANCE CENTER 2.5 EXPERT GUIDE: SQL SERVER 105
OTHER VIEWS AND STATISTICS > OS PAGE STATISTICS
Summary TabThe OS Summary tab displays the following statistics to communicate the general overall performance levels of the operating system:
• Disk Time
• Load Average
• Processor Time
• Paged Memory Used (Windows)
• Swap Memory Used (AIX, HP-UX, Linux, Solaris, Unix)
• Average Disk Queue
• Network Output Queue (Windows)
• Network Queue (Solaris)
• Page Faults/Sec
• Processor Queue
• Processor Speed
• Processor
• Available Paged Memory (Windows)
• Available Physical Memory
• Available Swap Memory (AIX, HP-UX, Linux, Solaris, Unix)
• Total Paged Memory (Windows)
• Total Physical Memory
• Total Swap Memory (AIX, HP-UX, Linux, Solaris, Unix)
• Free Disk Space
• Total Disk Space
• Used Disk Space
• Number of Logins
• Number of Processes
• Number of Processors
• Top CPU Process
• Top I/O Process
• Top Memory Process
Processor TimeThe Processor Time statistic indicates the percentage of time the processor is working. This counter is a primary indicator of processor activity.
EMBARCADERO TECHNOLOGIES > EMBARCADERO PERFORMANCE CENTER 2.5 EXPERT GUIDE: SQL SERVER 106
OTHER VIEWS AND STATISTICS > OS PAGE STATISTICS
MetricsIf your computer seems to be running sluggishly, this statistic could be displaying a high percentage.
TroubleshootingUpgrade to a processor with a larger L2 cache, a faster processor, or install an additional processor.
Processor SpeedThe Processor Speed statistic displays the speed of the active processor in MHz. The speed is approximate.
ProcessorThe Processor Statistic displays the type of processor currently in use, for example, GenuineIntel.
Disk TimeThe Disk Time statistic is the percentage of elapsed time that the selected disk drive/device was busy servicing read or write requests.
MetricsYou should avoid consistently seeing values for this statistic greater then 90%.
TroubleshootingAdd more disk drives and partition the files among all of the drives.
Load AverageThe Load Average statistic represents the system load averages over the last 1, 5, and 15 minutes.
MetricsHigh load averages usually mean that the system is being used heavily and the response time is correspondingly slow.
Paged Memory UsedThe Paged Memory Used statistic is the ratio of Commit Memory Bytes to the Commit Limit. Committed memory is where memory space has been reserved in the paging file if it needs to be written to disk. The commit limit is determined by the size of the paging file. As the paging file increases, so does the commit limit.
NOTE: This statistic is available for the Windows platform.
MetricsThis value displays the current percentage value only and not an average. If the percentage of paged memory used is above 90%, you may be running out of memory.
EMBARCADERO TECHNOLOGIES > EMBARCADERO PERFORMANCE CENTER 2.5 EXPERT GUIDE: SQL SERVER 107
OTHER VIEWS AND STATISTICS > OS PAGE STATISTICS
TroubleshootingIncrease the size of page file.
Number of ProcessorsThis statistic displays the number of processors currently in use.
Swap Memory UsedThe Swap Memory Used statistic is the percentage of swap space currently in use.
MetricsIf the percentage of swap memory used is above 90%, you may be running out of memory.
TroubleshootingIncrease the size of your swap files.
Average Disk QueueThe Average Disk Queue statistic is the average number of both read and write requests that were queued for the selected disk during the sample interval.
MetricsThis metric is useful in identifying I/O related bottlenecks. If the disk queue lengths for certain disks are consistently much higher than others, you may need to redistribute the load among available disks. If the disk queues lengths for all disks are consistently large, and you see a high amount of I/O activity, your disks may be inefficient.
TroubleshootingSome things you can do if you have problems with this statistic include:
• Redistribute the data on the disk with the large average disk queue to other disks.
• Upgrade to faster disk(s).
Page Faults/SecThe Page Faults/Sec statistic is the overall rate faulted pages are handled by the processor. It is measured in numbers of pages faulted per second. A page fault occurs when a process requires code or data that is not in its working set. This counter includes both hard faults and soft faults.
MetricsThis counter displays the difference between the values observed in the last two samples, divided by the duration of the sample interval.
EMBARCADERO TECHNOLOGIES > EMBARCADERO PERFORMANCE CENTER 2.5 EXPERT GUIDE: SQL SERVER 108
OTHER VIEWS AND STATISTICS > OS PAGE STATISTICS
TroubleshootingIf the number of page faults remains consistently high, you can check with your Windows System Administrator for further investigation. Often, large numbers of page faults are not a problem so long as they are soft faults. However, hard faults, that require disk access, can cause delays.
Processor Queue The Processor Queue Length statistic is the number of threads in the processor queue.
MetricsUnlike the disk counters, this counter shows ready threads only, not threads that are running. There is a single queue for processor time even on computers with multiple processors. Therefore, if a computer has multiple processors, you need to divide this value by the number of processors servicing the workload. A sustained processor queue of less than 10 threads per processor is normally acceptable, dependent of the workload.
TroubleshootingA sustained high value in the Processor Queue could indicate that a processor bottleneck has developed due to threads of a process requiring more process cycles than are available. If this is the case, you should look at installing a faster (or an additional) processor.
Network Output Queue/Network QueueThe Network Output Queue Length statistic is the number of threads in the processor queue.
NOTE: The name of this statistic depends on the platform of the operating system.
MetricsUnlike the disk counters, this counter shows ready threads only, not threads that are running. There is a single queue for processor time even on computers with multiple processors. Therefore, if a computer has multiple processors, you need to divide this value by the number of processors servicing the workload. A sustained processor queue of less than 10 threads per processor is normally acceptable, dependent of the workload.
TroubleshootingA sustained high value in the Processor Queue Length could indicate that a processor bottleneck has developed due to threads of a process requiring more process cycles than are available. If this is the case, you should look at installing a faster (or an additional) processor.
Available Physical MemoryThe Available Physical Memory statistic represents the amount of RAM available to all processes.
MetricsThis counter displays the last observed value only and not an average. Use this value with the Total physical memory and paging metrics (Memory details page). If the available physical memory is very small compared to this value, and the paging activity is high, your system may be running low on memory.
TroubleshootingSome things you can do if you have problems with this statistic include:
EMBARCADERO TECHNOLOGIES > EMBARCADERO PERFORMANCE CENTER 2.5 EXPERT GUIDE: SQL SERVER 109
OTHER VIEWS AND STATISTICS > OS PAGE STATISTICS
• Check the running processes to see if there are any memory leaks.
• Stop any services that are not required.
• Install additional RAM.
Available Paged MemoryThe Available Paged Memory statistic shows the amount of virtual memory available for the processes.
NOTE: This statistic is available for the Windows platform.
MetricsIf the available virtual memory is less than 10% of the total virtual memory, your system may run out of memory.
TroubleshootingIncrease the size of page file.
Available Swap MemoryThe Available Swap Memory statistic represents the amount of virtual memory available for the processes.
MetricsIf the available Available Swap Memory is less than 10% of the total Swap Memory, your system may run out of memory.
TroubleshootingIncrease the size of swap files.
Total Physical MemoryThe Total Physical Memory statistic shows the amount of physical memory installed on your computer.
MetricsThis is an informational metric and displays the total amount installed on the machine. Use this value with the available physical memory and paging metrics (Memory details page). If the available physical memory is very small compared to this value, and the paging activity is high, your system may be running low on memory.
Total Paged Memory/Total Swap MemoryThe Total Paged Memory statistic shows the maximum amount of virtual memory available to all processes.
NOTE: The name of this statistic depends on the platform of the operating system.
MetricsIt is recommended that this value is between 1.5 to 3 times the amount of RAM on the system.
EMBARCADERO TECHNOLOGIES > EMBARCADERO PERFORMANCE CENTER 2.5 EXPERT GUIDE: SQL SERVER 110
OTHER VIEWS AND STATISTICS > OS PAGE STATISTICS
Used Disk SpaceThe Used Disk Space statistic shows the amount of allocated space, in megabytes on all logical disk drives.
TroubleshootingThere are many things a DBA can do to ensure that a database does not encounter a space problem due to physical space limitations:
• If a database currently resides on a disk that has little free space, you can add more files to the database. Of course, you should add the new files to other physical hard disks that can accommodate a growing database.
• You should examine hard disks with shrinking disk space to see if you can relocate or delete files to allow more free space.
Total Disk SpaceTotal Disk Space displays the total allocated and unallocated space, in megabytes on all logical disk drives.
TroubleshootingThere are many things a DBA can do to ensure that a database does not encounter a space problem due to physical space limitations, here are two:
1 If a database currently resides on a disk that has little free space, you can add more files to the database. Of course, you should add the new files to other physical hard disks that can accommodate a growing database.
2 You should examine hard disks with shrinking disk space to see if you can relocate or delete files to allow more free space.
Free Disk SpaceThe Free Disk Space statistic shows the unallocated space, in megabytes on all logical disk drives.
TroubleshootingThere are many things a DBA can do to ensure that a database does not encounter a space problem due to physical space limitations:
• If a database currently resides on a disk that has little free space, you can add more files to the database. Of course, you should add the new files to other physical hard disks that can accommodate a growing database.
• You should examine hard disks with shrinking disk space to see if you can relocate or delete files to allow more free space.
Top Memory ProcessTop Memory Process shows the current process that is consuming the most amount of memory. The information displayed is dependent on the platform of the operating system. Information displayed includes the name of the process, process ID, amount of memory consumed expressed in KB, amount of CPU expressed as a percentage, the amount of Major Page Faults, and the amount of I/O expressed in KB/sec.
MetricsIf you are running out of memory on the system, this is a quick way to identify the top memory user. If the displayed process is using a significant portion of the total memory, it could be causing the memory issues.
EMBARCADERO TECHNOLOGIES > EMBARCADERO PERFORMANCE CENTER 2.5 EXPERT GUIDE: SQL SERVER 111
OTHER VIEWS AND STATISTICS > OS PAGE STATISTICS
Processes OverviewThe Processes Overview of the OS Summary includes the following sections:
• Top CPU Process
• Top I/O Process
• Top Memory Process
Top CPU ProcessTop CPU Process shows the current process that is consuming the most amount of CPU. The information displayed is dependent on the platform of the operating system. Information displayed includes the name of the process, process ID, amount of memory consumed expressed in KB, amount of CPU expressed as a percentage, the amount of Major Page Faults, and the amount of I/O expressed in KB/sec.
MetricsIf the amount of CPU time used by this process is close to 100% and the CPU usage is very high, this process may be the bottleneck on the server.
TroubleshootingInvestigate the process further to see if it is in an inconsistent state. Also, look at minimum requirements for CPU speed for the process. You may need to upgrade your CPU.
Top I/O ProcessThe Top I/O Process statistic shows the current process that is consuming the most amount of CPU. The information displayed is dependent on the platform of the operating system. Information displayed includes the name of the process, process ID, amount of memory consumed expressed in KB, amount of CPU expressed as a percentage, the amount of Major Page Faults, and the amount of I/O expressed in KB/sec.
Number of LoginsThis statistic displays the total number of logins on the server.
Number of ProcessesThis statistic displays the total number of processes on the server.
CPU TabThe CPU tab of the OS Detail includes the following sections:
• Context Switches/Sec
• CPU Utilization
• Interrupts/Sec
• Processor Queue Length
EMBARCADERO TECHNOLOGIES > EMBARCADERO PERFORMANCE CENTER 2.5 EXPERT GUIDE: SQL SERVER 112
OTHER VIEWS AND STATISTICS > OS PAGE STATISTICS
CPU UtilizationThe CPU Utilization section includes the following information:
• % Privileged Time
• % User Time
% Privileged TimeThe % Privileged Time statistic is the percentage of elapsed time that the process threads spent executing code in privileged mode.
NOTE: For Windows systems, when a Windows system service is called, the service will often run in privileged mode to gain access to system-private data. Such data is protected from access by threads executing in user mode. Calls to the system can be explicit or implicit, such as page faults or interrupts. These kernel commands, are considered privileged to keep the low-level commands executing and prevent a system freeze. Unlike some early operating systems, Windows uses process boundaries for subsystem protection in addition to the traditional protection of user and privileged modes. Some work done by Windows on behalf of the application might appear in other subsystem processes in addition to the privileged time in the process.
MetricsThe ideal range should be 0-40% (less than 40% indicates excessive system activity).
TroubleshootingIf your CPU consistently runs at less than 40% you may need to upgrade your system to include a faster processor(s).
% User TimeThe % User Time statistic is the percentage of elapsed time the processor spends in the user mode. User mode is a restricted processing mode designed for applications, environment subsystems, and integral subsystems. The alternative, privileged mode, is designed for operating system components and allows direct access to hardware and all memory. The operating system switches application threads to privileged mode to access operating system services. This counter displays the average busy time as a percentage of the sample time.
MetricsIf the Privileged Time is high in conjunction with Physical Disk Reads, consider upgrading the disk I/O subsystem.
Interrupts/SecThe Interrupts/Sec statistic is the average rate, in incidents per second, at which the processor received and serviced hardware interrupts. It does not include deferred procedure calls (DPCs), which are counted separately. This value is an indirect indicator of the activity of devices that generate interrupts, such as the system clock, the mouse, disk drivers, data communication lines, network interface cards, and other peripheral devices. These devices normally interrupt the processor when they have completed a task or require attention. Normal thread execution is suspended. The system clock typically interrupts the processor every ten milliseconds, creating a background of interrupt activity. This counter displays the difference between the values observed in the last two samples, divided by the duration of the sample interval.
MetricsThe ideal rage should be 0-5000. A number greater then 5000 indicates possible excessive hardware interrupts; justification is dependent on device activity.
EMBARCADERO TECHNOLOGIES > EMBARCADERO PERFORMANCE CENTER 2.5 EXPERT GUIDE: SQL SERVER 113
OTHER VIEWS AND STATISTICS > OS PAGE STATISTICS
Context Switches/SecThe Context Switches/Sec section shows the combined rate at which all processors on the computer are switched from one thread to another. Context switches occur when a running thread voluntarily relinquishes the processor, is preempted by a higher priority ready thread, or switches between user-mode and privileged (kernel) mode to use an Executive or subsystem service.
MetricsThe ideal range should be between 0-10,000. GA number greater then 10,000 may indicate too many threads contending for resources.
Processor Queue LengthThe Processor Queue Length statistic is the number of threads in the processor queue. There is a single queue for processor time even on computers with multiple processors.
NOTE: For Windows systems, unlike the disk counters, this counter shows ready threads only, not threads that are running.
MetricsA sustained high value in the Processor Queue Length could indicate that a processor bottleneck has developed due to threads of a process requiring more process cycles than are available. If this is the case, you should look at installing a faster (or an additional) processor.
Processes TabThe Processes tab of the OS Detail page succinctly communicates the general overall performance levels of processes. The columns available in this table depend on the platform of operating system. The table below describes the information available in the table on this tab:
Column Description
Process The name of the process.
User The user of the process.
ID The ID Process is the unique identifier of this process. ID Process numbers are reused, so they only identify a process for the lifetime of that process.
CPU The CPU is the percentage of elapsed time that all of process threads used the processor to execution instructions.
User Mode The User Mode is the percentage of elapsed time that the process threads spent executing code in user mode.
Memory WINDOWS ONLY
Memory is the current size, in bytes, of the virtual address space the process is using. Use of virtual address space does not necessarily imply corresponding use of either disk or main memory pages. Virtual space is finite, and the process can limit its ability to load libraries.
Memory (MB) Memory is the current size, in bytes, of the virtual address space the process is using. Use of virtual address space does not necessarily imply corresponding use of either disk or main memory pages. Virtual space is finite, and the process can limit its ability to load libraries.
Memory Memory is the percentage of the memory used of the total memory.
Active Memory Active Memory is the amount of committed virtual memory, in bytes for this process. Active memory is the physical memory which has space reserved on the disk paging file(s). There can be one or more paging files on each physical drive. This counter displays the last observed value only; it is not an average.
EMBARCADERO TECHNOLOGIES > EMBARCADERO PERFORMANCE CENTER 2.5 EXPERT GUIDE: SQL SERVER 114
OTHER VIEWS AND STATISTICS > OS PAGE STATISTICS
I/O TabThe table below describes the information available in this section:
I/O Data The rate at which the process is reading and writing bytes in I/O operations. This counter counts all I/O activity generated by the process to include file, network and device I/Os.
Elapsed Time The total elapsed time, in seconds, that this process has been running.
Thread Count The number of threads currently active in this process. An instruction is the basic unit of execution in a processor, and a thread is the object that executes instructions. Every running process has at least one thread.
Handle Count The total number of handles currently open by this process. This number is equal to the sum of the handles currently open by each thread in this process.
Priority The current base priority of this process. Threads within a process can raise and lower their own base priority relative to the process' base priority.
Creating Proc ID The Creating Process ID value is the Process ID of the process that created the process. The creating process may have terminated, so this value may no longer identify a running process.
Page Faults/Sec Page Faults/Sec is the rate at which page faults by the threads executing in this process are occurring. A page fault occurs when a thread refers to a virtual memory page that is not in its working set in main memory. This may not cause the page to be fetched from disk if it is on the standby list and hence already in main memory, or if it is in use by another process with whom the page is shared.
Page File Page File is the current number of kilobytes that this process has used in the paging file(s). Paging files are used to store pages of memory used by the process that are not contained in other files. Paging files are shared by all processes, and the lack of space in paging files can prevent other processes from allocating memory.
Private Private is the current size, in kilobytes, of memory that this process has allocated that cannot be shared with other processes.
Column Description
Disk The disk number assignment.
Reading (KB/s) The amount of bytes read from the device.
Writing (KB/s) The amount of bytes written to the device.
Disk Read Time Disk Read Time is the percentage of elapsed time that the selected disk drive was busy servicing read requests.
Disk Write Time Disk Write Time is the percentage of elapsed time that the selected disk drive was busy servicing write requests.
Disk Time Disk Time is the percentage of elapsed time that the selected disk was busy servicing requests.
Avg. Read Queue Avg. Disk Read Queue Length is the average number of read requests that were queued for the selected disk during the sample interval.
Avg. Write Queue Avg. Disk Write Queue Length is the average number of write requests that were queued for the selected disk during the sample interval.
Disk Reads/Sec Disk Reads/Sec is the rate of read operations on the disk.
Disk Writes/Sec Disk Writes/Sec is the rate of write operations on the disk.
Column Description
EMBARCADERO TECHNOLOGIES > EMBARCADERO PERFORMANCE CENTER 2.5 EXPERT GUIDE: SQL SERVER 115
OTHER VIEWS AND STATISTICS > OS PAGE STATISTICS
Memory TabThe Memory tab of the OS Detail page includes the following sections:
• Cache Efficiency
• Free Physical
• Free Paged
• Paging Activity
• Page Faults
• Total Physical
• Total Paged
Paging ActivityThe Paging Activity section includes the following statistics:
• Pages Input/Sec
• Pages Output/Sec
Pages Input/SecThe Pages Input/Sec statistic is the number of pages read from disk to resolve hard page faults. Hard page faults occur when a process requires code or data that is not in its working set or elsewhere in physical memory, and must be retrieved from disk.
MetricsThis value was designed as a primary indicator of the kinds of faults that cause system-wide delays. It includes pages retrieved to satisfy faults in the file system cache (usually requested by applications) and in non-cached mapped memory files. This counter counts numbers of pages, and can be compared to other counts of pages, such as Memory: Page Faults/sec, without conversion. This counter displays the difference between the values observed in the last two samples, divided by the duration of the sample interval.
TroubleshootingAlthough it never hurts to have as much physical memory as your system can handle, there are some things you can check within your system to alleviate the memory bottleneck.
• Check to see if you have any drivers or protocols that are running but not being used. They use space in all memory pools even if they are idle.
• Check to see if you have additional space on your disk drive that you could use to expand the size of your page file. Normally, the bigger the initial size of your page file, the better, in performance terms.
Pages Output/SecThe Pages Output/Sec statistic is the number of pages written to disk to free up space in physical memory. Pages are written back to disk only if they are changed in physical memory. A high rate of pages output might indicate a memory shortage.
EMBARCADERO TECHNOLOGIES > EMBARCADERO PERFORMANCE CENTER 2.5 EXPERT GUIDE: SQL SERVER 116
OTHER VIEWS AND STATISTICS > OS PAGE STATISTICS
MetricsWindows NT writes more pages back to disk to free up space when low in physical memory. This counter counts numbers of pages, and can be compared to other counts of pages, without conversion. This counter displays the difference between the values observed in the last two samples, divided by the duration of the sample interval.
TroubleshootingAlthough it never hurts to have as much physical memory as your system can handle, there are some things you can check within your system to alleviate the memory bottleneck.
• Check to see if you have any drivers or protocols that are running but not being used. They use space in all memory pools even if they are idle.
• Check to see if you have additional space on your disk drive that you could use to expand the size of your page file. Normally, the bigger the initial size of your page file, the better, in performance terms.
Free PhysicalThe Free Physical statistic is the amount of physical memory that is uncommitted.
MetricsNone.
Free PagedThe Free Paged statistic is the amount of uncommitted virtual memory.
MetricsNone.
Total PhysicalThe Total Physical statistic is the total physical memory available.
MetricsNone.
Total PagedThe Total Paged statistic is the amount of total virtual memory, in bytes. Used Memory is the physical memory that has space reserved on the disk paging file(s). There can be one or more paging files on each physical drive.
MetricsNone.
Page Faults/SecThe Page Faults/Sec statistic is the overall rate faulted pages are handled by the processor. It is measured in numbers of pages faulted per second. A page fault occurs when a process requires code or data that is not in its working set. This counter includes both hard faults and soft faults.
EMBARCADERO TECHNOLOGIES > EMBARCADERO PERFORMANCE CENTER 2.5 EXPERT GUIDE: SQL SERVER 117
OTHER VIEWS AND STATISTICS > OS PAGE STATISTICS
MetricsThis counter displays the difference between the values observed in the last two samples, divided by the duration of the sample interval.
TroubleshootingIf the number of page faults remains consistently high, you can check with your Windows System Administrator for further investigation. Often, large numbers of page faults are not a problem so long as they are soft faults. However, hard faults, that require disk access, can cause delays.
Cache EfficiencyThe Cache Efficiency section of the Memory tab succinctly communicates the general overall performance levels of the server's memory. The following statistics are available in this section:
• Copy Read Hits%
• Data Map Hits%
• MDL Read Hits%
• Pin Read Hits%
Copy Read Hits %The Copy Read Hits % statistic is the percentage of cache copy read requests that hit the cache and does not require a disk read to provide access to the page in the cache.
MetricsWhen the page is pinned in the memory, the page's physical address in the file system cache will not be altered. A copy read is a file read operation where a page in the cache is copied to the application's buffer. Because this value reflects hits, it ideally should be close to 100%. An amount below 100% indicates misses.
TroubleshootingAdding physical memory to a server results in a larger file system cache, which is generally more efficient. Defragmenting disks also helps, putting related pages in the cache together and thereby improving the cache hit rate
Data Map Hits %The Data Map Hits % statistic is the percentage of data maps in the file system cache that could be resolved without having to retrieve a page from the disk.
MetricsBecause this value reflects hits, it ideally should be close to 100%. An amount below 100% indicates misses.
TroubleshootingAdding physical memory to a server results in a larger file system cache, which is generally more efficient. Defragmenting disks also helps, putting related pages in the cache together and thereby improving the cache hit rate.
MDL Read Hits %The MDL Read Hits % statistic is the percentage of Memory Descriptor List Read requests to the file system cache that hit the cache and does not require disk access to provide memory access to the pages in the cache.
EMBARCADERO TECHNOLOGIES > EMBARCADERO PERFORMANCE CENTER 2.5 EXPERT GUIDE: SQL SERVER 118
OTHER VIEWS AND STATISTICS > OS PAGE STATISTICS
MetricsBecause this value reflects hits, it ideally should be close to 100%. An amount below 100% indicates misses.
TroubleshootingAdding physical memory to a server results in a larger file system cache, which is generally more efficient. Defragmenting disks also helps, putting related pages in the cache together and thereby improving the cache hit rate.
Pin Read Hits %The Pin Read Hits % statistic is the percentage of pin read requests that hit the file system cache and does not require a disk read in order to provide access to the page in the file system cache.
MetricsBecause this value reflects hits, it ideally should be close to 100%. An amount below 100% indicates misses.
TroubleshootingAdding physical memory to a server results in a larger file system cache, which is generally more efficient. Defragmenting disks also helps, putting related pages in the cache together and thereby improving the cache hit rate.
Space TabThe Space tab of the OS Detail page includes the following sections:
• Disk Space Free
• Disk Space Detail
Disk Space FreeThe Disk Space Free metric displays the amount of free disk space in megabytes.
MetricNone.
Disk Space Detail The Disk Space Detail section of the Space tab succinctly communicates the general overall performance levels of the server’s disks and space allotment. The table below describes the statistics in this section:
Statistic Description
Partition The drive letter of the disk.
Total Space Total size of the disk/device's capacity expressed in MBs.
Used Space Amount of MBs currently allocated on the particular disk/device.
Free Space Amount of MBs currently unallocated and free on the particular disk/device.
EMBARCADERO TECHNOLOGIES > EMBARCADERO PERFORMANCE CENTER 2.5 EXPERT GUIDE: SQL SERVER 119
OTHER VIEWS AND STATISTICS > SESSION DETAIL VIEW
Network TabThe Network tab of the OS Detail page succinctly communicates the general overall performance levels of the server's networking. The statistics available in this section depend on the platform of operating system. The table below describes the information available in this section:
Session Detail View The Session Detail view is available for the following database platforms:
• Oracle Session Detail View
• SQL Server Session Detail View
• Sybase Session Detail View
• DB2 Session Detail View
Oracle Session Detail ViewThe following tabbed pages are available on the Session Detail view for Oracle:
• Session Contention
• Session I/O
• Session Memory
• Session Network
• Session Objects
• Session SQL
• Session Statistics
Column Description
Network Interface The name of network interface.
INET Address/Address The IP address assigned to the network interface.
Pkts Sent/Sec The number of packets sent per second.
Pkts Received/Sec The number of packets received per second.
Sent (KB/Sec) The number of bytes sent per second.
Received (KB/Sec) The number of bytes received per second.
Out Pkts Discarded The number of outbound packets discarded.
In Pkts Discarded The number of inbound packets discarded.
Out Pkt Errors The number of outbound packet errors.
In Pkt Errors The number of inbound packet errors.
Queue Length The queue length.
Collisions The number of collisions.
Packets Discarded The number of packets discarded.
EMBARCADERO TECHNOLOGIES > EMBARCADERO PERFORMANCE CENTER 2.5 EXPERT GUIDE: SQL SERVER 120
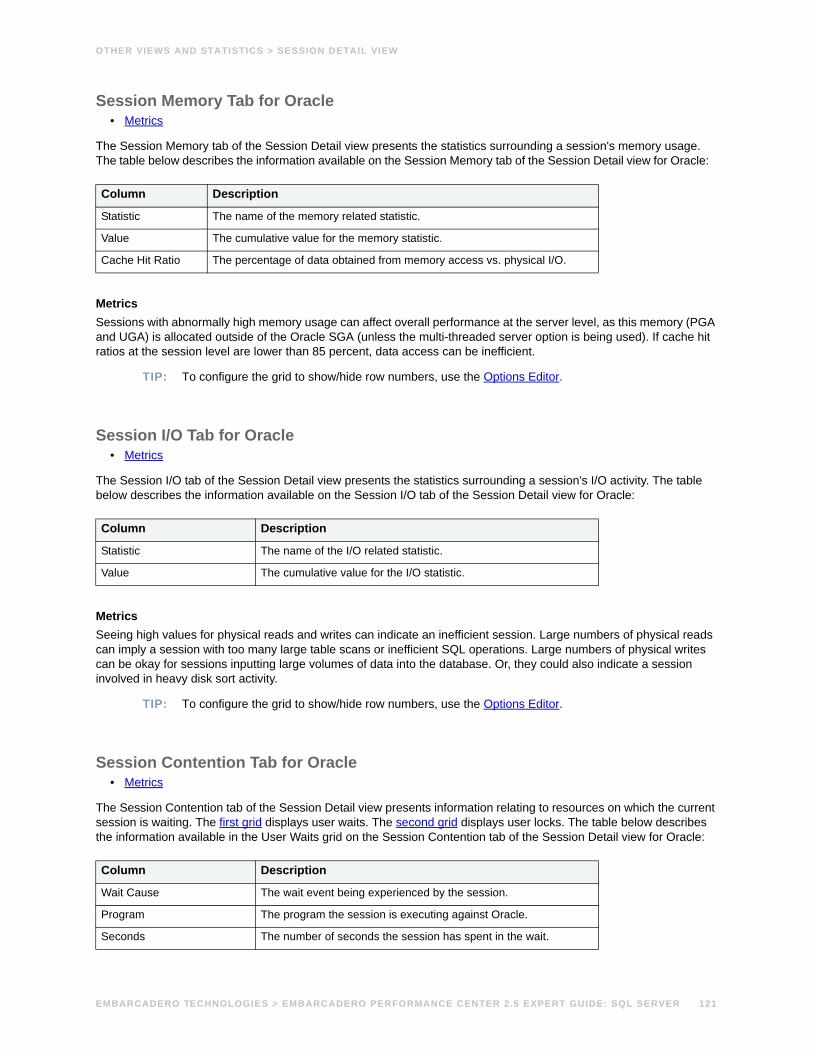
OTHER VIEWS AND STATISTICS > SESSION DETAIL VIEW
Session Memory Tab for Oracle• Metrics
The Session Memory tab of the Session Detail view presents the statistics surrounding a session's memory usage. The table below describes the information available on the Session Memory tab of the Session Detail view for Oracle:
MetricsSessions with abnormally high memory usage can affect overall performance at the server level, as this memory (PGA and UGA) is allocated outside of the Oracle SGA (unless the multi-threaded server option is being used). If cache hit ratios at the session level are lower than 85 percent, data access can be inefficient.
TIP: To configure the grid to show/hide row numbers, use the Options Editor.
Session I/O Tab for Oracle• Metrics
The Session I/O tab of the Session Detail view presents the statistics surrounding a session's I/O activity. The table below describes the information available on the Session I/O tab of the Session Detail view for Oracle:
MetricsSeeing high values for physical reads and writes can indicate an inefficient session. Large numbers of physical reads can imply a session with too many large table scans or inefficient SQL operations. Large numbers of physical writes can be okay for sessions inputting large volumes of data into the database. Or, they could also indicate a session involved in heavy disk sort activity.
TIP: To configure the grid to show/hide row numbers, use the Options Editor.
Session Contention Tab for Oracle• Metrics
The Session Contention tab of the Session Detail view presents information relating to resources on which the current session is waiting. The first grid displays user waits. The second grid displays user locks. The table below describes the information available in the User Waits grid on the Session Contention tab of the Session Detail view for Oracle:
Column Description
Statistic The name of the memory related statistic.
Value The cumulative value for the memory statistic.
Cache Hit Ratio The percentage of data obtained from memory access vs. physical I/O.
Column Description
Statistic The name of the I/O related statistic.
Value The cumulative value for the I/O statistic.
Column Description
Wait Cause The wait event being experienced by the session.
Program The program the session is executing against Oracle.
Seconds The number of seconds the session has spent in the wait.
EMBARCADERO TECHNOLOGIES > EMBARCADERO PERFORMANCE CENTER 2.5 EXPERT GUIDE: SQL SERVER 121
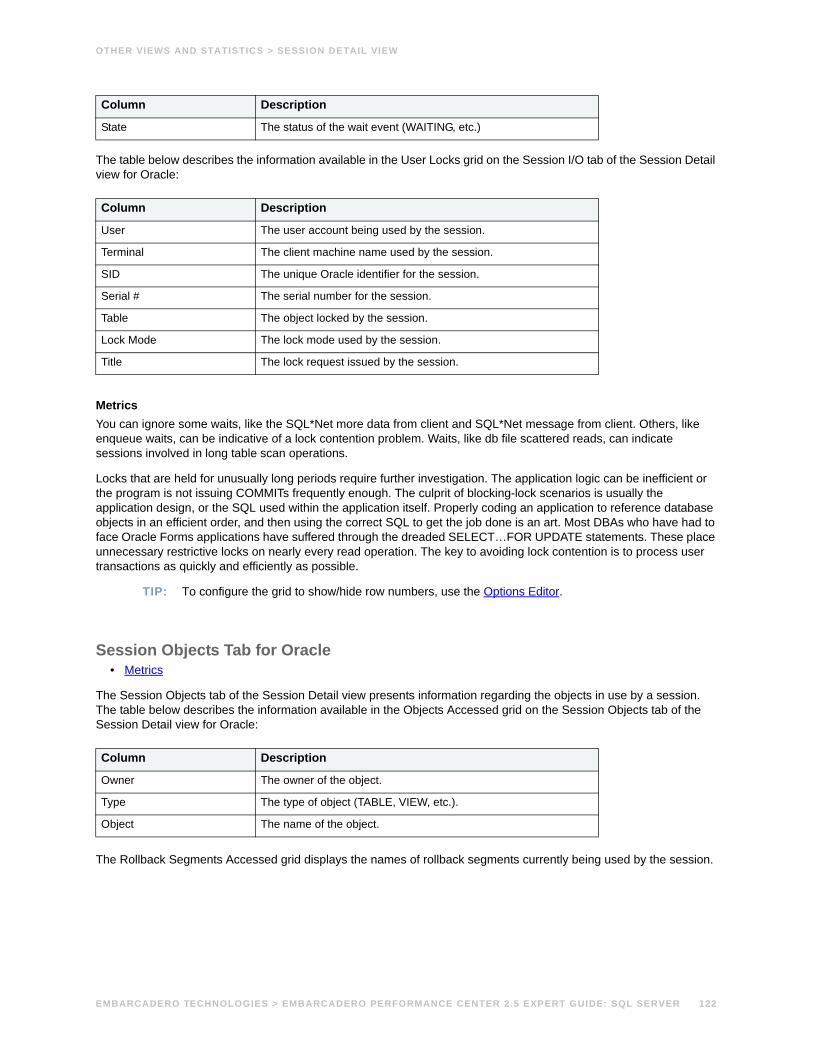
OTHER VIEWS AND STATISTICS > SESSION DETAIL VIEW
The table below describes the information available in the User Locks grid on the Session I/O tab of the Session Detail view for Oracle:
MetricsYou can ignore some waits, like the SQL*Net more data from client and SQL*Net message from client. Others, like enqueue waits, can be indicative of a lock contention problem. Waits, like db file scattered reads, can indicate sessions involved in long table scan operations.
Locks that are held for unusually long periods require further investigation. The application logic can be inefficient or the program is not issuing COMMITs frequently enough. The culprit of blocking-lock scenarios is usually the application design, or the SQL used within the application itself. Properly coding an application to reference database objects in an efficient order, and then using the correct SQL to get the job done is an art. Most DBAs who have had to face Oracle Forms applications have suffered through the dreaded SELECT…FOR UPDATE statements. These place unnecessary restrictive locks on nearly every read operation. The key to avoiding lock contention is to process user transactions as quickly and efficiently as possible.
TIP: To configure the grid to show/hide row numbers, use the Options Editor.
Session Objects Tab for Oracle• Metrics
The Session Objects tab of the Session Detail view presents information regarding the objects in use by a session. The table below describes the information available in the Objects Accessed grid on the Session Objects tab of the Session Detail view for Oracle:
The Rollback Segments Accessed grid displays the names of rollback segments currently being used by the session.
State The status of the wait event (WAITING, etc.)
Column Description
User The user account being used by the session.
Terminal The client machine name used by the session.
SID The unique Oracle identifier for the session.
Serial # The serial number for the session.
Table The object locked by the session.
Lock Mode The lock mode used by the session.
Title The lock request issued by the session.
Column Description
Owner The owner of the object.
Type The type of object (TABLE, VIEW, etc.).
Object The name of the object.
Column Description
EMBARCADERO TECHNOLOGIES > EMBARCADERO PERFORMANCE CENTER 2.5 EXPERT GUIDE: SQL SERVER 122
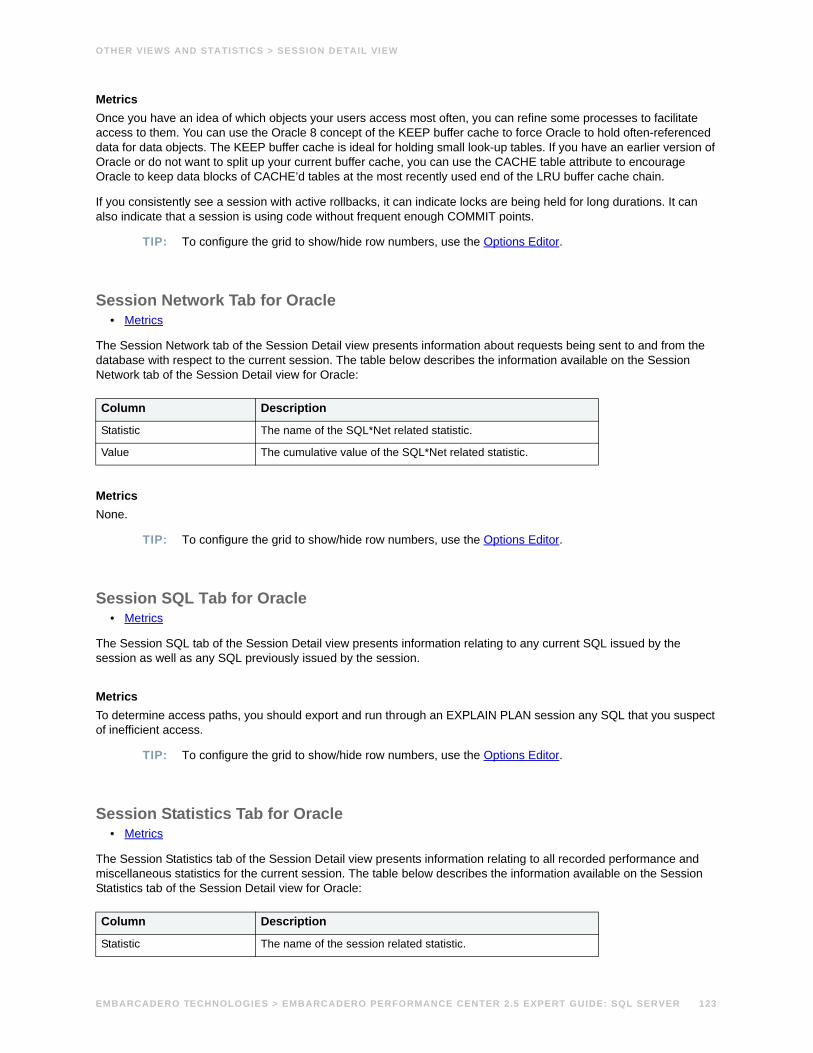
OTHER VIEWS AND STATISTICS > SESSION DETAIL VIEW
Metrics Once you have an idea of which objects your users access most often, you can refine some processes to facilitate access to them. You can use the Oracle 8 concept of the KEEP buffer cache to force Oracle to hold often-referenced data for data objects. The KEEP buffer cache is ideal for holding small look-up tables. If you have an earlier version of Oracle or do not want to split up your current buffer cache, you can use the CACHE table attribute to encourage Oracle to keep data blocks of CACHE’d tables at the most recently used end of the LRU buffer cache chain.
If you consistently see a session with active rollbacks, it can indicate locks are being held for long durations. It can also indicate that a session is using code without frequent enough COMMIT points.
TIP: To configure the grid to show/hide row numbers, use the Options Editor.
Session Network Tab for Oracle• Metrics
The Session Network tab of the Session Detail view presents information about requests being sent to and from the database with respect to the current session. The table below describes the information available on the Session Network tab of the Session Detail view for Oracle:
MetricsNone.
TIP: To configure the grid to show/hide row numbers, use the Options Editor.
Session SQL Tab for Oracle• Metrics
The Session SQL tab of the Session Detail view presents information relating to any current SQL issued by the session as well as any SQL previously issued by the session.
MetricsTo determine access paths, you should export and run through an EXPLAIN PLAN session any SQL that you suspect of inefficient access.
TIP: To configure the grid to show/hide row numbers, use the Options Editor.
Session Statistics Tab for Oracle• Metrics
The Session Statistics tab of the Session Detail view presents information relating to all recorded performance and miscellaneous statistics for the current session. The table below describes the information available on the Session Statistics tab of the Session Detail view for Oracle:
Column Description
Statistic The name of the SQL*Net related statistic.
Value The cumulative value of the SQL*Net related statistic.
Column Description
Statistic The name of the session related statistic.
EMBARCADERO TECHNOLOGIES > EMBARCADERO PERFORMANCE CENTER 2.5 EXPERT GUIDE: SQL SERVER 123
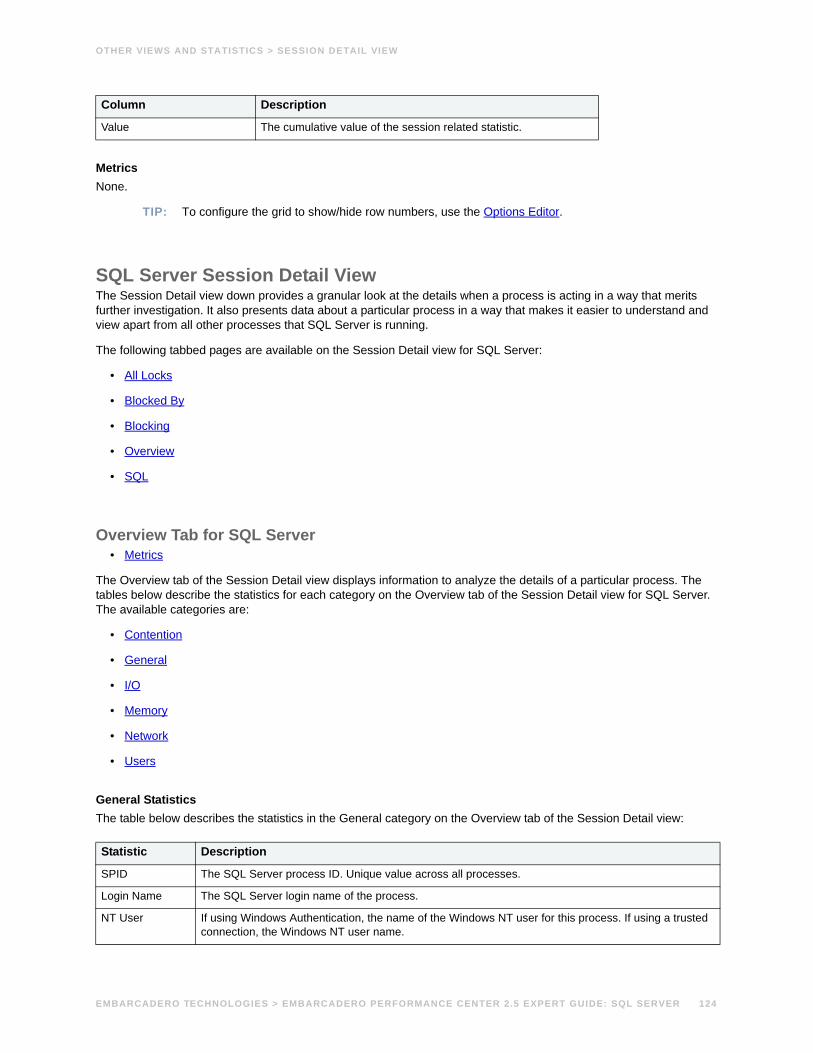
OTHER VIEWS AND STATISTICS > SESSION DETAIL VIEW
MetricsNone.
TIP: To configure the grid to show/hide row numbers, use the Options Editor.
SQL Server Session Detail ViewThe Session Detail view down provides a granular look at the details when a process is acting in a way that merits further investigation. It also presents data about a particular process in a way that makes it easier to understand and view apart from all other processes that SQL Server is running.
The following tabbed pages are available on the Session Detail view for SQL Server:
• All Locks
• Blocked By
• Blocking
• Overview
• SQL
Overview Tab for SQL Server• Metrics
The Overview tab of the Session Detail view displays information to analyze the details of a particular process. The tables below describe the statistics for each category on the Overview tab of the Session Detail view for SQL Server. The available categories are:
• Contention
• General
• I/O
• Memory
• Network
• Users
General StatisticsThe table below describes the statistics in the General category on the Overview tab of the Session Detail view:
Value The cumulative value of the session related statistic.
Statistic Description
SPID The SQL Server process ID. Unique value across all processes.
Login Name The SQL Server login name of the process.
NT User If using Windows Authentication, the name of the Windows NT user for this process. If using a trusted connection, the Windows NT user name.
Column Description
EMBARCADERO TECHNOLOGIES > EMBARCADERO PERFORMANCE CENTER 2.5 EXPERT GUIDE: SQL SERVER 124
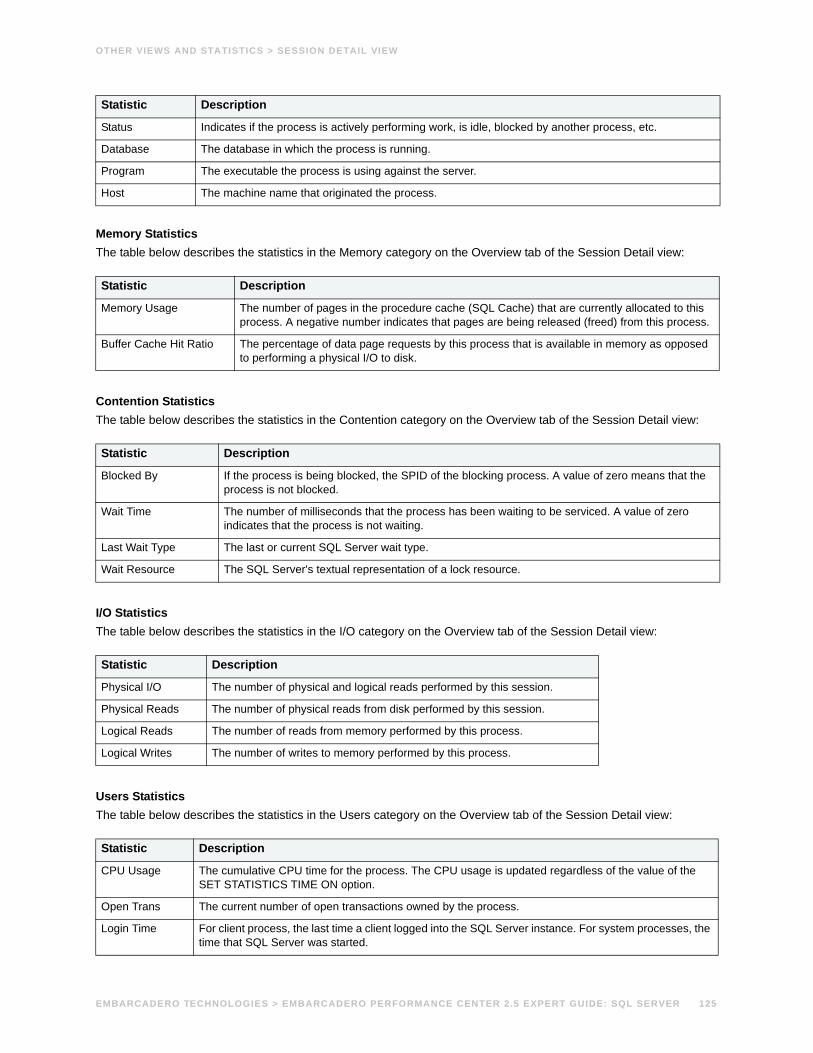
OTHER VIEWS AND STATISTICS > SESSION DETAIL VIEW
Memory StatisticsThe table below describes the statistics in the Memory category on the Overview tab of the Session Detail view:
Contention StatisticsThe table below describes the statistics in the Contention category on the Overview tab of the Session Detail view:
I/O StatisticsThe table below describes the statistics in the I/O category on the Overview tab of the Session Detail view:
Users StatisticsThe table below describes the statistics in the Users category on the Overview tab of the Session Detail view:
Status Indicates if the process is actively performing work, is idle, blocked by another process, etc.
Database The database in which the process is running.
Program The executable the process is using against the server.
Host The machine name that originated the process.
Statistic Description
Memory Usage The number of pages in the procedure cache (SQL Cache) that are currently allocated to this process. A negative number indicates that pages are being released (freed) from this process.
Buffer Cache Hit Ratio The percentage of data page requests by this process that is available in memory as opposed to performing a physical I/O to disk.
Statistic Description
Blocked By If the process is being blocked, the SPID of the blocking process. A value of zero means that the process is not blocked.
Wait Time The number of milliseconds that the process has been waiting to be serviced. A value of zero indicates that the process is not waiting.
Last Wait Type The last or current SQL Server wait type.
Wait Resource The SQL Server's textual representation of a lock resource.
Statistic Description
Physical I/O The number of physical and logical reads performed by this session.
Physical Reads The number of physical reads from disk performed by this session.
Logical Reads The number of reads from memory performed by this process.
Logical Writes The number of writes to memory performed by this process.
Statistic Description
CPU Usage The cumulative CPU time for the process. The CPU usage is updated regardless of the value of the SET STATISTICS TIME ON option.
Open Trans The current number of open transactions owned by the process.
Login Time For client process, the last time a client logged into the SQL Server instance. For system processes, the time that SQL Server was started.
Statistic Description
EMBARCADERO TECHNOLOGIES > EMBARCADERO PERFORMANCE CENTER 2.5 EXPERT GUIDE: SQL SERVER 125
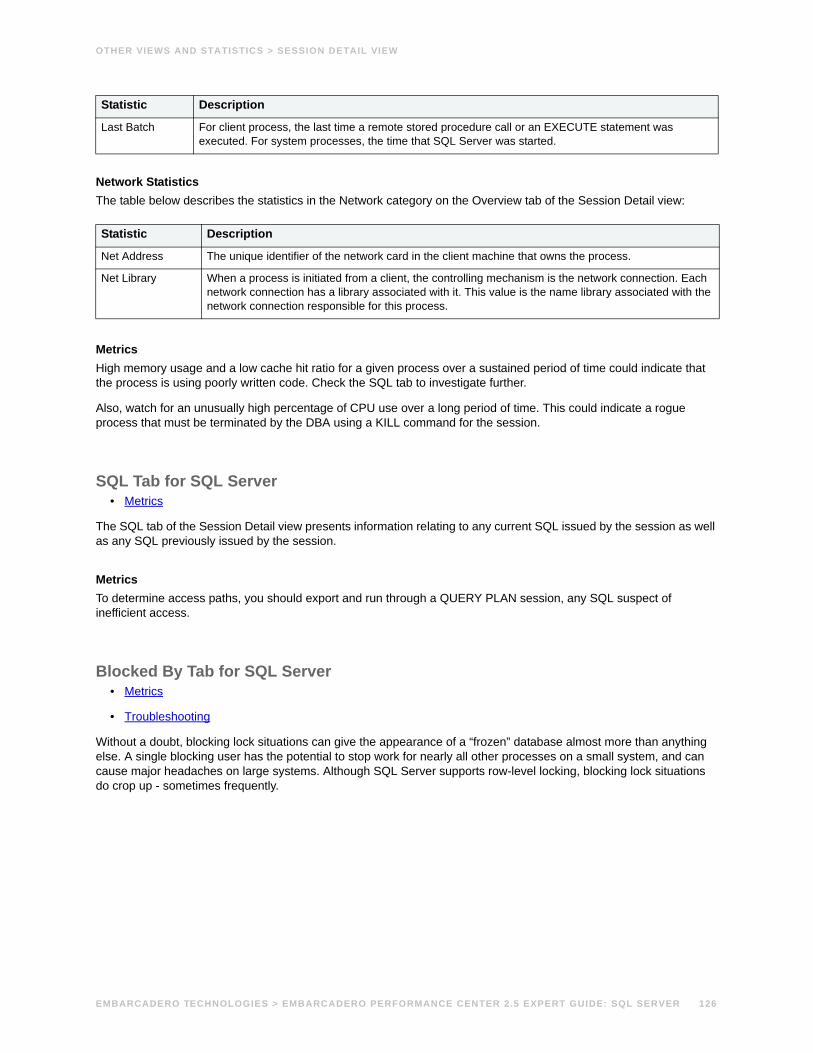
OTHER VIEWS AND STATISTICS > SESSION DETAIL VIEW
Network StatisticsThe table below describes the statistics in the Network category on the Overview tab of the Session Detail view:
MetricsHigh memory usage and a low cache hit ratio for a given process over a sustained period of time could indicate that the process is using poorly written code. Check the SQL tab to investigate further.
Also, watch for an unusually high percentage of CPU use over a long period of time. This could indicate a rogue process that must be terminated by the DBA using a KILL command for the session.
SQL Tab for SQL Server• Metrics
The SQL tab of the Session Detail view presents information relating to any current SQL issued by the session as well as any SQL previously issued by the session.
MetricsTo determine access paths, you should export and run through a QUERY PLAN session, any SQL suspect of inefficient access.
Blocked By Tab for SQL Server• Metrics
• Troubleshooting
Without a doubt, blocking lock situations can give the appearance of a “frozen” database almost more than anything else. A single blocking user has the potential to stop work for nearly all other processes on a small system, and can cause major headaches on large systems. Although SQL Server supports row-level locking, blocking lock situations do crop up - sometimes frequently.
Last Batch For client process, the last time a remote stored procedure call or an EXECUTE statement was executed. For system processes, the time that SQL Server was started.
Statistic Description
Net Address The unique identifier of the network card in the client machine that owns the process.
Net Library When a process is initiated from a client, the controlling mechanism is the network connection. Each network connection has a library associated with it. This value is the name library associated with the network connection responsible for this process.
Statistic Description
EMBARCADERO TECHNOLOGIES > EMBARCADERO PERFORMANCE CENTER 2.5 EXPERT GUIDE: SQL SERVER 126
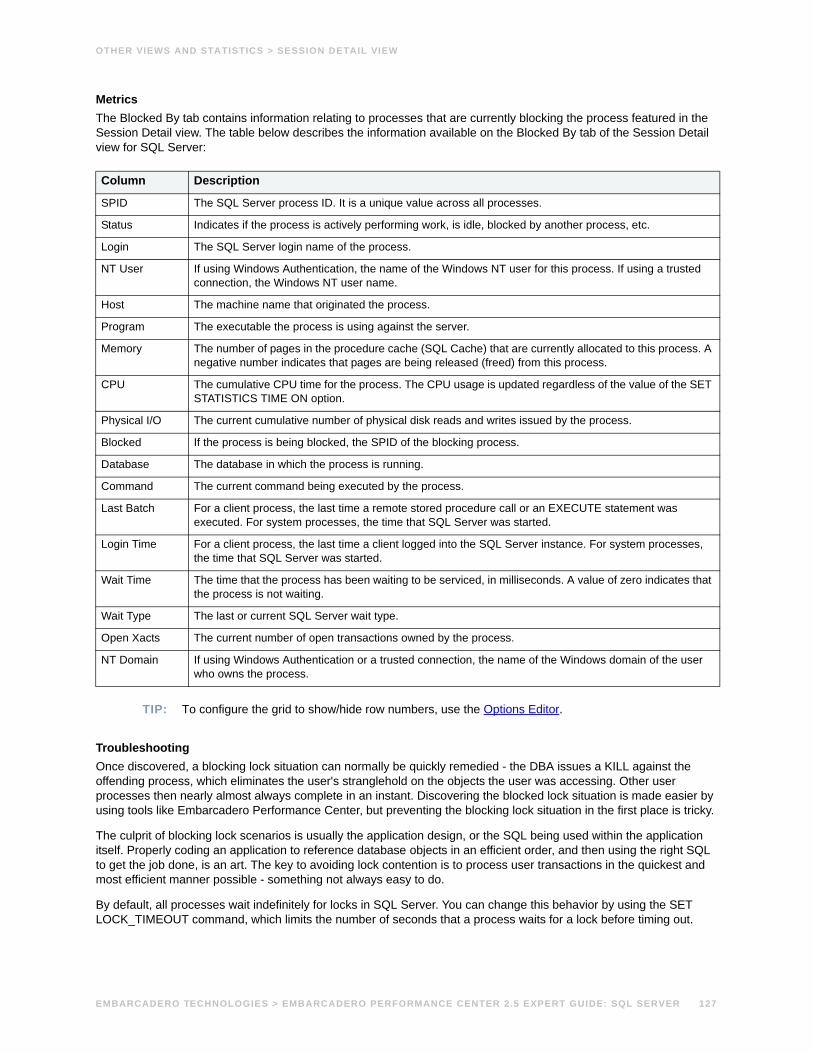
OTHER VIEWS AND STATISTICS > SESSION DETAIL VIEW
MetricsThe Blocked By tab contains information relating to processes that are currently blocking the process featured in the Session Detail view. The table below describes the information available on the Blocked By tab of the Session Detail view for SQL Server:
TIP: To configure the grid to show/hide row numbers, use the Options Editor.
TroubleshootingOnce discovered, a blocking lock situation can normally be quickly remedied - the DBA issues a KILL against the offending process, which eliminates the user's stranglehold on the objects the user was accessing. Other user processes then nearly almost always complete in an instant. Discovering the blocked lock situation is made easier by using tools like Embarcadero Performance Center, but preventing the blocking lock situation in the first place is tricky.
The culprit of blocking lock scenarios is usually the application design, or the SQL being used within the application itself. Properly coding an application to reference database objects in an efficient order, and then using the right SQL to get the job done, is an art. The key to avoiding lock contention is to process user transactions in the quickest and most efficient manner possible - something not always easy to do.
By default, all processes wait indefinitely for locks in SQL Server. You can change this behavior by using the SET LOCK_TIMEOUT command, which limits the number of seconds that a process waits for a lock before timing out.
Column Description
SPID The SQL Server process ID. It is a unique value across all processes.
Status Indicates if the process is actively performing work, is idle, blocked by another process, etc.
Login The SQL Server login name of the process.
NT User If using Windows Authentication, the name of the Windows NT user for this process. If using a trusted connection, the Windows NT user name.
Host The machine name that originated the process.
Program The executable the process is using against the server.
Memory The number of pages in the procedure cache (SQL Cache) that are currently allocated to this process. A negative number indicates that pages are being released (freed) from this process.
CPU The cumulative CPU time for the process. The CPU usage is updated regardless of the value of the SET STATISTICS TIME ON option.
Physical I/O The current cumulative number of physical disk reads and writes issued by the process.
Blocked If the process is being blocked, the SPID of the blocking process.
Database The database in which the process is running.
Command The current command being executed by the process.
Last Batch For a client process, the last time a remote stored procedure call or an EXECUTE statement was executed. For system processes, the time that SQL Server was started.
Login Time For a client process, the last time a client logged into the SQL Server instance. For system processes, the time that SQL Server was started.
Wait Time The time that the process has been waiting to be serviced, in milliseconds. A value of zero indicates that the process is not waiting.
Wait Type The last or current SQL Server wait type.
Open Xacts The current number of open transactions owned by the process.
NT Domain If using Windows Authentication or a trusted connection, the name of the Windows domain of the user who owns the process.
EMBARCADERO TECHNOLOGIES > EMBARCADERO PERFORMANCE CENTER 2.5 EXPERT GUIDE: SQL SERVER 127
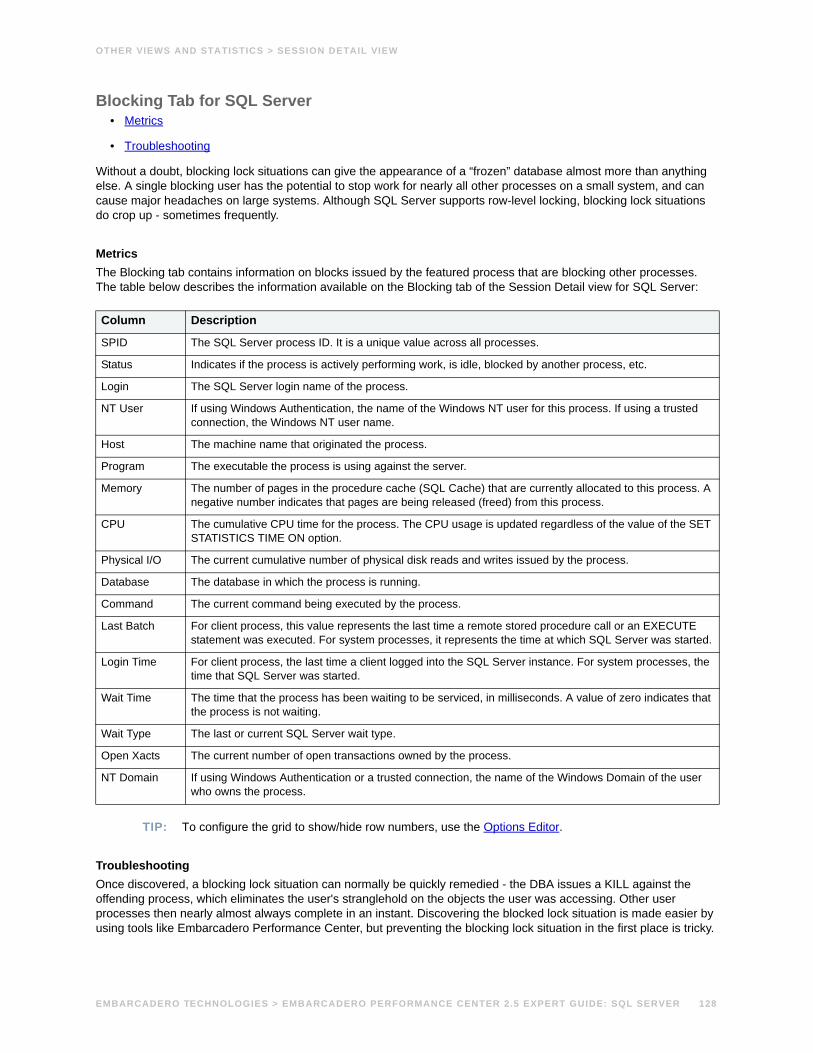
OTHER VIEWS AND STATISTICS > SESSION DETAIL VIEW
Blocking Tab for SQL Server• Metrics
• Troubleshooting
Without a doubt, blocking lock situations can give the appearance of a “frozen” database almost more than anything else. A single blocking user has the potential to stop work for nearly all other processes on a small system, and can cause major headaches on large systems. Although SQL Server supports row-level locking, blocking lock situations do crop up - sometimes frequently.
MetricsThe Blocking tab contains information on blocks issued by the featured process that are blocking other processes. The table below describes the information available on the Blocking tab of the Session Detail view for SQL Server:
TIP: To configure the grid to show/hide row numbers, use the Options Editor.
TroubleshootingOnce discovered, a blocking lock situation can normally be quickly remedied - the DBA issues a KILL against the offending process, which eliminates the user's stranglehold on the objects the user was accessing. Other user processes then nearly almost always complete in an instant. Discovering the blocked lock situation is made easier by using tools like Embarcadero Performance Center, but preventing the blocking lock situation in the first place is tricky.
Column Description
SPID The SQL Server process ID. It is a unique value across all processes.
Status Indicates if the process is actively performing work, is idle, blocked by another process, etc.
Login The SQL Server login name of the process.
NT User If using Windows Authentication, the name of the Windows NT user for this process. If using a trusted connection, the Windows NT user name.
Host The machine name that originated the process.
Program The executable the process is using against the server.
Memory The number of pages in the procedure cache (SQL Cache) that are currently allocated to this process. A negative number indicates that pages are being released (freed) from this process.
CPU The cumulative CPU time for the process. The CPU usage is updated regardless of the value of the SET STATISTICS TIME ON option.
Physical I/O The current cumulative number of physical disk reads and writes issued by the process.
Database The database in which the process is running.
Command The current command being executed by the process.
Last Batch For client process, this value represents the last time a remote stored procedure call or an EXECUTE statement was executed. For system processes, it represents the time at which SQL Server was started.
Login Time For client process, the last time a client logged into the SQL Server instance. For system processes, the time that SQL Server was started.
Wait Time The time that the process has been waiting to be serviced, in milliseconds. A value of zero indicates that the process is not waiting.
Wait Type The last or current SQL Server wait type.
Open Xacts The current number of open transactions owned by the process.
NT Domain If using Windows Authentication or a trusted connection, the name of the Windows Domain of the user who owns the process.
EMBARCADERO TECHNOLOGIES > EMBARCADERO PERFORMANCE CENTER 2.5 EXPERT GUIDE: SQL SERVER 128
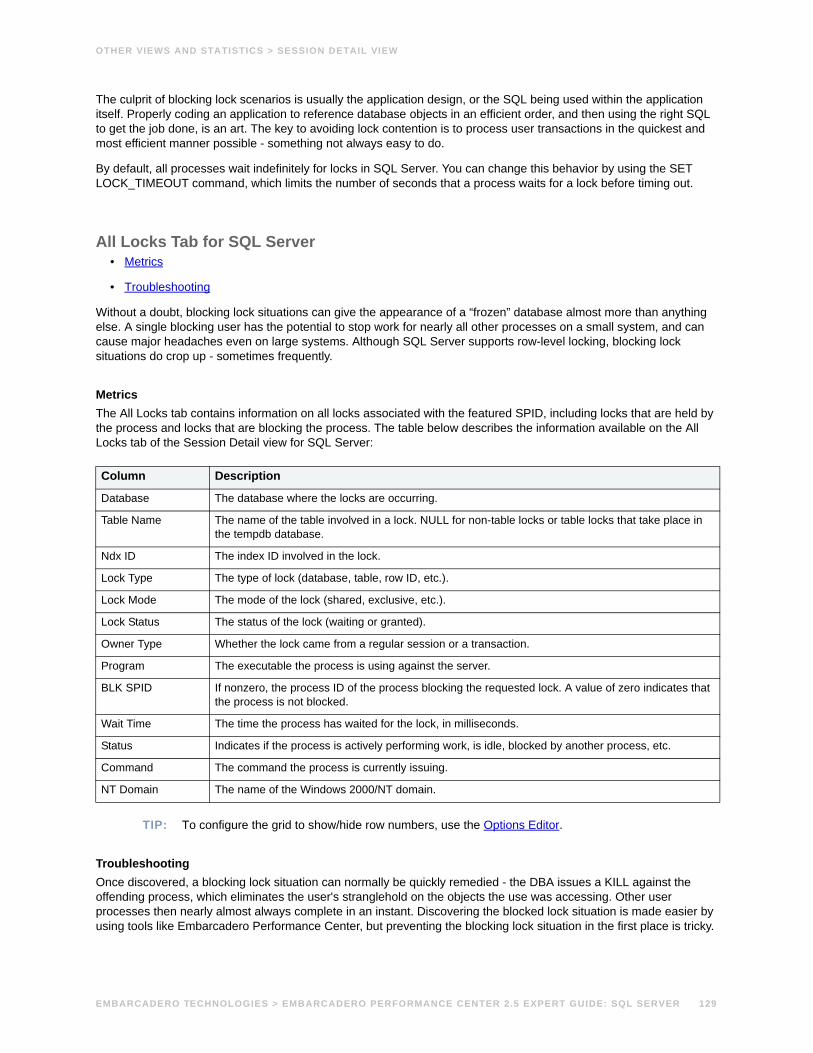
OTHER VIEWS AND STATISTICS > SESSION DETAIL VIEW
The culprit of blocking lock scenarios is usually the application design, or the SQL being used within the application itself. Properly coding an application to reference database objects in an efficient order, and then using the right SQL to get the job done, is an art. The key to avoiding lock contention is to process user transactions in the quickest and most efficient manner possible - something not always easy to do.
By default, all processes wait indefinitely for locks in SQL Server. You can change this behavior by using the SET LOCK_TIMEOUT command, which limits the number of seconds that a process waits for a lock before timing out.
All Locks Tab for SQL Server• Metrics
• Troubleshooting
Without a doubt, blocking lock situations can give the appearance of a “frozen” database almost more than anything else. A single blocking user has the potential to stop work for nearly all other processes on a small system, and can cause major headaches even on large systems. Although SQL Server supports row-level locking, blocking lock situations do crop up - sometimes frequently.
MetricsThe All Locks tab contains information on all locks associated with the featured SPID, including locks that are held by the process and locks that are blocking the process. The table below describes the information available on the All Locks tab of the Session Detail view for SQL Server:
TIP: To configure the grid to show/hide row numbers, use the Options Editor.
TroubleshootingOnce discovered, a blocking lock situation can normally be quickly remedied - the DBA issues a KILL against the offending process, which eliminates the user's stranglehold on the objects the use was accessing. Other user processes then nearly almost always complete in an instant. Discovering the blocked lock situation is made easier by using tools like Embarcadero Performance Center, but preventing the blocking lock situation in the first place is tricky.
Column Description
Database The database where the locks are occurring.
Table Name The name of the table involved in a lock. NULL for non-table locks or table locks that take place in the tempdb database.
Ndx ID The index ID involved in the lock.
Lock Type The type of lock (database, table, row ID, etc.).
Lock Mode The mode of the lock (shared, exclusive, etc.).
Lock Status The status of the lock (waiting or granted).
Owner Type Whether the lock came from a regular session or a transaction.
Program The executable the process is using against the server.
BLK SPID If nonzero, the process ID of the process blocking the requested lock. A value of zero indicates that the process is not blocked.
Wait Time The time the process has waited for the lock, in milliseconds.
Status Indicates if the process is actively performing work, is idle, blocked by another process, etc.
Command The command the process is currently issuing.
NT Domain The name of the Windows 2000/NT domain.
EMBARCADERO TECHNOLOGIES > EMBARCADERO PERFORMANCE CENTER 2.5 EXPERT GUIDE: SQL SERVER 129
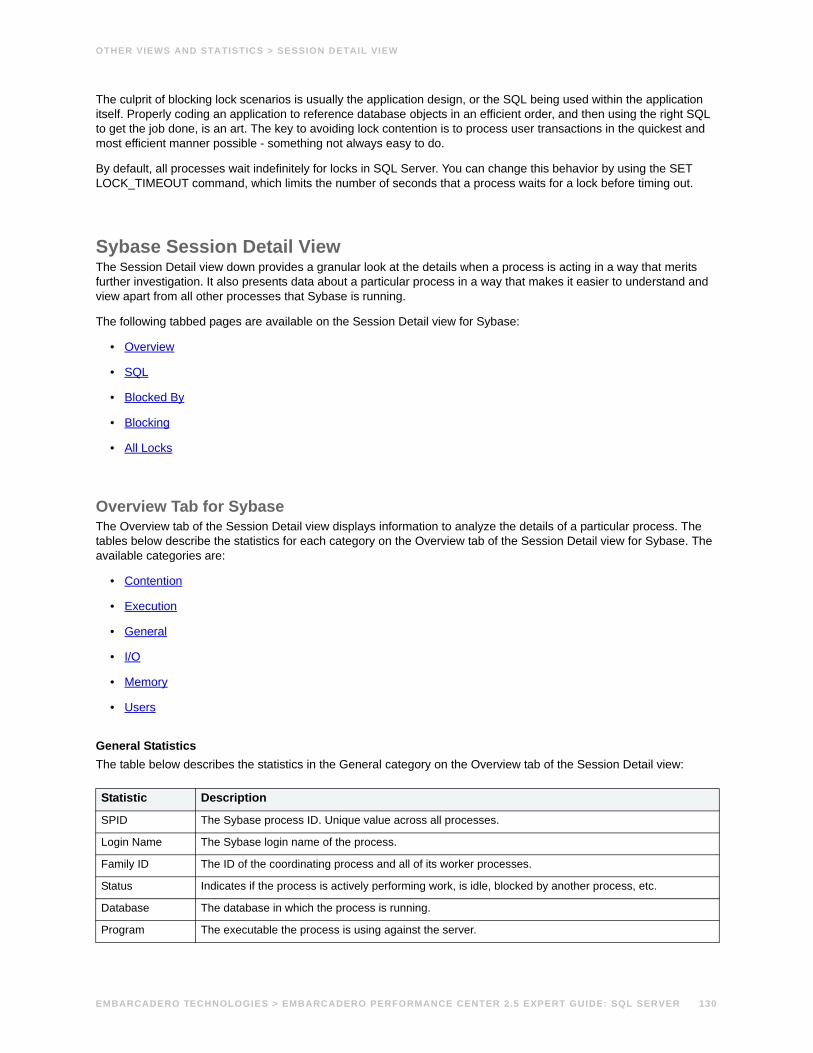
OTHER VIEWS AND STATISTICS > SESSION DETAIL VIEW
The culprit of blocking lock scenarios is usually the application design, or the SQL being used within the application itself. Properly coding an application to reference database objects in an efficient order, and then using the right SQL to get the job done, is an art. The key to avoiding lock contention is to process user transactions in the quickest and most efficient manner possible - something not always easy to do.
By default, all processes wait indefinitely for locks in SQL Server. You can change this behavior by using the SET LOCK_TIMEOUT command, which limits the number of seconds that a process waits for a lock before timing out.
Sybase Session Detail ViewThe Session Detail view down provides a granular look at the details when a process is acting in a way that merits further investigation. It also presents data about a particular process in a way that makes it easier to understand and view apart from all other processes that Sybase is running.
The following tabbed pages are available on the Session Detail view for Sybase:
• Overview
• SQL
• Blocked By
• Blocking
• All Locks
Overview Tab for SybaseThe Overview tab of the Session Detail view displays information to analyze the details of a particular process. The tables below describe the statistics for each category on the Overview tab of the Session Detail view for Sybase. The available categories are:
• Contention
• Execution
• General
• I/O
• Memory
• Users
General StatisticsThe table below describes the statistics in the General category on the Overview tab of the Session Detail view:
Statistic Description
SPID The Sybase process ID. Unique value across all processes.
Login Name The Sybase login name of the process.
Family ID The ID of the coordinating process and all of its worker processes.
Status Indicates if the process is actively performing work, is idle, blocked by another process, etc.
Database The database in which the process is running.
Program The executable the process is using against the server.
EMBARCADERO TECHNOLOGIES > EMBARCADERO PERFORMANCE CENTER 2.5 EXPERT GUIDE: SQL SERVER 130
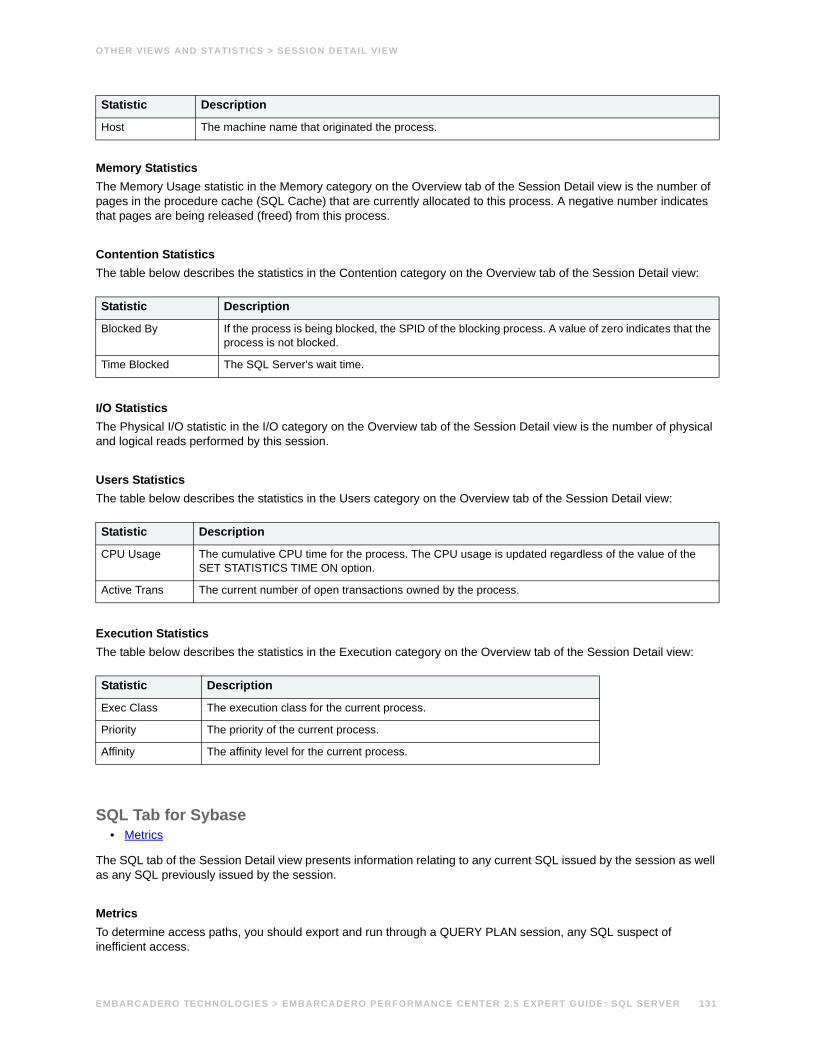
OTHER VIEWS AND STATISTICS > SESSION DETAIL VIEW
Memory StatisticsThe Memory Usage statistic in the Memory category on the Overview tab of the Session Detail view is the number of pages in the procedure cache (SQL Cache) that are currently allocated to this process. A negative number indicates that pages are being released (freed) from this process.
Contention StatisticsThe table below describes the statistics in the Contention category on the Overview tab of the Session Detail view:
I/O StatisticsThe Physical I/O statistic in the I/O category on the Overview tab of the Session Detail view is the number of physical and logical reads performed by this session.
Users StatisticsThe table below describes the statistics in the Users category on the Overview tab of the Session Detail view:
Execution StatisticsThe table below describes the statistics in the Execution category on the Overview tab of the Session Detail view:
SQL Tab for Sybase• Metrics
The SQL tab of the Session Detail view presents information relating to any current SQL issued by the session as well as any SQL previously issued by the session.
Metrics To determine access paths, you should export and run through a QUERY PLAN session, any SQL suspect of inefficient access.
Host The machine name that originated the process.
Statistic Description
Blocked By If the process is being blocked, the SPID of the blocking process. A value of zero indicates that the process is not blocked.
Time Blocked The SQL Server's wait time.
Statistic Description
CPU Usage The cumulative CPU time for the process. The CPU usage is updated regardless of the value of the SET STATISTICS TIME ON option.
Active Trans The current number of open transactions owned by the process.
Statistic Description
Exec Class The execution class for the current process.
Priority The priority of the current process.
Affinity The affinity level for the current process.
Statistic Description
EMBARCADERO TECHNOLOGIES > EMBARCADERO PERFORMANCE CENTER 2.5 EXPERT GUIDE: SQL SERVER 131
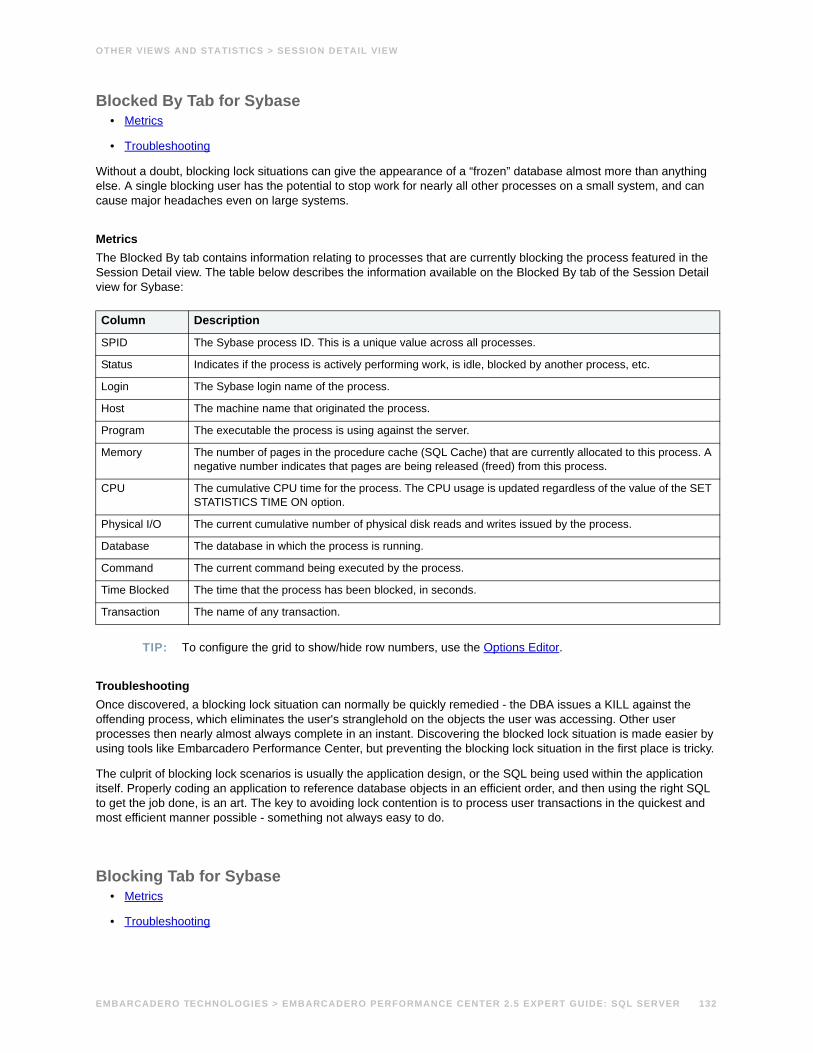
OTHER VIEWS AND STATISTICS > SESSION DETAIL VIEW
Blocked By Tab for Sybase• Metrics
• Troubleshooting
Without a doubt, blocking lock situations can give the appearance of a “frozen” database almost more than anything else. A single blocking user has the potential to stop work for nearly all other processes on a small system, and can cause major headaches even on large systems.
Metrics The Blocked By tab contains information relating to processes that are currently blocking the process featured in the Session Detail view. The table below describes the information available on the Blocked By tab of the Session Detail view for Sybase:
TIP: To configure the grid to show/hide row numbers, use the Options Editor.
TroubleshootingOnce discovered, a blocking lock situation can normally be quickly remedied - the DBA issues a KILL against the offending process, which eliminates the user's stranglehold on the objects the user was accessing. Other user processes then nearly almost always complete in an instant. Discovering the blocked lock situation is made easier by using tools like Embarcadero Performance Center, but preventing the blocking lock situation in the first place is tricky.
The culprit of blocking lock scenarios is usually the application design, or the SQL being used within the application itself. Properly coding an application to reference database objects in an efficient order, and then using the right SQL to get the job done, is an art. The key to avoiding lock contention is to process user transactions in the quickest and most efficient manner possible - something not always easy to do.
Blocking Tab for Sybase• Metrics
• Troubleshooting
Column Description
SPID The Sybase process ID. This is a unique value across all processes.
Status Indicates if the process is actively performing work, is idle, blocked by another process, etc.
Login The Sybase login name of the process.
Host The machine name that originated the process.
Program The executable the process is using against the server.
Memory The number of pages in the procedure cache (SQL Cache) that are currently allocated to this process. A negative number indicates that pages are being released (freed) from this process.
CPU The cumulative CPU time for the process. The CPU usage is updated regardless of the value of the SET STATISTICS TIME ON option.
Physical I/O The current cumulative number of physical disk reads and writes issued by the process.
Database The database in which the process is running.
Command The current command being executed by the process.
Time Blocked The time that the process has been blocked, in seconds.
Transaction The name of any transaction.
EMBARCADERO TECHNOLOGIES > EMBARCADERO PERFORMANCE CENTER 2.5 EXPERT GUIDE: SQL SERVER 132
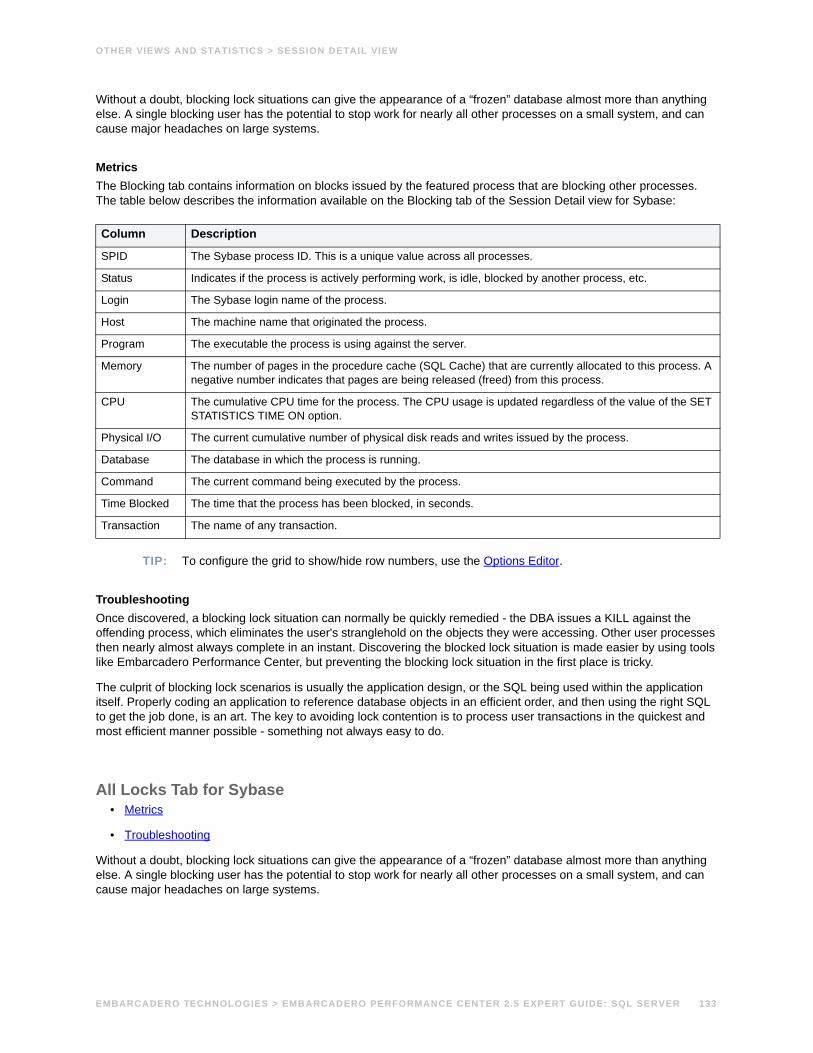
OTHER VIEWS AND STATISTICS > SESSION DETAIL VIEW
Without a doubt, blocking lock situations can give the appearance of a “frozen” database almost more than anything else. A single blocking user has the potential to stop work for nearly all other processes on a small system, and can cause major headaches on large systems.
Metrics The Blocking tab contains information on blocks issued by the featured process that are blocking other processes. The table below describes the information available on the Blocking tab of the Session Detail view for Sybase:
TIP: To configure the grid to show/hide row numbers, use the Options Editor.
TroubleshootingOnce discovered, a blocking lock situation can normally be quickly remedied - the DBA issues a KILL against the offending process, which eliminates the user's stranglehold on the objects they were accessing. Other user processes then nearly almost always complete in an instant. Discovering the blocked lock situation is made easier by using tools like Embarcadero Performance Center, but preventing the blocking lock situation in the first place is tricky.
The culprit of blocking lock scenarios is usually the application design, or the SQL being used within the application itself. Properly coding an application to reference database objects in an efficient order, and then using the right SQL to get the job done, is an art. The key to avoiding lock contention is to process user transactions in the quickest and most efficient manner possible - something not always easy to do.
All Locks Tab for Sybase• Metrics
• Troubleshooting
Without a doubt, blocking lock situations can give the appearance of a “frozen” database almost more than anything else. A single blocking user has the potential to stop work for nearly all other processes on a small system, and can cause major headaches on large systems.
Column Description
SPID The Sybase process ID. This is a unique value across all processes.
Status Indicates if the process is actively performing work, is idle, blocked by another process, etc.
Login The Sybase login name of the process.
Host The machine name that originated the process.
Program The executable the process is using against the server.
Memory The number of pages in the procedure cache (SQL Cache) that are currently allocated to this process. A negative number indicates that pages are being released (freed) from this process.
CPU The cumulative CPU time for the process. The CPU usage is updated regardless of the value of the SET STATISTICS TIME ON option.
Physical I/O The current cumulative number of physical disk reads and writes issued by the process.
Database The database in which the process is running.
Command The current command being executed by the process.
Time Blocked The time that the process has been blocked, in seconds.
Transaction The name of any transaction.
EMBARCADERO TECHNOLOGIES > EMBARCADERO PERFORMANCE CENTER 2.5 EXPERT GUIDE: SQL SERVER 133
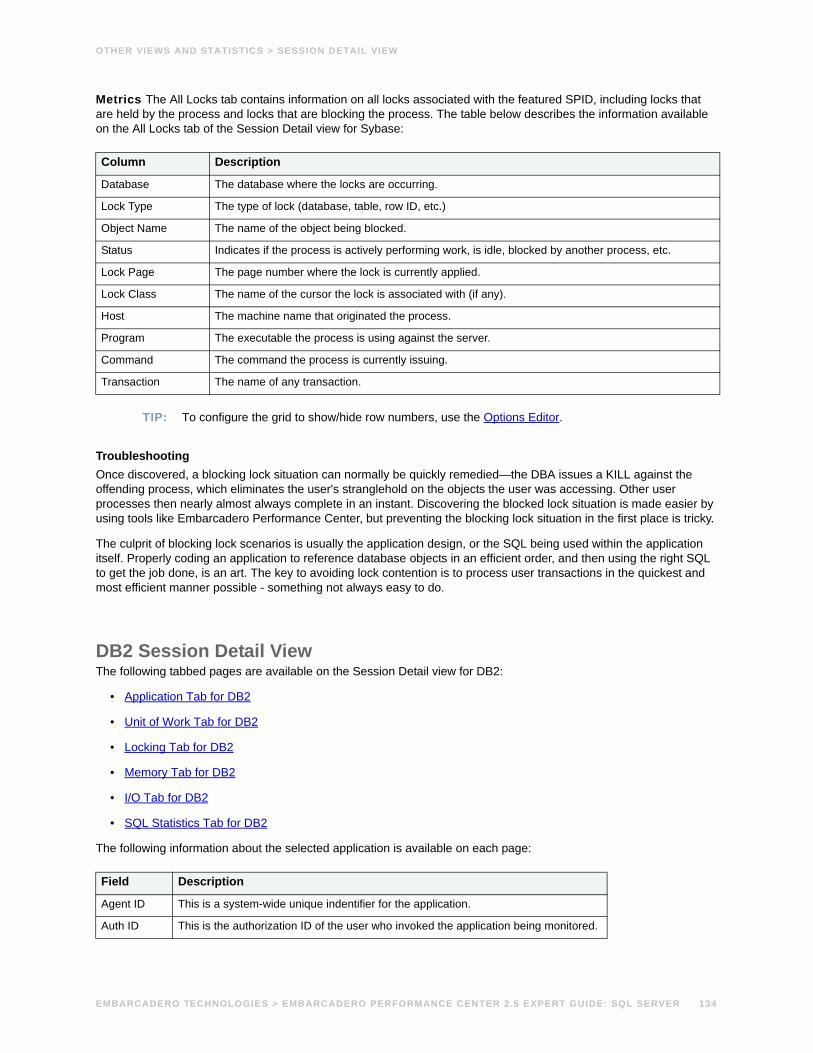
OTHER VIEWS AND STATISTICS > SESSION DETAIL VIEW
Metrics The All Locks tab contains information on all locks associated with the featured SPID, including locks that are held by the process and locks that are blocking the process. The table below describes the information available on the All Locks tab of the Session Detail view for Sybase:
TIP: To configure the grid to show/hide row numbers, use the Options Editor.
TroubleshootingOnce discovered, a blocking lock situation can normally be quickly remedied—the DBA issues a KILL against the offending process, which eliminates the user's stranglehold on the objects the user was accessing. Other user processes then nearly almost always complete in an instant. Discovering the blocked lock situation is made easier by using tools like Embarcadero Performance Center, but preventing the blocking lock situation in the first place is tricky.
The culprit of blocking lock scenarios is usually the application design, or the SQL being used within the application itself. Properly coding an application to reference database objects in an efficient order, and then using the right SQL to get the job done, is an art. The key to avoiding lock contention is to process user transactions in the quickest and most efficient manner possible - something not always easy to do.
DB2 Session Detail ViewThe following tabbed pages are available on the Session Detail view for DB2:
• Application Tab for DB2
• Unit of Work Tab for DB2
• Locking Tab for DB2
• Memory Tab for DB2
• I/O Tab for DB2
• SQL Statistics Tab for DB2
The following information about the selected application is available on each page:
Column Description
Database The database where the locks are occurring.
Lock Type The type of lock (database, table, row ID, etc.)
Object Name The name of the object being blocked.
Status Indicates if the process is actively performing work, is idle, blocked by another process, etc.
Lock Page The page number where the lock is currently applied.
Lock Class The name of the cursor the lock is associated with (if any).
Host The machine name that originated the process.
Program The executable the process is using against the server.
Command The command the process is currently issuing.
Transaction The name of any transaction.
Field Description
Agent ID This is a system-wide unique indentifier for the application.
Auth ID This is the authorization ID of the user who invoked the application being monitored.
EMBARCADERO TECHNOLOGIES > EMBARCADERO PERFORMANCE CENTER 2.5 EXPERT GUIDE: SQL SERVER 134
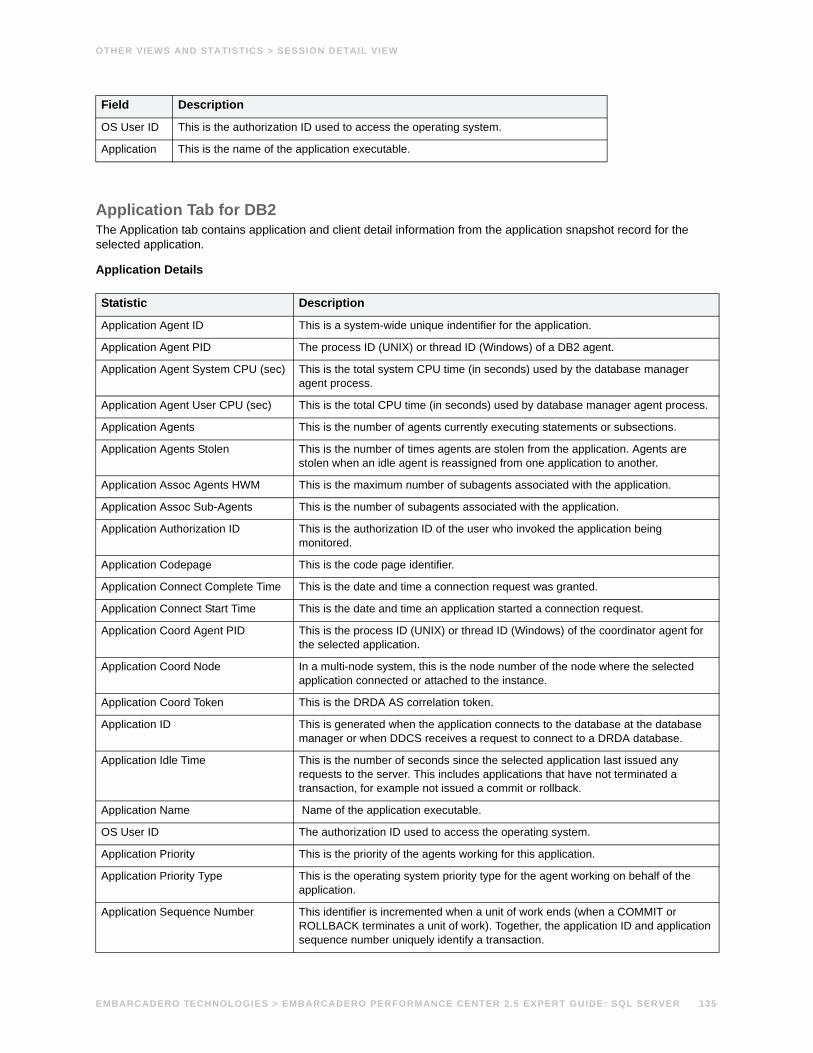
OTHER VIEWS AND STATISTICS > SESSION DETAIL VIEW
Application Tab for DB2The Application tab contains application and client detail information from the application snapshot record for the selected application.
Application Details
OS User ID This is the authorization ID used to access the operating system.
Application This is the name of the application executable.
Statistic Description
Application Agent ID This is a system-wide unique indentifier for the application.
Application Agent PID The process ID (UNIX) or thread ID (Windows) of a DB2 agent.
Application Agent System CPU (sec) This is the total system CPU time (in seconds) used by the database manager agent process.
Application Agent User CPU (sec) This is the total CPU time (in seconds) used by database manager agent process.
Application Agents This is the number of agents currently executing statements or subsections.
Application Agents Stolen This is the number of times agents are stolen from the application. Agents are stolen when an idle agent is reassigned from one application to another.
Application Assoc Agents HWM This is the maximum number of subagents associated with the application.
Application Assoc Sub-Agents This is the number of subagents associated with the application.
Application Authorization ID This is the authorization ID of the user who invoked the application being monitored.
Application Codepage This is the code page identifier.
Application Connect Complete Time This is the date and time a connection request was granted.
Application Connect Start Time This is the date and time an application started a connection request.
Application Coord Agent PID This is the process ID (UNIX) or thread ID (Windows) of the coordinator agent for the selected application.
Application Coord Node In a multi-node system, this is the node number of the node where the selected application connected or attached to the instance.
Application Coord Token This is the DRDA AS correlation token.
Application ID This is generated when the application connects to the database at the database manager or when DDCS receives a request to connect to a DRDA database.
Application Idle Time This is the number of seconds since the selected application last issued any requests to the server. This includes applications that have not terminated a transaction, for example not issued a commit or rollback.
Application Name Name of the application executable.
OS User ID The authorization ID used to access the operating system.
Application Priority This is the priority of the agents working for this application.
Application Priority Type This is the operating system priority type for the agent working on behalf of the application.
Application Sequence Number This identifier is incremented when a unit of work ends (when a COMMIT or ROLLBACK terminates a unit of work). Together, the application ID and application sequence number uniquely identify a transaction.
Field Description
EMBARCADERO TECHNOLOGIES > EMBARCADERO PERFORMANCE CENTER 2.5 EXPERT GUIDE: SQL SERVER 135
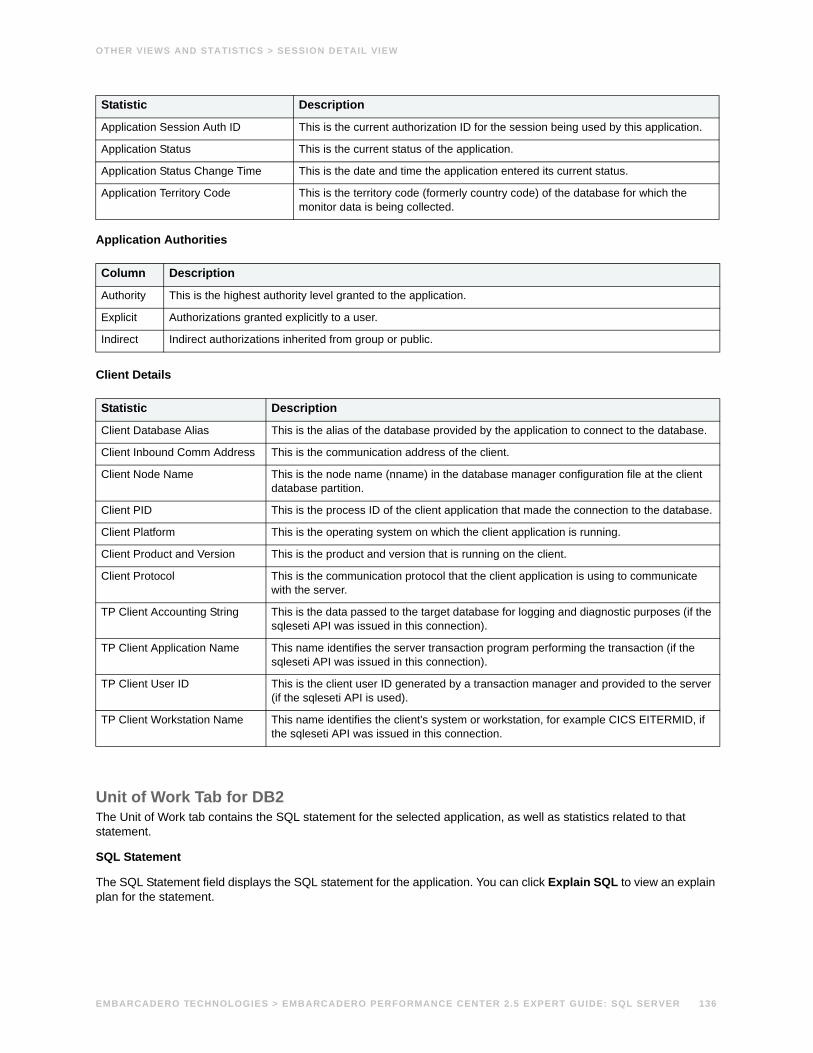
OTHER VIEWS AND STATISTICS > SESSION DETAIL VIEW
Application Authorities
Client Details
Unit of Work Tab for DB2The Unit of Work tab contains the SQL statement for the selected application, as well as statistics related to that statement.
SQL Statement
The SQL Statement field displays the SQL statement for the application. You can click Explain SQL to view an explain plan for the statement.
Application Session Auth ID This is the current authorization ID for the session being used by this application.
Application Status This is the current status of the application.
Application Status Change Time This is the date and time the application entered its current status.
Application Territory Code This is the territory code (formerly country code) of the database for which the monitor data is being collected.
Column Description
Authority This is the highest authority level granted to the application.
Explicit Authorizations granted explicitly to a user.
Indirect Indirect authorizations inherited from group or public.
Statistic Description
Client Database Alias This is the alias of the database provided by the application to connect to the database.
Client Inbound Comm Address This is the communication address of the client.
Client Node Name This is the node name (nname) in the database manager configuration file at the client database partition.
Client PID This is the process ID of the client application that made the connection to the database.
Client Platform This is the operating system on which the client application is running.
Client Product and Version This is the product and version that is running on the client.
Client Protocol This is the communication protocol that the client application is using to communicate with the server.
TP Client Accounting String This is the data passed to the target database for logging and diagnostic purposes (if the sqleseti API was issued in this connection).
TP Client Application Name This name identifies the server transaction program performing the transaction (if the sqleseti API was issued in this connection).
TP Client User ID This is the client user ID generated by a transaction manager and provided to the server (if the sqleseti API is used).
TP Client Workstation Name This name identifies the client's system or workstation, for example CICS EITERMID, if the sqleseti API was issued in this connection.
Statistic Description
EMBARCADERO TECHNOLOGIES > EMBARCADERO PERFORMANCE CENTER 2.5 EXPERT GUIDE: SQL SERVER 136
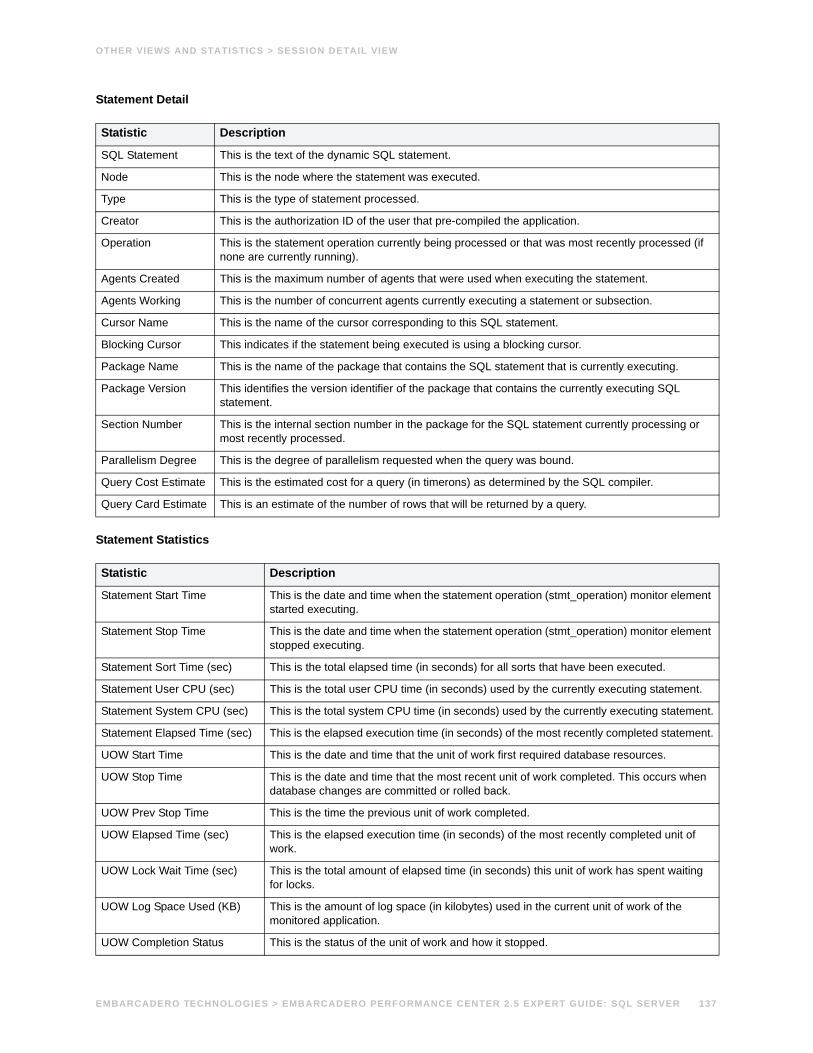
OTHER VIEWS AND STATISTICS > SESSION DETAIL VIEW
Statement Detail
Statement Statistics
Statistic Description
SQL Statement This is the text of the dynamic SQL statement.
Node This is the node where the statement was executed.
Type This is the type of statement processed.
Creator This is the authorization ID of the user that pre-compiled the application.
Operation This is the statement operation currently being processed or that was most recently processed (if none are currently running).
Agents Created This is the maximum number of agents that were used when executing the statement.
Agents Working This is the number of concurrent agents currently executing a statement or subsection.
Cursor Name This is the name of the cursor corresponding to this SQL statement.
Blocking Cursor This indicates if the statement being executed is using a blocking cursor.
Package Name This is the name of the package that contains the SQL statement that is currently executing.
Package Version This identifies the version identifier of the package that contains the currently executing SQL statement.
Section Number This is the internal section number in the package for the SQL statement currently processing or most recently processed.
Parallelism Degree This is the degree of parallelism requested when the query was bound.
Query Cost Estimate This is the estimated cost for a query (in timerons) as determined by the SQL compiler.
Query Card Estimate This is an estimate of the number of rows that will be returned by a query.
Statistic Description
Statement Start Time This is the date and time when the statement operation (stmt_operation) monitor element started executing.
Statement Stop Time This is the date and time when the statement operation (stmt_operation) monitor element stopped executing.
Statement Sort Time (sec) This is the total elapsed time (in seconds) for all sorts that have been executed.
Statement User CPU (sec) This is the total user CPU time (in seconds) used by the currently executing statement.
Statement System CPU (sec) This is the total system CPU time (in seconds) used by the currently executing statement.
Statement Elapsed Time (sec) This is the elapsed execution time (in seconds) of the most recently completed statement.
UOW Start Time This is the date and time that the unit of work first required database resources.
UOW Stop Time This is the date and time that the most recent unit of work completed. This occurs when database changes are committed or rolled back.
UOW Prev Stop Time This is the time the previous unit of work completed.
UOW Elapsed Time (sec) This is the elapsed execution time (in seconds) of the most recently completed unit of work.
UOW Lock Wait Time (sec) This is the total amount of elapsed time (in seconds) this unit of work has spent waiting for locks.
UOW Log Space Used (KB) This is the amount of log space (in kilobytes) used in the current unit of work of the monitored application.
UOW Completion Status This is the status of the unit of work and how it stopped.
EMBARCADERO TECHNOLOGIES > EMBARCADERO PERFORMANCE CENTER 2.5 EXPERT GUIDE: SQL SERVER 137
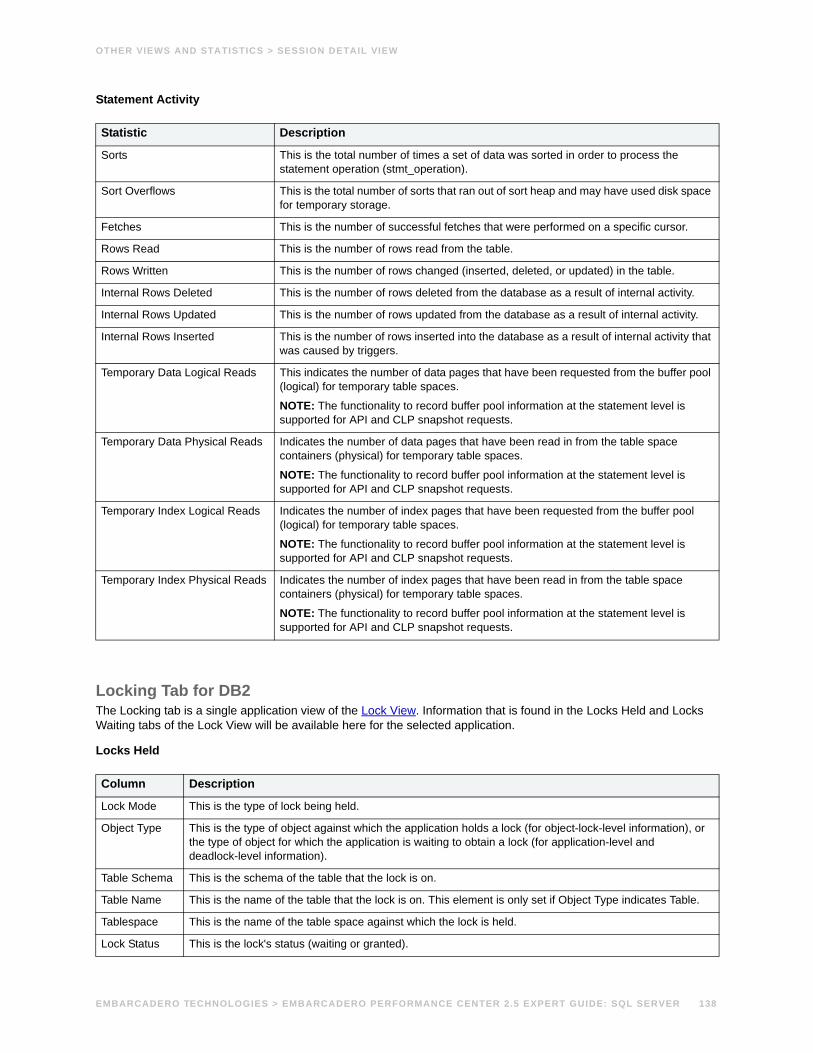
OTHER VIEWS AND STATISTICS > SESSION DETAIL VIEW
Statement Activity
Locking Tab for DB2The Locking tab is a single application view of the Lock View. Information that is found in the Locks Held and Locks Waiting tabs of the Lock View will be available here for the selected application.
Locks Held
Statistic Description
Sorts This is the total number of times a set of data was sorted in order to process the statement operation (stmt_operation).
Sort Overflows This is the total number of sorts that ran out of sort heap and may have used disk space for temporary storage.
Fetches This is the number of successful fetches that were performed on a specific cursor.
Rows Read This is the number of rows read from the table.
Rows Written This is the number of rows changed (inserted, deleted, or updated) in the table.
Internal Rows Deleted This is the number of rows deleted from the database as a result of internal activity.
Internal Rows Updated This is the number of rows updated from the database as a result of internal activity.
Internal Rows Inserted This is the number of rows inserted into the database as a result of internal activity that was caused by triggers.
Temporary Data Logical Reads This indicates the number of data pages that have been requested from the buffer pool (logical) for temporary table spaces.
NOTE: The functionality to record buffer pool information at the statement level is supported for API and CLP snapshot requests.
Temporary Data Physical Reads Indicates the number of data pages that have been read in from the table space containers (physical) for temporary table spaces.
NOTE: The functionality to record buffer pool information at the statement level is supported for API and CLP snapshot requests.
Temporary Index Logical Reads Indicates the number of index pages that have been requested from the buffer pool (logical) for temporary table spaces.
NOTE: The functionality to record buffer pool information at the statement level is supported for API and CLP snapshot requests.
Temporary Index Physical Reads Indicates the number of index pages that have been read in from the table space containers (physical) for temporary table spaces.
NOTE: The functionality to record buffer pool information at the statement level is supported for API and CLP snapshot requests.
Column Description
Lock Mode This is the type of lock being held.
Object Type This is the type of object against which the application holds a lock (for object-lock-level information), or the type of object for which the application is waiting to obtain a lock (for application-level and deadlock-level information).
Table Schema This is the schema of the table that the lock is on.
Table Name This is the name of the table that the lock is on. This element is only set if Object Type indicates Table.
Tablespace This is the name of the table space against which the lock is held.
Lock Status This is the lock's status (waiting or granted).
EMBARCADERO TECHNOLOGIES > EMBARCADERO PERFORMANCE CENTER 2.5 EXPERT GUIDE: SQL SERVER 138
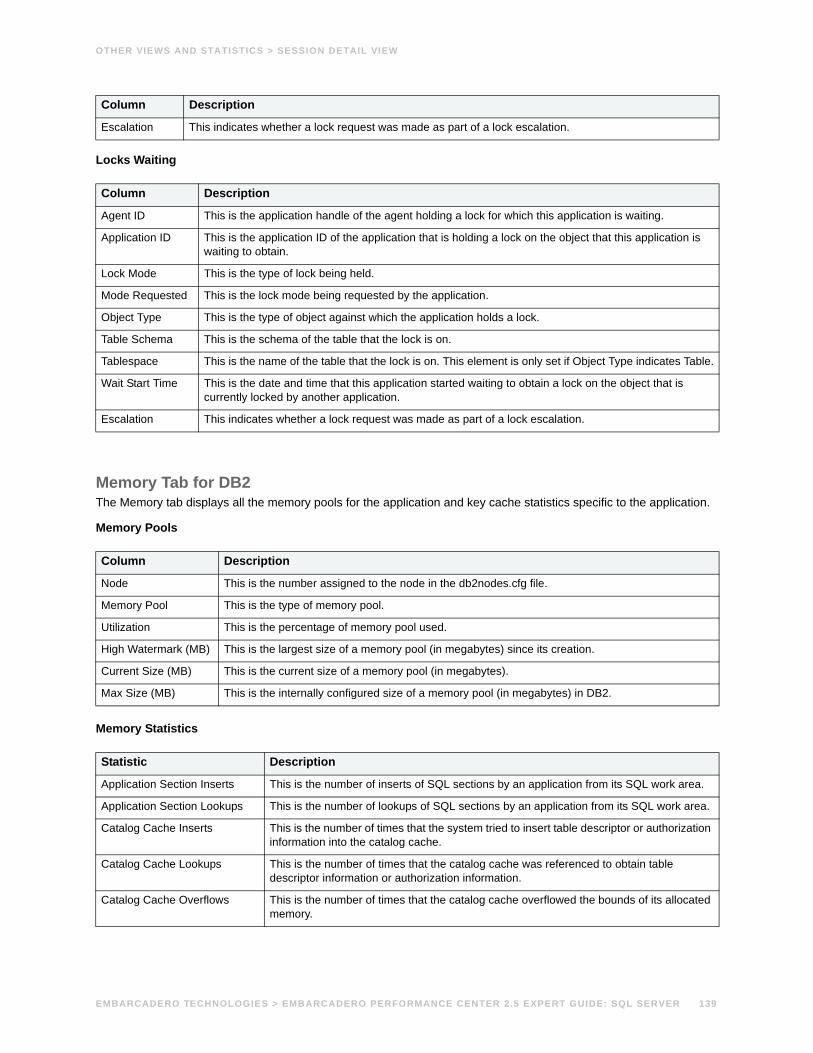
OTHER VIEWS AND STATISTICS > SESSION DETAIL VIEW
Locks Waiting
Memory Tab for DB2The Memory tab displays all the memory pools for the application and key cache statistics specific to the application.
Memory Pools
Memory Statistics
Escalation This indicates whether a lock request was made as part of a lock escalation.
Column Description
Agent ID This is the application handle of the agent holding a lock for which this application is waiting.
Application ID This is the application ID of the application that is holding a lock on the object that this application is waiting to obtain.
Lock Mode This is the type of lock being held.
Mode Requested This is the lock mode being requested by the application.
Object Type This is the type of object against which the application holds a lock.
Table Schema This is the schema of the table that the lock is on.
Tablespace This is the name of the table that the lock is on. This element is only set if Object Type indicates Table.
Wait Start Time This is the date and time that this application started waiting to obtain a lock on the object that is currently locked by another application.
Escalation This indicates whether a lock request was made as part of a lock escalation.
Column Description
Node This is the number assigned to the node in the db2nodes.cfg file.
Memory Pool This is the type of memory pool.
Utilization This is the percentage of memory pool used.
High Watermark (MB) This is the largest size of a memory pool (in megabytes) since its creation.
Current Size (MB) This is the current size of a memory pool (in megabytes).
Max Size (MB) This is the internally configured size of a memory pool (in megabytes) in DB2.
Statistic Description
Application Section Inserts This is the number of inserts of SQL sections by an application from its SQL work area.
Application Section Lookups This is the number of lookups of SQL sections by an application from its SQL work area.
Catalog Cache Inserts This is the number of times that the system tried to insert table descriptor or authorization information into the catalog cache.
Catalog Cache Lookups This is the number of times that the catalog cache was referenced to obtain table descriptor information or authorization information.
Catalog Cache Overflows This is the number of times that the catalog cache overflowed the bounds of its allocated memory.
Column Description
EMBARCADERO TECHNOLOGIES > EMBARCADERO PERFORMANCE CENTER 2.5 EXPERT GUIDE: SQL SERVER 139
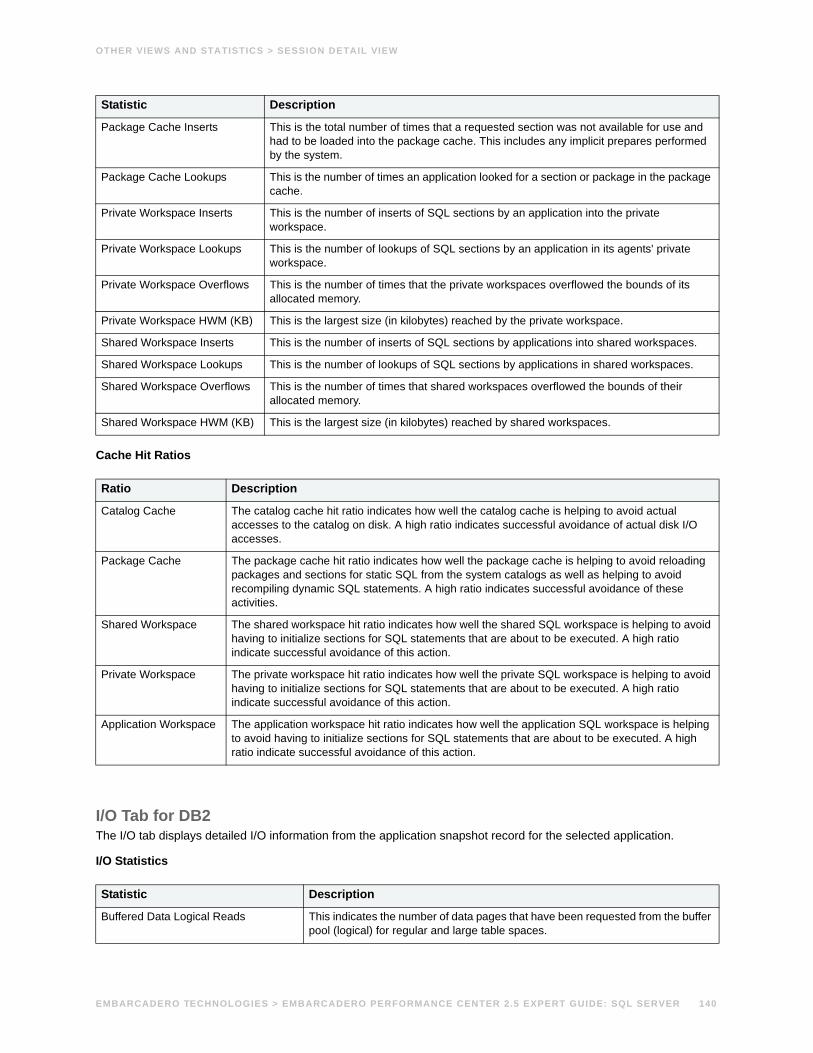
OTHER VIEWS AND STATISTICS > SESSION DETAIL VIEW
Cache Hit Ratios
I/O Tab for DB2The I/O tab displays detailed I/O information from the application snapshot record for the selected application.
I/O Statistics
Package Cache Inserts This is the total number of times that a requested section was not available for use and had to be loaded into the package cache. This includes any implicit prepares performed by the system.
Package Cache Lookups This is the number of times an application looked for a section or package in the package cache.
Private Workspace Inserts This is the number of inserts of SQL sections by an application into the private workspace.
Private Workspace Lookups This is the number of lookups of SQL sections by an application in its agents' private workspace.
Private Workspace Overflows This is the number of times that the private workspaces overflowed the bounds of its allocated memory.
Private Workspace HWM (KB) This is the largest size (in kilobytes) reached by the private workspace.
Shared Workspace Inserts This is the number of inserts of SQL sections by applications into shared workspaces.
Shared Workspace Lookups This is the number of lookups of SQL sections by applications in shared workspaces.
Shared Workspace Overflows This is the number of times that shared workspaces overflowed the bounds of their allocated memory.
Shared Workspace HWM (KB) This is the largest size (in kilobytes) reached by shared workspaces.
Ratio Description
Catalog Cache The catalog cache hit ratio indicates how well the catalog cache is helping to avoid actual accesses to the catalog on disk. A high ratio indicates successful avoidance of actual disk I/O accesses.
Package Cache The package cache hit ratio indicates how well the package cache is helping to avoid reloading packages and sections for static SQL from the system catalogs as well as helping to avoid recompiling dynamic SQL statements. A high ratio indicates successful avoidance of these activities.
Shared Workspace The shared workspace hit ratio indicates how well the shared SQL workspace is helping to avoid having to initialize sections for SQL statements that are about to be executed. A high ratio indicate successful avoidance of this action.
Private Workspace The private workspace hit ratio indicates how well the private SQL workspace is helping to avoid having to initialize sections for SQL statements that are about to be executed. A high ratio indicate successful avoidance of this action.
Application Workspace The application workspace hit ratio indicates how well the application SQL workspace is helping to avoid having to initialize sections for SQL statements that are about to be executed. A high ratio indicate successful avoidance of this action.
Statistic Description
Buffered Data Logical Reads This indicates the number of data pages that have been requested from the buffer pool (logical) for regular and large table spaces.
Statistic Description
EMBARCADERO TECHNOLOGIES > EMBARCADERO PERFORMANCE CENTER 2.5 EXPERT GUIDE: SQL SERVER 140
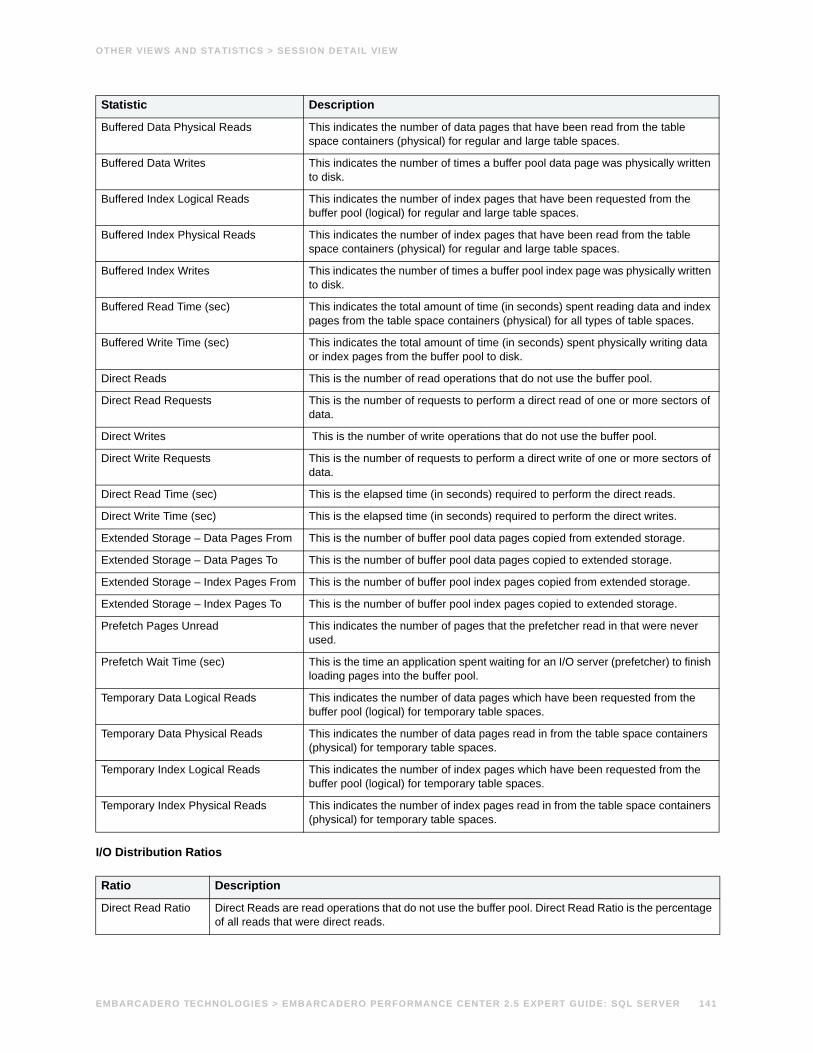
OTHER VIEWS AND STATISTICS > SESSION DETAIL VIEW
I/O Distribution Ratios
Buffered Data Physical Reads This indicates the number of data pages that have been read from the table space containers (physical) for regular and large table spaces.
Buffered Data Writes This indicates the number of times a buffer pool data page was physically written to disk.
Buffered Index Logical Reads This indicates the number of index pages that have been requested from the buffer pool (logical) for regular and large table spaces.
Buffered Index Physical Reads This indicates the number of index pages that have been read from the table space containers (physical) for regular and large table spaces.
Buffered Index Writes This indicates the number of times a buffer pool index page was physically written to disk.
Buffered Read Time (sec) This indicates the total amount of time (in seconds) spent reading data and index pages from the table space containers (physical) for all types of table spaces.
Buffered Write Time (sec) This indicates the total amount of time (in seconds) spent physically writing data or index pages from the buffer pool to disk.
Direct Reads This is the number of read operations that do not use the buffer pool.
Direct Read Requests This is the number of requests to perform a direct read of one or more sectors of data.
Direct Writes This is the number of write operations that do not use the buffer pool.
Direct Write Requests This is the number of requests to perform a direct write of one or more sectors of data.
Direct Read Time (sec) This is the elapsed time (in seconds) required to perform the direct reads.
Direct Write Time (sec) This is the elapsed time (in seconds) required to perform the direct writes.
Extended Storage – Data Pages From This is the number of buffer pool data pages copied from extended storage.
Extended Storage – Data Pages To This is the number of buffer pool data pages copied to extended storage.
Extended Storage – Index Pages From This is the number of buffer pool index pages copied from extended storage.
Extended Storage – Index Pages To This is the number of buffer pool index pages copied to extended storage.
Prefetch Pages Unread This indicates the number of pages that the prefetcher read in that were never used.
Prefetch Wait Time (sec) This is the time an application spent waiting for an I/O server (prefetcher) to finish loading pages into the buffer pool.
Temporary Data Logical Reads This indicates the number of data pages which have been requested from the buffer pool (logical) for temporary table spaces.
Temporary Data Physical Reads This indicates the number of data pages read in from the table space containers (physical) for temporary table spaces.
Temporary Index Logical Reads This indicates the number of index pages which have been requested from the buffer pool (logical) for temporary table spaces.
Temporary Index Physical Reads This indicates the number of index pages read in from the table space containers (physical) for temporary table spaces.
Ratio Description
Direct Read Ratio Direct Reads are read operations that do not use the buffer pool. Direct Read Ratio is the percentage of all reads that were direct reads.
Statistic Description
EMBARCADERO TECHNOLOGIES > EMBARCADERO PERFORMANCE CENTER 2.5 EXPERT GUIDE: SQL SERVER 141
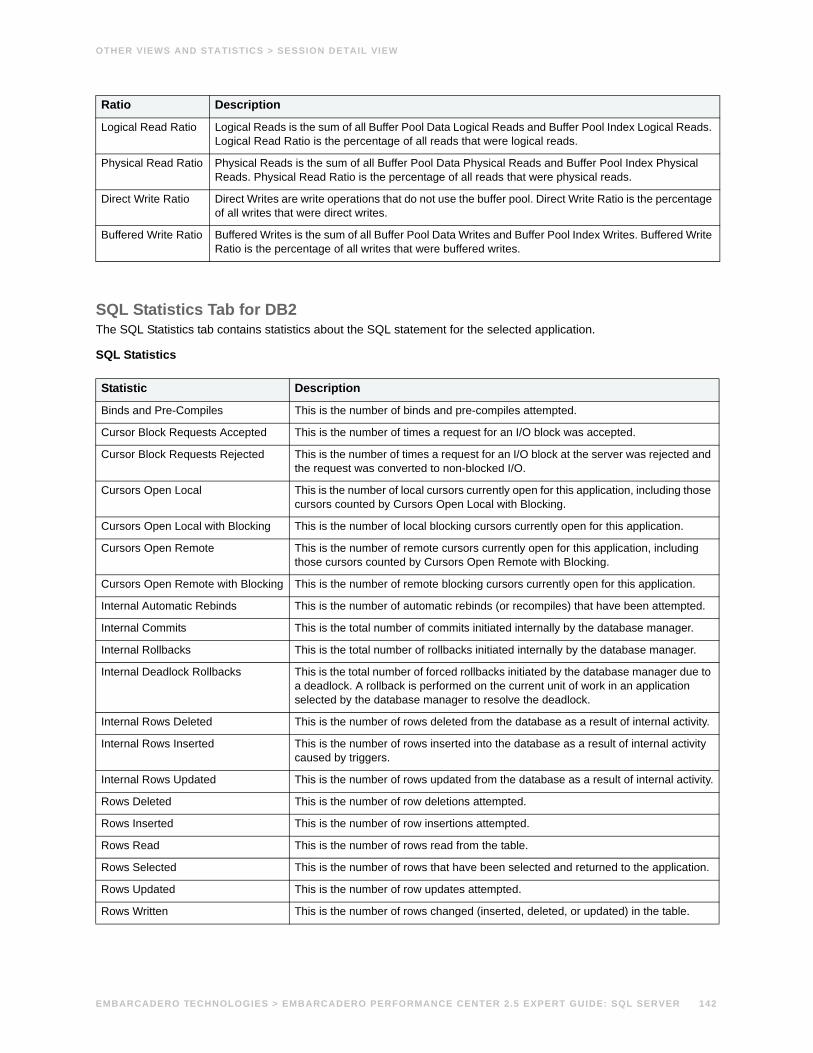
OTHER VIEWS AND STATISTICS > SESSION DETAIL VIEW
SQL Statistics Tab for DB2The SQL Statistics tab contains statistics about the SQL statement for the selected application.
SQL Statistics
Logical Read Ratio Logical Reads is the sum of all Buffer Pool Data Logical Reads and Buffer Pool Index Logical Reads. Logical Read Ratio is the percentage of all reads that were logical reads.
Physical Read Ratio Physical Reads is the sum of all Buffer Pool Data Physical Reads and Buffer Pool Index Physical Reads. Physical Read Ratio is the percentage of all reads that were physical reads.
Direct Write Ratio Direct Writes are write operations that do not use the buffer pool. Direct Write Ratio is the percentage of all writes that were direct writes.
Buffered Write Ratio Buffered Writes is the sum of all Buffer Pool Data Writes and Buffer Pool Index Writes. Buffered Write Ratio is the percentage of all writes that were buffered writes.
Statistic Description
Binds and Pre-Compiles This is the number of binds and pre-compiles attempted.
Cursor Block Requests Accepted This is the number of times a request for an I/O block was accepted.
Cursor Block Requests Rejected This is the number of times a request for an I/O block at the server was rejected and the request was converted to non-blocked I/O.
Cursors Open Local This is the number of local cursors currently open for this application, including those cursors counted by Cursors Open Local with Blocking.
Cursors Open Local with Blocking This is the number of local blocking cursors currently open for this application.
Cursors Open Remote This is the number of remote cursors currently open for this application, including those cursors counted by Cursors Open Remote with Blocking.
Cursors Open Remote with Blocking This is the number of remote blocking cursors currently open for this application.
Internal Automatic Rebinds This is the number of automatic rebinds (or recompiles) that have been attempted.
Internal Commits This is the total number of commits initiated internally by the database manager.
Internal Rollbacks This is the total number of rollbacks initiated internally by the database manager.
Internal Deadlock Rollbacks This is the total number of forced rollbacks initiated by the database manager due to a deadlock. A rollback is performed on the current unit of work in an application selected by the database manager to resolve the deadlock.
Internal Rows Deleted This is the number of rows deleted from the database as a result of internal activity.
Internal Rows Inserted This is the number of rows inserted into the database as a result of internal activity caused by triggers.
Internal Rows Updated This is the number of rows updated from the database as a result of internal activity.
Rows Deleted This is the number of row deletions attempted.
Rows Inserted This is the number of row insertions attempted.
Rows Read This is the number of rows read from the table.
Rows Selected This is the number of rows that have been selected and returned to the application.
Rows Updated This is the number of row updates attempted.
Rows Written This is the number of rows changed (inserted, deleted, or updated) in the table.
Ratio Description
EMBARCADERO TECHNOLOGIES > EMBARCADERO PERFORMANCE CENTER 2.5 EXPERT GUIDE: SQL SERVER 142
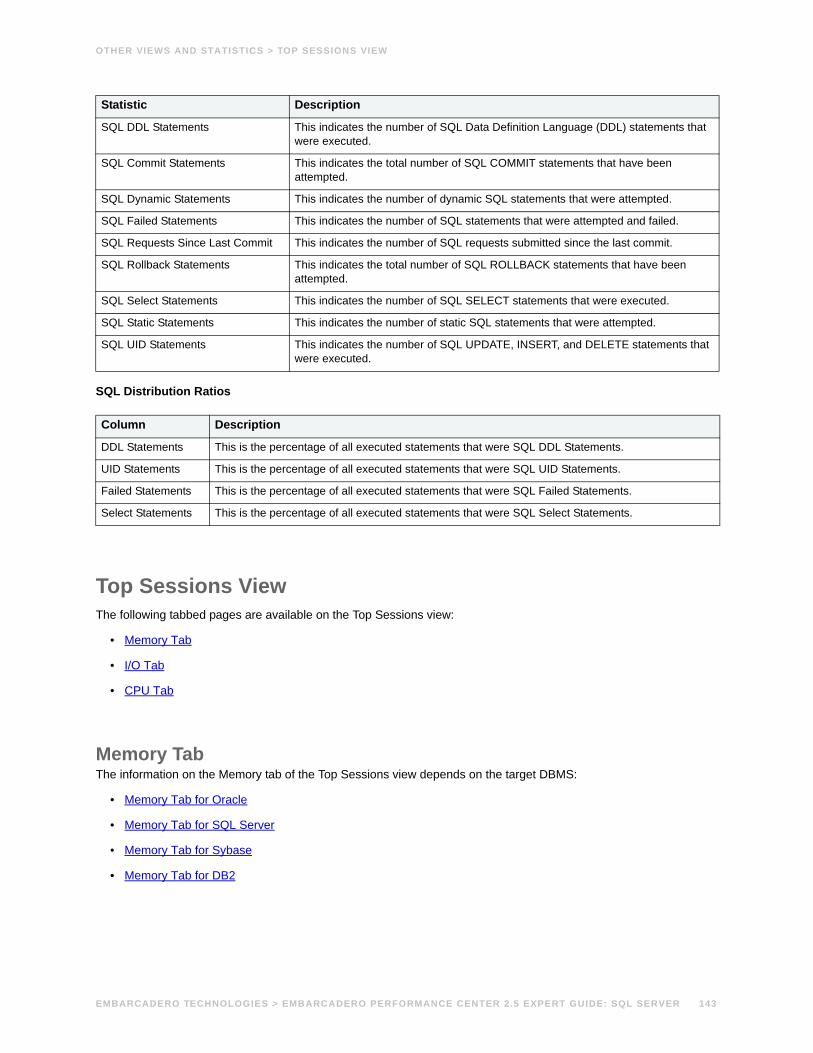
OTHER VIEWS AND STATISTICS > TOP SESSIONS VIEW
SQL Distribution Ratios
Top Sessions ViewThe following tabbed pages are available on the Top Sessions view:
• Memory Tab
• I/O Tab
• CPU Tab
Memory TabThe information on the Memory tab of the Top Sessions view depends on the target DBMS:
• Memory Tab for Oracle
• Memory Tab for SQL Server
• Memory Tab for Sybase
• Memory Tab for DB2
SQL DDL Statements This indicates the number of SQL Data Definition Language (DDL) statements that were executed.
SQL Commit Statements This indicates the total number of SQL COMMIT statements that have been attempted.
SQL Dynamic Statements This indicates the number of dynamic SQL statements that were attempted.
SQL Failed Statements This indicates the number of SQL statements that were attempted and failed.
SQL Requests Since Last Commit This indicates the number of SQL requests submitted since the last commit.
SQL Rollback Statements This indicates the total number of SQL ROLLBACK statements that have been attempted.
SQL Select Statements This indicates the number of SQL SELECT statements that were executed.
SQL Static Statements This indicates the number of static SQL statements that were attempted.
SQL UID Statements This indicates the number of SQL UPDATE, INSERT, and DELETE statements that were executed.
Column Description
DDL Statements This is the percentage of all executed statements that were SQL DDL Statements.
UID Statements This is the percentage of all executed statements that were SQL UID Statements.
Failed Statements This is the percentage of all executed statements that were SQL Failed Statements.
Select Statements This is the percentage of all executed statements that were SQL Select Statements.
Statistic Description
EMBARCADERO TECHNOLOGIES > EMBARCADERO PERFORMANCE CENTER 2.5 EXPERT GUIDE: SQL SERVER 143
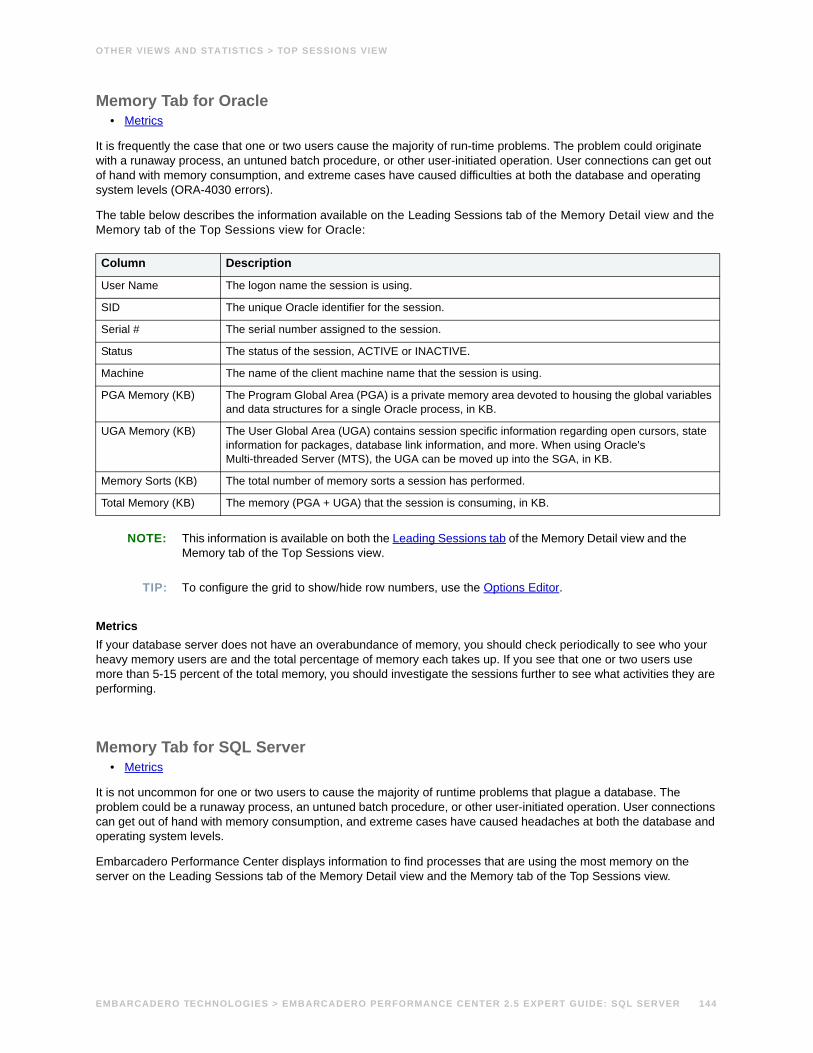
OTHER VIEWS AND STATISTICS > TOP SESSIONS VIEW
Memory Tab for Oracle• Metrics
It is frequently the case that one or two users cause the majority of run-time problems. The problem could originate with a runaway process, an untuned batch procedure, or other user-initiated operation. User connections can get out of hand with memory consumption, and extreme cases have caused difficulties at both the database and operating system levels (ORA-4030 errors).
The table below describes the information available on the Leading Sessions tab of the Memory Detail view and the Memory tab of the Top Sessions view for Oracle:
NOTE: This information is available on both the Leading Sessions tab of the Memory Detail view and the Memory tab of the Top Sessions view.
TIP: To configure the grid to show/hide row numbers, use the Options Editor.
MetricsIf your database server does not have an overabundance of memory, you should check periodically to see who your heavy memory users are and the total percentage of memory each takes up. If you see that one or two users use more than 5-15 percent of the total memory, you should investigate the sessions further to see what activities they are performing.
Memory Tab for SQL Server• Metrics
It is not uncommon for one or two users to cause the majority of runtime problems that plague a database. The problem could be a runaway process, an untuned batch procedure, or other user-initiated operation. User connections can get out of hand with memory consumption, and extreme cases have caused headaches at both the database and operating system levels.
Embarcadero Performance Center displays information to find processes that are using the most memory on the server on the Leading Sessions tab of the Memory Detail view and the Memory tab of the Top Sessions view.
Column Description
User Name The logon name the session is using.
SID The unique Oracle identifier for the session.
Serial # The serial number assigned to the session.
Status The status of the session, ACTIVE or INACTIVE.
Machine The name of the client machine name that the session is using.
PGA Memory (KB) The Program Global Area (PGA) is a private memory area devoted to housing the global variables and data structures for a single Oracle process, in KB.
UGA Memory (KB) The User Global Area (UGA) contains session specific information regarding open cursors, state information for packages, database link information, and more. When using Oracle's Multi-threaded Server (MTS), the UGA can be moved up into the SGA, in KB.
Memory Sorts (KB) The total number of memory sorts a session has performed.
Total Memory (KB) The memory (PGA + UGA) that the session is consuming, in KB.
EMBARCADERO TECHNOLOGIES > EMBARCADERO PERFORMANCE CENTER 2.5 EXPERT GUIDE: SQL SERVER 144
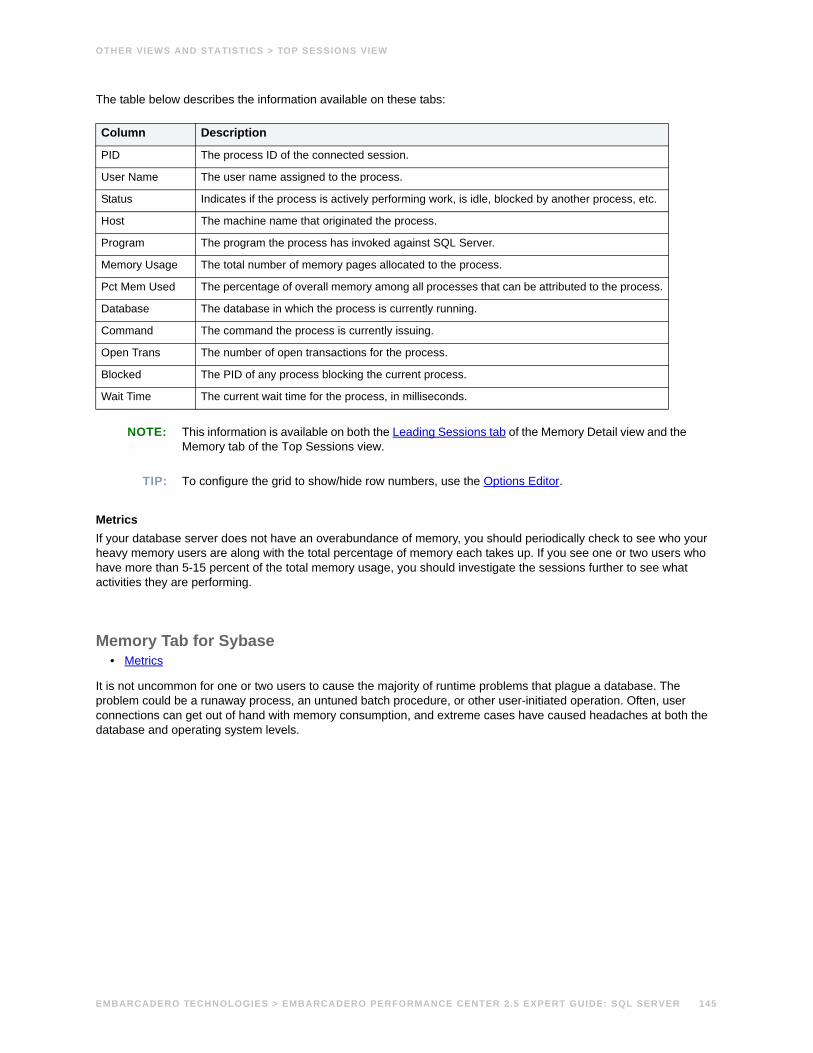
OTHER VIEWS AND STATISTICS > TOP SESSIONS VIEW
The table below describes the information available on these tabs:
NOTE: This information is available on both the Leading Sessions tab of the Memory Detail view and the Memory tab of the Top Sessions view.
TIP: To configure the grid to show/hide row numbers, use the Options Editor.
MetricsIf your database server does not have an overabundance of memory, you should periodically check to see who your heavy memory users are along with the total percentage of memory each takes up. If you see one or two users who have more than 5-15 percent of the total memory usage, you should investigate the sessions further to see what activities they are performing.
Memory Tab for Sybase• Metrics
It is not uncommon for one or two users to cause the majority of runtime problems that plague a database. The problem could be a runaway process, an untuned batch procedure, or other user-initiated operation. Often, user connections can get out of hand with memory consumption, and extreme cases have caused headaches at both the database and operating system levels.
Column Description
PID The process ID of the connected session.
User Name The user name assigned to the process.
Status Indicates if the process is actively performing work, is idle, blocked by another process, etc.
Host The machine name that originated the process.
Program The program the process has invoked against SQL Server.
Memory Usage The total number of memory pages allocated to the process.
Pct Mem Used The percentage of overall memory among all processes that can be attributed to the process.
Database The database in which the process is currently running.
Command The command the process is currently issuing.
Open Trans The number of open transactions for the process.
Blocked The PID of any process blocking the current process.
Wait Time The current wait time for the process, in milliseconds.
EMBARCADERO TECHNOLOGIES > EMBARCADERO PERFORMANCE CENTER 2.5 EXPERT GUIDE: SQL SERVER 145
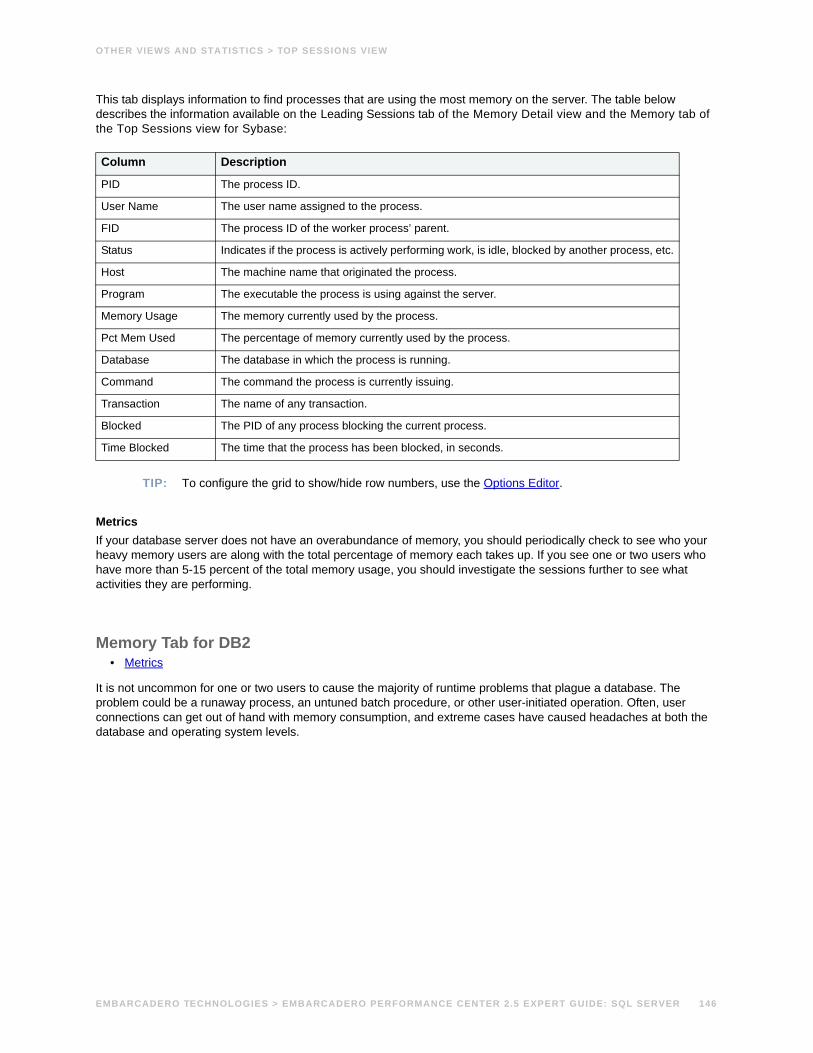
OTHER VIEWS AND STATISTICS > TOP SESSIONS VIEW
This tab displays information to find processes that are using the most memory on the server. The table below describes the information available on the Leading Sessions tab of the Memory Detail view and the Memory tab of the Top Sessions view for Sybase:
TIP: To configure the grid to show/hide row numbers, use the Options Editor.
MetricsIf your database server does not have an overabundance of memory, you should periodically check to see who your heavy memory users are along with the total percentage of memory each takes up. If you see one or two users who have more than 5-15 percent of the total memory usage, you should investigate the sessions further to see what activities they are performing.
Memory Tab for DB2• Metrics
It is not uncommon for one or two users to cause the majority of runtime problems that plague a database. The problem could be a runaway process, an untuned batch procedure, or other user-initiated operation. Often, user connections can get out of hand with memory consumption, and extreme cases have caused headaches at both the database and operating system levels.
Column Description
PID The process ID.
User Name The user name assigned to the process.
FID The process ID of the worker process’ parent.
Status Indicates if the process is actively performing work, is idle, blocked by another process, etc.
Host The machine name that originated the process.
Program The executable the process is using against the server.
Memory Usage The memory currently used by the process.
Pct Mem Used The percentage of memory currently used by the process.
Database The database in which the process is running.
Command The command the process is currently issuing.
Transaction The name of any transaction.
Blocked The PID of any process blocking the current process.
Time Blocked The time that the process has been blocked, in seconds.
EMBARCADERO TECHNOLOGIES > EMBARCADERO PERFORMANCE CENTER 2.5 EXPERT GUIDE: SQL SERVER 146
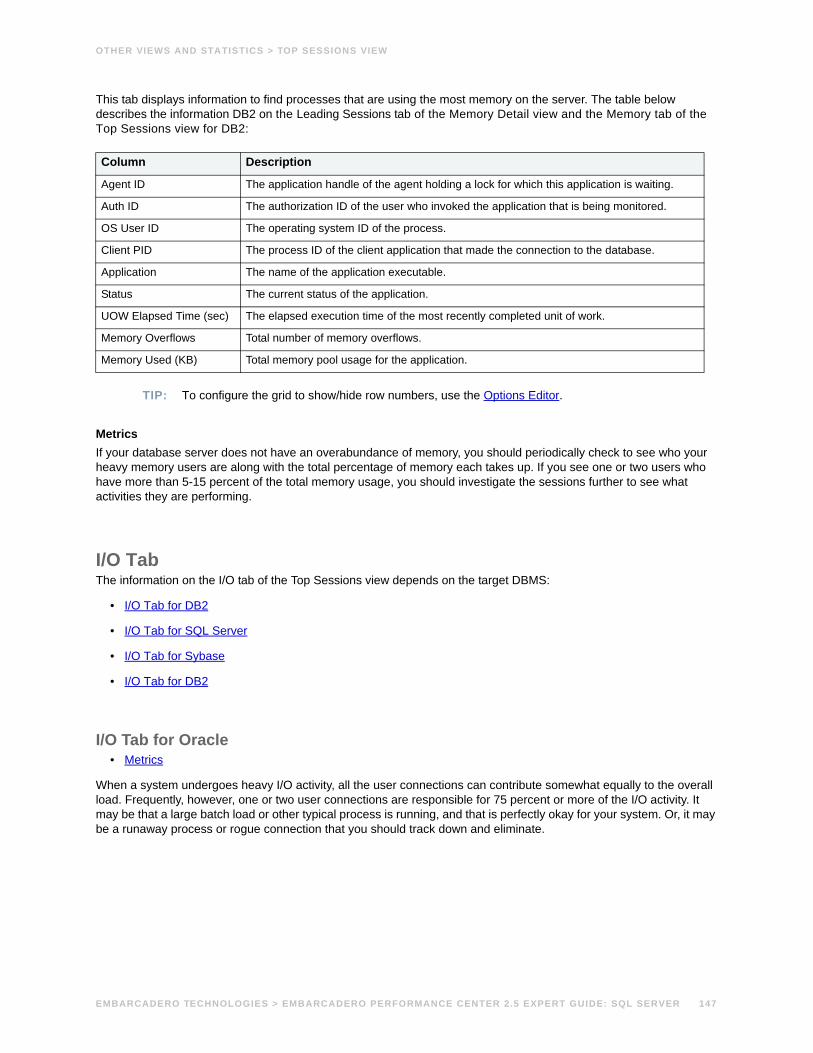
OTHER VIEWS AND STATISTICS > TOP SESSIONS VIEW
This tab displays information to find processes that are using the most memory on the server. The table below describes the information DB2 on the Leading Sessions tab of the Memory Detail view and the Memory tab of the Top Sessions view for DB2:
TIP: To configure the grid to show/hide row numbers, use the Options Editor.
MetricsIf your database server does not have an overabundance of memory, you should periodically check to see who your heavy memory users are along with the total percentage of memory each takes up. If you see one or two users who have more than 5-15 percent of the total memory usage, you should investigate the sessions further to see what activities they are performing.
I/O TabThe information on the I/O tab of the Top Sessions view depends on the target DBMS:
• I/O Tab for DB2
• I/O Tab for SQL Server
• I/O Tab for Sybase
• I/O Tab for DB2
I/O Tab for Oracle• Metrics
When a system undergoes heavy I/O activity, all the user connections can contribute somewhat equally to the overall load. Frequently, however, one or two user connections are responsible for 75 percent or more of the I/O activity. It may be that a large batch load or other typical process is running, and that is perfectly okay for your system. Or, it may be a runaway process or rogue connection that you should track down and eliminate.
Column Description
Agent ID The application handle of the agent holding a lock for which this application is waiting.
Auth ID The authorization ID of the user who invoked the application that is being monitored.
OS User ID The operating system ID of the process.
Client PID The process ID of the client application that made the connection to the database.
Application The name of the application executable.
Status The current status of the application.
UOW Elapsed Time (sec) The elapsed execution time of the most recently completed unit of work.
Memory Overflows Total number of memory overflows.
Memory Used (KB) Total memory pool usage for the application.
EMBARCADERO TECHNOLOGIES > EMBARCADERO PERFORMANCE CENTER 2.5 EXPERT GUIDE: SQL SERVER 147
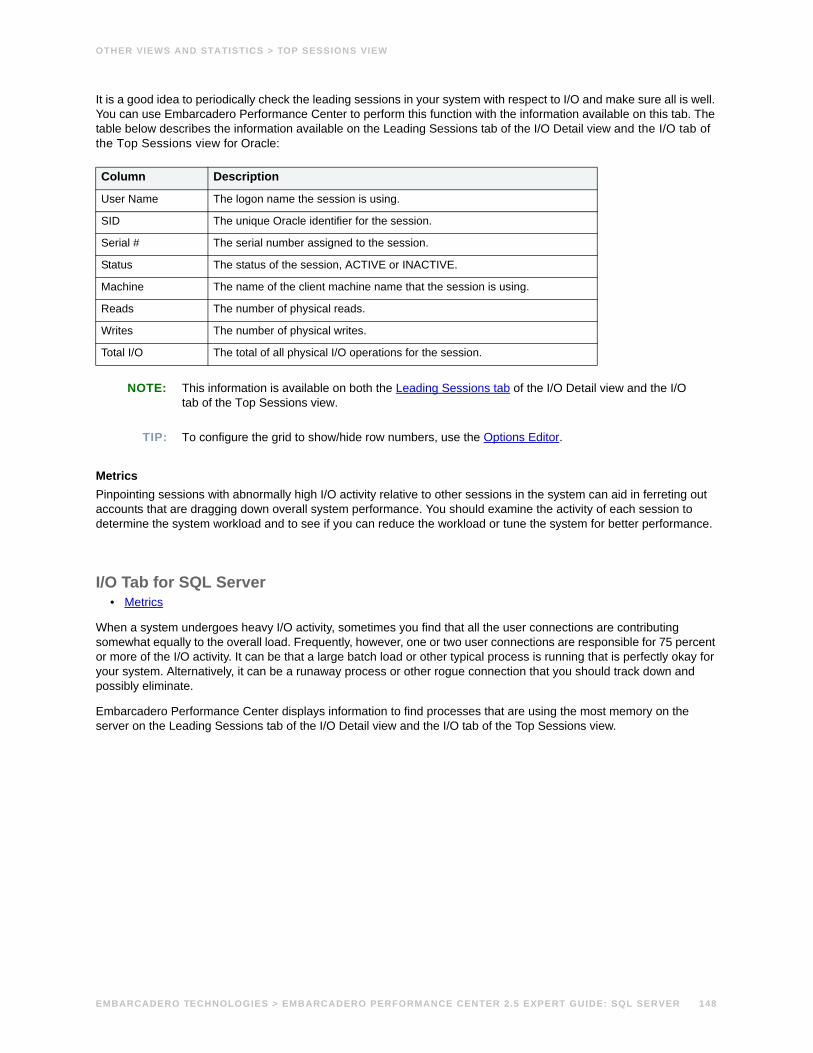
OTHER VIEWS AND STATISTICS > TOP SESSIONS VIEW
It is a good idea to periodically check the leading sessions in your system with respect to I/O and make sure all is well. You can use Embarcadero Performance Center to perform this function with the information available on this tab. The table below describes the information available on the Leading Sessions tab of the I/O Detail view and the I/O tab of the Top Sessions view for Oracle:
NOTE: This information is available on both the Leading Sessions tab of the I/O Detail view and the I/O tab of the Top Sessions view.
TIP: To configure the grid to show/hide row numbers, use the Options Editor.
MetricsPinpointing sessions with abnormally high I/O activity relative to other sessions in the system can aid in ferreting out accounts that are dragging down overall system performance. You should examine the activity of each session to determine the system workload and to see if you can reduce the workload or tune the system for better performance.
I/O Tab for SQL Server• Metrics
When a system undergoes heavy I/O activity, sometimes you find that all the user connections are contributing somewhat equally to the overall load. Frequently, however, one or two user connections are responsible for 75 percent or more of the I/O activity. It can be that a large batch load or other typical process is running that is perfectly okay for your system. Alternatively, it can be a runaway process or other rogue connection that you should track down and possibly eliminate.
Embarcadero Performance Center displays information to find processes that are using the most memory on the server on the Leading Sessions tab of the I/O Detail view and the I/O tab of the Top Sessions view.
Column Description
User Name The logon name the session is using.
SID The unique Oracle identifier for the session.
Serial # The serial number assigned to the session.
Status The status of the session, ACTIVE or INACTIVE.
Machine The name of the client machine name that the session is using.
Reads The number of physical reads.
Writes The number of physical writes.
Total I/O The total of all physical I/O operations for the session.
EMBARCADERO TECHNOLOGIES > EMBARCADERO PERFORMANCE CENTER 2.5 EXPERT GUIDE: SQL SERVER 148
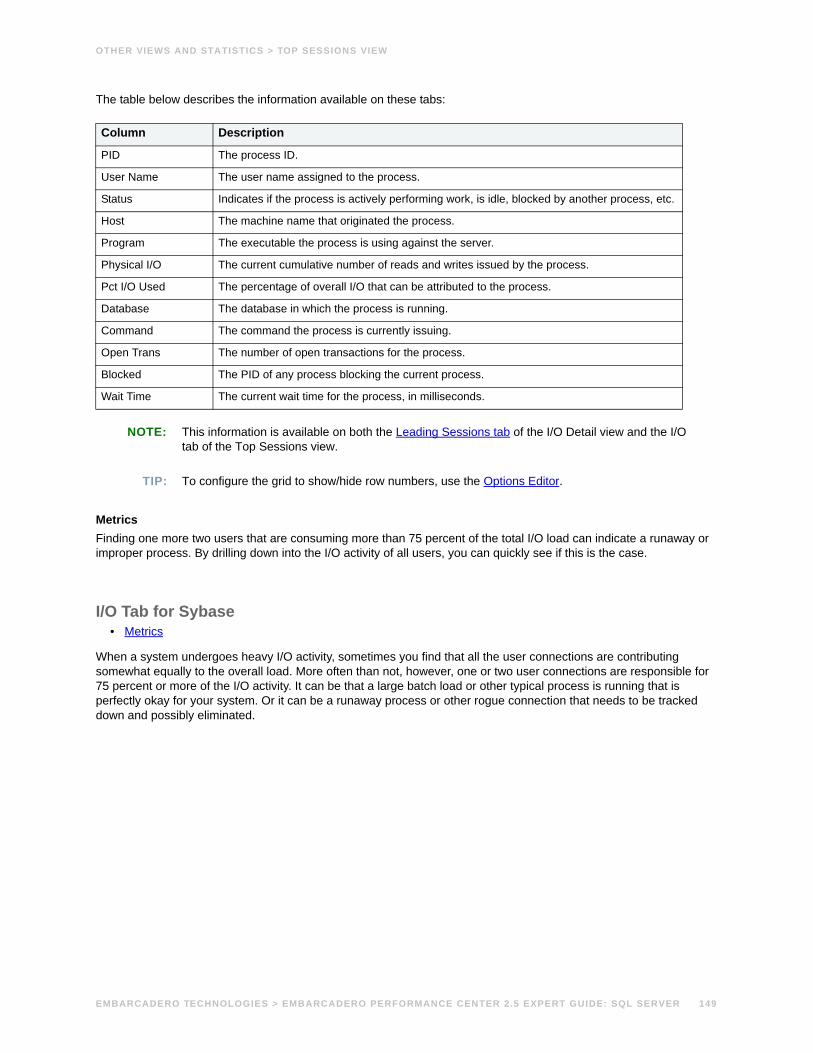
OTHER VIEWS AND STATISTICS > TOP SESSIONS VIEW
The table below describes the information available on these tabs:
NOTE: This information is available on both the Leading Sessions tab of the I/O Detail view and the I/O tab of the Top Sessions view.
TIP: To configure the grid to show/hide row numbers, use the Options Editor.
MetricsFinding one more two users that are consuming more than 75 percent of the total I/O load can indicate a runaway or improper process. By drilling down into the I/O activity of all users, you can quickly see if this is the case.
I/O Tab for Sybase• Metrics
When a system undergoes heavy I/O activity, sometimes you find that all the user connections are contributing somewhat equally to the overall load. More often than not, however, one or two user connections are responsible for 75 percent or more of the I/O activity. It can be that a large batch load or other typical process is running that is perfectly okay for your system. Or it can be a runaway process or other rogue connection that needs to be tracked down and possibly eliminated.
Column Description
PID The process ID.
User Name The user name assigned to the process.
Status Indicates if the process is actively performing work, is idle, blocked by another process, etc.
Host The machine name that originated the process.
Program The executable the process is using against the server.
Physical I/O The current cumulative number of reads and writes issued by the process.
Pct I/O Used The percentage of overall I/O that can be attributed to the process.
Database The database in which the process is running.
Command The command the process is currently issuing.
Open Trans The number of open transactions for the process.
Blocked The PID of any process blocking the current process.
Wait Time The current wait time for the process, in milliseconds.
EMBARCADERO TECHNOLOGIES > EMBARCADERO PERFORMANCE CENTER 2.5 EXPERT GUIDE: SQL SERVER 149
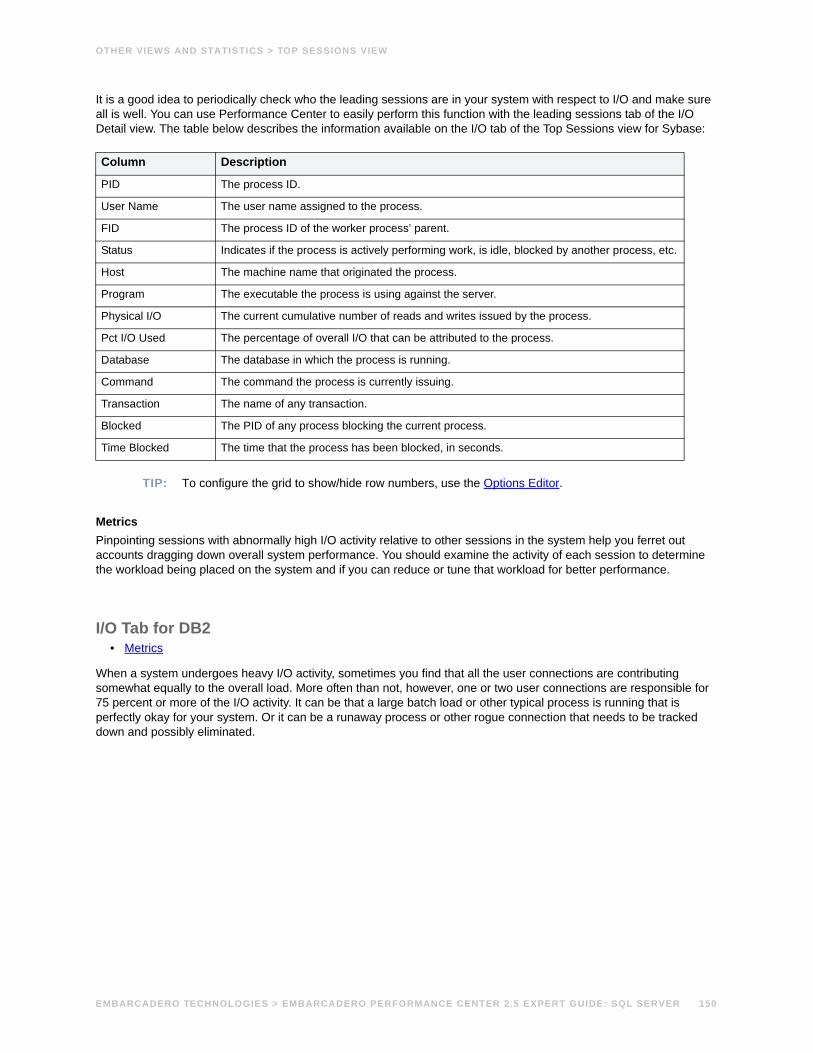
OTHER VIEWS AND STATISTICS > TOP SESSIONS VIEW
It is a good idea to periodically check who the leading sessions are in your system with respect to I/O and make sure all is well. You can use Performance Center to easily perform this function with the leading sessions tab of the I/O Detail view. The table below describes the information available on the I/O tab of the Top Sessions view for Sybase:
TIP: To configure the grid to show/hide row numbers, use the Options Editor.
MetricsPinpointing sessions with abnormally high I/O activity relative to other sessions in the system help you ferret out accounts dragging down overall system performance. You should examine the activity of each session to determine the workload being placed on the system and if you can reduce or tune that workload for better performance.
I/O Tab for DB2• Metrics
When a system undergoes heavy I/O activity, sometimes you find that all the user connections are contributing somewhat equally to the overall load. More often than not, however, one or two user connections are responsible for 75 percent or more of the I/O activity. It can be that a large batch load or other typical process is running that is perfectly okay for your system. Or it can be a runaway process or other rogue connection that needs to be tracked down and possibly eliminated.
Column Description
PID The process ID.
User Name The user name assigned to the process.
FID The process ID of the worker process’ parent.
Status Indicates if the process is actively performing work, is idle, blocked by another process, etc.
Host The machine name that originated the process.
Program The executable the process is using against the server.
Physical I/O The current cumulative number of reads and writes issued by the process.
Pct I/O Used The percentage of overall I/O that can be attributed to the process.
Database The database in which the process is running.
Command The command the process is currently issuing.
Transaction The name of any transaction.
Blocked The PID of any process blocking the current process.
Time Blocked The time that the process has been blocked, in seconds.
EMBARCADERO TECHNOLOGIES > EMBARCADERO PERFORMANCE CENTER 2.5 EXPERT GUIDE: SQL SERVER 150
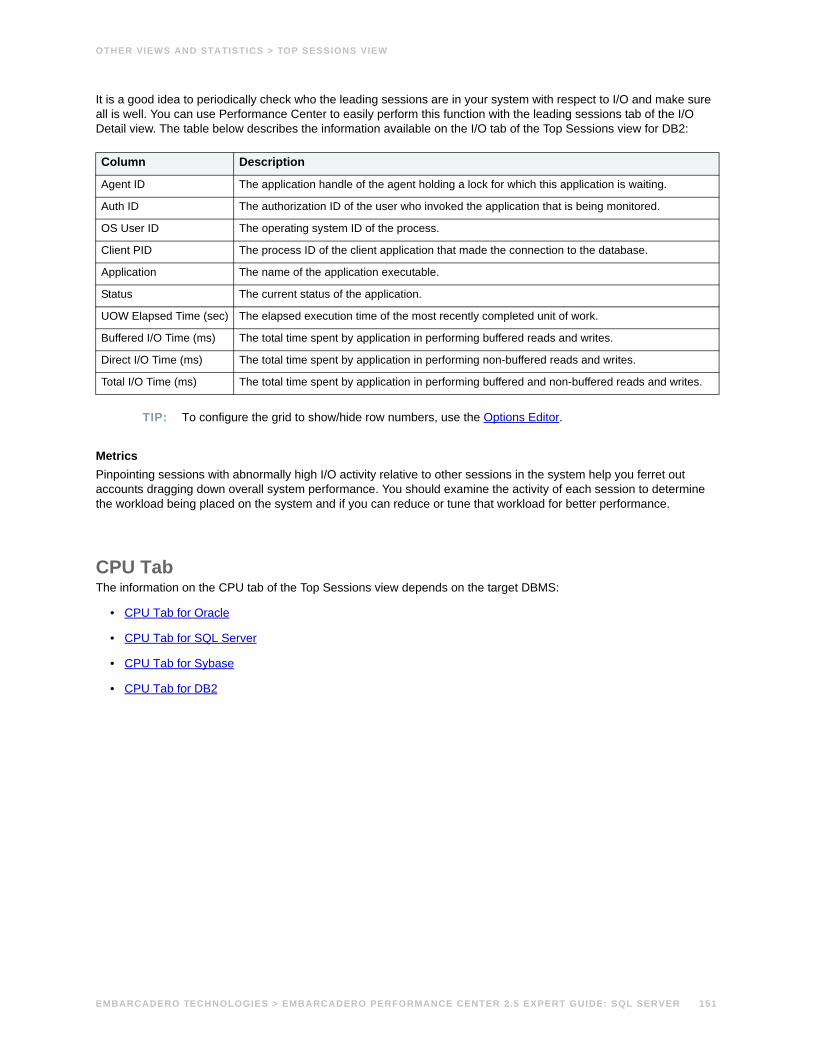
OTHER VIEWS AND STATISTICS > TOP SESSIONS VIEW
It is a good idea to periodically check who the leading sessions are in your system with respect to I/O and make sure all is well. You can use Performance Center to easily perform this function with the leading sessions tab of the I/O Detail view. The table below describes the information available on the I/O tab of the Top Sessions view for DB2:
TIP: To configure the grid to show/hide row numbers, use the Options Editor.
MetricsPinpointing sessions with abnormally high I/O activity relative to other sessions in the system help you ferret out accounts dragging down overall system performance. You should examine the activity of each session to determine the workload being placed on the system and if you can reduce or tune that workload for better performance.
CPU TabThe information on the CPU tab of the Top Sessions view depends on the target DBMS:
• CPU Tab for Oracle
• CPU Tab for SQL Server
• CPU Tab for Sybase
• CPU Tab for DB2
Column Description
Agent ID The application handle of the agent holding a lock for which this application is waiting.
Auth ID The authorization ID of the user who invoked the application that is being monitored.
OS User ID The operating system ID of the process.
Client PID The process ID of the client application that made the connection to the database.
Application The name of the application executable.
Status The current status of the application.
UOW Elapsed Time (sec) The elapsed execution time of the most recently completed unit of work.
Buffered I/O Time (ms) The total time spent by application in performing buffered reads and writes.
Direct I/O Time (ms) The total time spent by application in performing non-buffered reads and writes.
Total I/O Time (ms) The total time spent by application in performing buffered and non-buffered reads and writes.
EMBARCADERO TECHNOLOGIES > EMBARCADERO PERFORMANCE CENTER 2.5 EXPERT GUIDE: SQL SERVER 151
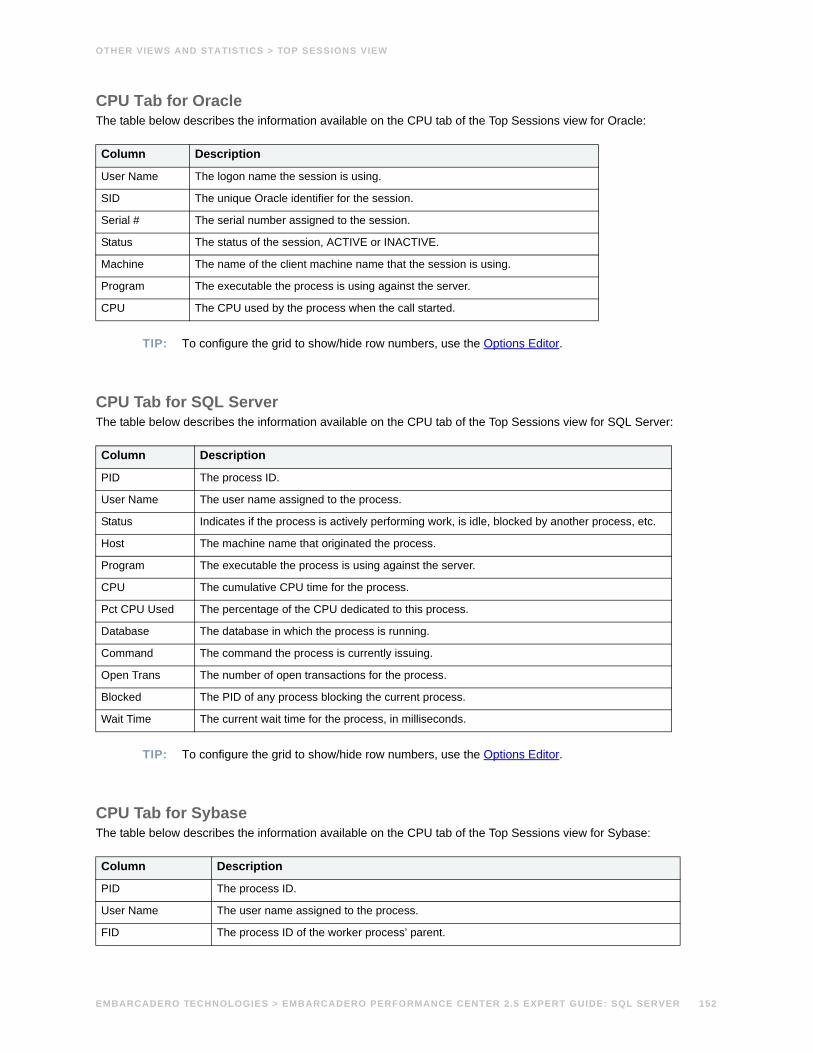
OTHER VIEWS AND STATISTICS > TOP SESSIONS VIEW
CPU Tab for OracleThe table below describes the information available on the CPU tab of the Top Sessions view for Oracle:
TIP: To configure the grid to show/hide row numbers, use the Options Editor.
CPU Tab for SQL ServerThe table below describes the information available on the CPU tab of the Top Sessions view for SQL Server:
TIP: To configure the grid to show/hide row numbers, use the Options Editor.
CPU Tab for SybaseThe table below describes the information available on the CPU tab of the Top Sessions view for Sybase:
Column Description
User Name The logon name the session is using.
SID The unique Oracle identifier for the session.
Serial # The serial number assigned to the session.
Status The status of the session, ACTIVE or INACTIVE.
Machine The name of the client machine name that the session is using.
Program The executable the process is using against the server.
CPU The CPU used by the process when the call started.
Column Description
PID The process ID.
User Name The user name assigned to the process.
Status Indicates if the process is actively performing work, is idle, blocked by another process, etc.
Host The machine name that originated the process.
Program The executable the process is using against the server.
CPU The cumulative CPU time for the process.
Pct CPU Used The percentage of the CPU dedicated to this process.
Database The database in which the process is running.
Command The command the process is currently issuing.
Open Trans The number of open transactions for the process.
Blocked The PID of any process blocking the current process.
Wait Time The current wait time for the process, in milliseconds.
Column Description
PID The process ID.
User Name The user name assigned to the process.
FID The process ID of the worker process’ parent.
EMBARCADERO TECHNOLOGIES > EMBARCADERO PERFORMANCE CENTER 2.5 EXPERT GUIDE: SQL SERVER 152
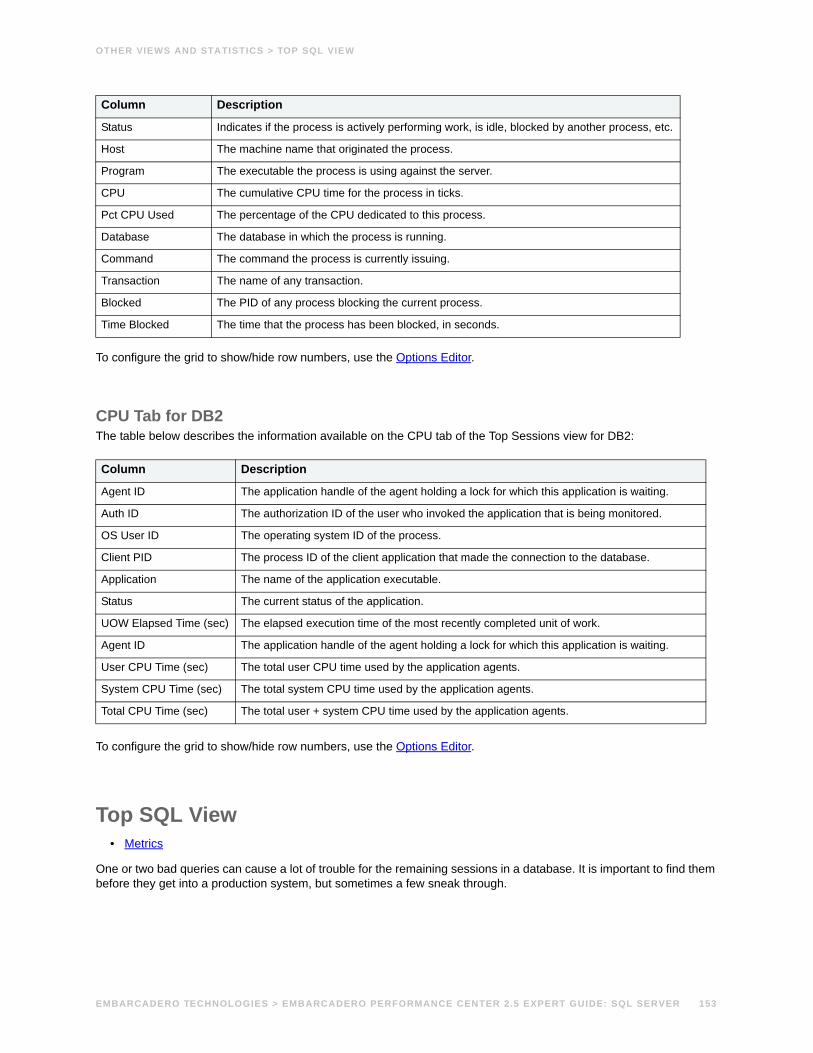
OTHER VIEWS AND STATISTICS > TOP SQL VIEW
To configure the grid to show/hide row numbers, use the Options Editor.
CPU Tab for DB2The table below describes the information available on the CPU tab of the Top Sessions view for DB2:
To configure the grid to show/hide row numbers, use the Options Editor.
Top SQL View• Metrics
One or two bad queries can cause a lot of trouble for the remaining sessions in a database. It is important to find them before they get into a production system, but sometimes a few sneak through.
Status Indicates if the process is actively performing work, is idle, blocked by another process, etc.
Host The machine name that originated the process.
Program The executable the process is using against the server.
CPU The cumulative CPU time for the process in ticks.
Pct CPU Used The percentage of the CPU dedicated to this process.
Database The database in which the process is running.
Command The command the process is currently issuing.
Transaction The name of any transaction.
Blocked The PID of any process blocking the current process.
Time Blocked The time that the process has been blocked, in seconds.
Column Description
Agent ID The application handle of the agent holding a lock for which this application is waiting.
Auth ID The authorization ID of the user who invoked the application that is being monitored.
OS User ID The operating system ID of the process.
Client PID The process ID of the client application that made the connection to the database.
Application The name of the application executable.
Status The current status of the application.
UOW Elapsed Time (sec) The elapsed execution time of the most recently completed unit of work.
Agent ID The application handle of the agent holding a lock for which this application is waiting.
User CPU Time (sec) The total user CPU time used by the application agents.
System CPU Time (sec) The total system CPU time used by the application agents.
Total CPU Time (sec) The total user + system CPU time used by the application agents.
Column Description
EMBARCADERO TECHNOLOGIES > EMBARCADERO PERFORMANCE CENTER 2.5 EXPERT GUIDE: SQL SERVER 153
OTHER VIEWS AND STATISTICS > TOP SQL VIEW
By applying custom filters and performance-related thresholds, the Top SQL view locates inefficient SQL. By applying filters to certain I/O and statistical counters, you hope to isolate queries that far exceed their nearest competitors in the same area (like disk reads). When you find them, you should reduce the number of sorts a query performs. Or, for a query that returns only a few records, you should try to minimize the number of rows a query processes.
The Top SQL view displays requested SQL for SQL Server, Oracle, DB2, and Sybase datasources.
MetricsWhen you begin to look for inefficient SQL in a database, there are two primary questions you need to answer:
1 What has been the worst SQL that has historically been run in my database?
2 What is the worst SQL that’s running right now in my database?
When troubleshooting a slow system, you should be on the lookout for any query that shows an execution count that is significantly larger than any other query on the system. It may be that the query is in an inefficient Transact SQL loop, or other problematic programming construct. Only by bringing the query to the attention of the application developers will you know if the query is being mishandled from a programming standpoint.
EMBARCADERO TECHNOLOGIES > EMBARCADERO PERFORMANCE CENTER 2.5 EXPERT GUIDE: SQL SERVER 154
>
Symbols% Privileged Time 85, 113% User Time 85, 113
AActive Connections 19
SQL Server 48Active Transactions 48Ad Hoc SQL Hit Ratio 13, 22Agent Information 72AIX 77, 105All Locks Tab
Oracle 96SQL Server 54, 96Sybase 97
All User Locks Tab 98Archive View 93Auto-Param Attempts 50Available Paged Memory 81, 110Available Physical Memory 81, 109Available Swap Memory 82, 110Average Disk Queue 87, 116Average Disk Queue Length 80, 108
BBackup/Restore Throughput 37Backup/Restore T-Put 37Backups Tab 71Blocked Users
SQL Server 56Blocking Lock Detail 62Blocking Lock Summary 62Blocking Locks Tab
Oracle 99SQL Server 54, 61, 100Sybase 101
Blocks Input/Sec 88, 116Blocks Output/Sec 88, 116Bottleneck Analysis
OS 78, 106Buffer Cache 24Buffer Cache Hit Ratio
SQL Server 12, 21Buffer Cache Tab 26Buffer Cache Usage 25Buffer Size 90, 118Bulk Copy Rows 37Bulk Copy Throughput 37Bytes per I/O Operation 87, 116Bytes Reads 38Bytes Written 38
CCache Efficiency 90, 118Cache Size 90, 118Clock Algorithm Scans 90, 118Contention
Number of Deadlocks 57Contention Detail View
SQL Server 59Contention Health Index 94Context Switches/Sec 85, 114
EMBARCADERO TECHNOLOGIES > EMBARCADERO PERFORMANCE CENTER 2.5 EXPERT GUIDE: SQL SERVER 1
>
Copy Read Hits % 90, 118CPU Busy 59CPU Events 85, 113CPU Tab 84, 112CPU Utilization 84, 113Current Locks
SQL Server 19
DData Map Hits % 90, 118Database Detail 69Database Detail View
Table Details 73Database Home Page 63Database I/O Tab 36Database Overview
SQL Server 40Database Reads 38Database Summary
SQL Server 68Database Writes 38Databases 64Databases Low on Space 17Databases Needing Backup 66Databases Without Auto-Create Stats 68Databases Without Auto-Grow 66Databases Without Auto-Update Statistics 67Datasource Health Index 94DBCC Logical Scans 36Deadlocks 16Device Detail 91, 120Device Summary 91, 120Disk Analysis
OS 78, 106Disk Free Space 40Disk I/O Time 87, 116Disk Space Tab 45Disk Summary By Database 46Disk Summary By Space 46Disk Time 79, 107Disk Transfers/Sec 87, 116
EErrors in Current Log 64Extent Deallocations 36Extents Allocated 36
FFailed Auto-Param Attempts 50File Group Summary 42File Groups 65File Groups/Files Tab 42File I/O Tab 38File Summary 42Files 64Forwarded Record Fetches 34Forwarded Records 37Fragmentation Tab
SQL Server 44Free Disk Space 83, 111Freespace Scans 36Full Scans 32, 37
EMBARCADERO TECHNOLOGIES > EMBARCADERO PERFORMANCE CENTER 2.5 EXPERT GUIDE: SQL SERVER 2
>
HHealth Index View 94HIDD_OS_PC_TOPMEMPROC_ORA 111Home View Statistics 11
SQL ServerContention Vital Signs 15I/O Vital Signs 14Memory Vital Signs 12Network Vital Signs 20Space Vital Signs 17Users Vital Signs 18
Hot Objects View 94Hot Code Tab 95Hot Tables Tab 94
HP-UX 77, 105
II/O Busy 59I/O Detail 35I/O Details 87, 115I/O Errors 15, 35I/O Home Page 28I/O Stall 38I/O Tab 147Inactive Connections
SQL Server 48Inbound Packet Errors 120Inbound Packets Discarded 92, 120Index Details Tab 72Index Reserved 42Index Searches 33, 37Indexes Tab 44INET Address 92, 120Interrupts/Sec 85, 113
KKey Resource Usage
OS 77, 106
LLast Full Backup 69Latch Waits 16
SQL Server 57Leading Sessions Tab
SQL ServerI/O 39Memory 28
Linux 77, 105Load Average 79, 107Load Averages 86, 114Local Filesystem 91Lock Detail 61Lock Overview 58Lock Summary 60Lock Timeouts 16Locks Tab
SQL Server 60Locks View 95
All Locks Tab 96All User Locks Tab 98Blocking Locks Tab 99
Locks View for DB2 102
EMBARCADERO TECHNOLOGIES > EMBARCADERO PERFORMANCE CENTER 2.5 EXPERT GUIDE: SQL SERVER 3
>
Log Cache Hit Ratio 13Log Cache Reads 27, 37Log Cache Tab 27Log Flush Wait Time 27Log Flush Waits 27, 58Log Flushes 14, 27, 37Log Growths 27, 37Log Overview
SQL Server 41Log Shrinks 27, 37Log Truncation 37Logins 20Logouts 20Logs Low on Space 18Logs Without Auto-Grow 67
MMDL Read Hits % 90, 118Memory Analysis
OS 78, 106Memory Available 90, 118Memory Detail 26Memory Freed 90, 118Memory Health Index 94Memory Home Page 21Memory Tab 87, 116, 144Memory Usage 23Mounted On 91
NNetwork Bytes Read 76Network Bytes Written 76Network Details 91, 120Network I/O Wait Requests 76Network I/O Wait Time 77Network Performance Category View
Statistics 74Network Queue Length 81, 109Network Reads 75Network Writes 75Number of Logins 84, 112Number of Processes 84, 112
OObjects Accessed 122Objects Health Index 94Offline Databases 66Operating System Statistics 77, 105Operating System View 104OS Detail 84, 112OS Drill Down 84, 112OS Statistics 77, 105OS View
Processor 79, 107Processor Speed 78, 107
Outbound Packet Errors 92, 120Outbound Packets Discarded 92, 120Overview Tab 69
PPacket Collisions 92, 120Packet Discard 92, 120Packet Discards 92, 120
EMBARCADERO TECHNOLOGIES > EMBARCADERO PERFORMANCE CENTER 2.5 EXPERT GUIDE: SQL SERVER 4
>
Packet Errors 76, 92, 120Packets Received 20, 75Packets Received/Sec 92, 120Packets Sent 20, 75Packets Sent/Sec 92, 120Page Deadlocks 56Page Faults/Sec 80, 108Page Reads 29Page Replacements 90, 118Page Splits 36Paged In 88, 116Paged Memory Used 79, 107Paged Out 88, 116Pages Input/Sec 88, 116Pages Output/Sec 88, 116Paging Activity 88, 116Partition 91, 119Performance Analyst for Microsoft Statistics 11
Database PageDatabase Detail
Backups Tab 71SQL Agent Tab
SQL Server Alert Summary 71SQL Server Job Summary 70
I/O PageTotal I/O 35
Memory PageMemory Detail 26
Users PageActive Transactions 48
Performance Analyst for Oracle StatisticsOS Page 77, 105
Available Paged Memory 81, 110Available Physical Memory 81, 109Available Swap Memory 82, 110Average Disk Queue Length 80, 108Disk Time 79, 107Free Disk Space 83, 111Load Average 79, 107Network Output Queue Length 81, 109Network Queue Length 81, 109Number of Logins 84, 112Number of Processes 84, 112OS Detail 84
CPU Tab 84, 112CPU Events 85CPU Events Context Switches/Sec 85, 114CPU Events Interrupts/Sec 85, 113CPU Events System Calls/Sec 86CPU Utilization 84, 113CPU Utilization % Privileged Time 85, 113CPU Utilization % User Time 85, 113Load Averages 86Processor Queue Length 86, 114
I/O Tab 87, 115Average Disk Queue 87
EMBARCADERO TECHNOLOGIES > EMBARCADERO PERFORMANCE CENTER 2.5 EXPERT GUIDE: SQL SERVER 5
>
Bytes per I/O Operation 87Disk I/O Time 87Total Disk Queue 87Transfer Rate 87
Memory Tab 87, 116Buffer Size 90Cache Efficiency 90, 118Cache Efficiency Copy Read Hits % 90, 118Cache Efficiency Data Map Hits % 90, 118Cache Efficiency MDL Read Hits % 90, 118Cache Efficiency Pin Read Hits % 91, 119Cache Size 90Memory Available 90Page Replacements 90Page Replacements Clock Algorithm Scans (Pages/sec) 90Page Replacements Memory Freed (Pages/sec) 90Paging Activity 88, 116Paging Activity Blocks Output/Sec 88Paging Activity Paged In 88Paging Activity Paged Out 88Paging Activity Pages Input/Sec 88, 116Paging Activity Pages Output/Sec 88, 116
Network Tab 91, 120Inbound Packet Errors 92Network Details 91Outbound Packet Errors 92Packet Collisions 92Packet Discards 92Packet Discards Inbound Packets Discarded 92Packet Discards Outbound Packets Discarded 92Packet Errors 92Transmission Queue Length 92Transmission Rate 92Transmission Rate (Bytes) 92Transmission Rate Packets Received/Sec 92Transmission Rate Packets Sent/Sec 92Transmission Received Rate (KB/Sec) 92Transmission Sent Rate (KB/Sec) 92
Processes Tab 86, 114Space Tab 91, 119
Device Detail 91
EMBARCADERO TECHNOLOGIES > EMBARCADERO PERFORMANCE CENTER 2.5 EXPERT GUIDE: SQL SERVER 6
>
Device Summary 91Page Faults/Sec 80, 108Paged Memory Used 79, 107Processor Queue Length 80, 109Processor Time 78, 106Swap Memory Used 79, 108Top CPU Process 84, 112Top I/O Process 84, 112Top Memory Process 83, 111Total Disk Space 83, 111Total Paged Memory 82, 110Total Physical Memory 82, 110Total Swap Memory 82, 110Used Disk Space 82, 111
Performance Analyst Microsoft SQL Server Expert Guide 11Pin Read Hits % 91, 119Pinned Objects 26Pinned Tables 72Probe Scans 33, 37Procedure Hit Ratio 22Procedure Plan Hit Ratio 12Processes Tab 86, 114
SQL Server 53Processor Queue Length 86, 114Processor Time 78, 106
RRange Scans 33, 37Received (KB/Sec) 92, 120Replication Tab 71Rollback Segments Accessed 122
SSent (KB/Sec) 92, 120Server I/O Busy Rate
SQL Server 34Server Idle 59Session Contention Tab 121Session Detail View
Oracle 120SQL Server 124Sybase 130
Session I/O Tab 121Session Leaders
SQL ServerCPU 52I/O 34, 52Memory 24, 51
Session Memory Tab 121Session Network Tab 123Session Objects Tab
Oracle 122Session SQL Tab 123Session Statistics Tab 123Skipped Ghosted Records 37Solaris 77, 105Space Detail 42Space Health Index 94Space Tab 91, 119SQL Agent Tab 70SQL Cache 23SQL Cache Details 26, 72
EMBARCADERO TECHNOLOGIES > EMBARCADERO PERFORMANCE CENTER 2.5 EXPERT GUIDE: SQL SERVER 7
>
SQL Cache Summary 26SQL Cache Tab 26SQL Compilations 49SQL Re-Compilations 49Suspect Databases 65Swap Memory Used 79, 108System Calls/Sec 86, 114System Connections 48System Tab 36
TTable Details
Database Detail View 73Table Lock Escalations 58Table Reserved 42Tables Tab 43Top CPU Process 84, 112Top I/O Process 84, 112Top Memory Process 83, 111Top Sessions View 143
DB2CPU Tab 153I/O Tab 150Memory Tab 146
OracleCPU Tab 152I/O Tab 147Memory Tab 144
SQL ServerCPU Tab 152I/O Tab 148Memory Tab 144
SybaseCPU Tab 152I/O Tab 149Memory Tab 145
Total ConnectionsSQL Server 18, 47
Total Disk Queue 87, 116Total Disk Space 83, 111Total Paged Memory 82, 110Total Physical Memory 82, 110Total Server Reads
SQL Server 14Total Server Writes
SQL Server 14Total Swap Memory 82, 110Total Traffic 76Transactions 19Transfer Rate 87, 116Transmission Queue Length 92, 120Transmission Rate
Bytes 92, 120Packets 92, 120
T-SQL Batches 48
UUnix 77, 105Used Disk Space 82, 111User Home Page 46User I/O Tab 37
EMBARCADERO TECHNOLOGIES > EMBARCADERO PERFORMANCE CENTER 2.5 EXPERT GUIDE: SQL SERVER 8
>
Users BlockedSQL Server 51
Users Detail ViewSQL Server 52
Users Health Index 94
VVirtual Log Files Tab 43
WWaits Tab 63Windows 77, 105Worktables Created 33
EMBARCADERO TECHNOLOGIES > EMBARCADERO PERFORMANCE CENTER 2.5 EXPERT GUIDE: SQL SERVER 9