Embed Size (px)
Citation preview
4.1 3.10
eMARS Reporting REPORT REDUCTION – TIPS & TRICKS NOVEMBER 27, 2017
eMARS Reporting Report Reduction – Tips & Tricks
Table of Contents Introduction .................................................................................................................................................. 3
Report Reduction Steps ................................................................................................................................ 3
1. Determine the Level for Report Reduction .......................................................................................... 3
2. Collect All Reports ................................................................................................................................. 6
3. Determine Which Reports Are in Use ................................................................................................... 7
4. Address Infrequently Used Reports ...................................................................................................... 7
5. Group Reports by Functional Area ....................................................................................................... 7
6. PASS 1: Compare Queries and Group Related Reports ...................................................................... 10
7. PASS 2: Determine Report Requirements / Eliminate Remaining Duplication .................................. 10
8. Consolidate Report Groups................................................................................................................. 11
General Recommendations .................................................................................................................... 11
Completing Repeated Activities .......................................................................................................... 11
Using or Bypassing Java Features ....................................................................................................... 12
Copying Elements Between Reports................................................................................................... 12
Consolidating Reports ............................................................................................................................. 13
Changing Query Filters to Prompts ..................................................................................................... 13
Changing Amount Measures .............................................................................................................. 16
Changing Merged Dimensions ............................................................................................................ 16
Changing Data Providers ......................................................................................................................... 17
9. Publish According to Folder / Naming Conventions ........................................................................... 18
10. Back Up / Remove Obsolete Reports .............................................................................................. 19
Conclusion ................................................................................................................................................... 20
Appendix – Sample Report Design Printouts .............................................................................................. 21
Expenditures and Revenues by Dept with Cash Balance ........................................................................ 22
Report Tabs ......................................................................................................................................... 22
Queries ................................................................................................................................................ 28
Merged Dimensions ............................................................................................................................ 30
Variables ............................................................................................................................................. 30
1550 Daily Cash Detail ............................................................................................................................ 31
Report Tabs ......................................................................................................................................... 31
Queries ................................................................................................................................................ 33
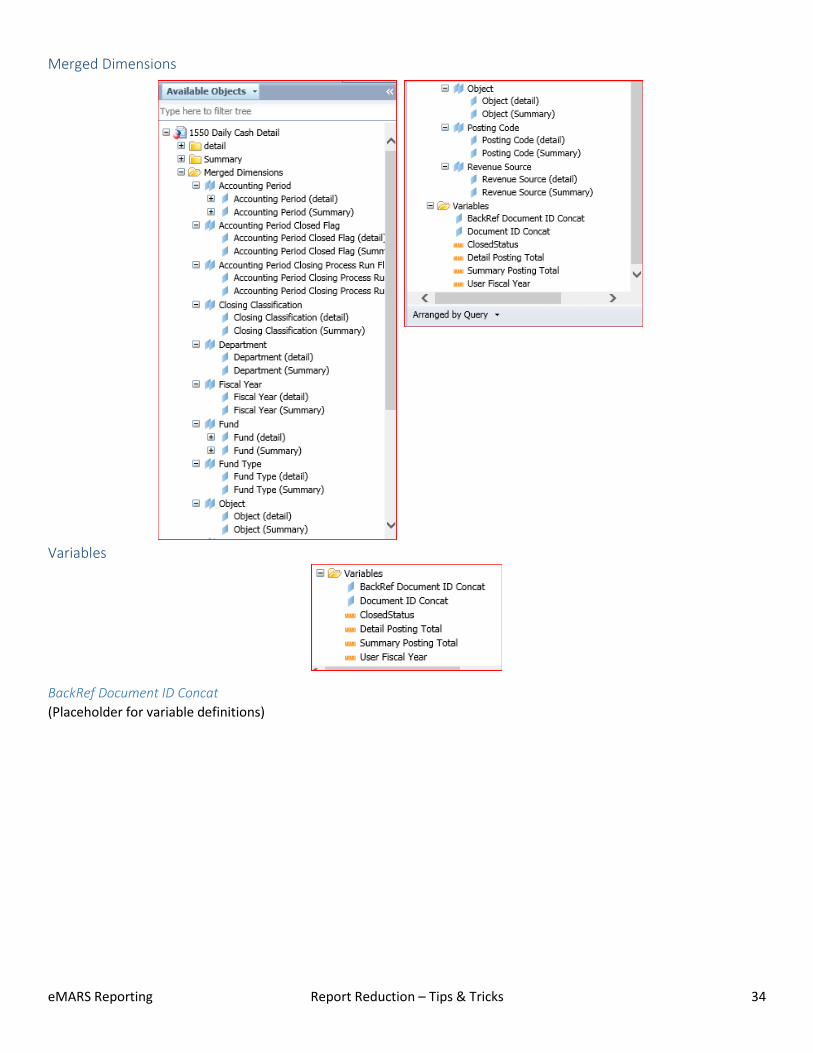
Merged Dimensions ............................................................................................................................ 34
Variables ............................................................................................................................................. 34
eMARS Reporting Report Reduction – Tips & Tricks 3
Introduction Each time eMARS Reporting moves to a new computing environment (usually as part of a software upgrade), it presents the best time for review of existing reports to determine how they can be consolidated or condensed. Equally important is determining the process by which duplicate reports will be prevented – particularly where Statewide Reports are modified to address the needs met by existing Agency reports. This document serves to provide suggestions for report review and reduction, as well as first steps toward a process for maintaining a minimal number of Agency reports.
Report Reduction Steps The following are steps recommended when organizing your agency’s report reduction effort. Each will be detailed in later sections with examples to support the explanation. Page
1. Determine the level at which report reduction will be organized for the agency. ............................................... 3 2. Collect all reports for the agency/level. ................................................................................................................ 6 3. Determine which reports are currently in use. ..................................................................................................... 7 4. Address any reports which are infrequently used. ............................................................................................... 7 5. Organize currently used reports into functional areas. ........................................................................................ 7 6. Compare queries and resulting data and group related reports. ....................................................................... 10 7. Review each report group, considering alternatives and identifying duplication. ............................................. 10 8. Consolidate each report group into fewer formatted reports. .......................................................................... 11 9. Publish the new report group following an established folder and naming convention. .................................. 18 10. Contact an administrator to back up and remove older reports. ....................................................................... 19
Note that for Steps 3-7, it is suggested that printed screen shots of queries and report designs be used. This is the fastest way to compare reports, and it permits important information about each report to be recorded on the printouts as organization is completed.
1. Determine the Level for Report Reduction Some Cabinets may choose to organize their Report Reduction effort centrally, while others may delegate the effort to the Departments within the Cabinet. Similarly, some Departments may organize a department-wide effort, while others may deem it more appropriate to dole out Report Reduction responsibilities to the areas responsible for the various groups of reports.
It is recommended that organization of the Report Reduction effort for each agency begin at the highest possible level, with specific tasks delegated and tracked at lower levels.
For example, suppose a Cabinet consists of several relatively unrelated Departments. The following is a suggested approach for organization of a Report Reduction effort. It is not a required approach nor the only approach – merely one example of an approach proven to be effective.
A. Assign a Cabinet-level coordinator to organize the Report Reduction effort at the Cabinet level. Only by having coordination at the highest level will it be possible to effect Report Reduction by removing duplicate reports across Departments. It is suggested that the Cabinet-level coordinator be the Reporting Lead for the Department having the most significant number of reports in the Cabinet.
eMARS Reporting Report Reduction – Tips & Tricks 4
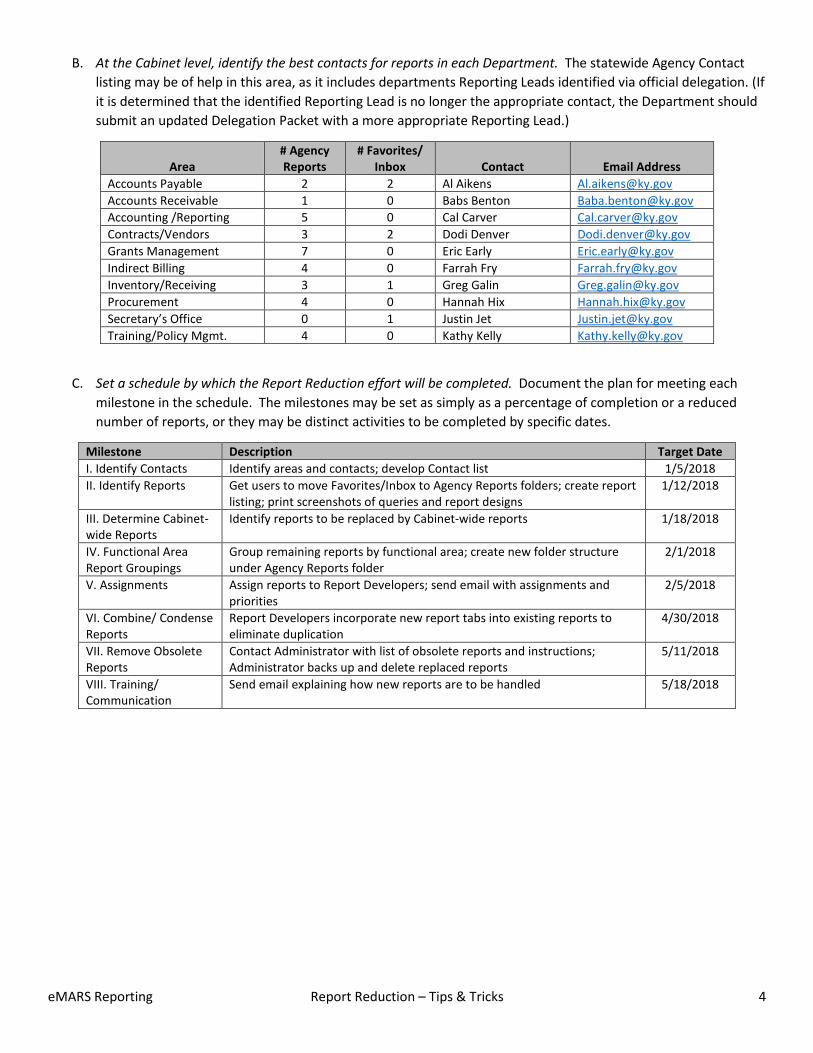
B. At the Cabinet level, identify the best contacts for reports in each Department. The statewide Agency Contact listing may be of help in this area, as it includes departments Reporting Leads identified via official delegation. (If it is determined that the identified Reporting Lead is no longer the appropriate contact, the Department should submit an updated Delegation Packet with a more appropriate Reporting Lead.)
Area # Agency Reports
# Favorites/ Inbox Contact Email Address
Accounts Payable 2 2 Al Aikens [email protected] Accounts Receivable 1 0 Babs Benton [email protected] Accounting /Reporting 5 0 Cal Carver [email protected] Contracts/Vendors 3 2 Dodi Denver [email protected] Grants Management 7 0 Eric Early [email protected] Indirect Billing 4 0 Farrah Fry [email protected] Inventory/Receiving 3 1 Greg Galin [email protected] Procurement 4 0 Hannah Hix [email protected] Secretary’s Office 0 1 Justin Jet [email protected] Training/Policy Mgmt. 4 0 Kathy Kelly [email protected]
C. Set a schedule by which the Report Reduction effort will be completed. Document the plan for meeting each milestone in the schedule. The milestones may be set as simply as a percentage of completion or a reduced number of reports, or they may be distinct activities to be completed by specific dates.
Milestone Description Target Date I. Identify Contacts Identify areas and contacts; develop Contact list 1/5/2018 II. Identify Reports Get users to move Favorites/Inbox to Agency Reports folders; create report
listing; print screenshots of queries and report designs 1/12/2018
III. Determine Cabinet-wide Reports
Identify reports to be replaced by Cabinet-wide reports 1/18/2018
IV. Functional Area Report Groupings
Group remaining reports by functional area; create new folder structure under Agency Reports folder
2/1/2018
V. Assignments Assign reports to Report Developers; send email with assignments and priorities
2/5/2018
VI. Combine/ Condense Reports
Report Developers incorporate new report tabs into existing reports to eliminate duplication
4/30/2018
VII. Remove Obsolete Reports
Contact Administrator with list of obsolete reports and instructions; Administrator backs up and delete replaced reports
5/11/2018
VIII. Training/ Communication
Send email explaining how new reports are to be handled 5/18/2018
eMARS Reporting Report Reduction – Tips & Tricks 5
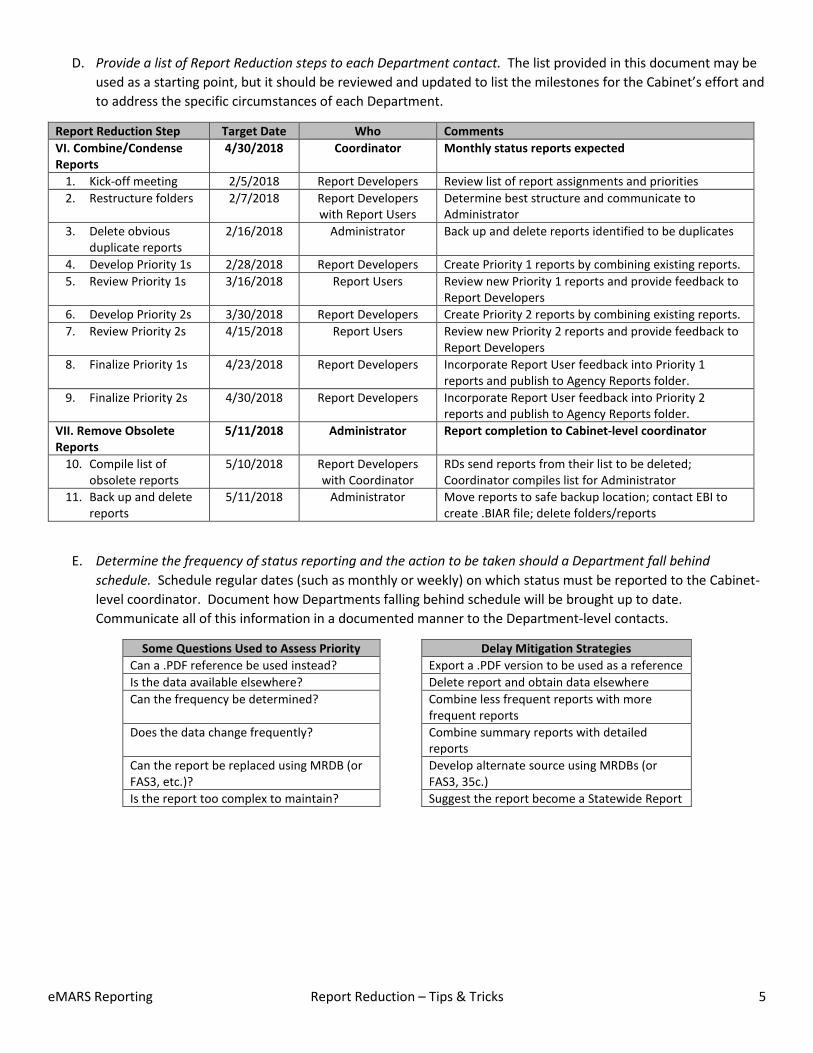
D. Provide a list of Report Reduction steps to each Department contact. The list provided in this document may be used as a starting point, but it should be reviewed and updated to list the milestones for the Cabinet’s effort and to address the specific circumstances of each Department.
Report Reduction Step Target Date Who Comments VI. Combine/Condense Reports
4/30/2018 Coordinator Monthly status reports expected
1. Kick-off meeting 2/5/2018 Report Developers Review list of report assignments and priorities 2. Restructure folders 2/7/2018 Report Developers
with Report Users Determine best structure and communicate to Administrator
3. Delete obvious duplicate reports
2/16/2018 Administrator Back up and delete reports identified to be duplicates
4. Develop Priority 1s 2/28/2018 Report Developers Create Priority 1 reports by combining existing reports. 5. Review Priority 1s 3/16/2018 Report Users Review new Priority 1 reports and provide feedback to
Report Developers 6. Develop Priority 2s 3/30/2018 Report Developers Create Priority 2 reports by combining existing reports. 7. Review Priority 2s 4/15/2018 Report Users Review new Priority 2 reports and provide feedback to
Report Developers 8. Finalize Priority 1s 4/23/2018 Report Developers Incorporate Report User feedback into Priority 1
reports and publish to Agency Reports folder. 9. Finalize Priority 2s 4/30/2018 Report Developers Incorporate Report User feedback into Priority 2
reports and publish to Agency Reports folder. VII. Remove Obsolete Reports
5/11/2018 Administrator Report completion to Cabinet-level coordinator
10. Compile list of obsolete reports
5/10/2018 Report Developers with Coordinator
RDs send reports from their list to be deleted; Coordinator compiles list for Administrator
11. Back up and delete reports
5/11/2018 Administrator Move reports to safe backup location; contact EBI to create .BIAR file; delete folders/reports
E. Determine the frequency of status reporting and the action to be taken should a Department fall behind schedule. Schedule regular dates (such as monthly or weekly) on which status must be reported to the Cabinet-level coordinator. Document how Departments falling behind schedule will be brought up to date. Communicate all of this information in a documented manner to the Department-level contacts.
Some Questions Used to Assess Priority Delay Mitigation Strategies Can a .PDF reference be used instead? Export a .PDF version to be used as a reference Is the data available elsewhere? Delete report and obtain data elsewhere Can the frequency be determined? Combine less frequent reports with more
frequent reports Does the data change frequently? Combine summary reports with detailed
reports Can the report be replaced using MRDB (or FAS3, etc.)?
Develop alternate source using MRDBs (or FAS3, 35c.)
Is the report too complex to maintain? Suggest the report become a Statewide Report
eMARS Reporting Report Reduction – Tips & Tricks 6
2. Collect All Reports While it has been recommended that all reports necessary for the day-to-day operations of an agency be maintained within the Agency Reports folder for each Cabinet/Department, the reality is that Report Developers and Basic Reporting Users frequently maintain reports in their “Favorites” folder or “Inbox” in EBI. There is currently no way to obtain a list of reports in these folders, so each Report Developer and Basic User must be informed of any need for making sure the reports in their “Favorites” folder or “Inbox” in EBI will be moved to the new computing environment.
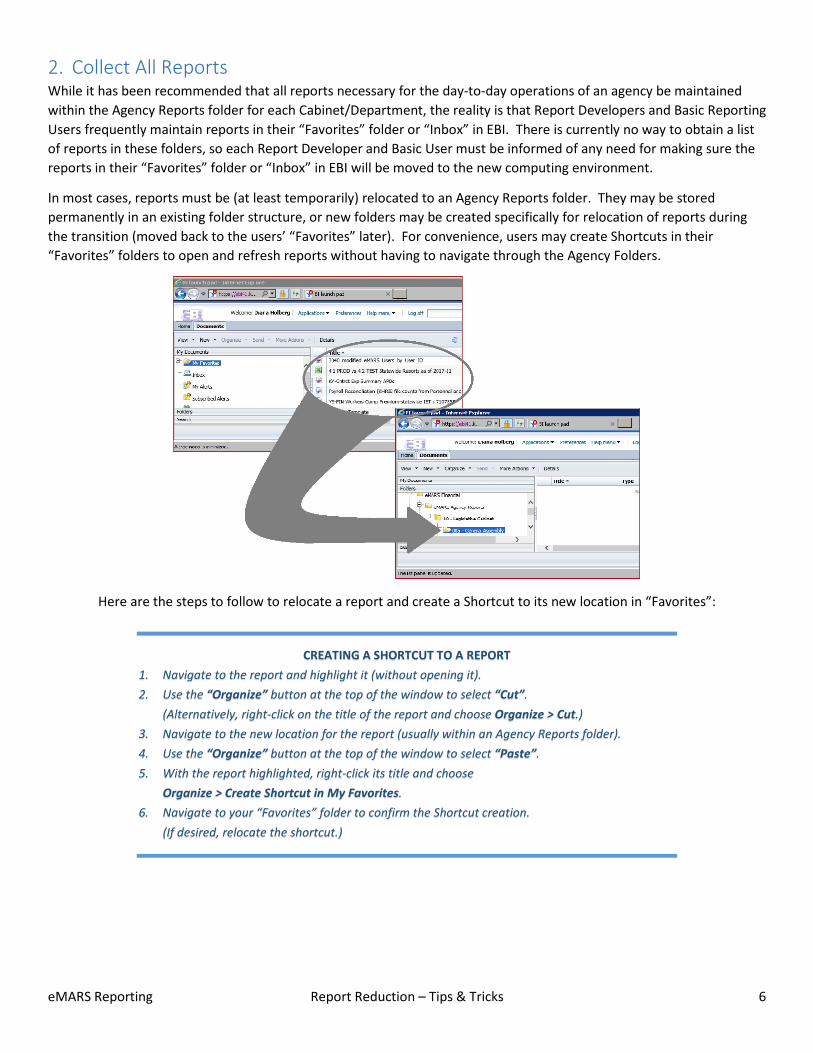
In most cases, reports must be (at least temporarily) relocated to an Agency Reports folder. They may be stored permanently in an existing folder structure, or new folders may be created specifically for relocation of reports during the transition (moved back to the users’ “Favorites” later). For convenience, users may create Shortcuts in their “Favorites” folders to open and refresh reports without having to navigate through the Agency Folders.
Here are the steps to follow to relocate a report and create a Shortcut to its new location in “Favorites”:
CREATING A SHORTCUT TO A REPORT 1. Navigate to the report and highlight it (without opening it). 2. Use the “Organize” button at the top of the window to select “Cut”.
(Alternatively, right-click on the title of the report and choose Organize > Cut.) 3. Navigate to the new location for the report (usually within an Agency Reports folder). 4. Use the “Organize” button at the top of the window to select “Paste”. 5. With the report highlighted, right-click its title and choose
Organize > Create Shortcut in My Favorites. 6. Navigate to your “Favorites” folder to confirm the Shortcut creation.
(If desired, relocate the shortcut.)
eMARS Reporting Report Reduction – Tips & Tricks 7
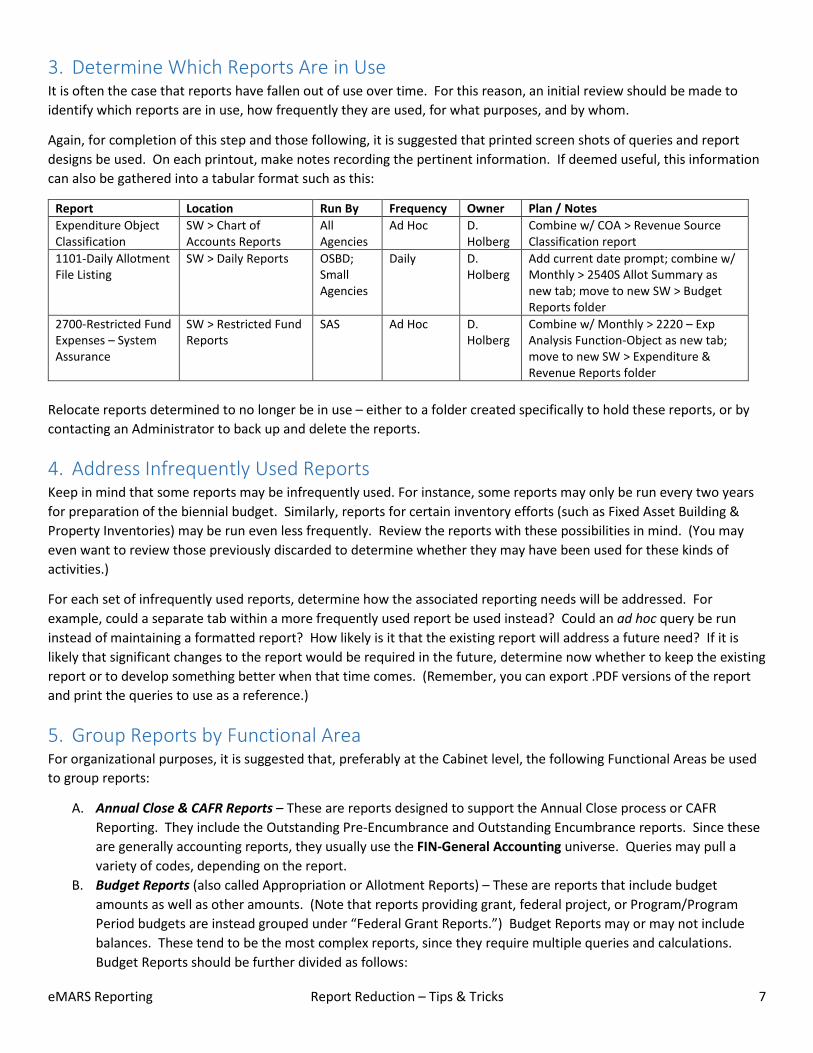
3. Determine Which Reports Are in Use It is often the case that reports have fallen out of use over time. For this reason, an initial review should be made to identify which reports are in use, how frequently they are used, for what purposes, and by whom.
Again, for completion of this step and those following, it is suggested that printed screen shots of queries and report designs be used. On each printout, make notes recording the pertinent information. If deemed useful, this information can also be gathered into a tabular format such as this:
Report Location Run By Frequency Owner Plan / Notes Expenditure Object Classification
SW > Chart of Accounts Reports
All Agencies
Ad Hoc D. Holberg
Combine w/ COA > Revenue Source Classification report
1101-Daily Allotment File Listing
SW > Daily Reports OSBD; Small Agencies
Daily D. Holberg
Add current date prompt; combine w/ Monthly > 2540S Allot Summary as new tab; move to new SW > Budget Reports folder
2700-Restricted Fund Expenses – System Assurance
SW > Restricted Fund Reports
SAS Ad Hoc D. Holberg
Combine w/ Monthly > 2220 – Exp Analysis Function-Object as new tab; move to new SW > Expenditure & Revenue Reports folder
Relocate reports determined to no longer be in use – either to a folder created specifically to hold these reports, or by contacting an Administrator to back up and delete the reports.
4. Address Infrequently Used Reports Keep in mind that some reports may be infrequently used. For instance, some reports may only be run every two years for preparation of the biennial budget. Similarly, reports for certain inventory efforts (such as Fixed Asset Building & Property Inventories) may be run even less frequently. Review the reports with these possibilities in mind. (You may even want to review those previously discarded to determine whether they may have been used for these kinds of activities.)
For each set of infrequently used reports, determine how the associated reporting needs will be addressed. For example, could a separate tab within a more frequently used report be used instead? Could an ad hoc query be run instead of maintaining a formatted report? How likely is it that the existing report will address a future need? If it is likely that significant changes to the report would be required in the future, determine now whether to keep the existing report or to develop something better when that time comes. (Remember, you can export .PDF versions of the report and print the queries to use as a reference.)
5. Group Reports by Functional Area For organizational purposes, it is suggested that, preferably at the Cabinet level, the following Functional Areas be used to group reports:
A. Annual Close & CAFR Reports – These are reports designed to support the Annual Close process or CAFR Reporting. They include the Outstanding Pre-Encumbrance and Outstanding Encumbrance reports. Since these are generally accounting reports, they usually use the FIN-General Accounting universe. Queries may pull a variety of codes, depending on the report.
B. Budget Reports (also called Appropriation or Allotment Reports) – These are reports that include budget amounts as well as other amounts. (Note that reports providing grant, federal project, or Program/Program Period budgets are instead grouped under “Federal Grant Reports.”) Budget Reports may or may not include balances. These tend to be the most complex reports, since they require multiple queries and calculations. Budget Reports should be further divided as follows:
eMARS Reporting Report Reduction – Tips & Tricks 8
a. Capital Project Budget Reports – These reports are specific to Capital Projects. They should be grouped together since they require queries using Budget Structures 42 and 43, and the budget amounts are assigned by Fund code. These reports usually include a query against the Budget Execution Universe – KY universe, and at least one query against the FIN-General Accounting universe.
b. Operational Budget Reports – These reports provide budget amounts and/or balances for Appropriations and Allotments. They should be grouped together since they require queries using Budget Structure 3, and the budget amounts are assigned by Cabinet, CAFR Fund Type, and Function Type/Function Group codes. (General Fund budgets are also set by Object code. Allotment amounts are also defined by Allotment Period = Quarter.) These reports usually include a query against the Budget Execution Universe – KY universe, and at least one query against the FIN-General Accounting universe.
c. Management Budget Reports – These reports provide budget amounts and/or balances set within a Cabinet or Department by processing OB1 documents. They should be grouped together since they require queries using the codes making up the budget line, as well as Event Types XMEX (for Monthly budgets), XQEX (for Quarterly budgets), and XYEX (for Yearly budgets). These reports include queries against the FIN-General Accounting universe, both for budget data and for accounting data.
C. Code Listings – These reports provide setup information for Chart of Account codes or other reporting codes. Code Listings are often the simplest reports to develop; they usually require only one query and do not include amounts or calculations. They can therefore be developed and maintained by less experienced Report Developers. Many of these reports can be categorized as follows:
a. Chart of Account Code Listings – These are listings of Cabinets, Departments, Units, Locations, Funds, Objects, Revenue Sources, Functions/Sub-Functions, Activities, etc. Queries are against the Univ Kernel – Chart of Accounts universe.
b. Security & Workflow Code Listings – These are listings of Users, Document Approvers, Security Groups, Security Roles, Worklists, etc. Queries are against the OADM-Security and Workflow universe.
D. Disbursement Reports – These reports provide information about disbursements: checks or EFT payments. These reports usually provide check/EFT amounts, and may include Intercept amounts. They generally employ queries against the FIN-General Accounting universe using Closing Classification 5, although they may also pull data using Document Type AD or Document Codes AD and EFT (if Checkwriters aren’t needed).
E. Document & Transaction Reports – These reports provide listings of documents (also called transactions) processed against a particular Chart of Account code, Vendor, etc. Queries are usually against either the FIN-Document Catalog or OFIN-Financial Document Catalog universe.
F. Expenditure & Revenue Reports – These reports provide expenditure or revenue amounts independent of any particular budget. These reports usually provide amounts by Object/Object Type (for Expenditures) or Revenue Source (for Revenues), and they require queries against the FIN-General Accounting or Budget Execution Universe – KY universes by Closing Classification code (10 or 11 for Expenditures and 14 or 15 for Revenues).
G. Federal Grant/Project Reports – These reports are specifically designed toprovide information about federal grants, federal projects, job costing, or other activities being tracked using Program and Program Period codes via the Major Program structure in eMARS. These reports generally include a query against the Budget Execution – KY universe and at least one query against FIN-General Accounting. Also in this category are reports on the eMARS Cost Allocation process, generally built against the FIN-Cost Accounting and KY Cost Accounting universes.
H. Fixed Asset/Inventory Reports – These are reports providing information about Fixed Assets, and are built using queries against the FIN-Fixed Assets universe.
I. Payroll & Personnel Reports – These are reports providing information about Personnel or Payroll. They usually include queries against the PERS universe, although payroll summary reports may also be built against FIN-General Accounting (using Object Type 1).
J. Procurement / Contracts Reports – These are reports providing information about the Procurement process or about the contracts resulting from that process. There are numerous Procument universes which may be used
eMARS Reporting Report Reduction – Tips & Tricks 9
to report on the Procurement process; most Contracts reports are built against the FIN-Procurement Awards or FIN-Accounts Payable universe. The FIN-Document Catalog, KY-Contrct Exp Smry, and OFIN-Financial Document Catalog universes can also be useful for these reports.
K. Travel Reports – These are reports providing information about travel and travel reimbursements, and are built using queries against the Travel Accounting universe.
L. Vendor Reports – These reports provide information about Vendors, and are built using queries against the Vendor – KY or Univ Kernel-Vendor universe (for current Vendor data), FIN-General Accounting (for Vendor data used on documents), or FIN-Procurement Awards (for Vendor data used on contracts).
Functional Area Universe(s) Codes Notes Annual Close & CAFR Reports
FIN-General Accounting Various Includes Outstanding Encumbrance reports
Budget Reports See below See below - Capital Project
Budget Reports Budget execution Universe – KY (for budget amounts) FIN-General Accounting (for other amounts)
Department, Fund
- Operational Budget Reports
Budget execution Universe – KY (for budget amounts) FIN-General Accounting (for other amounts)
FY, Cabinet, Fund Type, Function Type, Function Group, Object (for General Fund)
Also by Allotment Period / Quarter (for Allotments)
- Management Budget Reports
FIN-General Accounting (for all amounts)
Doc Code OB1, Event Types EMEX, EQEX, EYEX, FY, APD
COA codes will vary depending on Departmental OB1s
Code Listings Univ Kernel - Chart of Accounts OADM-Security & Workflow
Various
Disbursement Reports FIN-General Accounting Closing Classification 5 Document Type AD Document Codes AD and EFT
Only queries by Closing Classification 5 will pick up Checkwriter payments
Document & Transaction Reports
FIN-Document Catalog OFIN-Financial Document Catalog
Document Code Document Department Document ID Prefix
Expenditure & Revenue Reports
FIN-General Accounting Closing Classification (10, 11 for Expenditures; 14, 15 for Revenues), FY, Fund, Department, Unit, Function, Object/ Revenue Source
Federal Grant / Project Reports
Budget execution Universe – KY (for budget amounts) FIN-General Accounting (for other amounts)
Department, Program, Program Period Program Period often corresponds to two digit Federal Fiscal Year for grant award
Fixed Asset / Inventory Reports
FIN-Fixed Assets FA Number Sometimes by Custodian, Location or Building
Payroll & Personnel Reports
PER FIN-General Accounting
Various, including Object Type 1 Additional security required for PER
Procurement / Contract Reports
FIN-Accounts Payable FIN-Procurement Awards
Procurement Folder Document Number
Use FIN-AP for payment details; FIN-PA for contract details
Travel Reports Travel Accounting Various Vendor Reports Univ Kernel – Vendor
FIN-General Accounting FIN-Procurement Awards
Vendor Code
eMARS Reporting Report Reduction – Tips & Tricks 10
6. PASS 1: Compare Queries and Group Related Reports The first review pass should be conducted by the Reporting Leads. Reporting Leads have presumably been selected because they have the best understanding of how reports are used within their departments. As previously mentioned, the fastest way to compare reports and queries is to have printed copies – see the Appendix to this document for examples. How the reports will be grouped depends on the goals your department has established for the Report Reduction effort. Here are some examples of different Report Reduction strategies for the groupings:
• Frequency Emphasis – Group reports according to frequency, combining daily reports into as few as possible, monthly reports into as few as possible, annual reports, and less frequent reports. The idea here is that users would need to refresh fewer reports daily, monthly, etc. The downside to this approach is that it will not eliminate duplication in queries hitting the same universes for the same type of data.
• Functional Area Emphasis – Group reports according to functional area, combining them regardless of frequency. The idea here is to build as many report tabs as possible (within reason) against common queries pulling detailed data that is summarized as needed. The downside to this approach is that the report designs may be more complex requiring a more advanced skill set for report maintenance.
• Complexity Emphasis – Group reports by desired complexity, combining those which are simple and run quickly, and grouping complex reports based on WebI features required. The idea is to be able to assign groups to Report Developers possessing different skill sets. One possible downside is that skill sets change over time.
These are only a few examples; there may be many other strategies equally effective for reducing report maintenance.
For this review pass, obviously duplicated reports may be eliminated, but there is no need to spend much time examining report designs – that will be done in Pass 2. Clip reports that are to be consolidated together with a note on top explaining preliminary ideas and reasons for the consolidation. Once these groupings have been set and notated, they can be assigned to Report Developers for a more detailed pass.
Exercise: For the two report printouts provided in the Appendix, how would the choice of Report Reduction strategy affect their consolidation? How might the strategy affect the design of the consolidated report?
7. PASS 2: Determine Report Requirements / Eliminate Remaining Duplication Pass 2 is done by Report Developers who review the initial report groupings and determine the best way to complete consolidation in the time provided. This means setting priorities and looking at alternatives to formatted reports.
• Reports which would benefit the entire Cabinet should be consolidated with that in mind. This may mean simply relocating the report up to the Cabinet folder in EBI, or it may require redesigning the report.
• Similarly, reports which may benefit all Cabinets should be submitted for consideration as Statewide Reports. The eMARS Upgrade Reporting Team determines which reports would be appropriate Statewide Reports.
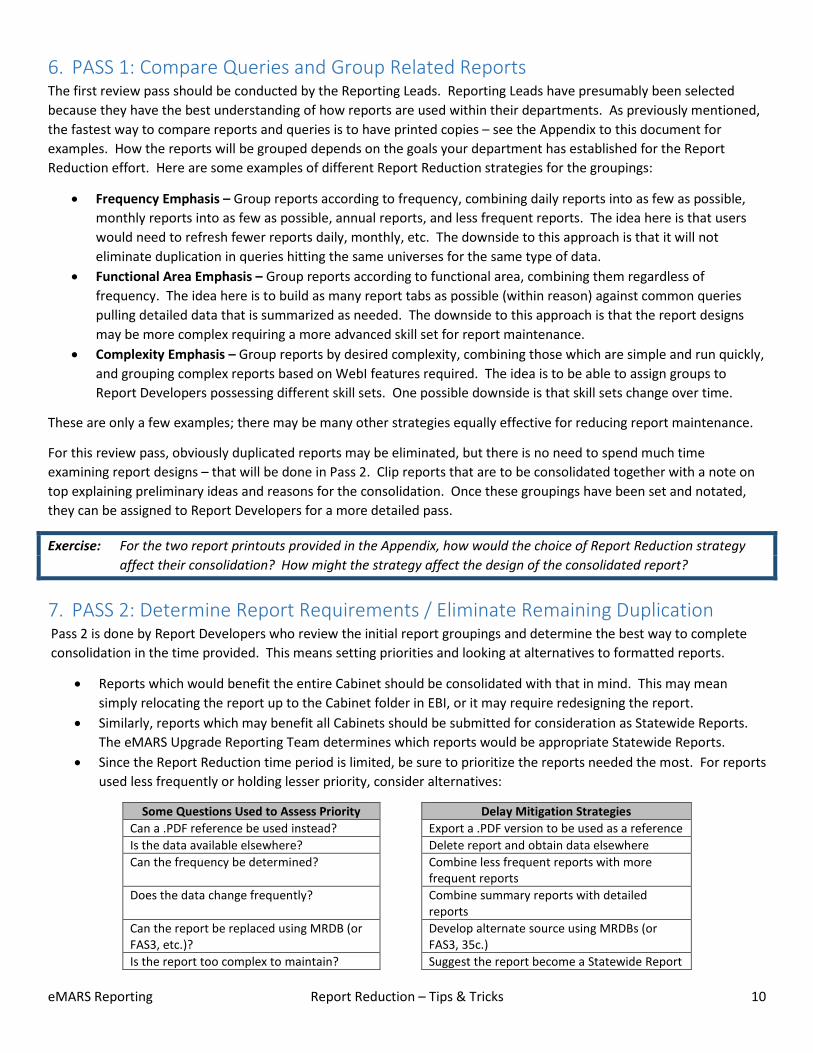
• Since the Report Reduction time period is limited, be sure to prioritize the reports needed the most. For reports used less frequently or holding lesser priority, consider alternatives:
Some Questions Used to Assess Priority Delay Mitigation Strategies Can a .PDF reference be used instead? Export a .PDF version to be used as a reference Is the data available elsewhere? Delete report and obtain data elsewhere Can the frequency be determined? Combine less frequent reports with more
frequent reports Does the data change frequently? Combine summary reports with detailed
reports Can the report be replaced using MRDB (or FAS3, etc.)?
Develop alternate source using MRDBs (or FAS3, 35c.)
Is the report too complex to maintain? Suggest the report become a Statewide Report
eMARS Reporting Report Reduction – Tips & Tricks 11
• Examine report designs more thoroughly with the idea of consolidating remaining duplicates. The reports may not be identical, but rather pull data using very similar queries. Combining different reports that are based on similar data will reduce the maintenance required and allow users to see more information at once.
• Look for more subtle duplications. The most common example is Budget reports containing expenditure data, which could be consolidated with Expenditure reports. It is also often possible to consolidate Cash reports with Expenditure and Revenue reports to reduce report refreshes required on a daily basis.
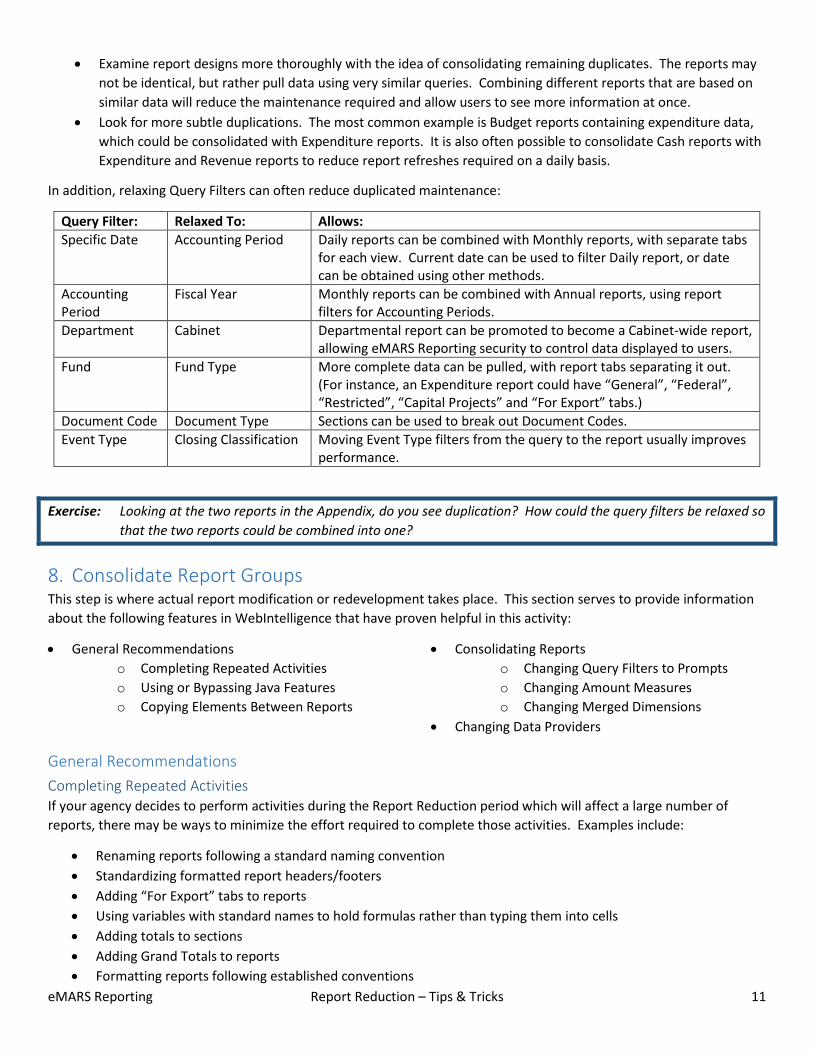
In addition, relaxing Query Filters can often reduce duplicated maintenance:
Query Filter: Relaxed To: Allows: Specific Date Accounting Period Daily reports can be combined with Monthly reports, with separate tabs
for each view. Current date can be used to filter Daily report, or date can be obtained using other methods.
Accounting Period
Fiscal Year Monthly reports can be combined with Annual reports, using report filters for Accounting Periods.
Department Cabinet Departmental report can be promoted to become a Cabinet-wide report, allowing eMARS Reporting security to control data displayed to users.
Fund Fund Type More complete data can be pulled, with report tabs separating it out. (For instance, an Expenditure report could have “General”, “Federal”, “Restricted”, “Capital Projects” and “For Export” tabs.)
Document Code Document Type Sections can be used to break out Document Codes. Event Type Closing Classification Moving Event Type filters from the query to the report usually improves
performance.
Exercise: Looking at the two reports in the Appendix, do you see duplication? How could the query filters be relaxed so that the two reports could be combined into one?
8. Consolidate Report Groups This step is where actual report modification or redevelopment takes place. This section serves to provide information about the following features in WebIntelligence that have proven helpful in this activity:
• General Recommendations o Completing Repeated Activities o Using or Bypassing Java Features o Copying Elements Between Reports
• Consolidating Reports o Changing Query Filters to Prompts o Changing Amount Measures o Changing Merged Dimensions
• Changing Data Providers
General Recommendations Completing Repeated Activities If your agency decides to perform activities during the Report Reduction period which will affect a large number of reports, there may be ways to minimize the effort required to complete those activities. Examples include:
• Renaming reports following a standard naming convention • Standardizing formatted report headers/footers • Adding “For Export” tabs to reports • Using variables with standard names to hold formulas rather than typing them into cells • Adding totals to sections • Adding Grand Totals to reports • Formatting reports following established conventions
eMARS Reporting Report Reduction – Tips & Tricks 12
Here are some ways these types of activities can be done efficiently:
1. Determine and document naming conventions and formatting standards prior to the effort. 2. Create a “template” report to use as a starting point for new report development, and from which report
elements such as headers, footers, etc. can be copied. 3. Assign a Report Developer to make a change to groups of reports, without having to make other changes.
This permits Report Developers with less experience to gain experience and reinforce each activity through repetition.
Using or Bypassing Java Features There are a number of features in WebIntelligence which require the Java Runtime Environment, but most of those features are infrequently used. Since Java takes extra time to load, you may choose to bypass execution of the Java Runtime Environment. This is also handy should you receive Java errors that you have no time to address.
To bypass the Java Runtime Environment execution:
1. In Preferences, choose “HTML” (or “PDF”) as the View preference for WebIntelligence documents (located in the Web Intelligence section).
2. Select “View” rather “Modify” when opening the report (or double-click it in the folder to open it). 3. While viewing the report, click the “Design” button (in the toolbar at the upper right of the window).
This will bypass Java, yet allow you access to the report design and all query designs. Note that if you intend to use the Change Data Source tool, custom number formatting options, or query filter nesting (among other features), you must permit the Java Runtime Environment to run by reversing the above steps and using “Modify” when opening the report.
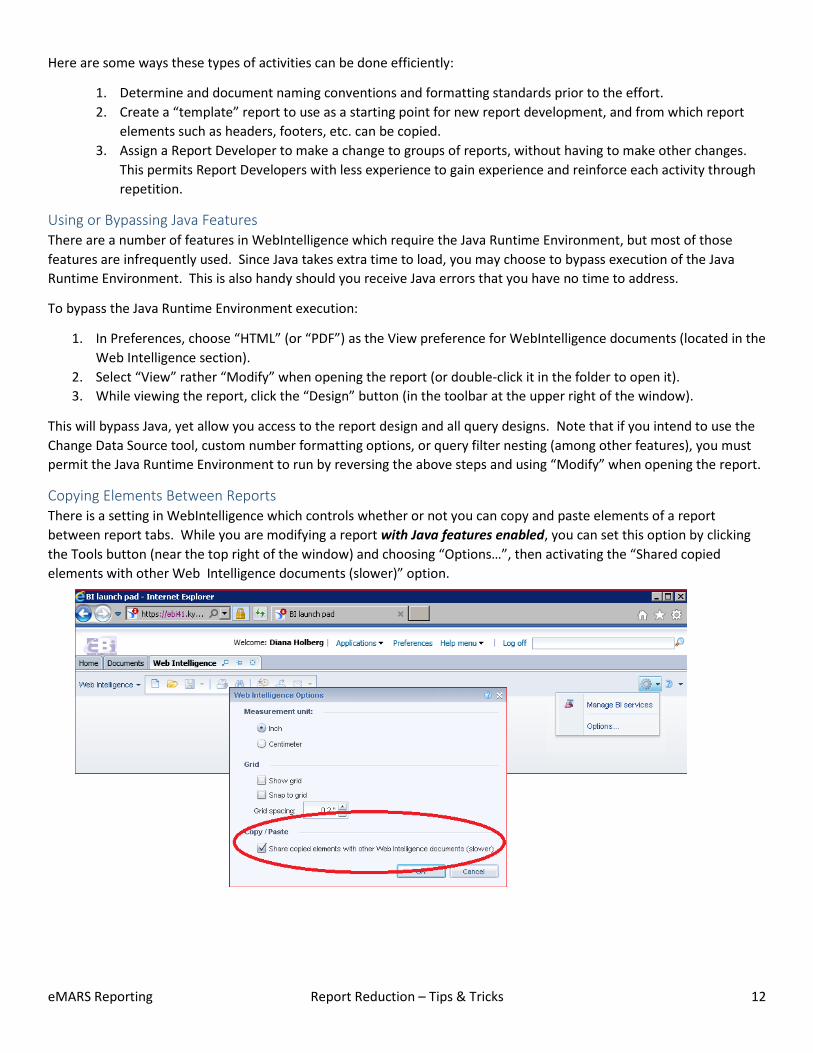
Copying Elements Between Reports There is a setting in WebIntelligence which controls whether or not you can copy and paste elements of a report between report tabs. While you are modifying a report with Java features enabled, you can set this option by clicking the Tools button (near the top right of the window) and choosing “Options…”, then activating the “Shared copied elements with other Web Intelligence documents (slower)” option.
eMARS Reporting Report Reduction – Tips & Tricks 13
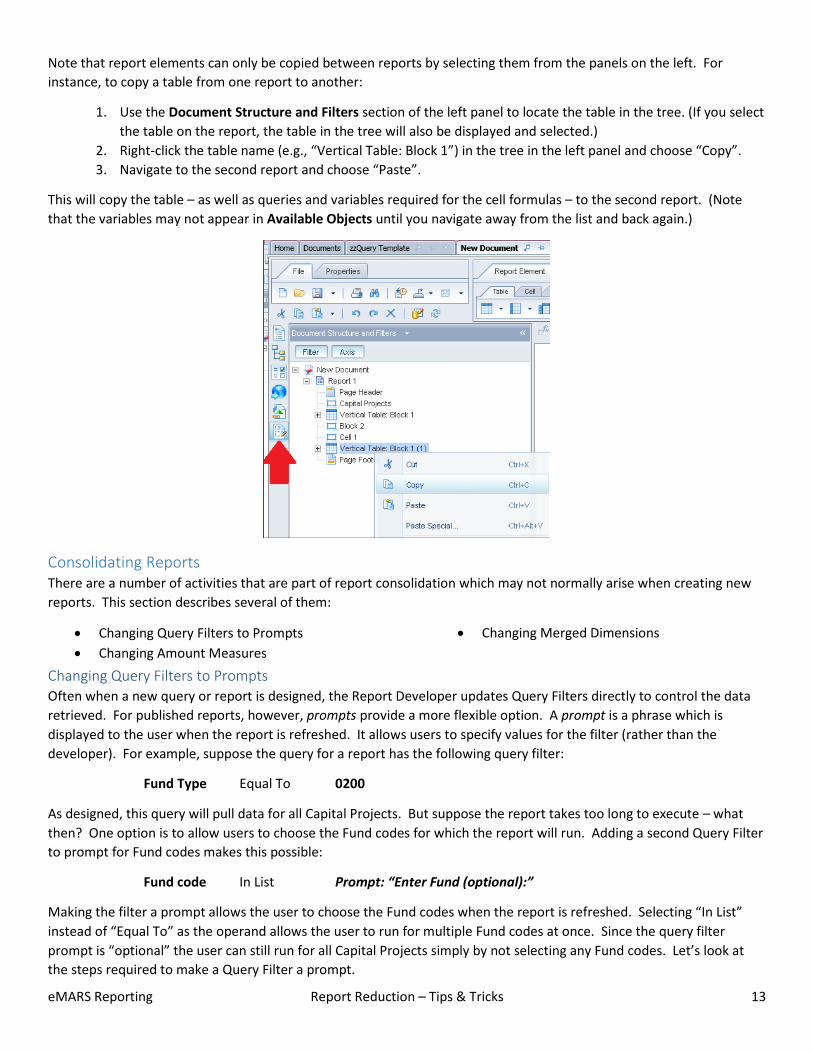
Note that report elements can only be copied between reports by selecting them from the panels on the left. For instance, to copy a table from one report to another:
1. Use the Document Structure and Filters section of the left panel to locate the table in the tree. (If you select the table on the report, the table in the tree will also be displayed and selected.)
2. Right-click the table name (e.g., “Vertical Table: Block 1”) in the tree in the left panel and choose “Copy”. 3. Navigate to the second report and choose “Paste”.
This will copy the table – as well as queries and variables required for the cell formulas – to the second report. (Note that the variables may not appear in Available Objects until you navigate away from the list and back again.)
Consolidating Reports There are a number of activities that are part of report consolidation which may not normally arise when creating new reports. This section describes several of them:
• Changing Query Filters to Prompts • Changing Amount Measures
• Changing Merged Dimensions
Changing Query Filters to Prompts Often when a new query or report is designed, the Report Developer updates Query Filters directly to control the data retrieved. For published reports, however, prompts provide a more flexible option. A prompt is a phrase which is displayed to the user when the report is refreshed. It allows users to specify values for the filter (rather than the developer). For example, suppose the query for a report has the following query filter:
Fund Type Equal To 0200
As designed, this query will pull data for all Capital Projects. But suppose the report takes too long to execute – what then? One option is to allow users to choose the Fund codes for which the report will run. Adding a second Query Filter to prompt for Fund codes makes this possible:
Fund code In List Prompt: “Enter Fund (optional):”
Making the filter a prompt allows the user to choose the Fund codes when the report is refreshed. Selecting “In List” instead of “Equal To” as the operand allows the user to run for multiple Fund codes at once. Since the query filter prompt is “optional” the user can still run for all Capital Projects simply by not selecting any Fund codes. Let’s look at the steps required to make a Query Filter a prompt.
eMARS Reporting Report Reduction – Tips & Tricks 14
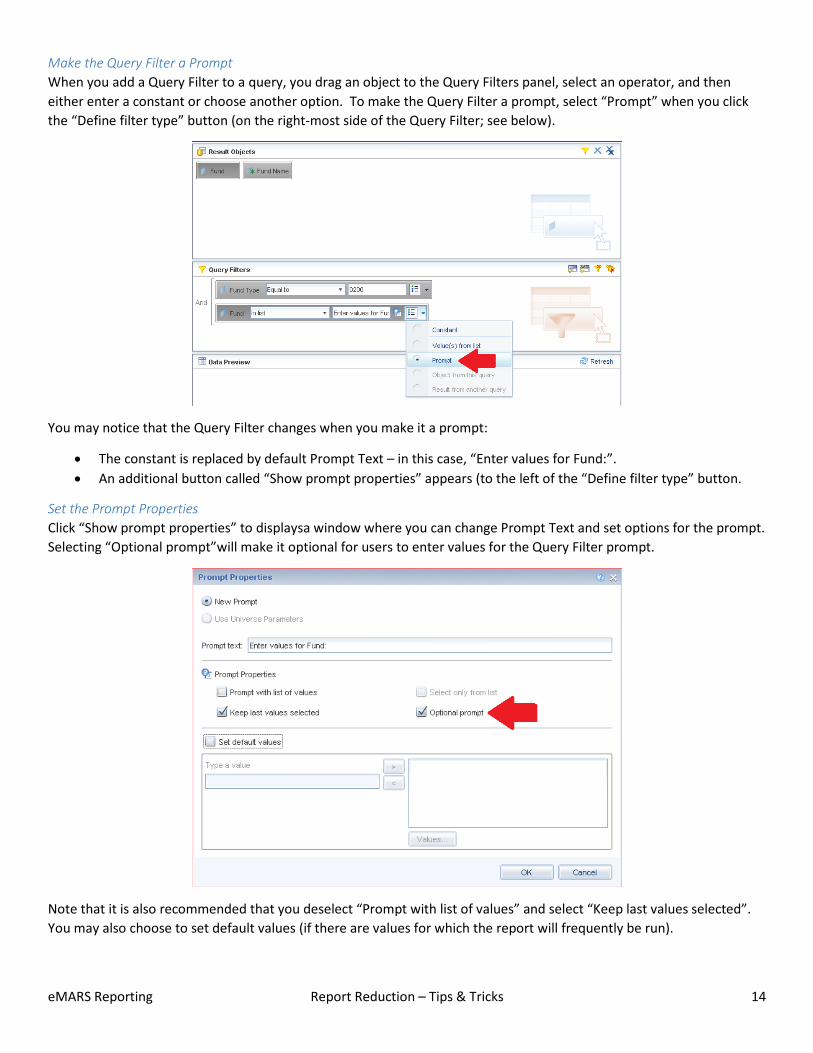
Make the Query Filter a Prompt When you add a Query Filter to a query, you drag an object to the Query Filters panel, select an operator, and then either enter a constant or choose another option. To make the Query Filter a prompt, select “Prompt” when you click the “Define filter type” button (on the right-most side of the Query Filter; see below).
You may notice that the Query Filter changes when you make it a prompt:
• The constant is replaced by default Prompt Text – in this case, “Enter values for Fund:”. • An additional button called “Show prompt properties” appears (to the left of the “Define filter type” button.
Set the Prompt Properties Click “Show prompt properties” to displaysa window where you can change Prompt Text and set options for the prompt. Selecting “Optional prompt”will make it optional for users to enter values for the Query Filter prompt.
Note that it is also recommended that you deselect “Prompt with list of values” and select “Keep last values selected”. You may also choose to set default values (if there are values for which the report will frequently be run).
eMARS Reporting Report Reduction – Tips & Tricks 15
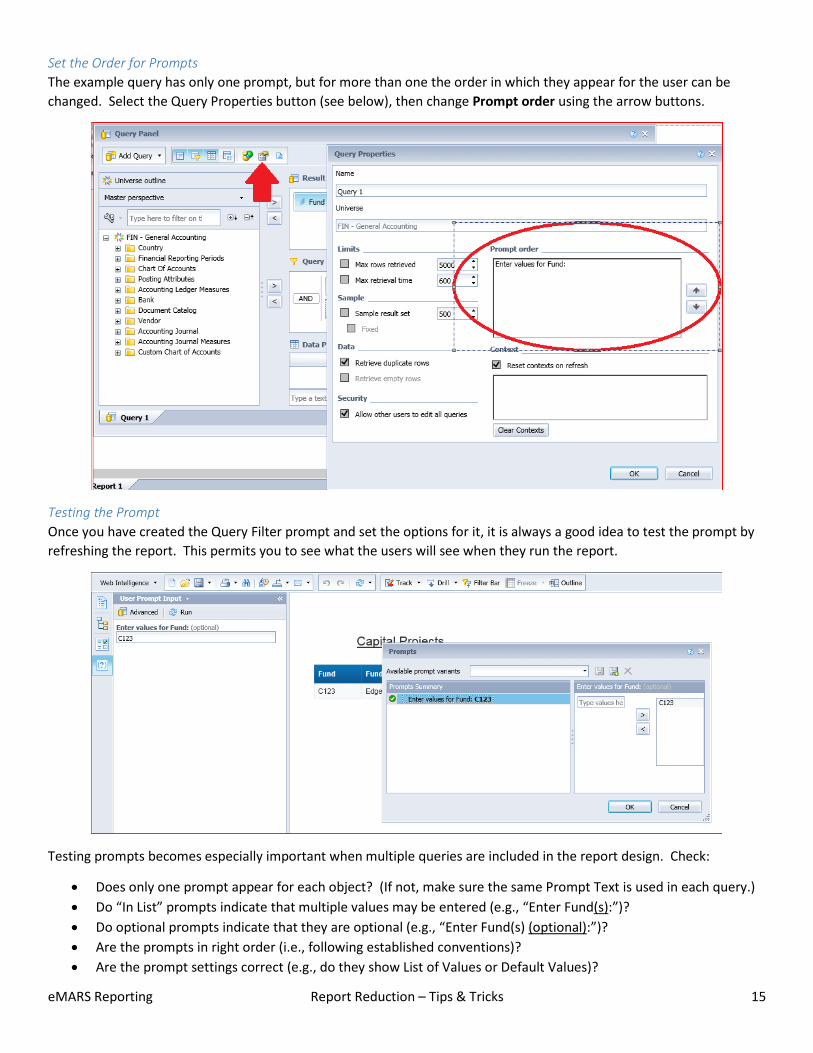
Set the Order for Prompts The example query has only one prompt, but for more than one the order in which they appear for the user can be changed. Select the Query Properties button (see below), then change Prompt order using the arrow buttons.
Testing the Prompt Once you have created the Query Filter prompt and set the options for it, it is always a good idea to test the prompt by refreshing the report. This permits you to see what the users will see when they run the report.
Testing prompts becomes especially important when multiple queries are included in the report design. Check:
• Does only one prompt appear for each object? (If not, make sure the same Prompt Text is used in each query.) • Do “In List” prompts indicate that multiple values may be entered (e.g., “Enter Fund(s):”)? • Do optional prompts indicate that they are optional (e.g., “Enter Fund(s) (optional):”)? • Are the prompts in right order (i.e., following established conventions)? • Are the prompt settings correct (e.g., do they show List of Values or Default Values)?
eMARS Reporting Report Reduction – Tips & Tricks 16
Changing Amount Measures Suppose one measure was used in the calculation of amounts, but you need to use a different measure. For example, suppose the Posting Amount measure from the Basic Accounting Ledger class was used instead of Jrnl Posting Amt from the Accounting Journal. This can present several issues:
• If the measure was included in the report tabs, removing it from the query will remove it from those tabs, possibly affecting the arrangement of other elements on the report tabs.
• If the measure was used as part of the formula for a calculation, removing it from the query will cause the calculation to display an error, and may render the formula unreadable to someone wanting to fix it.
• Similarly, if the measure was used as part of a variable, any reports including the variable will display errors, and the formula for the variable may become unreadable.
Here are steps which will minimize the chance of these problems:
1. Add the correct measure object to the query. (Do not remove the existing measure object.) 2. Save the query and refresh the report. This should not cause any changes in the results of the report (though
the query may run longer since both measures have to be obtained.) 3. Examine each variable object, replacing the old measure object with the new one in each affected formula. 4. Examine the formula for each amount field or column in each report tab, again replacing the old measure object
with the new. Be sure to check for totals at the end of each section and at the end of the report. 5. Be sure you have examined all report tabs – it’s easy to forget the “For Export” tab. 6. Once you are confident that all formulas have been updated, remove the old measure from the query safely. 7. Examine the report tabs thoroughly to be sure nothing was significantly changed before saving the report.
Changing Merged Dimensions When a query is added to a report where multiple queries were already in use and dimensions were already merged, it can be awkward to include the dimensions from the new query in the merge:
• Previously merged dimensions cannot be merged with dimensions from the new query. • If merged objects are included in the report tabs, unmerging will cause them to disappear, possibly affecting the
arrangement of other elements on the report tabs.
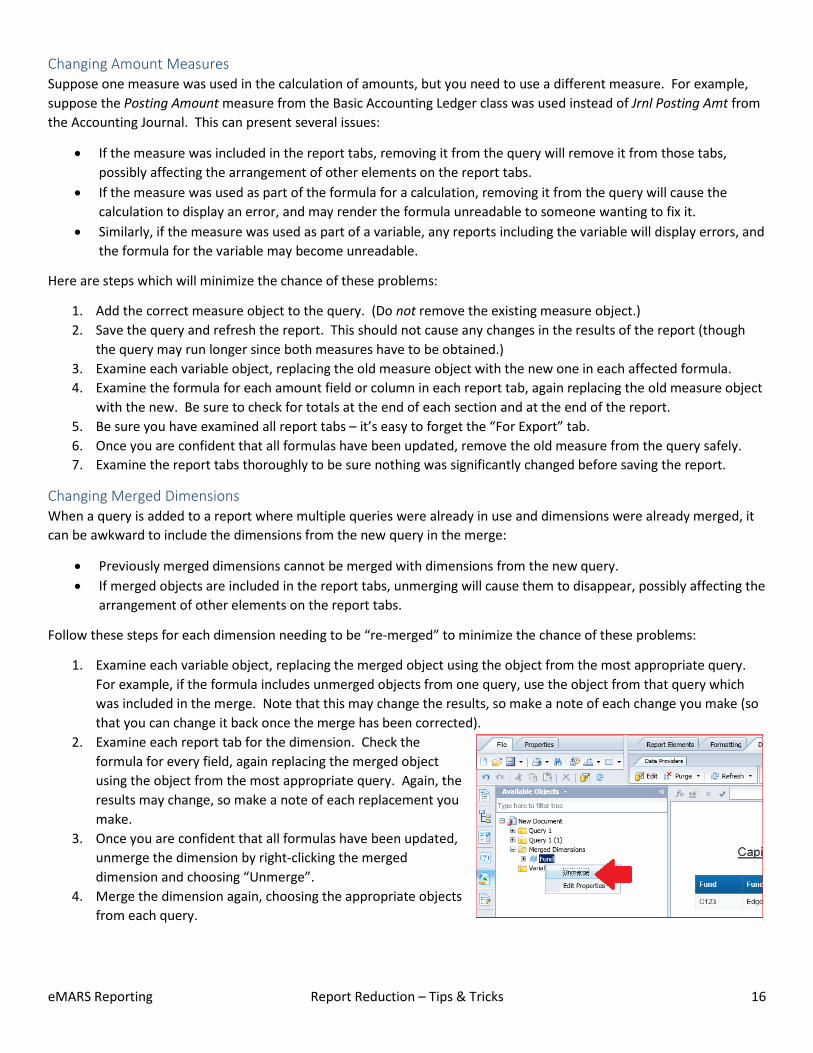
Follow these steps for each dimension needing to be “re-merged” to minimize the chance of these problems:
1. Examine each variable object, replacing the merged object using the object from the most appropriate query. For example, if the formula includes unmerged objects from one query, use the object from that query which was included in the merge. Note that this may change the results, so make a note of each change you make (so that you can change it back once the merge has been corrected).
2. Examine each report tab for the dimension. Check the formula for every field, again replacing the merged object using the object from the most appropriate query. Again, the results may change, so make a note of each replacement you make.
3. Once you are confident that all formulas have been updated, unmerge the dimension by right-clicking the merged dimension and choosing “Unmerge”.
4. Merge the dimension again, choosing the appropriate objects from each query.
eMARS Reporting Report Reduction – Tips & Tricks 17
Changing Data Providers There are times when you may need to change the Data Provider for a report. For example, you may have a report which uses the FIN-Accounts Payable universe, but you need it to use the FIN-General Accounting universe (so that additional data may be included in the report). This process can be unpredictable, so make a backup copy first!
Changing a Data Provider requires use of Java functionality, so be sure you have that enabled:
1. Be sure Java Runtime Environment is installed. 2. In Preferences, choose “Applet” as the Modify preference for WebIntelligence documents (located in the Web
Intelligence section). 3. Right-click the report and select “Modify” to open it (instead of double-clicking or selecting “View”).
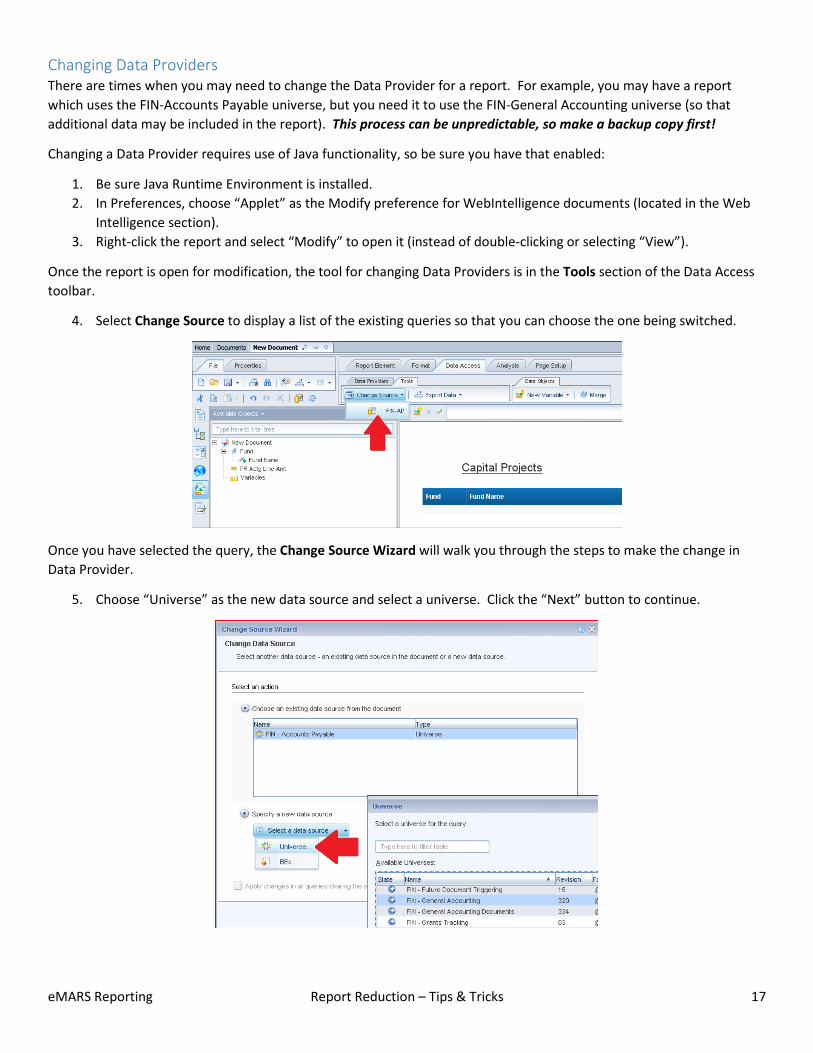
Once the report is open for modification, the tool for changing Data Providers is in the Tools section of the Data Access toolbar.
4. Select Change Source to display a list of the existing queries so that you can choose the one being switched.
Once you have selected the query, the Change Source Wizard will walk you through the steps to make the change in Data Provider.
5. Choose “Universe” as the new data source and select a universe. Click the “Next” button to continue.
eMARS Reporting Report Reduction – Tips & Tricks 18
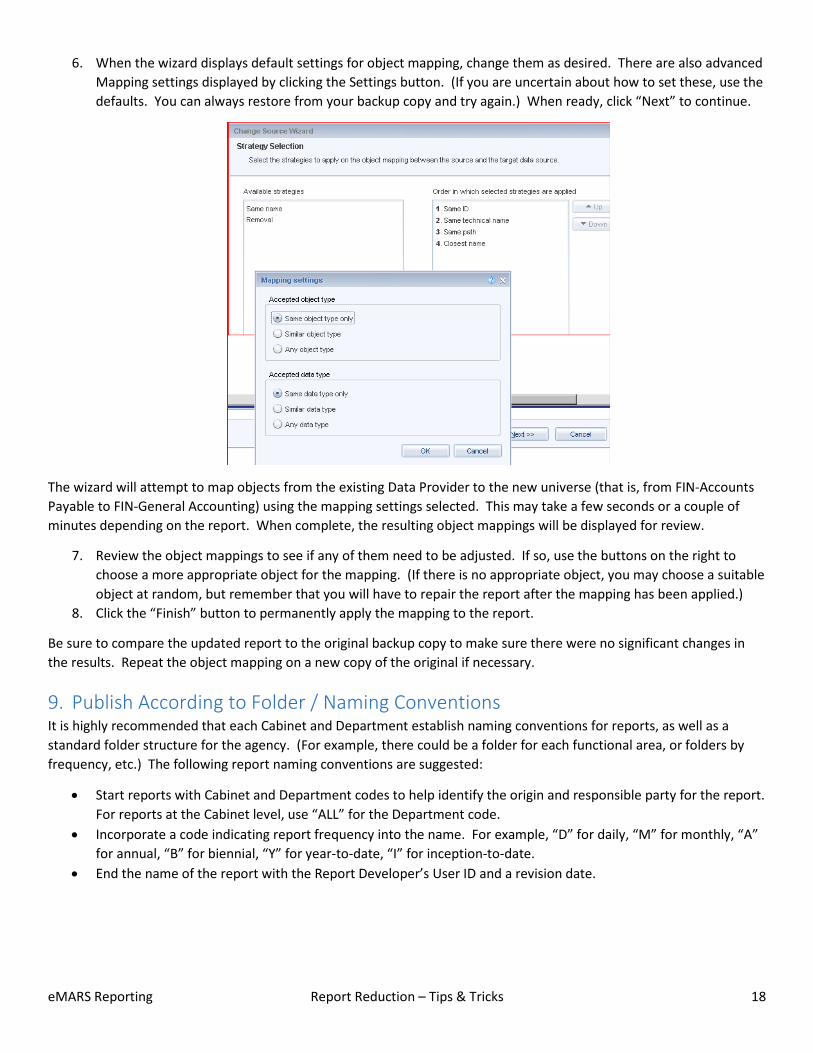
6. When the wizard displays default settings for object mapping, change them as desired. There are also advanced Mapping settings displayed by clicking the Settings button. (If you are uncertain about how to set these, use the defaults. You can always restore from your backup copy and try again.) When ready, click “Next” to continue.
The wizard will attempt to map objects from the existing Data Provider to the new universe (that is, from FIN-Accounts Payable to FIN-General Accounting) using the mapping settings selected. This may take a few seconds or a couple of minutes depending on the report. When complete, the resulting object mappings will be displayed for review.
7. Review the object mappings to see if any of them need to be adjusted. If so, use the buttons on the right to choose a more appropriate object for the mapping. (If there is no appropriate object, you may choose a suitable object at random, but remember that you will have to repair the report after the mapping has been applied.)
8. Click the “Finish” button to permanently apply the mapping to the report.
Be sure to compare the updated report to the original backup copy to make sure there were no significant changes in the results. Repeat the object mapping on a new copy of the original if necessary.
9. Publish According to Folder / Naming Conventions It is highly recommended that each Cabinet and Department establish naming conventions for reports, as well as a standard folder structure for the agency. (For example, there could be a folder for each functional area, or folders by frequency, etc.) The following report naming conventions are suggested:
• Start reports with Cabinet and Department codes to help identify the origin and responsible party for the report. For reports at the Cabinet level, use “ALL” for the Department code.
• Incorporate a code indicating report frequency into the name. For example, “D” for daily, “M” for monthly, “A” for annual, “B” for biennial, “Y” for year-to-date, “I” for inception-to-date.
• End the name of the report with the Report Developer’s User ID and a revision date.
eMARS Reporting Report Reduction – Tips & Tricks 19
Here are sample report names exemplifying these conventions:
• 53-ALL-Federal Grants (DMAYI, ABC0123, Rev. April 12, 2018) A grant report run for daily, monthly, annual, YTD, or ITD data; last modified by user ABC0123 on 4/12/2018.
• 39-758-Trial Balance (D, DEF4567, Rev. August 23, 2018) A daily trial balance report last modified by user DEF4567 on 8/23/2018.
• 31-660-Budget Balances (MAY, GHJ8901, Rev. November 16, 2018) A budget balance report for monthly, annual, or YTD data; last modified by user GHJ8901 on 11/16/2018.
10. Back Up / Remove Obsolete Reports While the Report Reduction effort is ongoing, you will probably want to keep original reports intact until testing is complete. For this reason, you may want to create a subfolder to your Cabinet and/or Department Agency Reports folders called “Ongoing Report Reduction” within which to store the consolidated reports as they are in progress. A second subfolder called “Completed Consolidation” could hold the final versions. A third subfolder called “Archive” can be established to hold obsolete reports. This will allow for the following “version control” process during development:
1. Create a folder structure under “Ongoing Report Reduction” to match what you intend to use after the upgrade. 2. Create the same folder structure under “Completed Consolidation”. 3. Create copies of the original reports for consolidation in the appropriate “Ongoing Report Reduction” subfolder. 4. Perform consolidation, name the resulting report according to naming conventions, and store it in the same
subfolder under “Ongoing Report Reduction”. Request review of the report. 5. Once the consolidated report has been sufficiently reviewed/tested, move it from the “Ongoing Report
Reduction” subfolder to the corresponding subfolder under “Completed Consolidation”. 6. Move the original report copies from the “Ongoing Report Reduction” subfolder to an “Archive” subfolder. 7. Arrange a date for the actual original reports to be moved from the Department’s Agency Reports folder to the
“Archive” subfolder (replacing the copies). 8. On (or before) the agreed upon date, help users create shortcuts in their “Favorites” folder to the new
consolidated report. (Also be sure they aren’t keeping copies of the old reports.) 9. When the new report is meeting needs sufficiently, arrange for backup and removal of the “Archive” reports. 10. After the upgrade, arrange for the folder structure under “Completed Consolidation” to be relocated to the
Deparment’s Agency Reports folder (and remove the “Completed Consolidation” folder).
An important part of the Report Reduction effort is to remove the reports which have been replaced or eliminated.
• One Report Developer per cabinet may be granted security to move/delete reports from Agency Report folders. • Members of the eMARS Upgrade Reporting Team and the EBI Support team in COT can also do this.
eMARS Reporting Report Reduction – Tips & Tricks 20
Conclusion Report reduction is not a one-time event. Rather, it is something that needs to be addressed each time a change is made which could eliminate the need for reports. Although this document has addressed the organization of a significant Report Reduction effort, it is important for each Cabinet/Department to determine how reports will be eliminated when they become obsolete.
For example, if a Statewide Report has been modified such that Cabinet- or Department-level reports are no longer needed, that information must be communicated to responsible parties who have an understanding of how Report Reduction is done in the Cabinet/Department. Similarly, if a Cabinet-level report makes Department-level reports obsolete, the responsible parties in the Departments must be notified and take action.
It is our hope that this document serves as a starting point in the discussion of how best to facilitate this communication and ongoing maintenance of the reporting library in eMARS Reporting.
eMARS Reporting Report Reduction – Tips & Tricks 21
Appendix – Sample Report Design Printouts
eMARS Reporting Report Reduction – Tips & Tricks 22
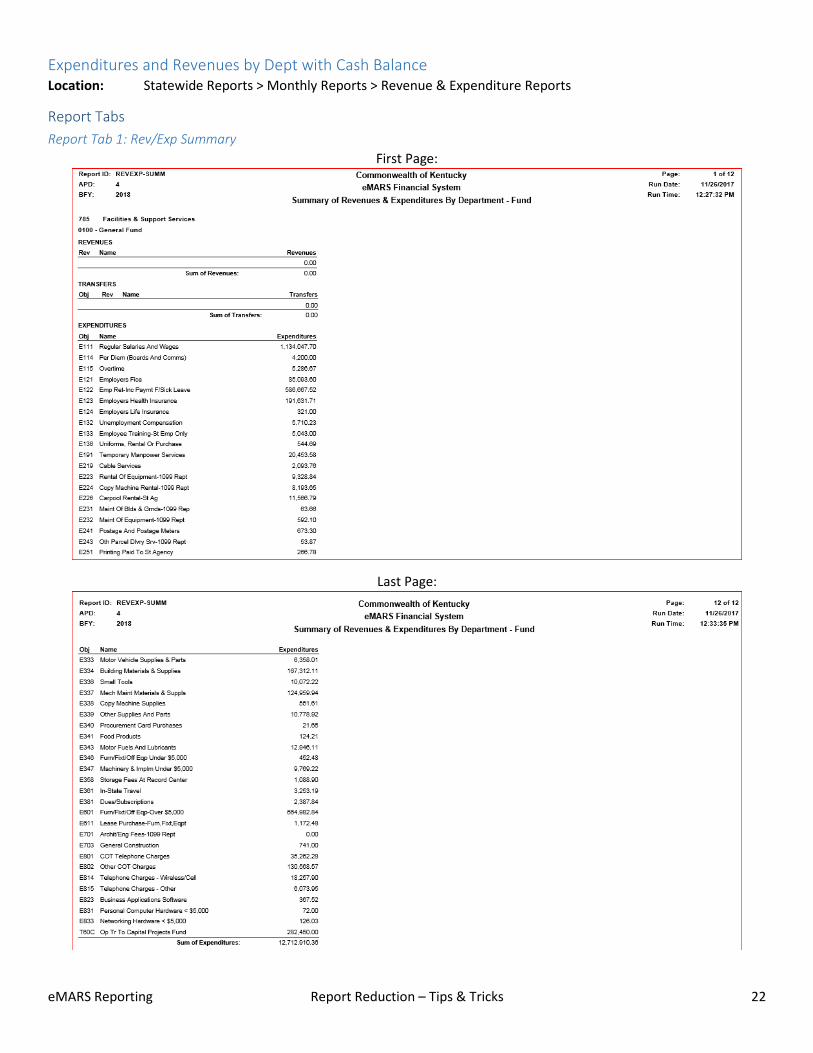
Expenditures and Revenues by Dept with Cash Balance Location: Statewide Reports > Monthly Reports > Revenue & Expenditure Reports
Report Tabs Report Tab 1: Rev/Exp Summary
First Page:
Last Page:
eMARS Reporting Report Reduction – Tips & Tricks 23
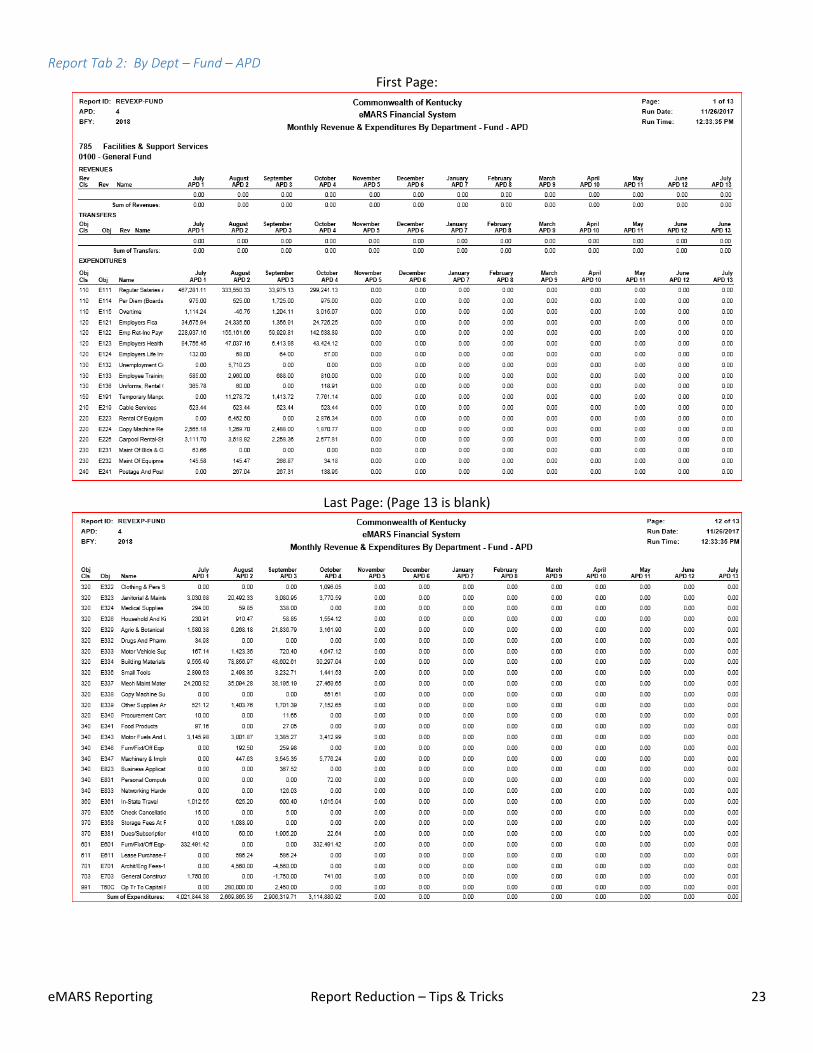
Report Tab 2: By Dept – Fund – APD First Page:
Last Page: (Page 13 is blank)
eMARS Reporting Report Reduction – Tips & Tricks 24
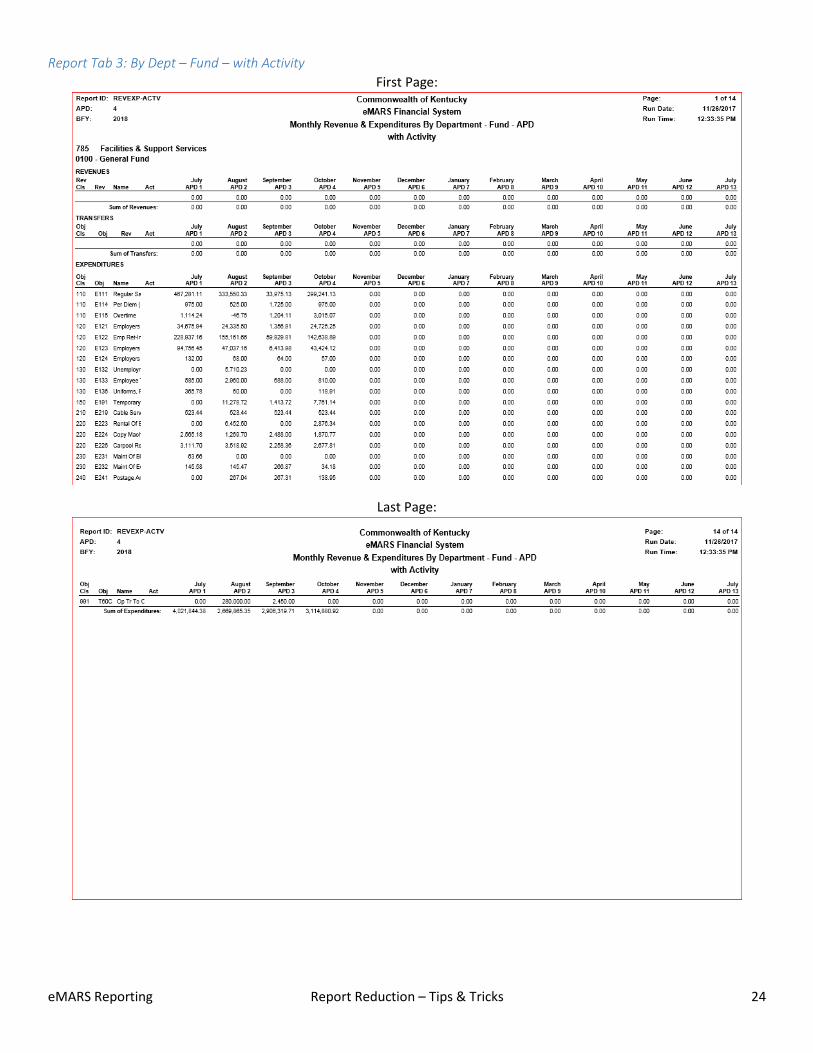
Report Tab 3: By Dept – Fund – with Activity First Page:
Last Page:
eMARS Reporting Report Reduction – Tips & Tricks 25
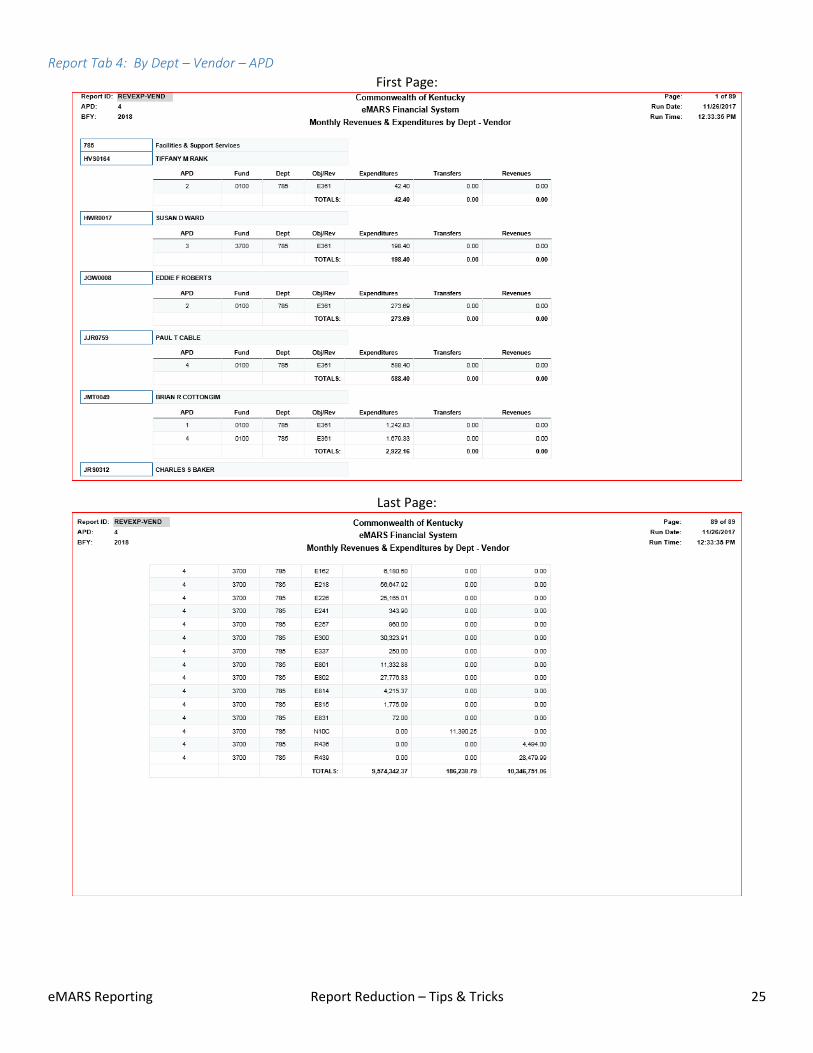
Report Tab 4: By Dept – Vendor – APD First Page:
Last Page:
eMARS Reporting Report Reduction – Tips & Tricks 26
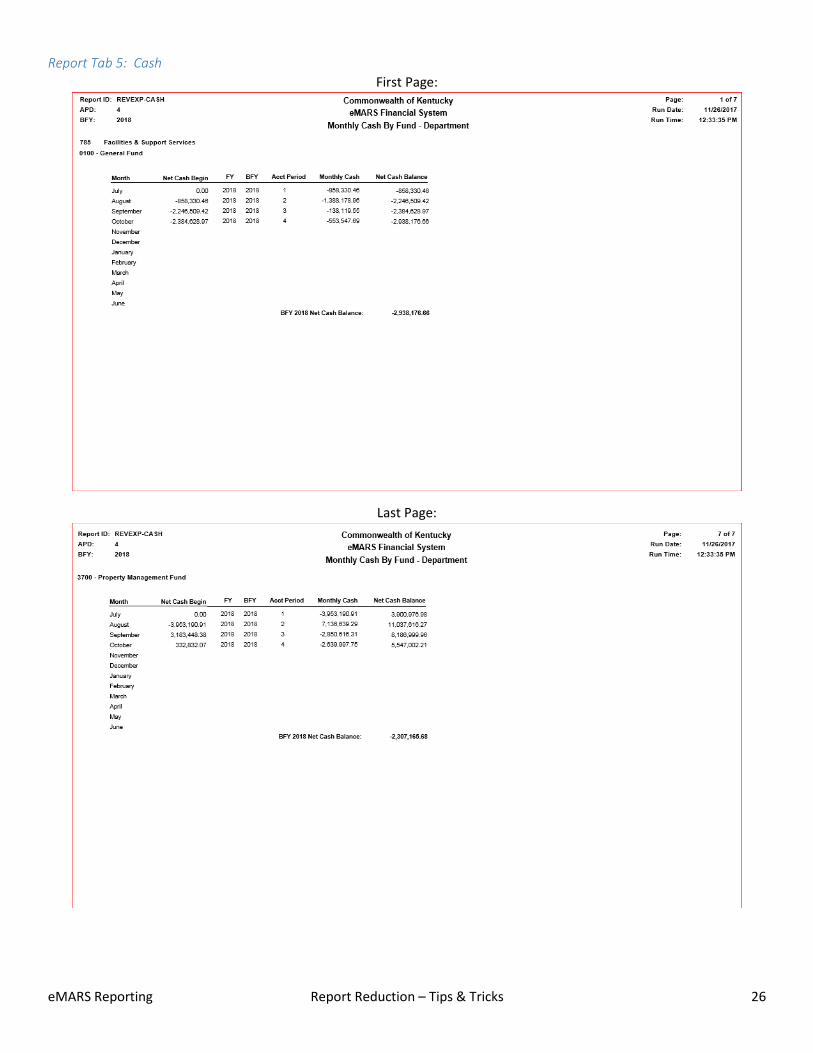
Report Tab 5: Cash First Page:
Last Page:
eMARS Reporting Report Reduction – Tips & Tricks 27
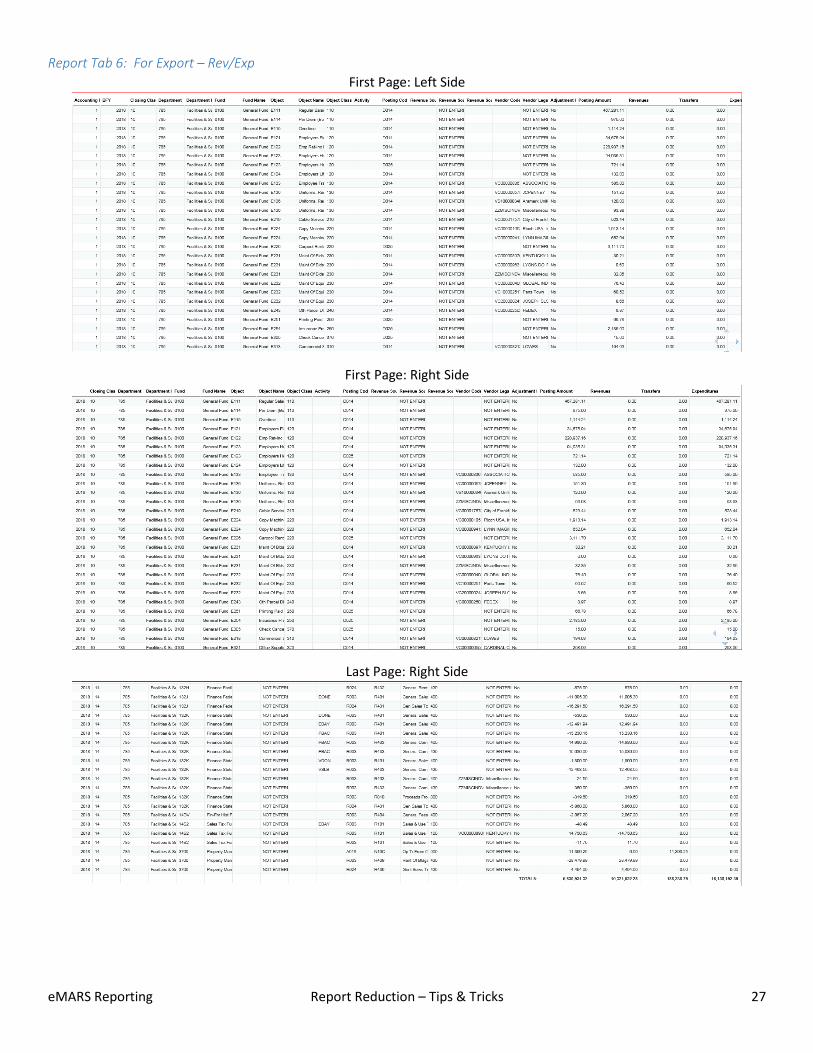
Report Tab 6: For Export – Rev/Exp First Page: Left Side
First Page: Right Side
Last Page: Right Side
eMARS Reporting Report Reduction – Tips & Tricks 28
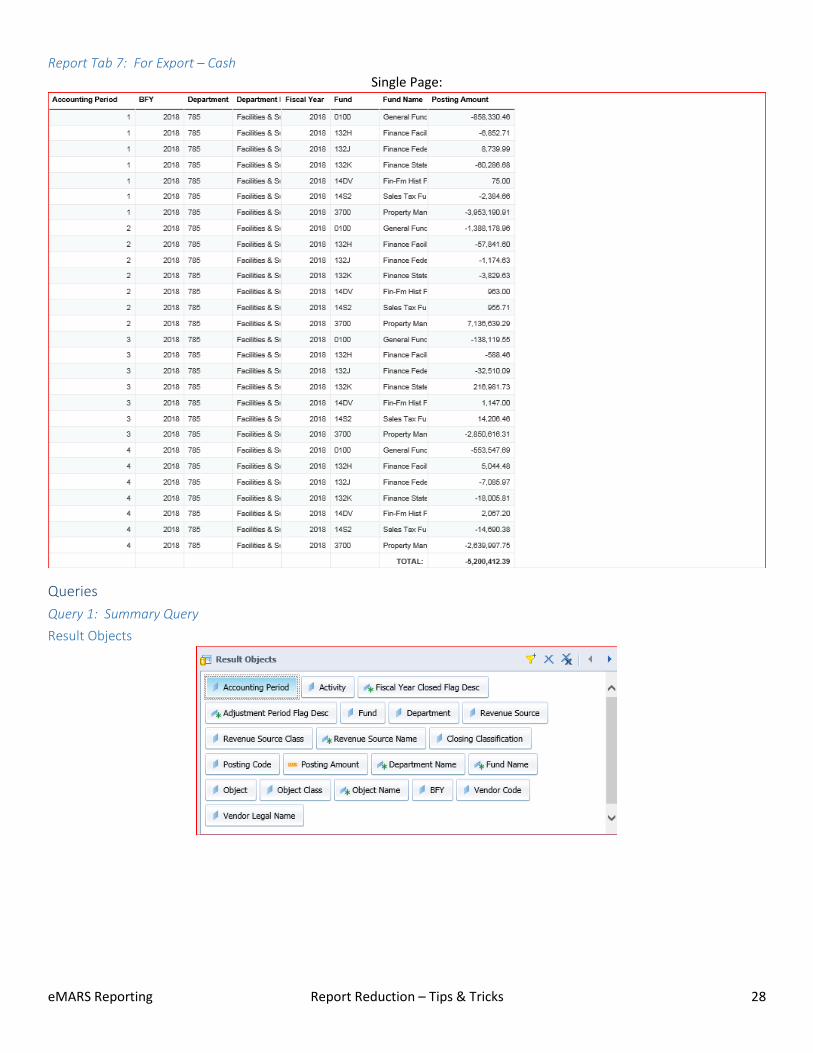
Report Tab 7: For Export – Cash Single Page:
Queries Query 1: Summary Query Result Objects
eMARS Reporting Report Reduction – Tips & Tricks 29
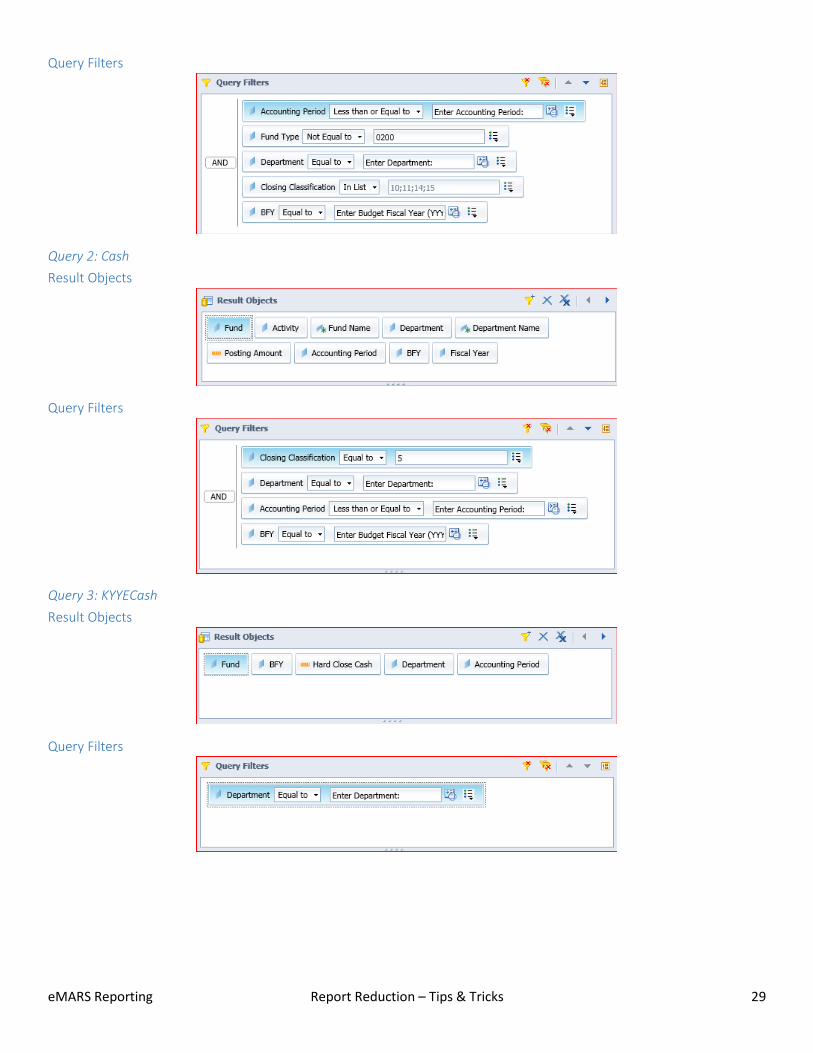
Query Filters
Query 2: Cash Result Objects
Query Filters
Query 3: KYYECash Result Objects
Query Filters
eMARS Reporting Report Reduction – Tips & Tricks 30
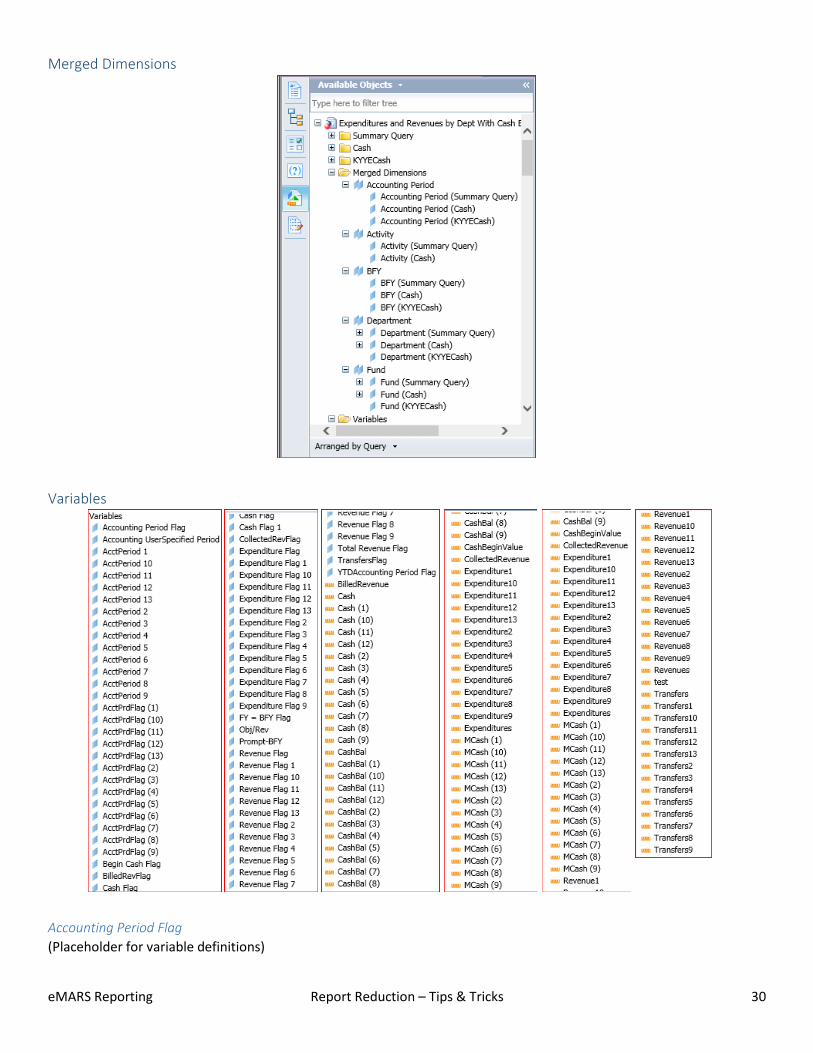
Merged Dimensions
Variables
Accounting Period Flag (Placeholder for variable definitions)
eMARS Reporting Report Reduction – Tips & Tricks 31
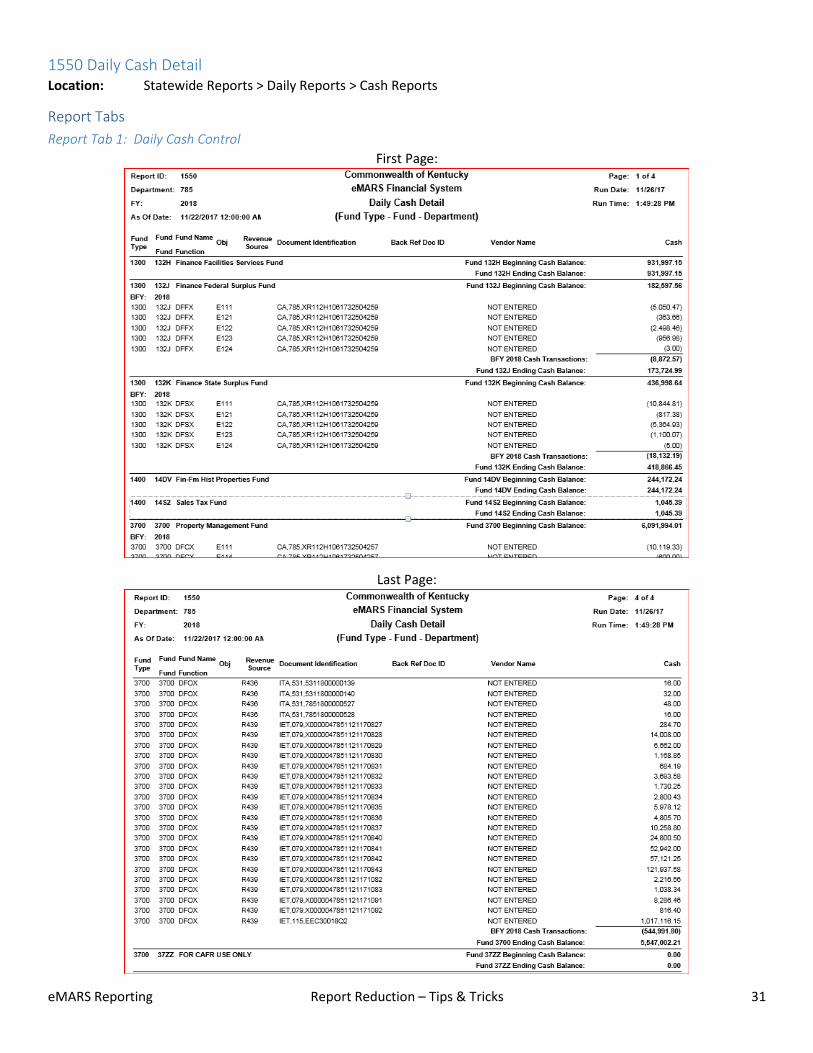
1550 Daily Cash Detail Location: Statewide Reports > Daily Reports > Cash Reports
Report Tabs Report Tab 1: Daily Cash Control
First Page:
Last Page:
eMARS Reporting Report Reduction – Tips & Tricks 32
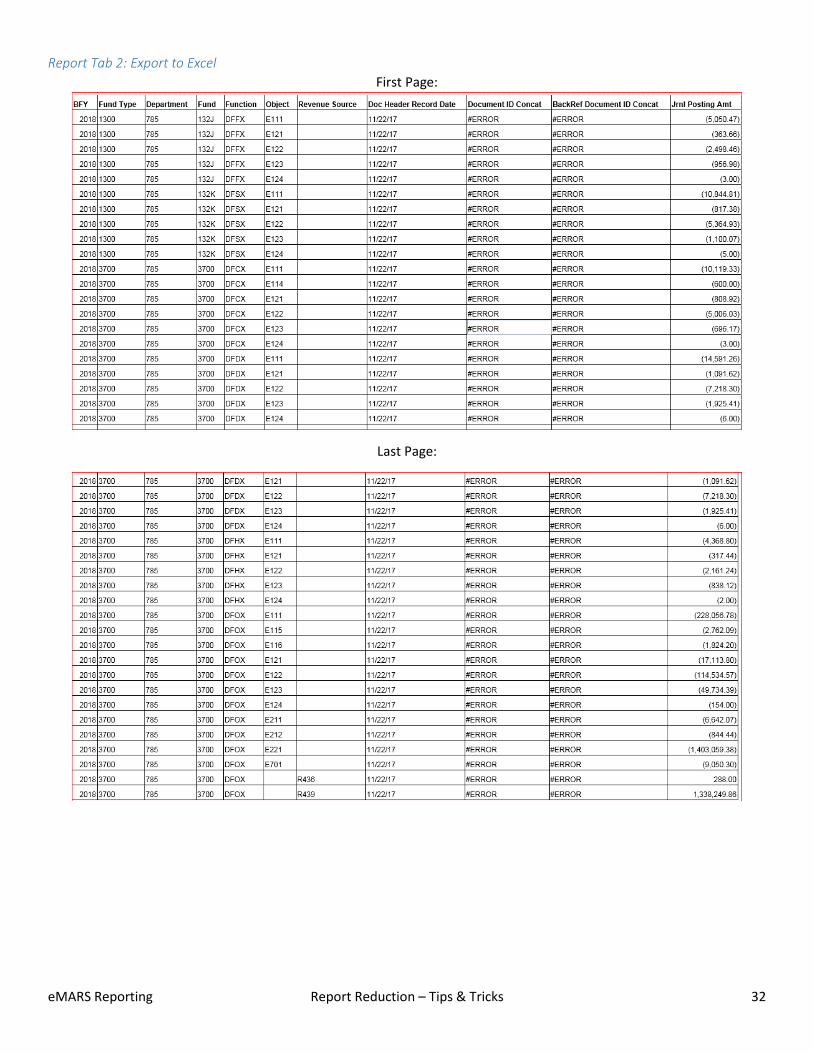
Report Tab 2: Export to Excel First Page:
Last Page:
eMARS Reporting Report Reduction – Tips & Tricks 33
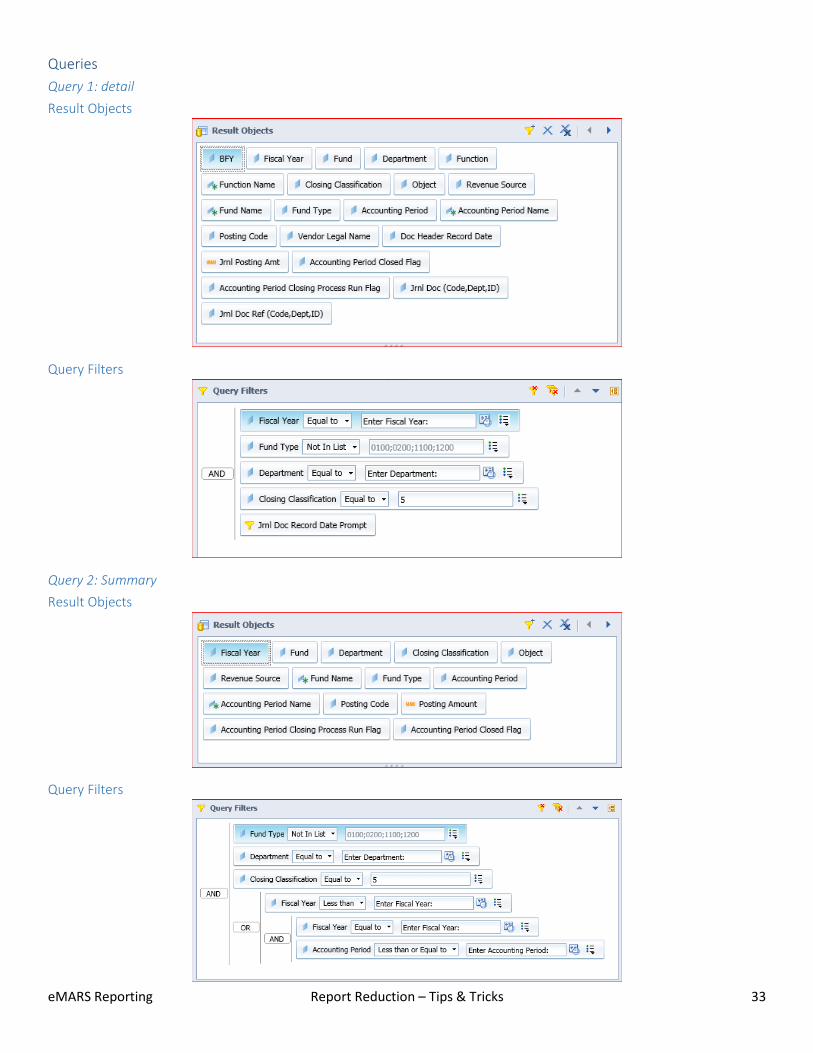
Queries Query 1: detail Result Objects
Query Filters
Query 2: Summary Result Objects
Query Filters
eMARS Reporting Report Reduction – Tips & Tricks 34
Merged Dimensions
Variables
BackRef Document ID Concat (Placeholder for variable definitions)


![Hypnosis and posthypnotic suggestions[3] · HYPNOSIS AND POSTHYPNOTIC SUGGESTIONS Lars-Erik Unestål. Ph.D. Uppsala University CHAPTER III. POSTHYPNOTIC SUGGESTIONS Posthypnotic Suggestions](https://img.pdfslide.us/doc/110x75/5e807de82eb6152f8c71e232/hypnosis-and-posthypnotic-suggestions3-hypnosis-and-posthypnotic-suggestions-lars-erik.jpg)