Embed Size (px)
Citation preview

For more information,
[email protected] or 617-253-7054 please visit our website at http://digital.mit.edu
or contact the Center directly at
A research and education initiative at the MIT Sloan School of Management
Email, Social Networks and Performance: An Econometric Case Study
Paper 233 Nathaniel Bulkley Marshall Van Alstyne
July 2007
Email, Social Networks and Performance: An Econometric Case Study
Nathaniel Bulkley University of Illinois, Urbana-Champaign
Marshall Van Alstyne Boston University & MIT
Abstract: This research investigates the efficient use of social networks by a specific
group of white collar workers. Using a unique data set containing email patterns and
accounting records for several dozen executive recruiters, we examine two existing
theories relating network position and tie strength to performance. A structural holes
argument suggests recruiters who cultivate more diverse contacts will be higher
performers based on a greater ability to identify novel combinations of information. A
transfer argument suggests recruiters who maintain strong ties with teammates will be
higher performers based on a greater ability to exchange complex information. We find
statistically significant relationships between email and performance measures that are
consistent with these theories. But recruiters’ general perceptions of communication with
colleagues over email do not correlate with performance. Direct measures of
communication show greater predictive power than self-reports of time and value.
Further, communication networks are better predictors than contract networks. We
conclude that the analysis of electronic archival data on communication networks offers
significant opportunities for improving performance.
An earlier version of this paper received the International Network for Social Network Analysis/Visible Path award for best paper on social networks and organizational performance (Sunbelt 2006). For helpful comments and suggestions, the authors thank Wayne Baker, Michael Cohen, Jerry Davis, Ed Rothman, Jun Zhang and participants in the University of Chicago Graduate School of Business Organizations and Markets Workshop. Van Alstyne gratefully acknowledges financial support from NSF Career Award 9876233 and France Telecom.
1
Businesses provide workers with email, Blackberries, instant messaging, cell phones,
and social networking tools with the expectation of improving performance. Social
interactions are increasingly mediated through these technologies. Despite the implied
importance for organizational activity, very little empirical evidence connects communication
networks to individual performance (Weber 2004). This research describes an econometric
case study that examines how internal email patterns of executive recruiters relate to
individual output.
Two significant obstacles contribute to the absence of prior evidence. White collar
output is notoriously hard to measure. And, direct observation of communications inputs
must confront challenges of access, interference, security, and privacy. To address the first
challenge, we focus on a specific group of white collar professionals who generate
measurable contract revenues. To address the second, we developed original data capture
techniques that we deployed in a working organization. These choices allow us to directly
observe communications activity and identify relationships among social networks, IT use,
and individual output.
We test two hypotheses relating recruiters’ email communication to their performance.
A structural holes argument suggests recruiters who cultivate a diversity of contacts will be
higher performers because they can bridge pools of novel information (Burt 1992; 2000;
2004; 2005). A transfer argument suggests that recruiters who also maintain stronger ties with
teammates will be higher performers because this enables them to exchange complex
information more effectively (Hansen 1999). Using survey data, we also consider how these
results compare to recruiters’ own perceptions of communication with colleagues over email.
We find statistically significant relationships between direct measures of internal
communication and individual performance that are consistent with existing social network
theories. But recruiters’ general perceptions regarding the time spent and value received from
communicating with colleagues and over email are not positively related to performance. Our
explanation for the difference in outcomes associated with self-reported versus direct
measures of communication is that locally perceived attributes may not be as predictive as
global phenomena that are harder for individuals to observe. We also analyze the social
networks implied by working on joint projects. Ironically, the communication networks are
better predictors of performance than even these contract networks. The mismatch between
1
subjective individual perceptions and independent direct measures implies that making
“invisible work visible” (Cross, Borgatti et al. 2002) has significant potential to improve
performance.
We begin with a brief review of existing theory on structural holes, weak ties, and
search-transfer, then move to a description of the research setting, which includes details of
secondary analyses we conducted to understand how recruiters use email professionally.
Next, we develop specific hypotheses applied to email data and provide results of hypothesis
tests. Discussion provides interpretation as well as highlights of novel findings. We conclude
by reflecting on key research issues that arise in relating performance to social network
measures based on electronic records.
THEORY
The theory of weak ties put forward by Granovetter (1973; 1983) suggests that remote
or infrequent relationships provide access to new information. Weak ties are more likely to
bridge disconnected groups enabling access to information not found in familiar social circles.
Burt (1992) refines this argument by suggesting the mechanism involves spanning non-
overlapping information structures, not tie strength per se. Bridging a larger “structural hole”
provides the explanation for access to more novel information. It also provides control. In the
context of executive recruiting, serving as a bridge across a structural hole enables greater
access to and control over information. Structural holes therefore represent a natural focus of
our attention for predicting output.
Hansen’s (1999) search-transfer hypothesis argues for additional benefits of strong ties
with teammates. When information is complex, meaning either interdependent or tacit,
transferring it from one context to another becomes difficult without strong ties to support
interpretation. Weak ties, although sufficient for locating information, can be insufficient for
moving complex information. In this case, information can become “sticky” (Von Hipple
1994) or “balkanized” (Van Alstyne and Brynjolfsson 2005). This leads us to examine tie
strength expressed as the frequency of interaction.
Research on professionals who communicate frequently via email suggests they often
intersperse messages with phone and face-to-face conversations, a phenomenon Markus
(1994) calls “channel-switching.” Professionals make the most of email to schedule
2
meetings or offer critical or timely information, then meet face-to-face or call to address the
remaining transfer problem.
Channel switching implies that interactions between email and communication in
other media may be relevant. If patterns of more frequent email communication are strongly
positively correlated with in-depth exchanges in other media, then email measures of
responsiveness may act as proxies for tie strength effects in more dimensions than simply
frequency of interaction. For example, more frequent interactions among team members may
lead them to develop shared context or common ground (Weick 1979; Clark and Brennan
1991; Weick 1995). This would facilitate knowledge transfer.
Studies of informant inaccuracy highlight problems with subject reactivity and recall
errors in surveys (Webb, Campbell et al. 1981; Bernard, Killworth et al. 1984; Marsden
1990). Further, individuals may not be able to accurately discern global network structure
from local information (Kleinberg 2001). Perceptual gaps can arise because the worms’ eye
view from one person’s inbox may not represent the birds’ eye view of the population post
office. To address errors from both subjectivity and non-observability, we used direct
measures of communication across the population. Email data provided us with accurate fine
grained measures of point-to-point volume, frequency, response delays (and non-response)
and message size. These provide highly accurate local and global social network measures.
Early applications of electronic archival data focused on questions other than
performance, such as the role of social networks in the adoption of technologies and
legitimating the study of online interactions as social networks (Rice, Grant et al. 1990; Rice
1994; Haythornthwaite 1996; Wellman 1996; Garton, Haythornthwaite et al. 1999; Wellman
2001). Researchers also examined how emergent media were used to support relationships
and interactions with other media, often using theoretical frames such as media richness and
social definition theories (Feldman 1986; Mackay 1989; Markus 1990; McKenney, Zack et al.
1992; Markus 1994; Rice 1994; Hinds and Kiesler 1995; Ducheneaut and Bellotti 2001). As
technologies that provide sources of electronic archival data become institutionalized,
researchers can treat communication strategies as variables of interest and test hypothesized
relationships with performance. This opportunity motivates our analysis of relationships
between email patterns and performance in the context of an executive search firm.
3
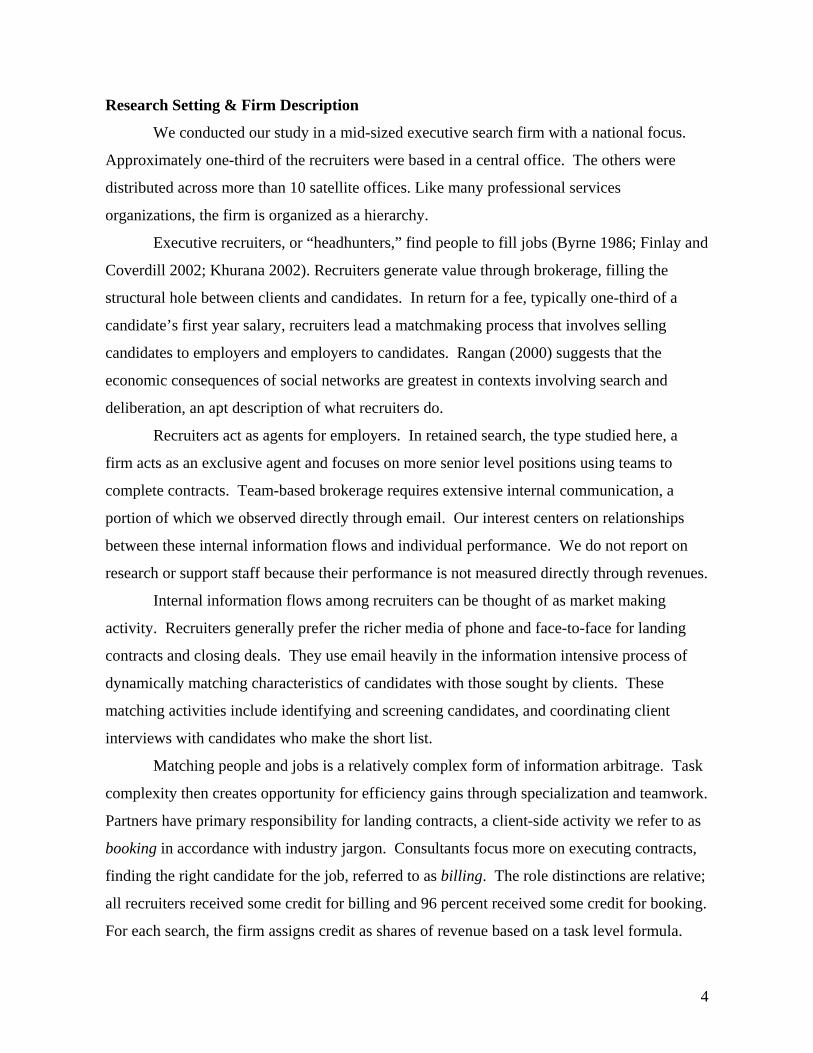
Research Setting & Firm Description
We conducted our study in a mid-sized executive search firm with a national focus.
Approximately one-third of the recruiters were based in a central office. The others were
distributed across more than 10 satellite offices. Like many professional services
organizations, the firm is organized as a hierarchy.
Executive recruiters, or “headhunters,” find people to fill jobs (Byrne 1986; Finlay and
Coverdill 2002; Khurana 2002). Recruiters generate value through brokerage, filling the
structural hole between clients and candidates. In return for a fee, typically one-third of a
candidate’s first year salary, recruiters lead a matchmaking process that involves selling
candidates to employers and employers to candidates. Rangan (2000) suggests that the
economic consequences of social networks are greatest in contexts involving search and
deliberation, an apt description of what recruiters do.
Recruiters act as agents for employers. In retained search, the type studied here, a
firm acts as an exclusive agent and focuses on more senior level positions using teams to
complete contracts. Team-based brokerage requires extensive internal communication, a
portion of which we observed directly through email. Our interest centers on relationships
between these internal information flows and individual performance. We do not report on
research or support staff because their performance is not measured directly through revenues.
Internal information flows among recruiters can be thought of as market making
activity. Recruiters generally prefer the richer media of phone and face-to-face for landing
contracts and closing deals. They use email heavily in the information intensive process of
dynamically matching characteristics of candidates with those sought by clients. These
matching activities include identifying and screening candidates, and coordinating client
interviews with candidates who make the short list.
Matching people and jobs is a relatively complex form of information arbitrage. Task
complexity then creates opportunity for efficiency gains through specialization and teamwork.
Partners have primary responsibility for landing contracts, a client-side activity we refer to as
booking in accordance with industry jargon. Consultants focus more on executing contracts,
finding the right candidate for the job, referred to as billing. The role distinctions are relative;
all recruiters received some credit for billing and 96 percent received some credit for booking.
For each search, the firm assigns credit as shares of revenue based on a task level formula.
4

Using accounting data at the level of search contracts, we measured individual performance
directly as billing and booking revenue.
The modal team is composed of a partner and a consultant. No recruiter operated
solely as a lone wolf and teams frequently reconfigured around demands of new assignments.
Two person teams conducted sixty percent of searches, slightly under one third were solo
searches. Three or more person teams conducted the remainder.
Recruiting teams must manage temporal interdependencies (Thompson 1967). For
example, the value of information regarding a third candidate on a short list is dependent on
the viability of the top two. When one team member uncovers information updating either the
client or candidate side of the search (e.g. neither of the top two candidates are willing to
move), this information often has implications for the other team member’s work. As an
asynchronous medium, email provides a means for frequent updates within teams. Common
ground facilitates a team’s ability to identify better matches using difficult to codify criteria
such as personal “chemistry” (Finlay and Coverdill 2002). More frequent email
communication may be associated with common ground, particularly if email activity is
positively correlated with communication in richer media.
Using email to measure internal communication
Our analyses provided significant evidence supporting the interpretation of email
measures as proxies for more general communication patterns even though email use in
organizations is context specific (Rice 1994). We relied on analyses based on secondary data,
including interviews, to develop our understanding of how recruiters use email (Webb,
Campbell et al. 1981; Bulkley 2006).1
Recruiters were extremely responsive to colleagues over email, using the medium as if
it were instant messaging.2 They use email extensively to coordinate searches.3 We found no
consistent evidence that recruiters who were collocated exchanged either more or fewer
1 Data we used for these analyses included survey self-reports of communication by medium (average number of people communicated with per day, proportion of time spent, proportion of value received), records of project assignments and records of the office locations of individual recruiters. 2 When we divided response times into 30 minute intervals, we found modal response time to colleagues for all recruiters except one was 0-30 minutes. 3 More than 60 percent of the messages exchanged between revenue generating recruiters occurred while they had one or more active searches in common. Results from a model that predicts the number of emails sent between any two recruiters further supports our claim. Variables related to the number of weeks recruiters worked together on searches are the most significant predictors of the number of messages exchanged. In addition, all recruiters who worked together on searches exchanged some email.
5

messages.4 The most prolific email communicators were the most prolific communications
across all media.5
We do not mean to suggest that email is a perfect proxy for internal communication
patterns. In the discussion, we present evidence regarding correlates of our email measures
that suggest factors such as technological complementarities and media interactions that may
also play a role in explaining individual performance differences. Our analyses led us to
believe that five older and more senior partners exhibited a preference for media other than
email to communicate with colleagues. We also identified significant concerns with using
email measures of external communication. But the results of our analyses suggested that
email data provide reasonably valid indicators of which colleagues recruiters interact with
(network position) and the frequency of their interaction (tie strength).
To summarize, we selected this research setting for three reasons: (1) theory suggests
strong relationships between social networks and individual performance; (2) we were able to
directly measure a significant component of internal communication through records of email
traffic; and (3) contract revenues provide direct measures of individual performance.
HYPOTHESES
Network position
Focusing on structural holes (Burt 1992; 2005), both access to and control over
information are relevant in recruiting. Interviews, however, suggest the benefits of position in
the internal email network are predominantly associated with better access to information.
Better access gives recruiters more options: awareness of a greater number of candidates,
more timely recognition of opportunities, and referrals and scripts that facilitate sales. Not all
options will be useful in any given search, but valuable options that would otherwise lie
undiscovered are likely to be exercised based on better access to information. This argument
suggests a positive association between the effective size of structural holes in the internal
email network and performance. Reverse causality is also possible. Recruiters who are more
effective performers, particularly those who have more productive relationships with clients,
may be more sought after by their peers. We hypothesize that the search benefits of structural 4 This claim is supported by correlation analyses involving individual percentages of collocated searches (collocated tasks) and ANOVA results comparing recruiters in the central office to those in satellite offices (physical presence of colleagues). 5 Measured email activity was correlated with self-reported estimates of the number of people communicated with per day across all media (p < 0.01).
6

holes at the level of weak ties across all email communication with colleagues will show a
positive correlation with both billing and booking revenue.
We also consider the effective size of structural holes in terms of both the email
network and the formal network. We define the latter in terms of recruiters who worked
together on search contracts during the study period. Studies of email networks in other
contexts suggest they often contain many weak ties not present in the formal network,
particularly geographically dispersed ties (Feldman 1986; Finholt and Sproull 1990).
Research on communication networks suggests informal networks may be better predictors of
performance, since the resources individuals rely on to do their jobs are often found outside
the formal chain of command (Krackhardt and Hanson 1993; Monge and Contractor 1999;
2003). This leads to the following hypotheses: Hypothesis 1a: The effective size of structural holes in a recruiter’s internal email network will be positively related to revenue. Hypothesis 1b: The relationship between the effective size of structural holes and revenue will be stronger with respect to the email network than the contract network.
We tested the effects of network position with respect to the email and contract
networks separately because of problems with co-linearity. All recruiters who worked
together on searches during the study exchanged some email, so the contract network is a
subset of the email network.
While we believe Burt’s theory of structural holes provides the best theoretical
explanation for a relationship between position and performance in the recruiting context, we
test two additional measures of position in a network, betweenness and indegree, to assess
whether the hypothesized effect is specific to structural holes or might be better characterized
as a general notion of centrality.
Information flows
Our strong tie hypothesis is that more frequent email exchanges among team members
will be positively associated with billing revenue. We argue that this is theoretically likely
because of the role more frequent email exchanges play in managing temporal
interdependencies. The primary measures we use to assess tie strength within teams are
response time, measured by interval length, and response completeness, measured by the
7

percentage of messages returned within a given interval.6 We use message size as a
secondary measure to investigate a related hypothesis that shorter more frequent email
communication outperforms longer less frequent communication in the context of team based
work.7 We would not expect to find relationships between the frequency or size of
communication with team members and booking revenue, since the coordination demands of
booking are typically lower. Nor would we expect to find similar relationships with non-team
email because these exchanges are less likely to depend on the transfer of complex
information.
We use response times to colleagues as our primary measure of tie strength.
Following the logic of the search transfer problem, we hypothesize a positive association
between strong ties among team members and billing revenue. To test whether strong ties
provide an additional benefit (theoretically attributed to the transfer of complex information)
over search benefits associated with weak ties, we control for the latter. We also test for
similar effects of email size to investigate a secondary hypothesis based on a queuing theory
model of information flow that suggests shorter more frequent email communication may
outperform longer less frequent communication in the context of team based work.
Hypothesis 2a: Controlling for network position, longer average response times to teammates will be negatively related to billing revenue. Hypothesis 2b: Controlling for network position, sending longer average emails to teammates will be negatively related to billing revenue. To test discriminant validity, we investigate similar relationships involving non-team
email and booking revenue, contexts in which we do not expect that effects related to the
transfer of complex information would significantly influence performance (Cook and
Campbell 1979).
6 Results based on response completeness measures can be found in Bulkley (2006). 7 This idea was motivated by a human analogy with a queuing theory problem involving the division of a volume of information into messages. One strategy for using email involves batching communication, resulting in longer messages and less frequent interactions. We hypothesized that the alternative strategy, more frequent interactions and shorter messages within search teams would be positively related to performance in executing search contracts. Load balancing models of queuing and network flow imply that short jobs can be swapped in and attended to more quickly than long jobs of the same priority. A natural analog for email might be a tendency of people to postpone or defer long messages until they have free time.
8

Fig. 1 The entire email network with nodes scaled by booking revenue. In H1, we propose that the effective size of structural holes will be associated with higher performance. The smaller size of more peripheral nodes suggests this association.
Fig. 2 Email exchanged between team members withnodes scaled by billing revenue. Thicker and darker lines correspond to shorter average gaps between messages. In H2, we propose that longer average response times to teammates will be negatively associated with billing revenue. This association is reflected by larger nodes connected by thicker lines and smaller nodes connected by thinner lines.
9

METHOD Data
We based our analysis on a three-part dataset consisting of an online survey,
accounting data on search contracts and six months of e-mail traffic. Participation rates for
each of the three parts were over 80 percent. A total of 29 consultants, 27 partners, 13
researchers and 2 information technology staffers participated in at least one of the parts.
Models used in testing our hypotheses are based on a population of 47 recruiters (22 partners
and 25 consultants). Recruiters who left the firm during the study or worked part-time were
not included in any of the models, although records of their email activity were used in
computing measures. As a result of survey non-response, the population for additional
models involving survey measures of media preferences and information sources is smaller (n
= 40).
The online survey consisted of 52 questions covering aspects of information
management including attitudes towards information sharing, types of information shared
(e.g. procedural vs. declarative), database use, compensation practices and proportions of time
spent and value gained from both information sources and modes of information gathering.
Output measures include booking revenue (associated with landing contracts) and
billing revenue (associated with executing contracts). Since more than one recruiter is
typically involved in executing and sometime landing a contract, total contract revenue is
apportioned based on shares that were calculated by the firm on the basis of tasks each
recruiter performed on the specific assignment. Contracts also identify the industry sector and
level of placed candidates, information we used to control for search quality.
We built new communication capture tools, tested them in a laboratory setting to
remove data deletion bias, server load interference, and security threats; and devised content
masking techniques to ensure participant privacy (Zhang and Van Alstyne 2003). Briefly, we
encrypted e-mail header and body information using one-way hash functions that permit
comparisons of similar tokens but not semantic interpretation of content. Although we have
full e-mail logs for a period of six months, participation was voluntary on an opt-out basis.
We provided incentive payments of $100 in Amazon gift certificates per person for consent.
This and CIO encouragement helped boost e-mail participation above 85 percent.
10

Because there was extensive communication between offices (approximately 50
percent of the messages were exchanged among co-located colleagues), we selected the firm
as the relevant network. In this paper, we focus solely on email communication among
consultants and partners. We also gathered email exchanged with researchers, staff and
external sources, which we could analyze in future work.
Measures
We provide descriptions and descriptive statistics for all measures used in testing
hypotheses in the Appendix.
Research Model and Hypothesis
We tested the hypotheses outlined in the theory section using the following linear
regression model:
' '
i i iQ α= + + + +H Xβ γ i iY eδThe determinants of output (Qi) in the equation above include: (Hi) controls for the
type of searches recruiters performed (two industry sector dummy variables and separate
percentages of CEO-level and solo searches); (Xi) human capital and organizational position
controls (years of experience and a dummy variable for whether a recruiter had made partner);
information behavioral treatments (Yi), constant (α) and error terms. Capital is included in the
constant term because we assume it is the same for all recruiters. We selected this linear
specification on the basis of comparisons with the common log-linear Cobb-Douglas
specification (Brynjolfsson and Hitt 1995), which included minimizing the variance estimator
and the PE test for log-linearity.
We began by fitting the base model composed of control variables, (Hi) and (Xi). We
then added behavioral treatment(s). Significant effects are indicated by statistically
significant changes in the F-statistic of the model. An overview of models as they relate to
specific hypotheses is given in the table below:
Dependent Variable
Controls Treatments
H0: Revenue Base model (years of experience, partner dummy, percentage of solo searches, percentage of CEO searches and 2 sector dummies)
H1: Revenue = Base model + Network structure H2: Revenue = Base model + Network structure + Email behaviors
11
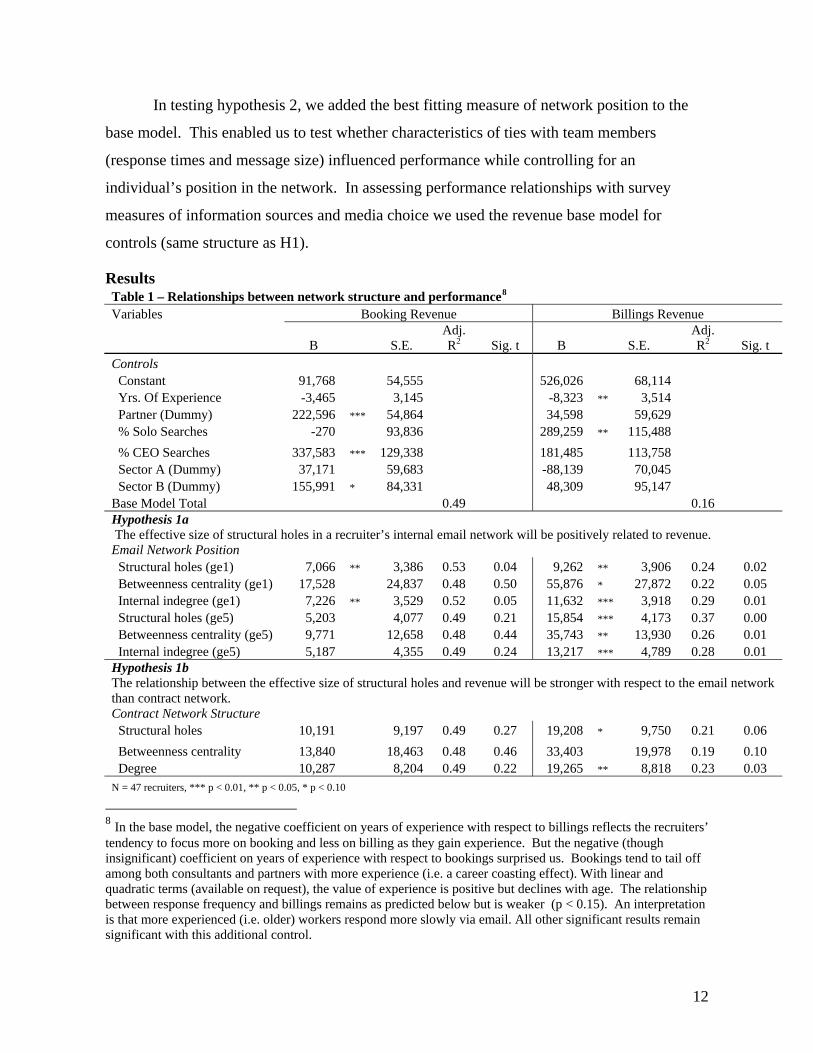
In testing hypothesis 2, we added the best fitting measure of network position to the
base model. This enabled us to test whether characteristics of ties with team members
(response times and message size) influenced performance while controlling for an
individual’s position in the network. In assessing performance relationships with survey
measures of information sources and media choice we used the revenue base model for
controls (same structure as H1).
Results Table 1 – Relationships between network structure and performance8 Variables Booking Revenue Billings Revenue
B S.E. Adj. R2 Sig. t B S.E.
Adj. R2 Sig. t
Controls Constant 91,768 54,555 526,026 68,114 Yrs. Of Experience -3,465 3,145 -8,323 ** 3,514 Partner (Dummy) 222,596 *** 54,864 34,598 59,629 % Solo Searches -270 93,836 289,259 ** 115,488 % CEO Searches 337,583 *** 129,338 181,485 113,758 Sector A (Dummy) 37,171 59,683 -88,139 70,045 Sector B (Dummy) 155,991 * 84,331 48,309 95,147 Base Model Total 0.49 0.16 Hypothesis 1a The effective size of structural holes in a recruiter’s internal email network will be positively related to revenue. Email Network Position Structural holes (ge1) 7,066 ** 3,386 0.53 0.04 9,262 ** 3,906 0.24 0.02 Betweenness centrality (ge1) 17,528 24,837 0.48 0.50 55,876 * 27,872 0.22 0.05 Internal indegree (ge1) 7,226 ** 3,529 0.52 0.05 11,632 *** 3,918 0.29 0.01 Structural holes (ge5) 5,203 4,077 0.49 0.21 15,854 *** 4,173 0.37 0.00 Betweenness centrality (ge5) 9,771 12,658 0.48 0.44 35,743 ** 13,930 0.26 0.01 Internal indegree (ge5) 5,187 4,355 0.49 0.24 13,217 *** 4,789 0.28 0.01 Hypothesis 1b The relationship between the effective size of structural holes and revenue will be stronger with respect to the email network than contract network. Contract Network Structure Structural holes 10,191 9,197 0.49 0.27 19,208 * 9,750 0.21 0.06 Betweenness centrality 13,840 18,463 0.48 0.46 33,403 19,978 0.19 0.10 Degree 10,287 8,204 0.49 0.22 19,265 ** 8,818 0.23 0.03 N = 47 recruiters, *** p < 0.01, ** p < 0.05, * p < 0.10
8 In the base model, the negative coefficient on years of experience with respect to billings reflects the recruiters’ tendency to focus more on booking and less on billing as they gain experience. But the negative (though insignificant) coefficient on years of experience with respect to bookings surprised us. Bookings tend to tail off among both consultants and partners with more experience (i.e. a career coasting effect). With linear and quadratic terms (available on request), the value of experience is positive but declines with age. The relationship between response frequency and billings remains as predicted below but is weaker (p < 0.15). An interpretation is that more experienced (i.e. older) workers respond more slowly via email. All other significant results remain significant with this additional control.
12
We found a statistically significant positive relationship between structural holes in the
email network and performance measured in terms of both booking revenue (landing
contracts) and billing revenue (executing contracts) as predicted by hypothesis 1a. For
bookings, statistical significance depended on the cutoff point above which the number of
email messages was interpreted as a link. Relationships were significant when measured over
all possible ties, but this often did not hold when the weakest ties were excluded. For billings,
the relationship was far less sensitive to the choice of cutoff point.9 The three centrality
metrics were highly correlated (Pearson’s ρ > 0.70, p < 0.001 at the same tie strength). The
weakest relationships usually involved betweenness centrality, while structural holes and
indegree exhibited similar relationships. On the basis of the best fit, we chose structural holes
at cutoffs of above one and five messages as the network structure controls we needed to test
hypothesis 2.
Corresponding metrics computed on the basis of shared search contracts alone were
insignificant with respect to booking revenue and less significant than email metrics with
respect to billings revenue (hypothesis 1b). A comparison of results from separate models (1a
and 1b) suggests relationships between position in the email network and performance are not
merely a reflection of the structure of the formal contract network, despite considerable
overlap between email and contract ties.
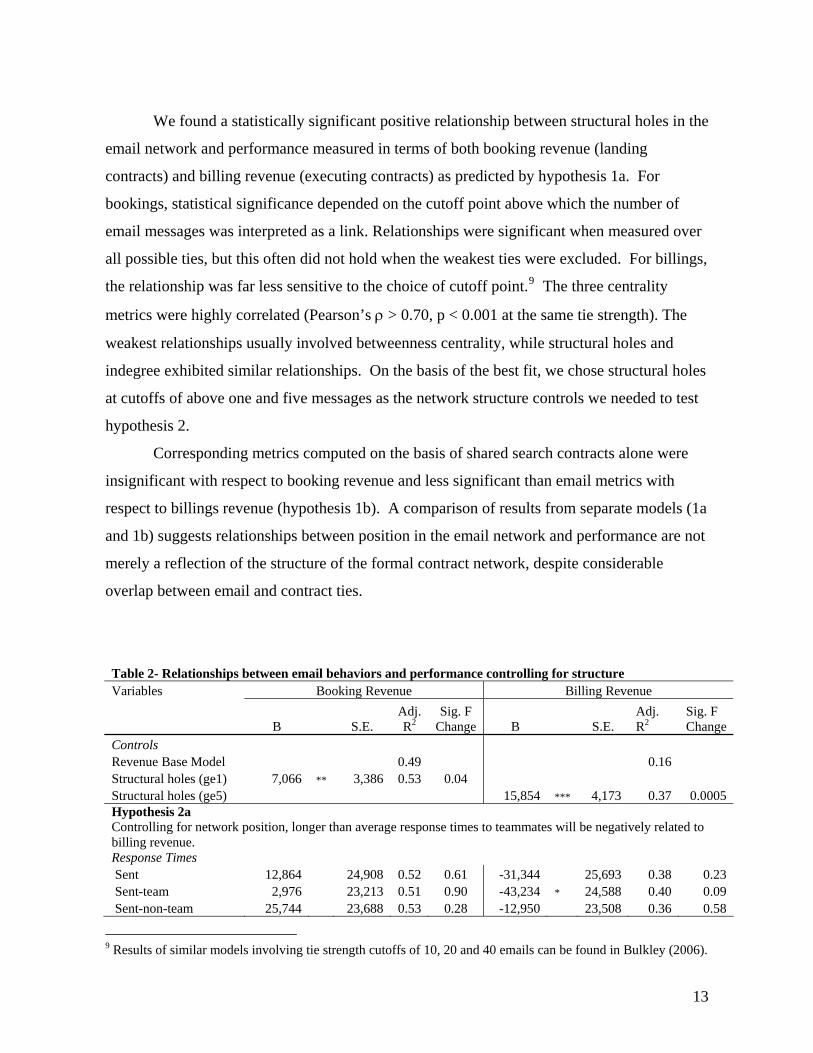
Table 2- Relationships between email behaviors and performance controlling for structure Variables Booking Revenue Billing Revenue
B S.E. Adj. R2
Sig. F Change B S.E.
Adj. R2
Sig. F Change
Controls Revenue Base Model 0.49 0.16 Structural holes (ge1) 7,066 ** 3,386 0.53 0.04 Structural holes (ge5) 15,854 *** 4,173 0.37 0.0005 Hypothesis 2a Controlling for network position, longer than average response times to teammates will be negatively related to billing revenue. Response Times Sent 12,864 24,908 0.52 0.61 -31,344 25,693 0.38 0.23 Sent-team 2,976 23,213 0.51 0.90 -43,234 * 24,588 0.40 0.09 Sent-non-team 25,744 23,688 0.53 0.28 -12,950 23,508 0.36 0.58
9 Results of similar models involving tie strength cutoffs of 10, 20 and 40 emails can be found in Bulkley (2006).
13

Hypothesis 2b Controlling for network position, sending longer than average emails will be negatively related to billing revenue. Email Size Sent -5,306 44,463 0.51 0.91 -97,108 ** 41,864 0.43 0.03 Sent-team 11,293 38,880 0.51 0.77 -93,494 ** 36,457 0.45 0.01 Sent-non-team -12,355 44,523 0.51 0.78 -84,824 * 42,649 0.41 0.05 N = 47 recruiters, *** p < 0.01, ** p < 0.05, * p < 0.10 Strongest structural predictor is effective size of structural holes at ge1 for booking revenue and ge5 for billing revenue.
Taking a longer time to respond and sending longer emails to teammates (on average)
was negatively related to billing revenue (executing contracts) at statistically significant
levels. Results shown in table 2 include the best fitting measure of network structure
associated with the two types of revenue added as controls. We also obtained statistically
significant results without these controls. Additional analyses suggested that relationships
between the size of messages sent to teammates and performance is more strongly related to
the percentage of messages sent with attachments than the size of the text portion of the
messages. Relationships with booking revenue were insignificant and relationships based on
team email measures were stronger than those based on non-team email measures.
14
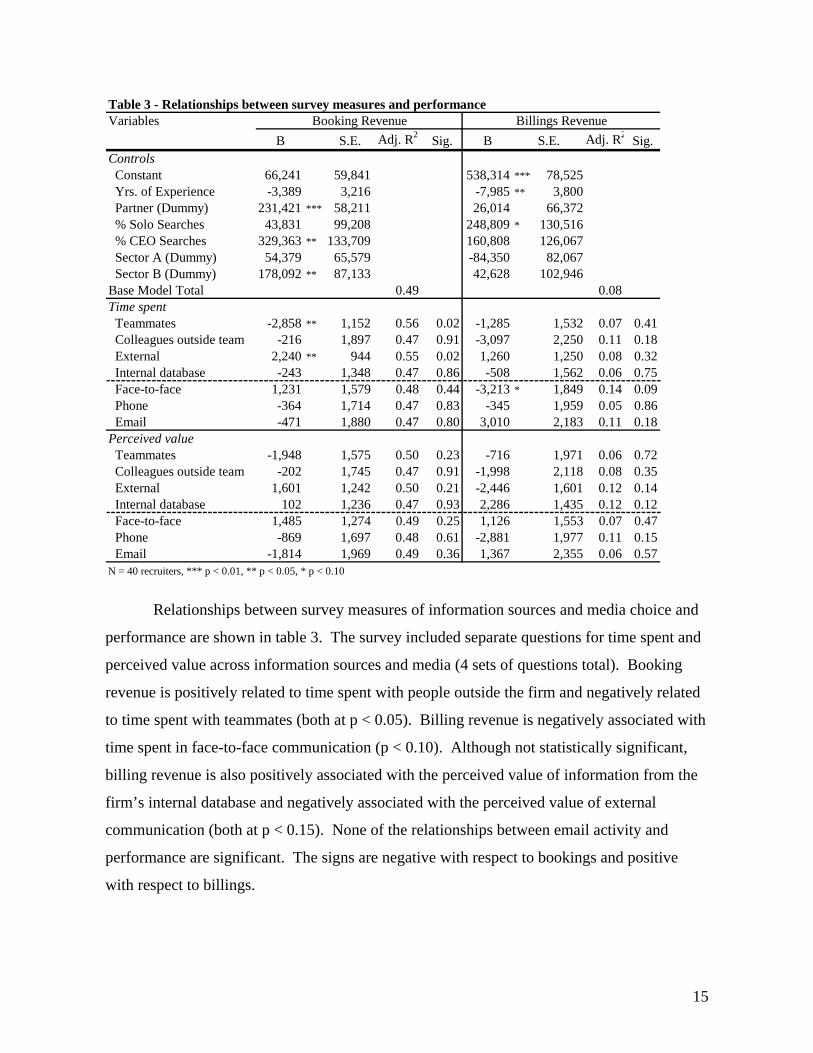
Table 3 - Relationships between survey measures and performanceVariables
B S.E. Adj. R2 Sig. B S.E. Adj. R2 Sig.Controls Constant 66,241 59,841 538,314 *** 78,525 Yrs. of Experience -3,389 3,216 -7,985 ** 3,800 Partner (Dummy) 231,421 *** 58,211 26,014 66,372 % Solo Searches 43,831 99,208 248,809 * 130,516 % CEO Searches 329,363 ** 133,709 160,808 126,067 Sector A (Dummy) 54,379 65,579 -84,350 82,067 Sector B (Dummy) 178,092 ** 87,133 42,628 102,946Base Model Total 0.49 0.08Time spent Teammates -2,858 ** 1,152 0.56 0.02 -1,285 1,532 0.07 0.41 Colleagues outside team -216 1,897 0.47 0.91 -3,097 2,250 0.11 0.18 External 2,240 ** 944 0.55 0.02 1,260 1,250 0.08 0.32 Internal database -243 1,348 0.47 0.86 -508 1,562 0.06 0.75 Face-to-face 1,231 1,579 0.48 0.44 -3,213 * 1,849 0.14 0.09 Phone -364 1,714 0.47 0.83 -345 1,959 0.05 0.86 Email -471 1,880 0.47 0.80 3,010 2,183 0.11 0.18Perceived value Teammates -1,948 1,575 0.50 0.23 -716 1,971 0.06 0.72 Colleagues outside team -202 1,745 0.47 0.91 -1,998 2,118 0.08 0.35 External 1,601 1,242 0.50 0.21 -2,446 1,601 0.12 0.14 Internal database 102 1,236 0.47 0.93 2,286 1,435 0.12 0.12 Face-to-face 1,485 1,274 0.49 0.25 1,126 1,553 0.07 0.47 Phone -869 1,697 0.48 0.61 -2,881 1,977 0.11 0.15 Email -1,814 1,969 0.49 0.36 1,367 2,355 0.06 0.57N = 40 recruiters, *** p < 0.01, ** p < 0.05, * p < 0.10
Booking Revenue Billings Revenue
Relationships between survey measures of information sources and media choice and
performance are shown in table 3. The survey included separate questions for time spent and
perceived value across information sources and media (4 sets of questions total). Booking
revenue is positively related to time spent with people outside the firm and negatively related
to time spent with teammates (both at p < 0.05). Billing revenue is negatively associated with
time spent in face-to-face communication (p < 0.10). Although not statistically significant,
billing revenue is also positively associated with the perceived value of information from the
firm’s internal database and negatively associated with the perceived value of external
communication (both at p < 0.15). None of the relationships between email activity and
performance are significant. The signs are negative with respect to bookings and positive
with respect to billings.
15
DISCUSSION
Using direct email measures, we found relationships between network position,
internal information flows and individual performance that are consistent with two predictions
from social network theories. In the recruiting setting, internal communication with
colleagues can be interpreted as a market making activity that predicts performance. Within
this context, we infer specific roles for weak and strong ties.
Research in other settings suggests professionals use email to maintain weak ties
(Feldman 1986; Finholt and Sproull 1990). Weak ties provide access to diverse information
sources. By maintaining a broader base of relationships, recruiters are likely to learn of more
opportunities and receive this information sooner. They may become aware of new
techniques, such as scripts that facilitate sales, and recent personnel moves that suggest
potential clients. Hypothesis 1 results provide statistical support for this theoretical argument
within the recruiting context.
We instrumented the diversity of sources as structural holes. We observed similar
relationships between performance and an indegree measure of position in the email network.
As a result, we interpret the effect as a general relationship between a central email position
and performance, as opposed to a specific feature of structural holes. An inability to make
meaningful distinctions among highly correlated measures of network position is not
uncommon when networks exhibit high density. A central position in the full email network
was associated with performance in both dimensions. A central position in the strong tie
network was associated with billing, but not booking revenue.10
Strong ties provide support for the transfer of complex information. More frequent
email communication with teammates may improve recruiters’ abilities to manage temporal
interdependence. In search teams, the value of one team member’s information is often
contingent on what other teammates know. More frequent updating may also facilitate the
more timely identification and resolution of problems. Our hypothesis 2 results provide
support for this theoretical argument. Strong email ties with teammates, defined by
interaction frequency, were positively associated with billing revenue controlling for the weak
tie effects of network position. Results involving non-team email and bookings provide
10 As we previously noted, with respect to booking revenue coefficients became less significant when we dropped weak ties by raising the cutoff for the minimum number of emails needed to signify a link.
16
evidence of discriminant validity. Other intra-organizational communication studies have
also found positive relationships between the frequency of team communication and
performance (Allen 1977; Brown and Eisenhardt 1995).
Taken together, Hypothesis 1 and 2 results provide evidence that certain email profiles
are consistent with higher performance. They suggest professionals receive news benefits
from weak tie bridges outside a team and transfer benefits from strong tie interactions within a
team. If social ties have opportunity costs, recognizing these two types of benefits may be the
first step towards developing an optimal email networking strategy. Results from secondary
analyses that follow hint at opportunities for fine-tuning based on the nature of tasks and
balance of interactions across media.
We used survey measures to evaluate relationships between information and
performance that were difficult to measure through email. We found that neither spending
more time communicating with colleagues nor associating a higher relative value with email
as a medium was related to performance at statistically significant levels.
Statistically significant survey measures reveal a pattern consistent with activities that
are likely to matter most in the performance dimensions of booking and billing. In Table 3,
higher booking revenue was associated with more external communication and less team
communication. Booking involves negotiation with clients outside the firm and a single
recruiter typically acts as the point person. This often requires direct interaction either in
person or on the phone. In contrast, higher billing revenue was associated with spending more
time on email and less time face-to-face. As a synchronous medium, face time is too time
intensive to juggle multiple contacts — mass meetings to screen candidates do not happen. In
performance terms, the association between billings and time spent on email is likely to
involve asynchronous multitasking while the association between bookings and time spent
communicating externally is likely to involve synchronous negotiation.
Our use of email data to trace interaction patterns that define a social network has
parallels with network surveys. At the same time, we can identify specific advantages of
using email as opposed to surveys as a network data source. As an interaction level data
source, email has a finer grain than surveys. This makes it possible to accurately determine
measures such as response patterns (e.g. lag times and sizes), initiating contact, and exact
frequency. This research improves our understanding of performance by demonstrating that
17

network behaviors, involving objective fine-grained properties of information flows, predict
output. Additional analyses suggest that it is not so much the immediacy of an email response
that matters, but rather a pattern of more regular email contact among team members. For
example, an alternative specification of responsiveness, based on proportion of messages
returned within a specific interval, provides the statistically strongest prediction of
performance for a time interval of one day.
Informant inaccuracy studies also suggest that recall accuracy declines with weaker
ties (Marsden 1990). Surveys are likely to reflect weak ties that respondents perceive as
salient, while other weak ties are lost, presumably forgotten because respondents did not view
them as consequential. Direct observation can recover these ties. In our case, using electronic
archival data also made it possible to conduct network research in a setting where many
respondents are likely to neglect filling out detailed network surveys. Worse, assessing
parallels between ties and worker productivity raises the possibility that subjects may react by
changing their data. Unobtrusive observation over long intervals is more “non-reactive” than
single shot surveys: “Of course, I communicate frequently with my teammates, don’t all high
performers?”.
Our experience, however, illustrates significant challenges for social network research
that uses digital archives. More general discussion of these issues appear in the
methodological literature on using non-reactive measures in social science research (Webb,
Campbell et al. 1981). We focus our discussion on two challenges: addressing the role of
missing data on information sources not identified through electronic traces, and identifying
trace correlates that influence the interpretation of results.
In most research settings, including ours, privacy concerns mean electronic data give
an incomplete picture of communications. For example, we were uable to obtain phone
records or use physical sensors to record face-to-face interaction (Pentland 2005; Eagle and
Pentland 2006). Instead, we relied on surveys to capture self-reported data on aspects of
communication we could not measure directly. Our results relating perceptions of
information sources and media use to performance remind us that other forms of
communication can affect output. Additional analyses, however, showed that the weak and
strong email tie effects we report are still significant when controlling for self-reported face-
to-face, phone, and external communication. Our larger point is that multi-method approaches
18

are often necessary. Surveys and ethnographic methods can fill in gaps involving aspects of
communication that are difficult to measure directly.
A second general problem with non-reactive measures is identifying and interpreting
correlates. Which ones are independent of context? Which ones support initial hypotheses?
Which ones suggest alternatives? A general strategy is to treat statistically significant results
consistent with theory as one plausible hypothesis. Additional analyses based on secondary
data can then be used to evaluate other plausible competing hypotheses.
For example, correlates of our response time and email size provide valuable context
for interpreting results. Among partners, we found correlations between sending smaller
emails to consultants and both self-reported tendencies to mentor others (Spearman’s ρ=0.43,
p < 0.10) and less time reported on email (ρ=0.48, p < 0.05). Executive preferences for
shorter email have been found in other settings (Owens and Neale 2000). One possibility is
that, through mentoring, partners teach junior colleagues to better “fill in the holes” in email,
enabling more efficient communication (Clark and Brennan 1991). It is worth considering
what role unobserved behaviors play that enable shorter more effective emails.
Among consultants, self-reported information overload correlate with longer emails
(ρ=0.39, p < 0.10) and longer response times (ρ=0.49, p < 0.05) from teammates. The ability
to juggle more simultaneous projects relates more strongly to consultant than to partner
performance. We speculate that the asynchronous nature of email communication plays a
role. We also found that recruiters who placed a higher value on the internal database
perceive less time communicating with teammates overall (ρ=-0.41, p < 0.01), but are
observed to communicate with teammates more frequently over email (ρ=0.32, p < 0.05).
This suggests a potential technological complementarity between use of the internal database
and email (Brynjolfsson, Renshaw et al. 1997).
Based on our experiences, we anticipate multi-method studies that play to the
strengths of both electronic archival data and network surveys will occupy an increasingly
important role in the development of social network analysis (Freeman 2004). Relationships
between social science theories and the data used to test them are like geological
“outcroppings” (Webb, Campbell et al. 1981). Theories make innumerable predictions, but
these can only be tested at the outcroppings, exposed portions of strata, where predictions and
19
available instruments meet. Confidence in results increases with the independence of these
checks.
Applications of electronic archival data in social network research create opportunities
for exploring similarities and differences between the role of relationships and information
flows. With instruments for directly measuring information flows, it becomes possible to
develop theories and test hypotheses that make sharper distinctions. Future work, for example,
can compare performance implications of strong ties based just on information flows but also
on topic threads, blind carbon copies, and even content. Recent work explores direct
measurement of community information flows on innovation (2006) and changes in Enron
email patterns during the company’s crisis (Diesner and Carley 2005). Other work compares
the construction of social networks through surveys and various types of electronic archives
(e.g. Grippa, Zilli et al. 2006). In time, our level of understanding regarding strengths and
limitations of different forms of electronic archival data in social network research may
approach current understanding of methodological strengths and weaknesses of face-to-face
and telephone surveys (Hochstim 1967; Groves 1990).
Combinations of new instruments associated with collecting and analyzing electronic
records, creative theorizing, and careful observation may well lead to significant
developments in social network understanding. We think of our work as illustrating an early
application of this approach, made possible by our new tools. While we focus on parallels
with existing theories in this paper, we have also found evidence of job level differences in
relationships between information flows and bookings, and information sharing behaviors and
email centrality that prompt new theorizing as a subject for future work.
Conclusion
This research responds to the challenge that too few empirical studies explore
relationships between social networks, new modes of communication and individual
performance (Weber 2004). We offer three contributions.
First, since professional output is notoriously hard to measure, we identified a
setting where white collar workers produce precise dollar valued output. We then gathered
data specific to the question of how information in social networks correlates with that output.
We secured six months of individual level communications data, and five years of accounting
20
data on individual revenues. We conducted interviews to understand the research setting and
a survey to assess individual perceptions.
Second, we validate two existing social network theories of individual performance.
Within the context of executive search, higher performing recruiters maintain a broader base
of email ties to colleagues. This is consistent with a structural holes explanation. Further,
strong email ties to teammates are associated with an additional advantage in search
execution. This is consistent with the search transfer argument.
Third, we find that individual perceptions about the value received from email are
poor predictors of performance. Survey responses for both the time spent using email and the
value received from using email, bear little correlation to individual performance. Consistent
with the structural holes and search transfer hypotheses, how individuals actually use email –
measures that profile communication strategies as opposed to perceptions of time spent and
value –better predict performance. One practical implication is that if worker perceptions
based on local inbox information are inaccurate, then giving them global social network data
could improve accuracy and potentially performance.
We hope our findings and further elaboration encourage future network studies that
use electronic archival data to investigate social network relationships with individual
performance. At the same time our experience suggests we are just beginning to understand
the potential of this new instrument for exploring social network interactions.
21
Appendix
Description of Measures Independent variables (treatments)
Social Network measures
All social network measures were calculated using UCINET VI software. The relevant network for this calculation was the partner and consultant network within the firm. For precise mathematical definitions, the reader is referred to Burt (1992) for structural holes and to Wasserman and Faust (1994) for betweenness centrality and indegree.
1.1 Effective size of structural holes A count of the number of links in an individual ego-network with a discount applied to links with nodes that are linked to each other.
1.2 Betweenness centrality A count of the number of times an individual lies on the shortest path between two others. When more than one shortest path exists, a fraction is allocated to all individuals on the shortest path in equal proportions summing to 1.
1.3 Internal indegree A count of the number of people from whom an individual receives communication.
We calculated each measure at two levels above which the number of emails was represented as a link. The cutoffs were greater than or equal to one (ge1) and greater than or equal to five (ge5) emails. Results from a similar model that includes cutoffs of greater than 10, 20 and 40 emails can be found in Bulkley (2006).
Email network efficiency variables
2.1 Average size of internal e-mail sent We used the natural log of the email size distribution in this paper. We excluded forwarded messages because the time required to forward a message is unrelated to size.
2.2 Average response time
We used the natural log of the response time distribution. We removed daily periodicity was removed by scaling time to reflect a ten hour workday (8 am – 6 pm). A time based measure as opposed to “Re:” header was used because analysis of the data suggested individual specific differences in the use of “Re:”
22

Survey measures of media choice and sources of information
We obtained the measures used in table 3 from four survey questions. For information sources, the questions were:
3.1 “In terms of relative time, I spend the most hours dealing with information from these sources…”
(a) my project team, (b) company colleagues not on my project, (c) people outside my company, (e) our internal database. Other categories included: (d) public access Web pages, (f) external proprietary databases, (g) news and trade press, (h) other (specify).
3.2. “In terms of relative value, the best information comes from these sources…”
Same categories as 3.1
For media choice, the questions were:
3.3 “What proportion of your time do you spend on the following modes of information gathering?”
(a) face-to-face, (b) phone and (c) email. Other categories included: (d) instant messaging, (e) computer display, (f) hardcopy and (g) other (specify).
3.4 “What proportion of your value do you get from the following modes of information gathering?”
Same categories as 3.3
For each of the four questions, responses in the categories listed in table 3 accounted for more than 85 percent of the relative time and value averaged across individuals. Independent variables (controls)
4.1 Industry sector dummies
Dummy variables for industry sectors such as finance, health, education, etc. The firm used in this study conducted searches in three sectors labeled A, B and C. These sectors are not specifically identified and do not necessarily correspond to the examples given above because this information could help identify the firm.
4.2 Job level of searches (percentage)
Percentage of searches conducted at the (1) CEO level and (2) solo searches. These variables control for the complexity of a search. CEO searches often involve the largest team sizes and highest revenues. Solo searches typically have lower revenues.
4.3 Years of experience Bulkley (2006) reports results of models that include years of education and gender as controls, but do not include the job level of searches. These specifications gave similar results.
23

Dependent variables When more than one recruiter was active in the process of landing (booking) or executing (billing) a search, revenues were apportioned on the basis of shares using an internal formula that assigns credit for particular tasks. The firm provided the share calculations. 5.1 Booking revenue Revenue generated by the search credited to the recruiter(s) that landed the contract.
Booking revenue was measured over the six month period that overlaps the email data. 5.2 Billing revenue
Revenue generated by the search credited to recruiter(s) who fulfilled the contract. Because searches take approximately 180 days on average to complete, a one year time window was used for calculating billing revenue and only searches that were completed within that year were counted.
24

N Min Max Mean S.DDependent Variables Booking Revenue (demeanded 47 -233,736 497,080 0 187,385 Billing Revenue (demeaned) 47 -432,053 465,446 0 168,285Base Models Yrs. of Experience 47 3 39 16.55 8.65 Partner (Dummy) 47 0 1 0.47 0.50 Sector A (Dummy) 47 0 1 0.18 0.38 Sector B (Dummy) 47 0 1 0.06 0.25Booking Base Model % Solo Searches 47 0 0.86 0.20 0.23 % CEO Searches 47 0 0.89 0.23 0.20Billing Base Model % Solo Searches 47 0 0.78 0.19 0.20 % CEO Searches 47 0 0.91 0.28 0.19Email Network Position Structural holes (ge1) 47 11.69 38.86 26.96 7.26 Betweenness centrality (ge1) 47 0.07 4.41 1.18 0.87 Internal indegree (ge1) 47 13 39 27.49 7.25 Structural holes (ge5) 47 5.16 30.22 12.61 5.96 Betweenness centrality (ge5) 47 0 8.74 1.73 1.79 Internal indegree (ge5) 47 4 31 12.74 5.41Contract Network Position Structural holes 47 1 15.00 6.34 2.76 Betweenness centrality 47 0 5.95 1.47 1.33 Degree 47 2 18 7.96 3.18Email response time (ln days) Sent 47 -3.20 1.92 -0.73 0.90 Sent-team 47 -3.68 2.15 -0.78 0.94 Sent-non-team 47 -2.53 1.84 -0.61 0.99Email size (ln bytes) Sent 47 6.69 9.22 8.00 0.48 Sent-team 47 6.19 9.29 8.05 0.56 Sent-non-team 47 7.17 9.19 7.94 0.49Time spent (%) Teammates 40 0 75 24.63 19.84 Colleagues outside team 40 0 80 8.18 12.65 External 40 0 100 32.95 26.85 Internal database 40 0 78 22.45 19.80 Face-to-face 40 0 75 19.68 15.18 Phone 40 10 70 44.73 15.55 Email 40 5 50 23.13 12.25Perceived Value (%) Teammates 40 0 75 24.40 16.05 Colleagues outside team 40 0 50 13.93 13.88 External 40 0 100 24.35 21.83 Internal database 40 0 75 26.23 20.89 Face-to-face 40 0 80 34.00 18.94 Phone 40 10 70 35.80 14.82 Email 40 0 50 20.93 11.69
25

Bibliography Allen, T. J. (1977). Managing the Flow of Technology. Cambridge, Mass., MIT Press. Bernard, H. R., P. Killworth, et al. (1984). "The Problem of Informant Accuracy: The Validity of
Retrospective Data." Annual Review of Antrhopology 13: 495-417. Brown, S. L. and K. M. Eisenhardt (1995). "Product Development: Past Research, Present Findings and
Future Directions." Academy of Management Review 20(2): 343-378. Brynjolfsson, E. and L. Hitt (1995). "Information Technology as a Factor of Production." Economics of
Innovation and New Technology 3(4): 183-200. Brynjolfsson, E., A. A. Renshaw, et al. (1997). "The Matrix of Change: A Tool for Business Process
Reengineering." Sloan Management Review(Winter): 37-54. Bulkley, N. (2006). Email and Output: Communication Effects on Productivity. Ph.D Thesis. School of
Information. Ann Arbor, University of Michigan. Burt, R. (2005). Brokerage and Closure. Oxford, Oxford University Press. Burt, R. S. (1992). Structural Holes: The Social Structure of Competition. Networks and Organizations. N.
Noria and R. G. Eccles. Cambridge, Mass., Harvard University Press: 57-91. Burt, R. S. (2000). The Network Structure of Social Capital. Research in Organizational Behavior. R. I.
Sutton and B. M. Staw. Greenwich, Conn., JAI Press. 22. Burt, R. S. (2004). "Structural Holes and Good Ideas." American Journal of Sociology 110(2): 349-399. Byrne, J. (1986). The Headhunters. New York, MacMillian. Clark, H. H. and S. E. Brennan (1991). Grounding in Communication. Socially Shared Cognition. L. B.
Resnick, J. M. Levine and S. Teasley, American Psychological Association. Cook, T. D. and D. T. Campbell (1979). Quasi-Experimentation: Design and Analysis Issues for Field
Settings. Boston, Houghton Mifflin. Cross, R., S. P. Borgatti, et al. (2002). "Making Invisible Work Visible: Using Social Network Analysis to
Support Strategic Collaboration." California Management Review 44(2): 25-46. Diesner, J. and K. M. Carley (2005). Exploration of Communication Networks from the Enron Email
Corpus. Proc. of Workshop on Link Analysis, Counterterrorism and Security, SIAM International Conference on Data Mining, Newport Beach, CA.
Ducheneaut, N. and V. Bellotti (2001). "Email as Habitat: An Exploration of Embedded Personal Information Management." Interactions 8(5): 30-38.
Eagle, N. and A. Pentland (2006). "Realty Mining: Sensing Complex Social Systems." Personal and Ubiquitous Computing 10(4): 255-268.
Feldman, M. S. (1986). Constraints on Communication and Electronic Mail. Proceedings of the 1986 ACM Conference on Computer Supported Cooperative Work, Austin, Texas.
Finholt, T. and L. S. Sproull (1990). "Electronic Groups at Work." Organization Science 1(1): 41-64. Finlay, W. and J. E. Coverdill (2002). Headhunters: Matchmaking in the Labor Market. Ithaca, NY, ILR
Press. Freeman, L. C. (2004). The Development of Social Network Analysis. Vancouver, B.C., Empirical Press. Garton, L., C. Haythornthwaite, et al. (1999). Studying On-Line Social Networks. Doing Internet Research.
S. Jones. Thousand Oaks, Calif., Sage Publications: 75-106. Gloor, P. A. (2006). Swarm Creativity: Competitive Advantage through Collaborative Innovation
Networks. New York, Oxford University Press. Granovetter, M. (1973). "The Strength of Weak Ties." American Journal of Sociology 78(6): 1360-1380. Granovetter, M. (1983). "The Strength of Weak Ties: A Network Theory Revisited." Sociological Theory
1: 201-233. Grippa, F., A. Zilli, et al. (2006). Email may not reflect the social network. North American Association for
Computational Social and Organizational Science, Notre Dame, IN. Groves, R. M. (1990). "Theories and Methods of Telephone Surveys." Annual Review of Sociology 16:
221-240. Hansen, M. T. (1999). "The Search-Transfer Problem: The Role of Weak Ties in Sharing Knowledge
Across Organizational Subunits." Administrative Science Quarterly 44(1): 82-111. Haythornthwaite, C. (1996). "Social Network Analysis: An Approach and Technique for the Study of
Information Exchange." Library and Information Science Research 18(4): 323-342.
26

Hinds, P. and S. Kiesler (1995). "Communication Across Boundaries: Work, Structure and the Use of Communication Technologies in a Large Organization." Organization Science 6(4): 373-393.
Hochstim, J. R. (1967). "A Critical Comparison of Three Strategies of Collecting Data from Households." Journal of the American Statistical Association 62(319): 976-989.
Khurana, R. (2002). "Market Triads: A Theoretical and Empirical Analysis of Market Intermediation." Journal for the Theory of Social Behavior 32(2): 239-262.
Kleinberg, J. (2001). "Small-World Phenomena and the Dynamics of Information." Advances in Neural Information Processing Systems 14.
Krackhardt, D. and J. R. Hanson (1993). "Informal Networks: The Company Behind the Chart." Harvard Business Review(July-Aug.): 104-111.
Mackay, W. E. (1989). "Diversity in the Use of Electronic Mail: A Preliminary Inquiry." ACM Transactions on Office Information Systems 6(4): 380-397.
Markus, M. L. (1990). Toward a 'Critical Mass' Theory of Interactive Media. Organizations and Communications Technology. J. Fulk and C. Steinfeld. Newbury Park, Calif., Sage Publications.
Markus, M. L. (1994). "Electronic Mail as the Medium of Managerial Choice." Organization Science 5(4): 502-527.
Marsden, P. V. (1990). "Network Data and Measurement." Annual Review of Sociology 16: 435-463. McKenney, J. L., M. H. Zack, et al. (1992). Complementary Communcation Media: A Comparison of
Electronic Main and Face-to-Face Communication in a Programming Team. Networks and Organizations. N. Nohria and R. G. Eccles. Boston, Harvard Business School Press: 262-287.
Monge, P. R. and N. S. Contractor (1999). Emergence of Communications Networks. Handbook of Organizational Communications (2nd ed.). F. M. Jablin and L. L. Putnam. Thousand Oaks, Calif., Sage.
Monge, P. R. and N. S. Contractor (2003). Theories of Communication Networks. New York, Oxford University Press.
Pentland, A. S. (2005). "Socially Aware Computation and Communication." Computer (IEEE) 38(3): 33-40.
Rice, R. E. (1994). Network Analysis and Computer-Mediated Communications Systems. Advances in Social Network Analysis. S. Wasserman and J. Galaskiewicz. Thousand Oaks, Calif., Sage Publications: 167-203.
Rice, R. E., A. E. Grant, et al. (1990). "Individual and Network Influences on the Adoption and Perceived Outcomes of Electronic Messaging." Social Networks 12: 27-55.
Thompson, J. D. (1967). Organizations in Action: Social Science Bases of Administrative Theory. New York, McGraw-Hill.
Van Alstyne, M. and E. Brynjolfsson (2005). "Electronic Communities: Global Village or Cyberbalkans." Management Science 51(6): 851-868.
Von Hipple, E. (1994). "Sticky Information and the Locus of Problem Solving." Management Science 40(4): 429-439.
Webb, E. J., D. T. Campbell, et al. (1981). Nonreactive Measures in the Social Sciences. Boston, Houghton Mifflin.
Weber, R. (2004). "The Grim Reaper: The Curse of Email." MIS Quarterly 28(3): iii-xiv. Weick, K., E. (1979). The Social Psychology of Organizing. New York, McGraw Hill. Weick, K., E. (1995). Sensemaking in Organizations. Thousand Oaks, Calif., Sage Publications. Wellman, B. (1996). An Electronic Group is Virtually a Social Network. Culture of the Internet. S. Kiesler.
Hillsdale, N.J., Lawrence Erlbaum: 179-205. Wellman, B. (2001). "Computer Networks as Social Networks." Science 293(5537): 2031-2034. Zhang, J. and M. Van Alstyne (2003). EmailNet: A System for Automatically Mining Social Networks
from Organizational Email Communications. North American Association for Computational Social and Organizational Science (NAACSOS), Pittsburgh.
27