Embed Size (px)
Citation preview
ElVis Developmentsfor Simulation and
Analysis Programs
Tarun PondicherrySummer 2006 Science Ed High School Intern
Eliot Feibush, Mentor8/16/2006
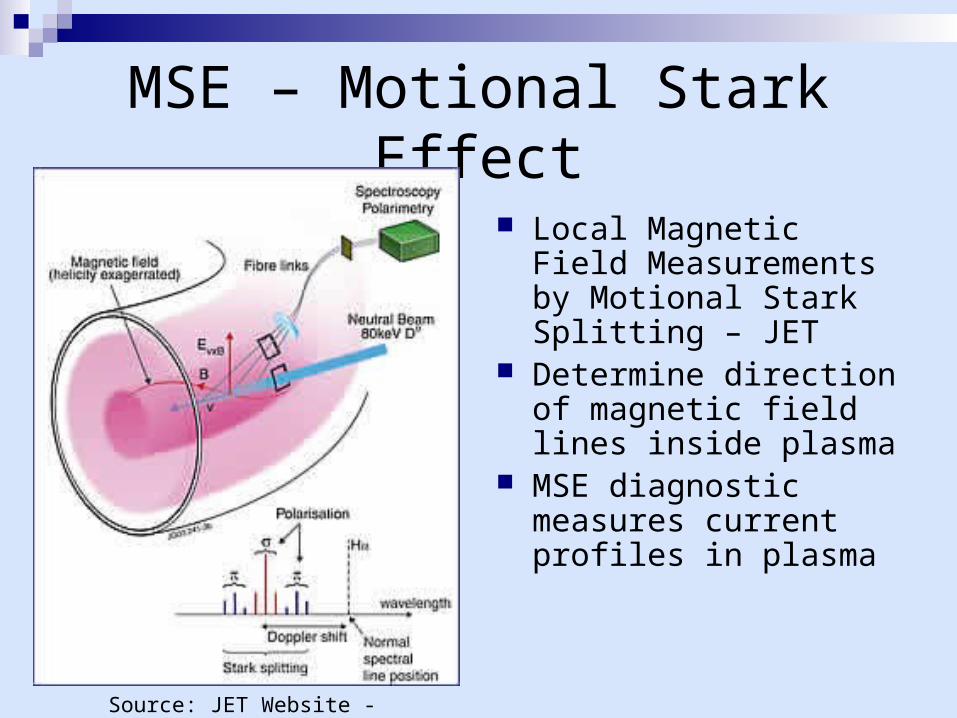
MSE – Motional Stark Effect
Local Magnetic Field Measurements by Motional Stark Splitting – JET
Determine direction of magnetic field lines inside plasma
MSE diagnostic measures current profiles in plasma
Source: JET Website - jet.efda.org
MSE Simulation
Simulate MSE diagnostic for ITER design Source code from JET
Required GHOST graphics package – impractical to distribute
Modified by Tina Ludescher to output results to netCDF file instead of using GHOST Separated Simulation from Visualization
Display graphs of netCDF variables in ElVis

ElVis Developmentsfor Simulation and
Analysis Programs
Tarun PondicherrySummer 2006 Science Ed High School Intern
Eliot Feibush, Mentor8/16/2006
OverviewBackground
My Topics:1. MSE (Motional Stark Effect)2. Monitoring Simulations3. Interactive Techniques
Demo
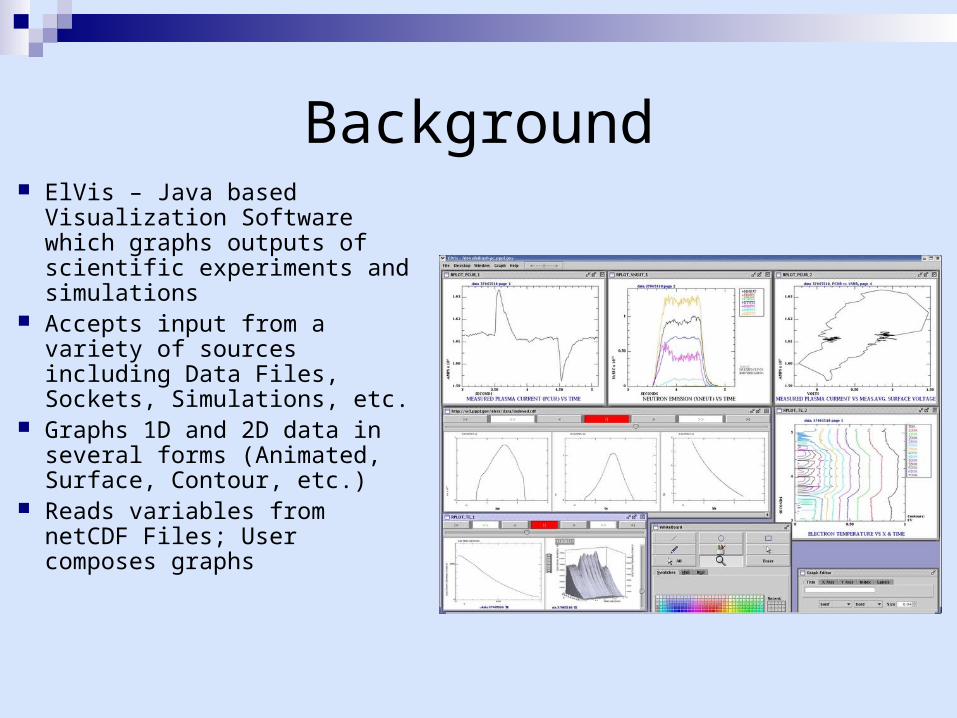
Background ElVis – Java based
Visualization Software which graphs outputs of scientific experiments and simulations
Accepts input from a variety of sources including Data Files, Sockets, Simulations, etc.
Graphs 1D and 2D data in several forms (Animated, Surface, Contour, etc.)
Reads variables from netCDF Files; User composes graphs
NetCDF File Format
File format and interface for scientific data storage Machine Independent and accessible through URL Consist of a collection of dimensions, variables and
attributes Variable
Single Value Array of one or more Dimensions
Variables and Dimensions can have attributes specifying units, alternate names or other information
Unidata provides NetCDF API’s in C, Java and Fortran

NetCDF File Elements Global Attributes … Dimensions
Attributes …
… Coordinate Variables [dim name]
Attributes …
… Variables (definition) [dim0 x dim1 x …]
Attributes …
… Variables (data) …
convention = elvis elvis_template = mytemplate.xml time = 50
long_name = time_of_capture unit = seconds
x_coordinate = 200 time [time]
sine [x_coordinate X time] amplitude = 1
time = {0,2,6,17,…} sine = {-1, -0.5, 0, 0.5,…}
{-1, -0.75, -0.5, -0.25,…} …
1. ElVis Enhancements for netCDF Data
MotivationMSE display requirementsGeneralize monitoring of Fusion Simulations
& Analysis programs
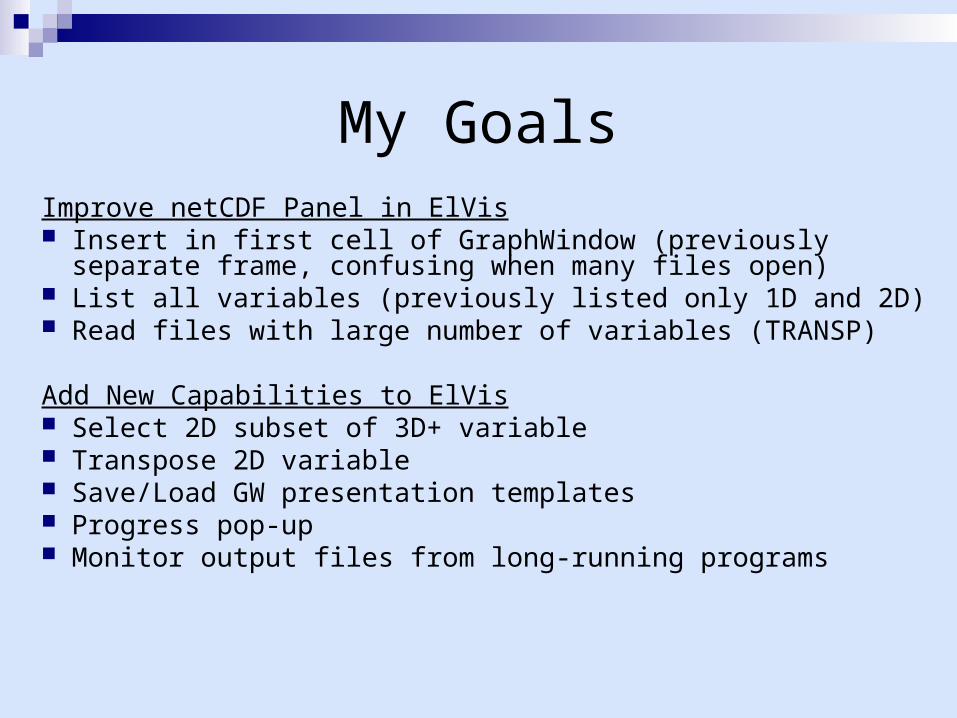
My GoalsImprove netCDF Panel in ElVis Insert in first cell of GraphWindow (previously separate frame,
confusing when many files open) List all variables (previously listed only 1D and 2D) Read files with large number of variables (TRANSP)
Add New Capabilities to ElVis Select 2D subset of 3D+ variable Transpose 2D variable Save/Load GW presentation templates Progress pop-up Monitor output files from long-running programs
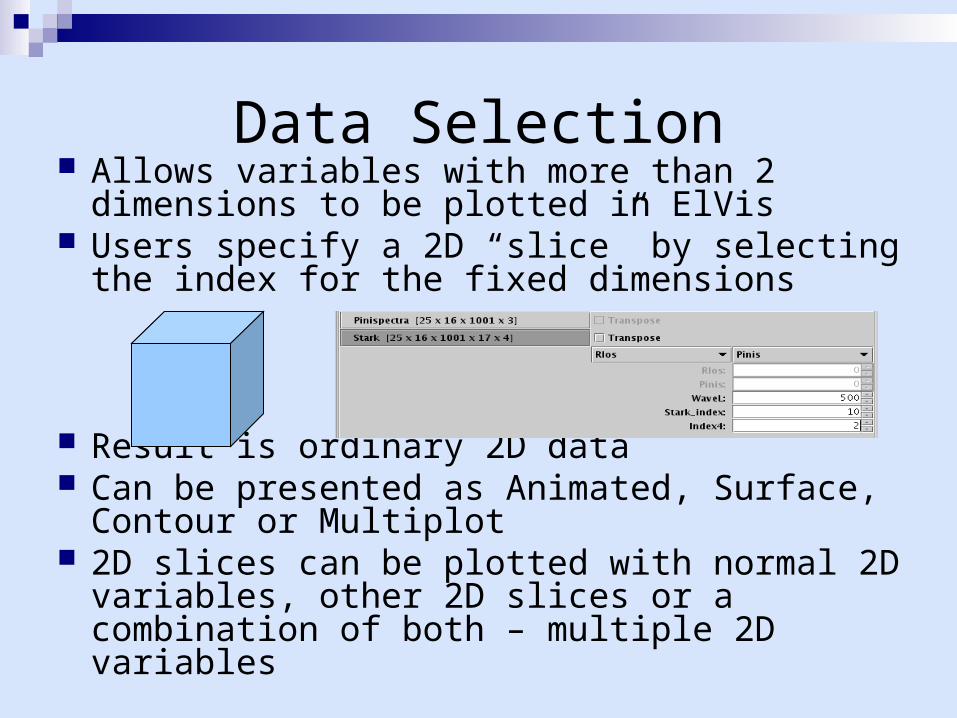
Data Selection Allows variables with more than 2 dimensions to
be plotted in ElVis Users specify a 2D “slice” by selecting the index
for the fixed dimensions
Result is ordinary 2D data Can be presented as Animated, Surface,
Contour or Multiplot 2D slices can be plotted with normal 2D
variables, other 2D slices or a combination of both – multiple 2D variables
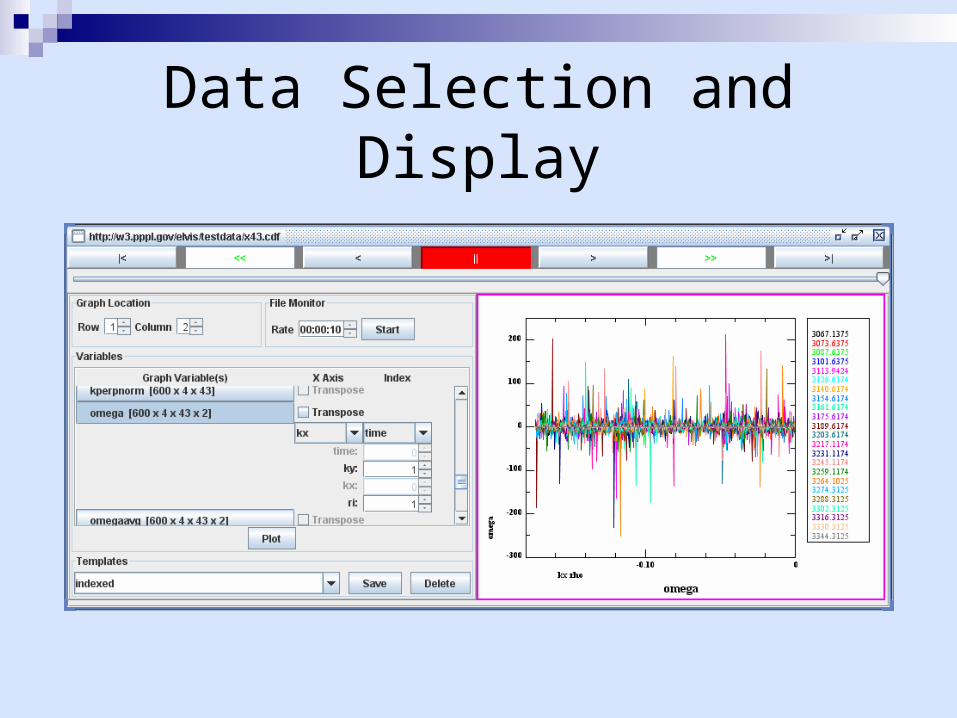
Data Selection and Display
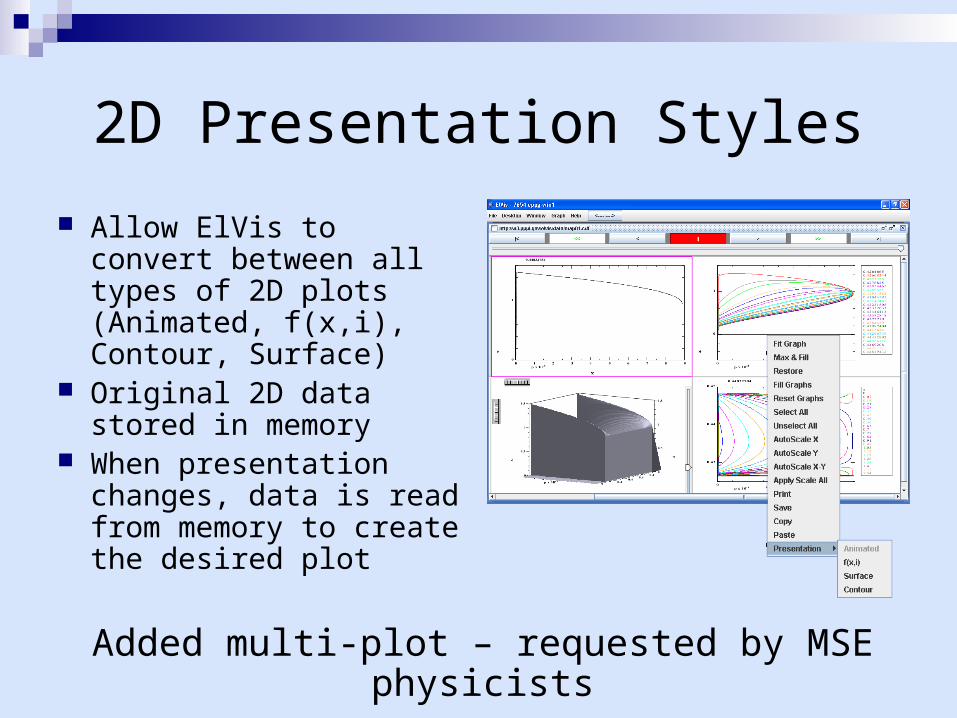
2D Presentation Styles
Allow ElVis to convert between all types of 2D plots (Animated, f(x,i), Contour, Surface)
Original 2D data stored in memory
When presentation changes, data is read from memory to create the desired plot
Added multi-plot – requested by MSE physicists
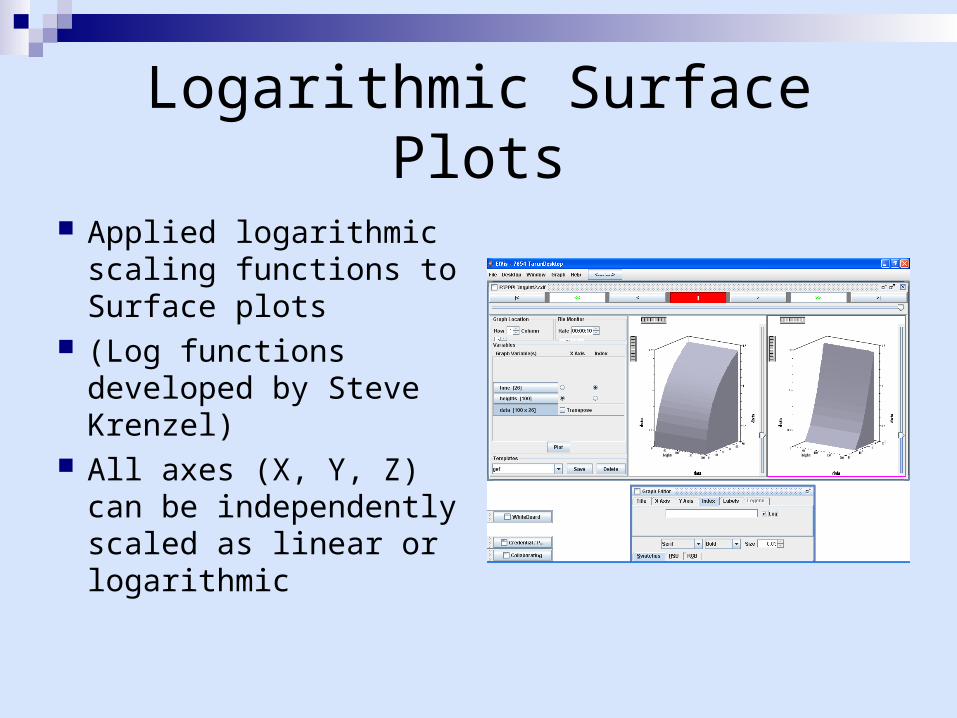
Logarithmic Surface Plots
Applied logarithmic scaling functions to Surface plots
(Log functions developed by Steve Krenzel)
All axes (X, Y, Z) can be independently scaled as linear or logarithmic
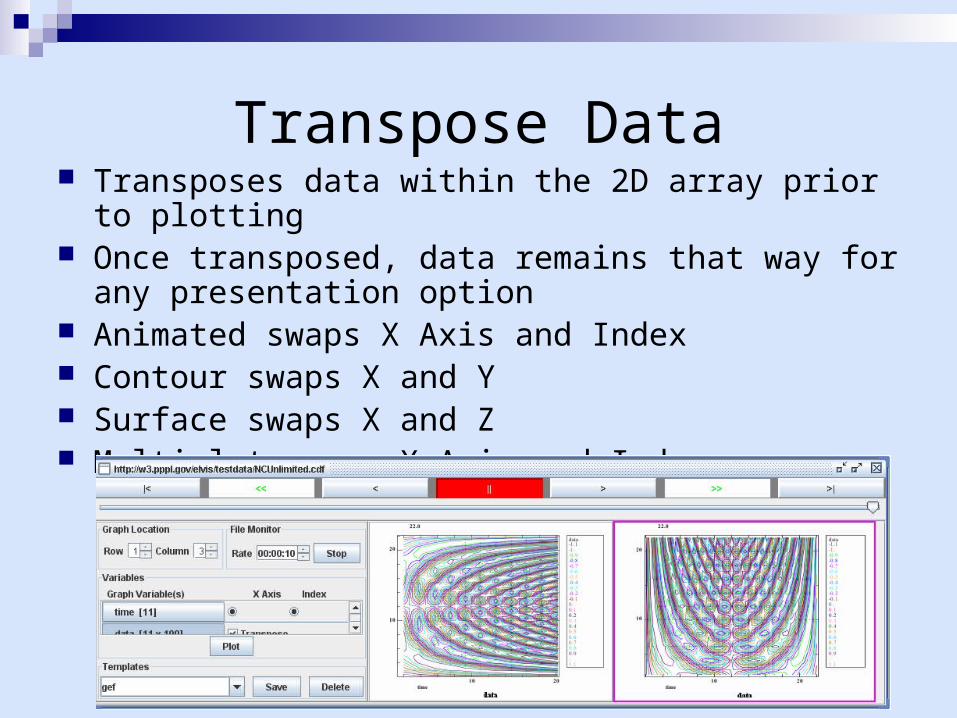
Transpose Data Transposes data within the 2D array prior to plotting Once transposed, data remains that way for any
presentation option Animated swaps X Axis and Index Contour swaps X and Y Surface swaps X and Z Multiplot swaps X Axis and Index
Data Interpolation
Allows Variables of Different Lengths to be plotted against each other
Adds or removes x values to match number f(x) values
Values added created by linear interpolation Values removed by periodic sampling Works for both 1D and 2D data Performed automatically when dataset sizes
vary
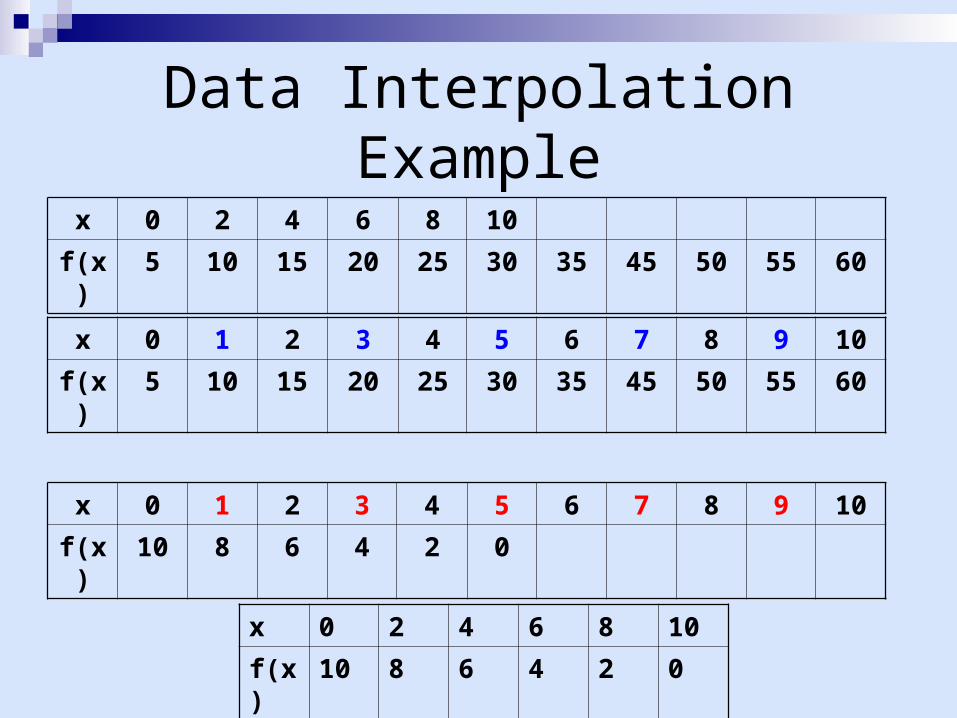
Data Interpolation Example
x 0 1 2 3 4 5 6 7 8 9 10
f(x) 10 8 6 4 2 0
x 0 2 4 6 8 10
f(x) 10 8 6 4 2 0
x 0 2 4 6 8 10
f(x) 5 10 15 20 25 30 35 45 50 55 60
x 0 1 2 3 4 5 6 7 8 9 10
f(x) 5 10 15 20 25 30 35 45 50 55 60
Graph Window Templates
Suggested by Steve Scott for MSE Allow ElVis to show NetCDF Files with a
user specified view
Enables author of the data to format graphs (without programming!) for collaborators to view over the Internet
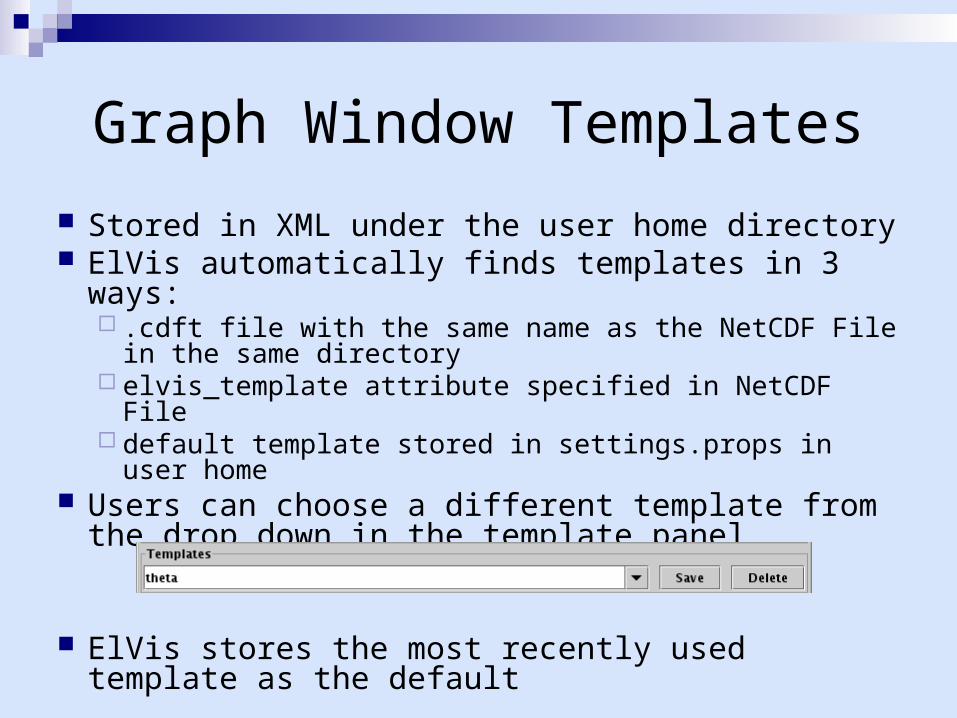
Graph Window Templates
Stored in XML under the user home directory ElVis automatically finds templates in 3 ways:
.cdft file with the same name as the NetCDF File in the same directory
elvis_template attribute specified in NetCDF File default template stored in settings.props in user home
Users can choose a different template from the drop down in the template panel
ElVis stores the most recently used template as the default
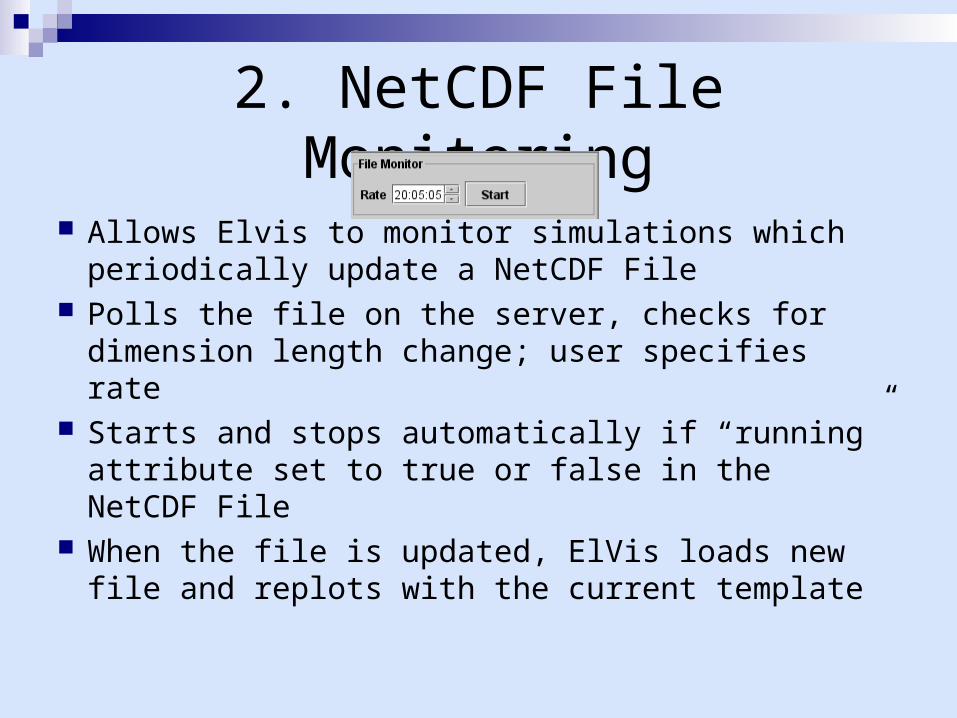
2. NetCDF File Monitoring
Allows Elvis to monitor simulations which periodically update a NetCDF File
Polls the file on the server, checks for dimension length change; user specifies rate
Starts and stops automatically if “running” attribute set to true or false in the NetCDF File
When the file is updated, ElVis loads new file and replots with the current template
File Monitoring – Solution
Generalized way to monitor simulations Overcomes the need for custom
programming for monitoring Can be combined with templates to
compose the graphs without programming
Fusion Simulation Projects
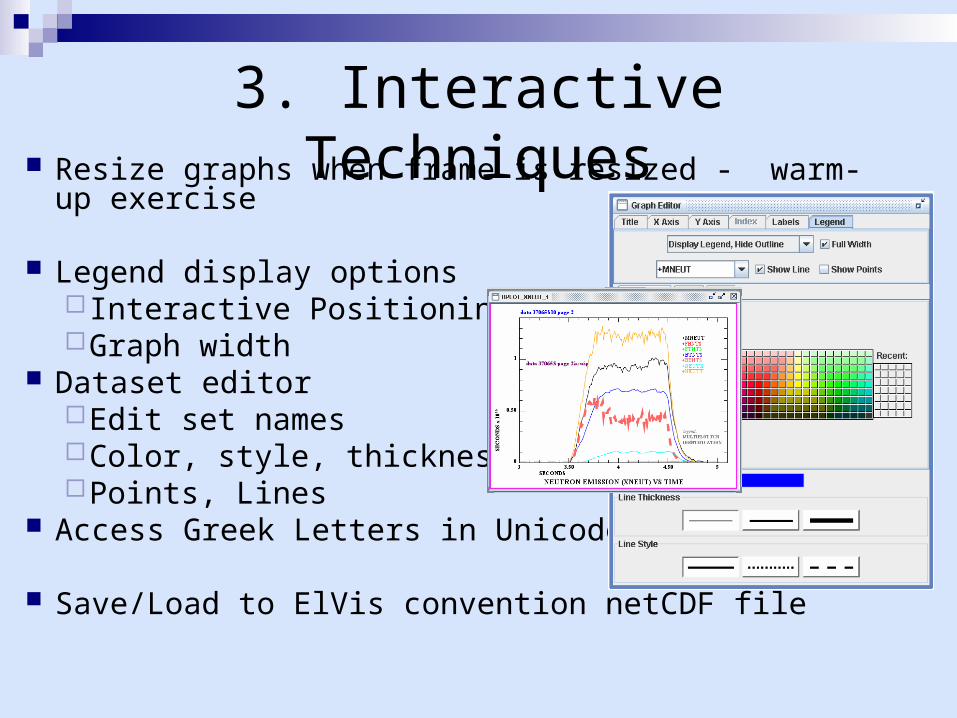
3. Interactive Techniques Resize graphs when frame is resized - warm-up exercise
Legend display options Interactive PositioningGraph width
Dataset editorEdit set namesColor, style, thicknessPoints, Lines
Access Greek Letters in Unicode Font
Save/Load to ElVis convention netCDF file
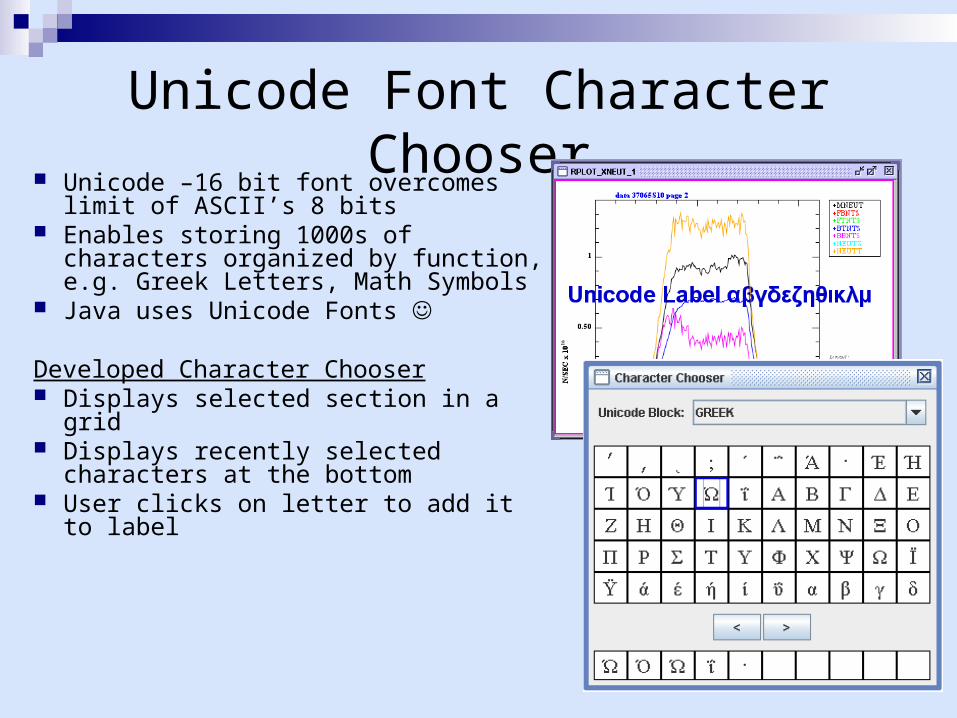
Unicode Font Character Chooser Unicode –16 bit font overcomes limit
of ASCII’s 8 bits Enables storing 1000s of characters
organized by function, e.g. Greek Letters, Math Symbols
Java uses Unicode Fonts
Developed Character Chooser Displays selected section in a grid Displays recently selected
characters at the bottom User clicks on letter to add it to label
Summary – How I spent my summer vacation
ElVis enhancements for MSE display requirements
Generalized solution for monitoring simulations
Interactive techniques
Acknowledgements
Eliot Feibush Jill Foley for MSE background info James Morgan, Andrew Post-Zwicker and
the PPPL Science Education Department Princeton Plasma Physics Lab
Demo
ElVis http://w3.pppl.gov/elvis/