Embed Size (px)
Citation preview

University of Arkansas, Fayetteville University of Arkansas, Fayetteville
ScholarWorks@UARK ScholarWorks@UARK
Graduate Theses and Dissertations
8-2016
Elucidating the genetic cause to ascites syndrome in broiler Elucidating the genetic cause to ascites syndrome in broiler
chickens utilizing multi-generational genome wide association chickens utilizing multi-generational genome wide association
studies studies
Katy Tarrant University of Arkansas, Fayetteville
Follow this and additional works at: https://scholarworks.uark.edu/etd
Part of the Genetics Commons, and the Poultry or Avian Science Commons
Citation Citation Tarrant, K. (2016). Elucidating the genetic cause to ascites syndrome in broiler chickens utilizing multi-generational genome wide association studies. Graduate Theses and Dissertations Retrieved from https://scholarworks.uark.edu/etd/1652
This Dissertation is brought to you for free and open access by ScholarWorks@UARK. It has been accepted for inclusion in Graduate Theses and Dissertations by an authorized administrator of ScholarWorks@UARK. For more information, please contact [email protected].

Elucidating the Genetic Cause to Ascites Syndrome in Broiler Chickens Utilizing Multi-
Generational Genome Wide Association Studies
A dissertation submitted in partial fulfillment
of the requirements for the degree of
Doctor of Philosophy in Cell and Molecular Biology
by
Katy J. Tarrant
Sam Houston State University
Bachelor of Science in Biological Sciences, 2010
Sam Houston State University
Master of Science in Biological Sciences, 2012
August 2016
University of Arkansas
This dissertation is approved for recommendation to the Graduate Council.
____________________________________
Dr. Douglas Rhoads
Chair
____________________________________
Dr. Nicholas Anthony
Co-Chair
____________________________________ ____________________________________
Dr. Charles Rosenkrans Dr. Mack Ivey
Committee Member Committee Member

ABSTRACT
Ascites syndrome in broiler chickens has developed into a source of economic loss in the
last three decades. Intensive selective pressure, and implementation of flock management
practices, has successfully reduced ascites frequency, but has not eliminated its occurrence. For
this reason, it is imperative to better understand the genetic cause to ascites in broiler chickens.
Previous studies of this magnitude have been attempted, but, thus far, a consensus of genomic
associations have not been made. This collection of studies was aimed at identifying and
interpreting genomic and genetic associations to ascites phenotype specific to a broiler line
representative of a 1990s elite male line. A next generation sequencing technique, termed
genome wide association studies, was initially implemented to identify chromosomal regions
experiencing correlations with ascetic events in broilers. Individual loci were then evaluated for
their impact on resistance and susceptibility, with particular interest in sex effects and parental
genotypes. Finally, statistical models were evaluated for their potential use in predicting ascites
incidence. Models represent a less time consuming and more cost effective method aimed at
conserving genetic accuracy in selected breeding programs. Together, these studies represent
gains in the current knowledge of ascites genetics and serve as a possible source for novel
selective breeding practices in an industry setting.

ACKNOWLEDGMENTS
This degree has been the result of the time and effort of many people who have dedicated a
portion of their lives to help me achieve my dream. It truly has been a group effort.
To Jake - This degree is as much yours as it is mine. Thank you for always believing in me,
even when I did not. It has been a long journey, but our next adventure is yet to come.
To Mom and Dad – This has been a difficult, frustrating, and rewarding experience fraught with
failure and success. You spent many years worried about what I was doing with my life, but you
never wavered in your confidence that I would figure it out one day.
To Dr. Rhoads – If you hadn’t ended up in the piney woods of East Texas I do not know where I
would be today. Thank you for taking a chance on me, and thank you for pushing me to be
better.
To Dr. Anthony – You have acted as an advisor, academic mentor, job counselor, and therapist.
Thank you for your support along the way, and thank you for opening the doors to my future.
Additionally, I would like to thank my committee members, lab mates, and co-authors.

TABLE OF CONTENTS
CHAPTER 1 Literature Review ..................................................................................................... 1
Domestication .......................................................................................................................... 2
Modernization of the Broiler ................................................................................................... 2
Modern Breeding Schemes ...................................................................................................... 3
Domestication Effects .............................................................................................................. 4
Heart and Lung Function ......................................................................................................... 5
Pulmonary Hypertension Syndrome ........................................................................................ 6
Development of PHS ............................................................................................................... 7
Genetics of PHS..................................................................................................................... 11
Marker Assisted Selection History ........................................................................................ 13
Marker Assisted Selection in Broilers ................................................................................... 14
Synopsis ................................................................................................................................. 15
REFERENCES .......................................................................................................................... 22
CHAPTER 2 Multi-generational genome wide association studies identify chromosomal regions
associated with ascites phenotype ................................................................................................. 31
ABSTRACT .............................................................................................................................. 32
INTRODUCTION ..................................................................................................................... 33
METHODS................................................................................................................................ 34
Genome Data ......................................................................................................................... 34
Bird Stocks and Hypobaric Chamber Trials .......................................................................... 35
DNA Isolation........................................................................................................................ 35
Genome Wide Association Study .......................................................................................... 36
Real-Time PCR...................................................................................................................... 36
Statistical Methods ................................................................................................................ 37
RESULTS.................................................................................................................................. 37
DISCUSSION ........................................................................................................................... 39
REFERENCES .......................................................................................................................... 48
CHAPTER 3 Marker assisted selection for ascites resistance in broilers using a chromosome Z
locus .............................................................................................................................................. 52
ABSTRACT .............................................................................................................................. 53
INTRODUCTION ..................................................................................................................... 54

METHODS................................................................................................................................ 55
Genome data .......................................................................................................................... 55
Bird stock ............................................................................................................................... 56
Hypobaric Chamber Trials .................................................................................................... 56
Floor Trial and Processing ..................................................................................................... 56
Blood Extraction, DNA Isolation, and Genotyping .............................................................. 57
Statistical Analysis ................................................................................................................ 57
RESULTS.................................................................................................................................. 57
CONCLUSIONS ....................................................................................................................... 61
REFERENCES .......................................................................................................................... 88
CHAPTER 4 Predicting ascites incidence in simulated altitude-challenge using single nucleotide
polymorphisms identified in multi-generational genome wide association studies ..................... 92
ABSTRACT .............................................................................................................................. 93
INTRODUCTION ..................................................................................................................... 94
METHODS................................................................................................................................ 95
Bird Handling ........................................................................................................................ 95
Genome Data ......................................................................................................................... 96
DNA Isolation........................................................................................................................ 96
Genotyping ............................................................................................................................ 96
Statistical Analysis ................................................................................................................ 97
RESULTS AND CONCLUSIONS ........................................................................................... 97
REFERENCES ........................................................................................................................ 110
CHAPTER 5 Discussion ............................................................................................................. 113
REFERENCES ........................................................................................................................ 120
CHAPTER 6 Appendix............................................................................................................... 122
LIST OF ABBREVIATIONS
AUC area under the curve
Cdh13 cadherin 13
Cdh6 cadherin 6
GWAS genome wide association study
HTR1A 5-hydroxytryptamine (serotonin) receptor 1A
LOX lysyl oxidase
MAD mean absolute deviation
MAS marker assisted selection
Mbp megabase pairs
MC4R melanocortin 4 receptor
MCR misclassification rate
Mef2 myocyte enhancer factor-2
Mef2c myocyte enhancer factor 2C
MG moderate growth and livability
MH medial hypertrophy
PHS Pulmonary hypertension syndrome
QTL quantitative trait loci
REL relaxed selected line
RG feed efficiency
RMSE root mean square error
ROC receiver operative characteristic
RVTV right ventricle-to-total ventricle weight
SNP single nucleotide polymorphism
WOG whole bird without giblets
YD growth rate and breast yield

LIST OF TABLES
Table 2-1. Location of SNP identified from GWAS. Annealing temperature, forward and
reverse primers, and probes also included for each SNP. ............................................................. 43
Table 2-2. Data collected from single nucleotide polymorphisms from male individuals on
chromosomes 2 and Z. Included are SNP identification names, location, individual counts,
percent incidence of ascites-susceptible birds, observed genotypic frequencies, and
corresponding P-values calculated for Chi-squared tests. Additionally, RVTV averaged ratios
for resistant and susceptible individuals are included. Information for males and females
presented separately. ..................................................................................................................... 44
Table 2-3. Data collected from single nucleotide polymorphisms from female individuals on
chromosomes 2 and Z. Included are SNP identification names, location, individual counts,
percent incidence of ascites-susceptible birds, observed genotypic frequencies, and
corresponding P-values calculated for Chi-squared tests. Additionally, RVTV averaged ratios
for resistant and susceptible individuals are included. Information for males and females
presented separately. ..................................................................................................................... 45
Table 3-1. Data collected after the completion of the hypobaric chamber trials. Individuals were
genotyped for a C/T SNP on the Z chromosome and phenotyped as ascites resistant or
susceptible. A calculated percent of resistant individuals for each genotype is also included. ... 64
Table 3-2. Counts of ascites resistant and susceptible males with associated genotype and
parental genotypic cross. ............................................................................................................... 65
Table 3-3. Counts of ascites resistant and susceptible males with associated genotype and
parental genotypic cross. ............................................................................................................... 66
Table 3-4. Absolute weight means1 for male offspring. ............................................................... 67

Table 3-5. Percent weight means1 for male offspring. .................................................................. 68
Table 3-6. Averaged breast fillet traits for male offspring. .......................................................... 69
Table 3-7. Absolute weight means1 for parental crosses resulting in heterozygous male offspring.
....................................................................................................................................................... 70
Table 3-8. Percent weight means1 for crosses resulting in heterozygous male offspring. ........... 71
Table 3-9. Averaged breast fillet traits for resulting in heterozygous male offspring. ................ 72
Table 3-10. Absolute weight means1 for parental crosses resulting in homozygous T male
offspring. ....................................................................................................................................... 73
Table 3-11. Percent weight means1 for parental crosses resulting in homozygous T male
offspring. ....................................................................................................................................... 74
Table 3-12. Averaged breast fillet traits resulting in homozygous T male offspring. ................. 75
Table 3-13. Absolute weight means1 for female offspring. ......................................................... 76
Table 3-14. Percent weight means1 for female offspring. ............................................................ 77
Table 3-15. Averaged breast fillet traits for female offspring. ..................................................... 78
Table 3-16. Absolute weight means1 for parental crosses resulting in hemizygous C female
offspring. ....................................................................................................................................... 79
Table 3-17. Percent weight means1 for parental crosses resulting in hemizygous C female
offspring. ....................................................................................................................................... 80
Table 3-18. Averaged breast fillet traits resulting in hemizygous C female offspring. ............... 81
Table 3-19. Absolute weight means1 for parental crosses resulting in hemizygous T female
offspring. ....................................................................................................................................... 82
Table 3-20. Percent weight means1 for parental crosses resulting in hemizygous T female
offspring. ....................................................................................................................................... 83

Table 3-21. Averaged breast fillet traits resulting in hemizygous T female offspring. ............... 84
Table 4-1. SNPs identified from chromosomes 11 and Z used to develop predictive models. .. 103
Table 4-2. Comparisons between regression modeling techniques for male broilers. Three sets
of SNPs were used as inputs for models: SNPs from both chromosomes, SNPs from
chromosome 11, and SNPs from chromosome Z. ...................................................................... 104
Table 4-3. Comparisons between regression modeling techniques for female broilers. Three sets
of SNPs were used as inputs for models: SNPs from both chromosomes, SNPs from
chromosome 11, and SNPs from chromosome Z. ...................................................................... 105
Table 4-4. Training and validation statistics on two neural networking models developed from
SNPs on chromosomes 11 and Z in males. The All SNPs model includes 8 SNP inputs on
chromosome 11 and 12 SNP inputs on chromosome Z. The 13 SNPs model displays descriptive
statistics for a neural network completed using seven fewer SNPs to complete the analysis. ... 106
Table 4-5. Contributions of individual SNPs to the neural network model developed to predict
male ascites incidence using the fewest number of SNPs. Contributions are evaluated by the
calculated total effect value standard error. ............................................................................. 107
Table 4-6. Training and validation statistics on a neural networking model developed from SNPs
on chromosomes 11 and Z in female individuals. ...................................................................... 108
Table 4-7. Contributions of individual SNPs to the neural network model developed to predict
female ascites incidence using 20 SNPs. Contributions are evaluated by the calculated total
effect value standard error. ...................................................................................................... 109

1
LIST OF FIGURES
Figure 1-1 Yearly ready - to - cook broiler production with projections for 2016. Information as
reported by Economic Research Service/USDA. ......................................................................... 16
Figure 1-2. Breeding schemes in modern broiler genetics companies. Adapted from Pollock
(1999). ........................................................................................................................................... 17
Figure 1-3. Line crosses experienced at each level in the pyramid breeding scheme. ................. 18
Figure 1-4. The bird on the left is a healthy two week old broiler. The body cavity of the broiler
on the right is distended due to the accumulation of fluid, which indicates the bird has ascites. . 19
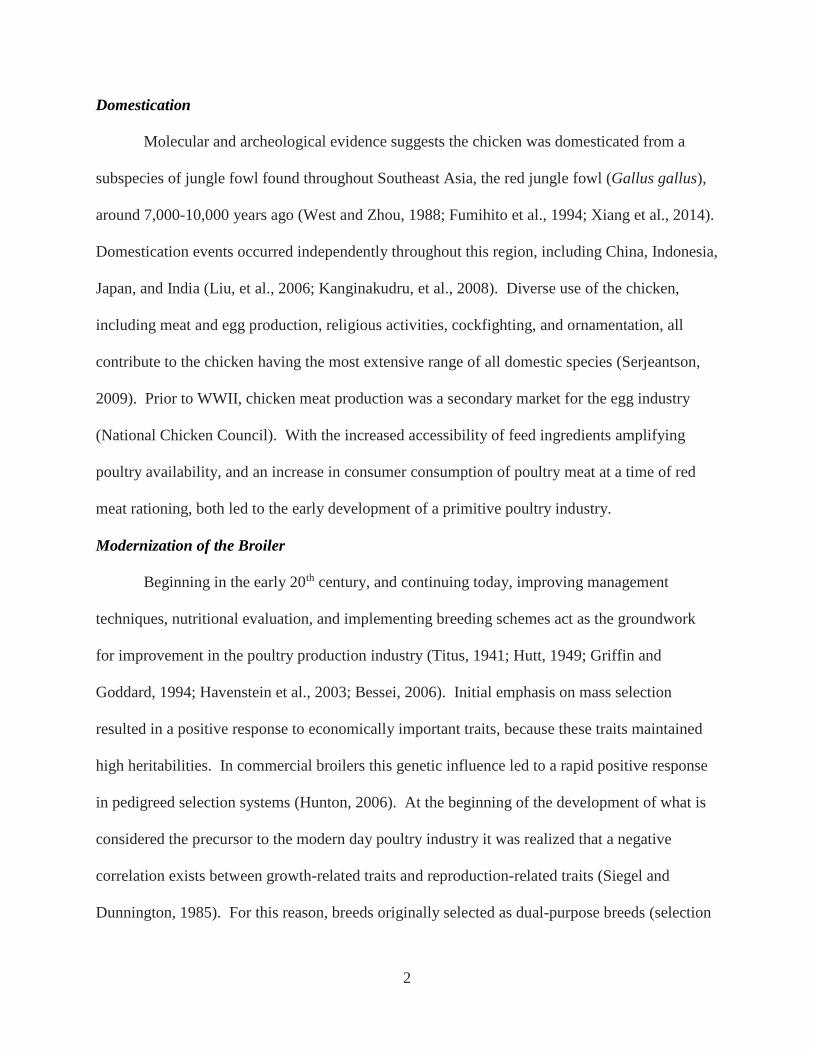
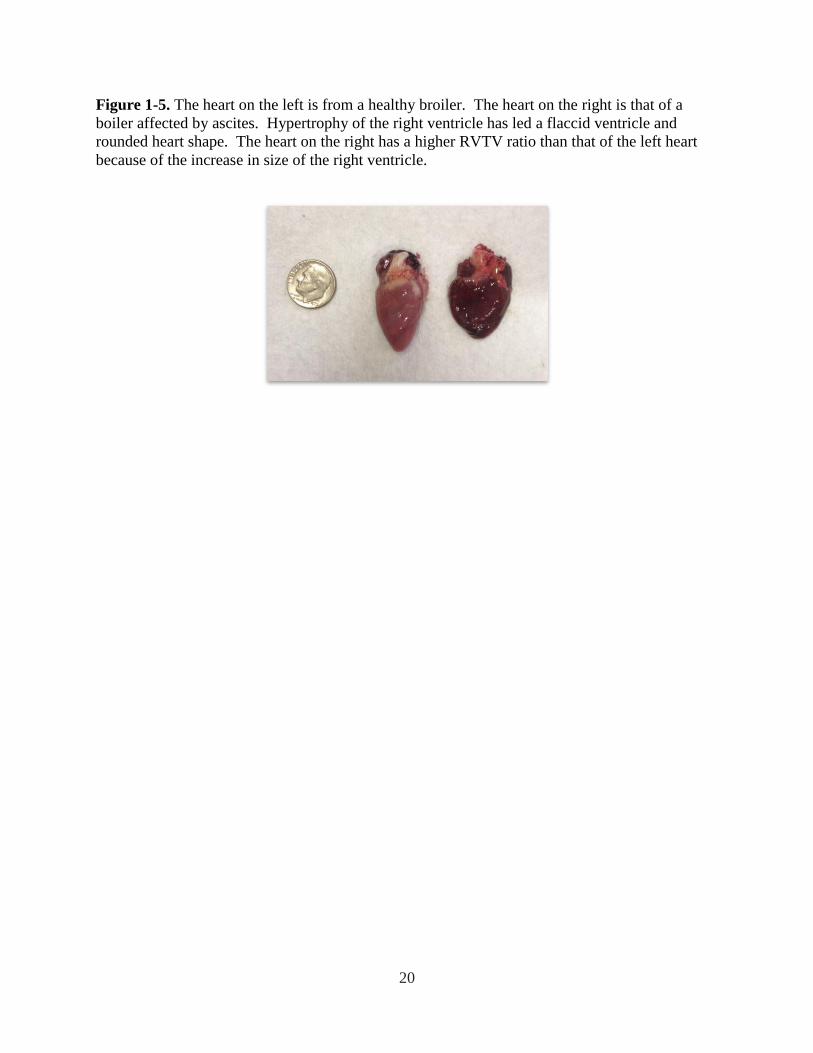
Figure 1-5. The heart on the left is from a healthy broiler. The heart on the right is that of a
boiler affected by ascites. Hypertrophy of the right ventricle has led a flaccid ventricle and
rounded heart shape. The heart on the right has a higher RVTV ratio than that of the left heart
because of the increase in size of the right ventricle. ................................................................... 20
Figure 1-6. Molecular genetics relevant publications plotted against the reported market weight
in lbs). The number of publications per year found using Web of Science search engine. Search
terms included chicken, broiler, hen, SNP, and genome. Projection for 2016 is included. Pounds
of the average broiler live weight at market age reported since 1925. Adapted from the U.S.
Broiler Performance reported by the National Chicken Council. ................................................. 21
Figure 2-1. Genome wide association study results indicate a region of interest around 70 Mbp
on chromosome 2 in resistant individuals comparing two generations of REL line individuals.
Single nucleotide polymorphism loci are identified as the corresponding Mbp along the
chromosome 2. Association of SNP loci to ascites resistance is visualized as a 1-LOGP value. 46
Figure 2-2. Genome wide association results indicating a region of interest around 60 Mbp on
chromosome Z in susceptible individuals comparing two generations of REL line individuals.

2
Single nucleotide polymorphism loci are identified as the corresponding Mbp along the Z
chromosome. Association of SNP loci to ascites susceptibility is visualized as a 1-LOGP value.
....................................................................................................................................................... 47
Figure 3-1. Growth of male broilers measured over 42 days SE. Birds are displayed by their
SNP genotype (A). Additionally, heterozygote offspring (B) and homozygous T offspring (C)
are shown with respect to their parent genotypic crosses. ............................................................ 85
Figure 3-2. Growth of female broilers measured over 42 days SE. Birds are displayed by their
SNP genotype (A). Additionally, heterozygote offspring (B) and homozygous T offspring (C)
are shown with respect to their parent genotypic crosses. ............................................................ 86
Figure 3-3. Mortality due to ascites of a 1990s unselected REL line and data combined from two
modern genetic lines when challenged in a high-altitude simulated environment (unpublished
data)............................................................................................................................................... 87
Figure 5-1. Pounds per person of produced beef, pork, and chicken in the U.S. Data available
through USDA ERS. ................................................................................................................... 117
Figure 5-2. Price per pound of beef, pork, and chicken parts evaluated since 2000. Data
available through USDA ERS. ................................................................................................... 118
Figure 5-3. Consumer perception of healthfulness of beef versus chicken. Values presented as
percent of 3000 individuals surveyed from a balanced representation of U.S. population. Data is
as reported in Husted (2005). ...................................................................................................... 119

1
CHAPTER 1
Literature Review
2
Domestication
Molecular and archeological evidence suggests the chicken was domesticated from a
subspecies of jungle fowl found throughout Southeast Asia, the red jungle fowl (Gallus gallus),
around 7,000-10,000 years ago (West and Zhou, 1988; Fumihito et al., 1994; Xiang et al., 2014).
Domestication events occurred independently throughout this region, including China, Indonesia,
Japan, and India (Liu, et al., 2006; Kanginakudru, et al., 2008). Diverse use of the chicken,
including meat and egg production, religious activities, cockfighting, and ornamentation, all
contribute to the chicken having the most extensive range of all domestic species (Serjeantson,
2009). Prior to WWII, chicken meat production was a secondary market for the egg industry
(National Chicken Council). With the increased accessibility of feed ingredients amplifying
poultry availability, and an increase in consumer consumption of poultry meat at a time of red
meat rationing, both led to the early development of a primitive poultry industry.
Modernization of the Broiler
Beginning in the early 20th century, and continuing today, improving management
techniques, nutritional evaluation, and implementing breeding schemes act as the groundwork
for improvement in the poultry production industry (Titus, 1941; Hutt, 1949; Griffin and
Goddard, 1994; Havenstein et al., 2003; Bessei, 2006). Initial emphasis on mass selection
resulted in a positive response to economically important traits, because these traits maintained
high heritabilities. In commercial broilers this genetic influence led to a rapid positive response
in pedigreed selection systems (Hunton, 2006). At the beginning of the development of what is
considered the precursor to the modern day poultry industry it was realized that a negative
correlation exists between growth-related traits and reproduction-related traits (Siegel and
Dunnington, 1985). For this reason, breeds originally selected as dual-purpose breeds (selection

3
emphasis on meat yield and egg production) were replaced by breeds with specialized selection.
As a result, in North America today, the Cornish Cross represents a majority of the broiler
market, whose selection has created a bird that reaches market weight at d 42.
Consumption of chicken meat has steadily increased since commercially available
products have been monitored beginning in the mid-1900s. Chicken meat surpassed beef and
pork in per capita consumption in pounds per year in the mid 1990’s (MacDonald, 2008). Since
1929, the pounds of poultry produced in the U.S. has increased almost five-fold (Figure 1-1). A
reason for the change in eating habits in the U.S. is partially due to the difference in price. In
December of 2015 the price of beef per pound averaged $5.50, while the price of chicken
averaged $1.94 per pound (Hahn, 2016).
As a result of an increase in demand for chicken meat during the 1940’s selective
breeding in chickens, through progeny testing, for the purpose of altering quantitative traits,
began (Hunton, 2006). Commercial genetic companies formed and began focusing on selection
efforts for traits affecting disease resistance, meat yield, feed efficiency, egg production, meat
quality, among others. Massive gains in economically important traits, specifically breast filet
yield, have been achieved. Evidence of this can be seen in feed conversion decline of 4.42 in a
1957 broiler population to 1.47 in 2003 (Havenstein et al., 2003) and the reduction of time it
takes for a broiler to reach 1.5kg of live weight in 1925 versus 2005: 120 days to 30 days,
respectively (Albers, 1998). In summary, massive changes in management and production
schemes has led to the commercial broiler of today.
Modern Breeding Schemes
Modern broiler breeding companies have developed a broiler breeding and production
system that can be visually represented in a pyramid scheme (Figure 1-2). At the top are pure-

4
bred pedigreed elite lines. In the Cobb-Vantress Inc. (Siloam Springs, AR) breeding program
over 50 performance, production, and general health traits are evaluated from each pedigreed
offspring (Katanbaf and Hardiman, 2010). Pedigreed birds will provide parental generations for
the pure line great grandparent stock, which provides parental generations for the grandparent
stock (Figure 1-3). Pure lines at the grandparent level experience the first line crosses in the
breeding scheme. What results is a two-way cross representing individuals whose pure line
heritage are under selection pressure for either growth, yield, and feed conversion ratio (termed
male lines), or growth, yield, and reproductive traits (termed female lines). The parent
generation is the first instance of ownership by production companies. Finally, commercial
broilers represent a four-way cross of the male and female two-way cross. On a world-wide
basis, it has been estimated that 400,000 pedigreed individuals representing 35-40 pure bred lines
from various companies at the pedigree level will be the progenitors for approximately 400
billion commercial broilers (Pollock, 1999).
Domestication Effects
Ultimately, dramatic changes experienced in the domestic chicken selected for growth
did not occur without negatively resulting consequences to the physiology of the birds. In
tandem with selection for performance traits, undesirable qualities developed. Selection for
rapid growth increases carcass fat, which directly influences leg lameness seen in broilers (Soller
and Eitan, 1984), fluctuation in muscle characteristic consistency due to alterations in age of
slaughter and development (Gous, 1986), and increases in disease accumulation, like sudden
death syndrome (Gardiner, et al., 1988), pulmonary hypertension (Julian, 1993), and negatively
influences reproductive performance (Anthony, 1998; Emmerson, 1997). These domestication

5
effects have been the subject of several review articles (Anthony, 1998; Petracci and Cavani,
2012).
Heart and Lung Function
The avian heart is a four chambered system consisting of right and left atria and
ventricles. The right ventricle works at a low pressure sending blood through to the lungs for
oxygenation, while the left ventricle works at a higher pressure as it perfuses blood for systemic
circulation. The thickness of the left ventricle is approximately two to three times the thickness
of the right ventricle (Olkowski et al., 1998; Tekeli, 2014). The size differential is owed to the
variation in systolic pressures maintained by the right and left ventricle (Speer, 2016). As a
result, the left ventricle is capable of producing a systolic pressure four to five times greater than
in the right ventricle under normal conditions (King and McLelland, 1984).
From approximately 40 g at hatch, a broiler chick has the ability to reach up to 4,000 g at
the processing age of eight weeks (Wideman et al., 2013). To sustain the physiological needs of
the bird during the growth phase heart and lung functions must cope with rapid gain. The
cardiac output, and subsequent stroke volume, are proportional to body mass in all avian species,
but these correlations are higher than what is seen in mammals (Grubb, 1983). Cardiac output
can be calculated as a function of the bird’s heart rate, and the preload and afterload, or the
stroke volume. A broiler heart at hatch has the ability of pumping 8 mL/min, defined as the
bird’s cardiac output, which averages 200 mL/min of cardiac output per kilogram (Wideman,
1999). By eight weeks of age a 4,000 g broiler now must pump 800 mL/min of oxygenated
blood from the left ventricle into the body.
Upon re-entry of circulating blood into the right atrium, for the process of re-oxygenating
the blood, the right ventricle acts to drive the blood from the heart through the lungs via the

6
pulmonary artery through the cardio-pulmonary system. It is the blood flow through the
pulmonary vasculature that is used to calculate the pulmonary arterial pressure. The pulmonary
artery pressure of a clinically healthy bird is measured around 20 mmHg (Chapman and
Wideman, 2001). At this rate, blood travels from the pulmonary artery into the inter- and intra-
parabronchial arterioles. Unilateral gas exchange takes place through diffusion of oxygen
between parabronchi networks extending from the parabronchus lumen to the blood capillaries
filled with pulmonary arterial blood.
Pulmonary Hypertension Syndrome
Pulmonary hypertension syndrome (PHS) is one such domestication effect experienced
by the cardio-pulmonary system that affects high-yield broiler lines. Symptoms linked to PHS
has been described consistently in North American since the 1950s (Sanger et al., 1958;
Schmittle et al., 1958), although, early mentions of flocks of broilers being managed at high
altitude conditions in Bolivia (Hall and Machicao, 1968) and Peru (Cueva et al., 1974) have also
occured. Initially, PHS was most common in high elevation environments, but became a frequent
occurrence in low altitude conditions in the 1980s (Julian, 1993).
The collection of manifestations that encompass PHS has been termed hydropericardium,
ascites, water belly, alimentary toxemia, myocarditis, altitude disease, and congestive heart
failure, among others (Sanger et al., 1958; Hall and Machicao, 1968; Huchzermeyer, 1984;
Wilson et al., 1988). Though the terminology used to describe the disease was initially variable,
PHS, or ascites, is currently the accepted name and will be used interchangeably when described
here.

7
Development of PHS
Pulmonary hypertension syndrome is a cascade of adverse changes in a broiler resulting
from selection for rapid growth and high oxygen demands that is a direct result of selective
pressures placed on muscle gain through increased growth rate (Julian, 1993; Julian, 2000).
Affected individuals can be phenotyped as ascites susceptible externally by evaluating the bird
for lethargy or noting the bird as being cyanotic, or low in oxygen. Additionally, ascites
phenotype can be determined internally by presence of fluid in body cavity (Figure 1-4), a
flaccid right ventricle, and enlarged liver (Olkowski, et al., 1999).
Broilers diagnosed as pre-ascitic experience an increase in pulmonary artery pressure to ≥
45 mmHg (Chapman and Wideman, 2001). This spike in pressure will result in the pulmonary
vascular channels experiencing vasodilation. In mammals, an increase pulmonary artery
pressure will increase the diameter of the pulmonary capillary by over 100% (Sobin et al., 1972;
Mazzone, 1980). In avian species, the pulmonary capillaries are more rigid in structure, and are
only able to accommodate and increase in capillary diameter of approximately 13% (Watson et
al., 2008). Additionally, increase in pressure is associated with abnormalities forming within the
inter-parabronchial pulmonary artery walls, termed medial hypertrophy (MH; Wagenvoort and
Wagenvoort, 1970). The thickening of the artery walls results in the reduction in the amount of
room available for the blood to flow. As a reduction in the inside radius of the vessel occurs due
to MH, Poiseuille’s law describes a simultaneous increase in blood pressure and decrease in flow
rate. Therefore, as the vessel lumen thickens, the pressure required to push deoxygenated blood
through the gas exchange system also increases. The need to push blood faster through the
systems directly influences negative adverse side effects. Initially, the right ventricle’s load
increases as it is forced to increase its cardiac output to compensate for the lack of oxygen being

8
delivered throughout the body. Subsequently, an increase in flow rate dictates the blood will be
pushed faster through the blood capillaries (Wideman et al., 2013). Full diffusion of O2 takes
place in the first 20-30% length of the capillary. At an increased flow rate through the
capillaries, the blood must travel over a longer distance for full gas diffusion to take place.
These steps indicate the beginning of denying the body of adequate oxygenation, which is
termed as a hypoxia.
Chickens in chronic hypoxic environments will experience cardiac hypertrophy of the
right ventricle, and these birds will have larger hearts than those raised in normal conditions
(Burton and Smith, 1967). Calculation of the subsequent right ventricle – to – total ventricle
(RVTV) weight ratio indicates an increase in this value associated with cardiac hypertrophy
(Figure 1- 5). In addition, it has been previously shown that the RVTV ratio and the pulmonary
arterial blood pressure are positively correlated further indicating association between heart
morphology and cardiac health (Burton, 1968; Chapman and Wideman, 2001).
In the process of selective breeding broilers while emphasizing economically important
traits, the growth rate of the heart has decreased in modern broilers when compared to a heritage
line representative of the 1940s (Schmidt et al., 2009). Post-hatch to d 14 in both lines show a
similar heart size to body size ratio. After d 14 the relative size of the heart to the body remains
consistent in the heritage line, but a decline in this ratio is seen in modern broilers. It is probable
that this decrease in relative size lends itself to a decrease in the cardiac capacity of the broiler,
which would lead to a higher incidence in heart related ailments, like PHS.
The growth rate of the heart slows as the bird ages, such that the proportion of the heart
to the total body weight decreases from hatch to d 42 despite large gains in body mass (Forman
and Wideman, 2000; Tickle et al., 2014). Interestingly, increases in blood pressure due to

9
hypoxic conditions is noted in the chicken, but not in naturally occurring avian species, which
can be contributed to a high level of selection pressures (Faraci, 1986).
It is estimated today that in broilers raised under conditions to achieve maximum growth
approximately 3% will be afflicted with pulmonary arterial hypertension (Wideman and Hamal,
2011). The underlying mechanisms necessary for the development of PHS are present in modern
broiler flocks under standard management techniques.
Methods for inducing PHS for study include both invasive and noninvasive techniques.
Chronic evaluations include cold temperatures (Lubritz and McPherson, 1994; Acar et al., 1995;
Wideman et al., 1998; Sato et al., 2002), long photoperiods (Hassanzadeh et al., 2000; Julian,
1990), and high elevation (Balog et al., 2000a) are chronic events seen in a commercial setting
that impact the incidence of PHS.
In cold temperature environments blood viscosity and hematocrit increase in chickens
(Vogel and Sturkie, 1963; Shlosberg et al., 1996; Stammers et al., 2003). Rapidly growing
broilers require a high oxygen demand due to a high metabolic rate, which is further amplified
by cold temperatures. Broilers grown at a cooler temperature have a lower body weight
(Blahova et al., 2007), but ultimately consume more feed than their warm-environment
counterparts, in order to maintain thermogenesis. An increase in cardiac output is observed in
cold-stressed birds to meet increase oxygen demands, but manipulating the delicate
cardiovascular system can lead to PHS (Julian et al., 1989).
Light restriction during growth reduces feed consumption in broilers, which slows the
growth rate (Downs et al., 2006). Oxygen saturation is known to be higher in lighter broilers
than in heavier broilers (Julian and Mirsalimi, 1992). Predisposition to low percent oxygen

10
saturation in the blood dictates that birds whose feed intake is at a maximum level while
experiencing a long photoperiod are more likely to develop ascites (Lott et al., 1996).
To replicate elevated conditions, a hypobaric chamber is used to simulate a set elevation
above sea level through creating a hypoxic environment. The chamber operates by reducing
atmospheric pressure, which in turn, reduces the partial pressure of oxygen by approximately
2.5% for every 1,000 m increase in elevation (Brosnan et al., 2000). Previously published
studies have utilized these noninvasive methods as a way to increase the frequency of PHS that
replicate events that may occur in a normal broiler operation (Owen, et al., 1990; Mirsalimi, et
al., 1993; Balog et al., 2000a; Balog et al., 2000b; los Santos et al., 2005; Pavlidis et al., 2007;
Krishnamoorthy et al., 2014). Out of the techniques previously listed, high elevation is superior
to other methods when inducing PHS because it does not pose an unideal environment which
would prevent optimum growth in the broiler. High elevation also causes PHS at a frequency
high enough for genetic study as compared to long day lengths.
In addition to these chronic stressors, acute techniques have been used for assessment of
ascites resistance. Acute techniques include micro-particle injections where micro-particles of
cellulose are injected into the systemic circulatory system (Wideman et al., 2002; Wideman and
Erf, 2002). Micro-particles become transplanted into the vasculature of the cardio-pulmonary
system, which induces systemic hypoxia. In a second method, users clamp the left pulmonary
artery (Wideman and Kirby, 1995). This method is used to increase cardiac output and elicit
pulmonary hypertension, but proves to be more invasive than micro-particle injections. Such
techniques evaluate ascites outcome at a specific point in time in the bird’s development.
Considering ascites frequency during a snapshot in the growth phase negates consideration of

11
ascites manifestation at all possible times of occurrence when the purpose of assessing ascites is
to create better selections at the pedigreed level.
Ultimately, pulmonary hypertension syndrome frequency is reduced in commercial flocks
through breeding schemes and management techniques like feed restriction (Bolukbasi et al.,
2004) and shorter photoperiods (Lott et al., 1996). In pedigreed flocks, ascites incidence is
evaluated, and this information is used to create breeding schemes that act to reduce the overall
incidence being seen at the commercial broiler level of the production system. Use of
environmental management techniques and of genetic breeding programs have gone a long way
in reducing overall flock incidence. In 2007, economic loss due to ascites incidence in the
United States was estimated at $100 million/year (Pavlidis et al.). The profound economic cost
is due to the tendency of ascites frequency to be highest in the largest, fastest growing birds, for
which the greatest amount of feed and the largest time investment have been made. An updated
estimation in 2015 indicated economic loss has remained consistent between these two years;
however, the USDA reported an increase in broiler production of 3.8 billion pounds between
years 2007 and 2015 (Figure 1-1). Ultimately, while financial loss due to this disease remains
economically relevant, it is clear that methods used to reduce ascites incidence have been
marginally successful.
Genetics of PHS
Although shown to be influenced by environmental factors (Julian, 2000), PHS is also
influenced through genetic parameters (Lubritz and McPherson, 1994; de Greef et al., 2001;
Wideman and French, 2000). Incidence has corresponded with increased genetic selection on
growth rate, live weight, and muscle yield. The genetic influence on PHS has been illustrated in
the low to moderate heritability estimates (Moghadam et al., 2001; Lubritz et al., 1995; Druyan

12
et al., 2007), which has led to success in the creation of divergently selected ascites resistant and
susceptible lines (Pavlidis et al. 2007; Druyan et al., 2009). In three ascites-induced selected
male broiler lines, characterized as selections for growth rate and feed efficiency (RG), moderate
growth and livability (MG), and growth rate and breast yield (YD), Lubritz et al. showed the
frequency of ascites incidence of the YD line to be approximately 0.15 higher than that of RG
and MG lines (1995). Additionally, heritabilities for ascites incidence in these cold-challenged
lines indicate lines with selection pressures focused on increased yield and growth have higher
heritabilities, .36 ± .10, .11 ± .08, and .44 ± .09, for RG, MG, and YD, respectively. The exact
genetic cause behind ascites incidence has been debated. While some groups argue for the
occurrence of one or a few dominant genes (Druyan and Cahaner, 2007; Wideman and French,
2000), other studies indicate cause for evaluating ascites incidence as a multi-genic disease
(Rabie et al., 2005; Hamal et al., 2010).
Krishnamoorthy et al. (2014) used a genome wide association analysis to identify regions
on chromosome 9 from an F2 generation from a cross of an ascites-selected resistant line and an
ascites-selected susceptible line cross. Data indicate a gender-specific effect in relation to the
line analyzed, and the authors went on to propose two candidate genes responsible for a portion
of ascites incidence. Rabie et al. (2005) cited many chromosomal regions as responsible for
ascites incidence including chromosomes 2, 5, 8, 10, 27, and 28. Notably, chromosome 9 was
not implicated as a causal source. Additionally, Rabie et al. (2005) found an association with
RVTV ratio and a region on chromosome 2. Gene expression has also been used as an
evaluation tool in selectively bred resistant and susceptible lines to determine variations in
expression of vasoactive mediators using micro-particle challenged birds exhibiting PHS (Hamal
et al., 2010). A divergently selected ascites susceptible line exhibited an increase in the

13
expression of vasoconstriction receptors, while an ascites resistant line demonstrated higher
expression of vasodilators. These studies indicate advances in the detection of genetic causation
to PHS.
Marker Assisted Selection History
The process of artificial selection in domestic species has been practiced since initiation
of domestication. At the beginning of the poultry industry’s development initial success in trait
selection was due to economically relevant traits having high heritabilities in the case of body
weight (Le Bihan-Duval et al., 1998; Sanda et al., 2014; Venturini et al., 2014), breast yield (Le
Bihan-Duval et al., 1998), and feed conversion (Leenstra and Pit, 1988). Breeding companies
were able to place traditional quantitative genetic selection emphasis on these traits by
maintaining breeding populations that were somewhat closed (Ewart, 1993). Markers in DNA,
or marker assisted selection (MAS), used for the purpose of trait selection has been implemented
in the poultry industry over the last 25 years (Soller, 1994). Reduced costs associated with DNA
sequencing and SNP genotyping has made MAS a reliable and attainable approach for industry
and researchers alike. Sequencing of 1.1 billion bases in the red jungle fowl genome in 2004
made application of molecular biology research more readily available (Hillier et al., 2004).
Identification of 2.8 million single nucleotide polymorphism (SNP) furthered the ability to easily
conduct molecular based research (Wong et al., 2004). The publicly available assembly released
in 2006 (Gallus_gallus-2.1), and subsequent revised assembly in 2011 (Gallus_gallus-4.0) have
aided development of new scientific techniques useful for selection purposes. To better illustrate
that point, a publication search performed using Web of Science™ (Thomas Reuters © 2016)
using title search terms poultry, chicken, and hen, with subject matter terms consisting of SNP

14
and genome, found a marked increase in the number of publications, consistent with the timeline
of the publication of the chicken genome (Figure 1-6).
Marker Assisted Selection in Broilers
Variations in DNA, such as variations in alleles at a single locus among closely related
individuals (SNPs) and short DNA sequences that are either inserted or deleted in the genome
(INDELs) are common tools used in MAS. Not all DNA variants are considered functional.
Functional variations are utilized as presumptive quantitative trait loci (QTL) to understand the
relationship between molecular markers and phenotypic trait data (Kearsey, 1998). Quantitative
trait loci alter the coding sequence of the DNA that can affect production, performance, and
health-related phenotypes. Therefore, selection programs are based on influencing the frequency
of advantageous or disadvantageous alleles (Siegel et al., 2006). In poultry species, the
identification of novel QTL, in respect to economically important traits, have gone a long way to
developing new areas of selection to be emphasized in breeding programs (Wolc et al., 2011;
Godoy et al., 2015; Wolc et al., 2016). Addition of genotypic information increases the accuracy
up to 50% over traditional BLUP analyses solely based on phenotypic information (Chen et al.,
2011). Therefore, genomic selection pressures being applied at the pedigreed level in poultry
production further accentuates the possibilities of traditional quantitative genetics in the pyramid
breeding scheme. It is no coincidence that more gain in broiler market weight has been
experienced in the industry over the last 25 years when MAS techniques have been available,
than over the 60 years prior to the 1990s when selection was based solely on classical genetics
(Figure 1-6).

15
Synopsis
Ascites incidence in broiler populations can be altered through environmental effects,
such as increased elevation and temperature stress (Owen et al., 1990; Balog et al., 2003). In
addition, ascites is influenced through genetic components (Lubritz et al., 1995; Wideman and
French, 2000). Adjustments in management and selection practices have been set in place to
reduce the estimated $100 million per year economic loss seen since 2007 (Pavlidis et al., 2007).
Still, ascites presents itself as a relevant and economically important disease internationally. Use
of MAS in detecting ascites frequency in flocks will provide additional resources in the
development of fast growing broiler lines that are resistant to health defects. Our purpose here is
first, to identify genetic causation to ascites incidence in broiler chicken lines maintained at the
University of Arkansas since the 1990s, and second, to use prediction based models to
effectively predict ascites outcome in broilers using a minimally invasive technique.

16
Figure 1-1 Yearly ready - to - cook broiler production with projections for 2016. Information as
reported by Economic Research Service/USDA.
0
10,000
20,000
30,000
40,000
50,0001950
1955
1960
1965
1970
1975
1980
1985
1990
1995
2000
2005
2010
2015
Mil
lion P
ounds
Yearly Broiler Production (Ready - to - Cook)

17
Figure 1-2. Breeding schemes in modern broiler genetics companies. Adapted from Pollock
(1999).

18
Figure 1-3. Line crosses experienced at each level in the pyramid breeding scheme.

19
Figure 1-4. The bird on the left is a healthy two-week old broiler. The body cavity of the broiler
on the right is distended due to the accumulation of fluid, which indicates the bird has ascites.
20
Figure 1-5. The heart on the left is from a healthy broiler. The heart on the right is that of a
boiler affected by ascites. Hypertrophy of the right ventricle has led a flaccid ventricle and
rounded heart shape. The heart on the right has a higher RVTV ratio than that of the left heart
because of the increase in size of the right ventricle.

21
Figure 1-6. Molecular genetics relevant publications plotted against the reported market weight
in lbs). The number of publications per year found using Web of Science search engine. Search
terms included chicken, broiler, hen, SNP, and genome. Projection for 2016 is included. Pounds
of the average broiler live weight at market age reported since 1925. Adapted from the U.S.
Broiler Performance reported by the National Chicken Council.
0
1
2
3
4
5
6
7
0
20
40
60
80
100
120
No
. o
f P
bli
cati
ons
Market Weight and Publication History Over Time
No. of Publications Market Weight (lbs)
Mark
et Weig
ht (L
bs)
22
REFERENCES
Acar, N., F. G. Sizemore, G. R. Leach, R. F. Wideman, R. L. Owen, and G. F. Barbato. 1995.
Growth of broiler chickens in response to feed restriction regimens to reduce ascites. Poultry
Science 74:833-843.
Albers, G. A. A. 1998. Future trends in poultry breeding. World's Poultry Science Association,
Israel Branch.
Anthony, N. B. 1998. A review of genetic practices in poultry: Efforts to improve meat quality.
Journal of Muscle Foods 9:25-33.
Balog, J. M., N. B. Anthony, M. A. Cooper, B. D. Kidd, G. R. Huff, W. E. Huff, and N. C. Rath.
2000a. Ascites syndrome and related pathologies in feed restricted broilers raised in a hypobaric
chamber. Poultry Science 79:318-323.
Balog, J. M., G. R. Huff, N. C. Rath, and W. E. Huff. 2000b. Effect of dietary aspirin on ascites
in broilers raised in a hypobaric chamber. Poultry Science 79:1101-1105.
Balog, J. M., B. D. Kidd, W. E. Huff, G. R. Huff, N. C. Rath, and N. B. Anthony. 2003. Effect of
cold stress on broilers selected for resistance or susceptibility to ascites syndrome. Poultry
Science 82:1383-1387.
Bessei, W. 2006. Welfare of broilers: a review. Worlds Poultry Science Journal 62:455-466.
Blahova, J., R. Dobsikova, E. Strakova, and P. Suchy. 2007. Effect of low environmental
temperature on performance and blood system in broiler chickens (Gallus domesticus). Acta
Veterinaria Brno 76:S17-S23.
Bolukbasi, S. C., M. Guzel, and M. S. Aktas. 2004. Effect of early feed restriction on ascites
induced by cold temperatures and growth performance in broilers. Journal of Applied Animal
Research 26:89-92.
Brosnan, M. J., D. T. Martin, A. G. Hahn, C. J. Gore, and J. A. Hawley. 2000. Impaired interval
exercise responses in elite female cyclists at moderate simulated altitude. Journal of Applied
Physiology 89:1819-1824.
Burton, R. R., Besch, E. L., Smith, A. H. 1968. Effect of chronic hypoxia on the pulmonary
arterial blood pressure of the chicken. American Journal of Physiology 214.
Burton, R. R., and A. H. Smith. 1967. Effect of polycythemia and chronic hypoxia on heart mass
in chicken. Journal of Applied Physiology 22:782-785.
Chapman, M. E., and R. F. Wideman. 2001. Pulmonary wedge pressures confirm pulmonary
hypertension in broilers is initiated by an excessive pulmonary arterial (precapillary) resistance.
Poultry Science 80:468-473.

23
Chen, C. Y., I. Misztal, I. Aguilar, S. Tsuruta, T. H. E. Meuwissen, S. E. Aggrey, T. Wing, and
W. M. Muir. 2011. Genome-wide marker-assisted selection combining all pedigree phenotypic
information with genotypic data in one step: An example using broiler chickens. Journal of
Animal Science 89:23-28.
Cueva, S., H. Sillau, Valenzue.A, and H. Ploog. 1974. High-altitude induced pulomary
hypertension and right heart failure in broiler chickens. Research in Veterinary Science 16:370-
374.
de Greef, K. H., L. L. G. Janss, A. L. J. Vereijken, R. Pit, and C. L. M. Gerritsen. 2001. Disease-
induced variability of genetic correlations: Ascites in broilers as a case study. Journal of Animal
Science 79:1723-1733.
Downs, K. M., R. J. Lien, J. B. Hess, S. F. Bilgili, and W. A. Dozier. 2006. The effects of
photoperiod length, light intensity, and feed energy on growth responses and meat yield of
broilers. Journal of Applied Poultry Research 15:406-416.
Druyan, S., A. Ben-David, and A. Cahaner. 2007. Development of ascites-resistant and ascites-
susceptible broiler lines. Poultry Science 86:811-822.
Druyan, S., and A. Cahaner. 2007. Segregation among test-cross progeny suggests that two
complementary dominant genes explain the difference between ascites-resistant and ascites-
susceptible broiler lines. Poultry Science 86:2295-2300.
Druyan, S., D. Shinder, A. Shlosberg, A. Cahaner, and S. Yahav. 2009. Physiological parameters
in broiler lines divergently selected for the incidence of ascites. Poultry Science 88:1984-1990.
Emmerson, D. A. 1997. Commercial approaches to genetic selection for growth and feed
conversion in domestic poultry. Poultry Science 76:1121-1125.
Ewart, J. 1993. Evolution of genetic selection techniques and their application in the next decade.
British Poultry Science 34:3-10.
Faraci, F. M. 1986. Circulation during hypoxia in birds. Comparative Biochemistry and
Physiology a-Physiology 85:613-620.
Forman, M. F., and R. F. Wiedeman. 2000. Measurements of pulmonary arterial pressure in
anesthetized male broilers at two to seven weeks of age. Poultry Science 79:1645-1649.
Fumihito, A., T. Miyake, S. I. Sumi, M. Takada, S. Ohno, and N. Kondo. 1994. One subspecies
of the red junglefowl (Gallus-gallus gallus) suffices as the matriarchic ancestor of all domestic
breeds. Proceedings of the National Academy of Sciences of the United States of America
91:12505-12509.
24
Gardiner, E. E., J. R. Hunt, R. C. Newberry, and J. W. Hall. 1988. Relationships between age,
body weight, and season of the year and the incidence of sudden death syndrome in male broiler
chickens. Poultry Science 67:1243-1249.
Godoy, T. F., G. C. M. Moreira, C. Boschiero, A. A. Gheyas, G. Gasparin, M. Paduan, S. C. S.
Andrade, H. Montenegro, D. W. Burt, M. C. Ledur, and L. L. Coutinho. 2015. SNP and INDEL
detection in a QTL region on chicken chromosome 2 associated with muscle deposition. Animal
Genetics 46:158-163.
Gous, R. M. 1986. Genetic Progress in the poultry industry. South African Journal of Animal
Science 16:127-133.
Griffin, H. D., and C. Goddard. 1994. Rapidly growing broiler (meat-type) chickens: their orgin
and use for comparative-studies of the regulation of growth. International Journal of
Biochemistry 26:19-28.
Grubb, B. R. 1983. Allometric relations of cardiovascular function in birds. American Journal of
Physiology 245:H567-H572.
Hahn, W. 2016. Meat Price SpreadsEconomic Research Service, U.S. Department of
Agriculture.
Hall, S. A., and N. Machicao. 1968. Myocarditis in broiler chickens reared at high altitude.
Avian Diseases 12:75-84.
Hamal, K. R., R. F. Wideman, N. B. Anthony, and G. F. Erf. 2010. Differential expression of
vasoactive mediators in microparticle-challenged lungs of chickens that differ in susceptibility to
pulmonary arterial hypertension. American Journal of Physiology-Regulatory Integrative and
Comparative Physiology 298:R235-R242.
Hassanzadeh, M., M. H. Bozorgmerifard, A. R. Akbari, J. Buyse, and E. Decuypere. 2000. Effect
of intermittent lighting schedules during the natural scotoperiod on T3-induced ascites in broiler
chickens. Avian Pathology 29:433-439 .
Havenstein, G. B., P. R. Ferket, and M. A. Qureshi. 2003. Growth, livability, and feed
conversion of 1957 versus 2001 broilers when fed representative 1957 and 2001 broiler diets.
Poultry Science 82:1500-1508.
Hillier, L. W., W. Miller, E. Birney, W. Warren, R. C. Hardison, C. P. Ponting, P. Bork, D. W.
Burt, M. A. M. Groenen, M. E. Delany, J. B. Dodgson, A. T. Chinwalla, P. F. Cliften, S. W.
Clifton, K. D. Delehaunty, C. Fronick, R. S. Fulton, T. A. Graves, C. Kremitzki, D. Layman, V.
Magrini, J. D. McPherson, T. L. Miner, P. Minx, W. E. Nash, M. N. Nhan, J. O. Nelson, L. G.
Oddy, C. S. Pohl, J. Randall-Maher, S. M. Smith, J. W. Wallis, S. P. Yang, M. N. Romanov, C.
M. Rondelli, B. Paton, J. Smith, D. Morrice, L. Daniels, H. G. Tempest, L. Robertson, J. S.
Masabanda, D. K. Griffin, A. Vignal, V. Fillon, L. Jacobbson, S. Kerje, L. Andersson, R. P. M.
Crooijmans, J. Aerts, J. J. van der Poel, H. Ellegren, R. B. Caldwell, S. J. Hubbard, D. V.

25
Grafham, A. M. Kierzek, S. R. McLaren, I. M. Overton, H. Arakawa, K. J. Beattie, Y. Bezzubov,
P. E. Boardman, J. K. Bonfield, M. D. R. Croning, R. M. Davies, M. D. Francis, S. J. Humphray,
C. E. Scott, R. G. Taylor, C. Tickle, W. R. A. Brown, J. Rogers, J. M. Buerstedde, S. A. Wilson,
L. Stubbs, I. Ovcharenko, L. Gordon, S. Lucas, M. M. Miller, H. Inoko, T. Shiina, J. Kaufman, J.
Salomonsen, K. Skjoedt, G. K. S. Wong, J. Wang, B. Liu, J. Yu, H. M. Yang, M. Nefedov, M.
Koriabine, P. J. deJong, L. Goodstadt, C. Webber, N. J. Dickens, I. Letunic, M. Suyama, D.
Torrents, C. von Mering, E. M. Zdobnov, K. Makova, A. Nekrutenko, L. Elnitski, P. Eswara, D.
C. King, S. Yang, S. Tyekucheva, A. Radakrishnan, R. S. Harris, F. Chiaromonte, J. Taylor, J. B.
He, M. Rijnkels, S. Griffiths-Jones, A. Ureta-Vidal, M. M. Hoffman, J. Severin, S. M. J. Searle,
A. S. Law, D. Speed, D. Waddington, Z. Cheng, E. Tuzun, E. Eichler, Z. R. Bao, P. Flicek, D. D.
Shteynberg, M. R. Brent, J. M. Bye, E. J. Huckle, S. Chatterji, C. Dewey, L. Pachter, A.
Kouranov, Z. Mourelatos, A. G. Hatzigeorgiou, A. H. Paterson, R. Ivarie, M. Brandstrom, E.
Axelsson, N. Backstrom, S. Berlin, M. T. Webster, O. Pourquie, A. Reymond, C. Ucla, S. E.
Antonarakis, M. Y. Long, J. J. Emerson, E. Betran, I. Dupanloup, H. Kaessmann, A. S. Hinrichs,
G. Bejerano, T. S. Furey, R. A. Harte, B. Raney, A. Siepel, W. J. Kent, D. Haussler, E. Eyras, R.
Castelo, J. F. Abril, S. Castellano, F. Camara, G. Parra, R. Guigo, G. Bourque, G. Tesler, P. A.
Pevzner, A. Smit, L. A. Fulton, E. R. Mardis, and R. K. Wilson. 2004. Sequence and
comparative analysis of the chicken genome provide unique perspectives on vertebrate evolution.
Nature 432:695-716.
Huchzermeyer, F. W. 1984. Waterbelly - altitude disease. Poultry Bulletin June, 279.
Hunton, P. 2006. 100 years of poultry genetics. Worlds Poultry Science Journal 62:738-738.
Hutt, F. B. 1949. Genetics of the Fowl. John Wiley, New York.
Julian, R. J. 1990. Pulmonary hypertension: a cause of right heart failure, ascites in meat-type
chickens. Feedstuffs 78:19-20.
Julian, R. J. 1993. Ascites in Poultry. Avian Pathology 22:419-454.
Julian, R. J. 2000. Physiological, management and environmental triggers of the ascites
syndrome: a review. Avian Pathology 29:519-527.
Julian, R. J., I. McMillan, and M. Quinton. 1989. The effect of cold and dietary energy on right
ventricular hypertrophy, right ventricle failure and ascites in meat-type chickens. Avian
Pathology 18:675-684.
Julian, R. J., and S. M. Mirsalimi. 1992. Blood oxygen concentration of fast-growing and slow-
growing broiler chickens, and chickens with ascites from right ventricular failure. Avian
Diseases 36:730-732.
Kanginakudru, S., M. Metta, R. D. Jakati, and J. Nagaraju. 2008. Genetic evidence from Indian
red jungle fowl corroborates multiple domestication of modern day chicken. BMC Evolutionary
Biology 8.

26
Katanbaf, M. N., and J. W. Hardiman. 2010. Primary broiler breeding-Striking a balance
between economic and well-being traits. Poultry Science 89:822-824.
Kearsey, M. J. 1998. The principles of QTL analysis (a minimal mathematics approach). Journal
of Experimental Botany 49:1619-1623.
King, A., and J. M. McLelland. 1984. Cardiovascular system. Bailliere Tindall, Eastbourne, UK.
Krishnamoorthy, S., C. D. Smith, A. A. Al-Rubaye, G. F. Erf, R. F. Wideman, N. B. Anthony,
and D. D. Rhoads. 2014. A quantitative trait locus for ascites on chromosome 9 in broiler
chicken lines. Poultry Science 93:307-317.
Le Bihan-Duval, E., S. Mignon-Grasteau, N. Millet, and C. Beaumont. 1998. Genetic analysis of
a selection experiment on increased body weight and breast muscle weight as well as on limited
abdominal fat weight. British Poultry Science 39:346-353.
Leenstra, F. R., and R. Pit. 1988. Fat Deposition in a broiler sire strain. 3. Heritability of and
genetic correlations among body weight, abdominal fat, and feed conversion. Poultry Science
67:1-9.
Liu, Y. P., G. S. Wu, Y. G. Yao, Y. W. Miao, G. Luikart, M. Baig, A. Beja-Pereira, Z. L. Ding,
M. G. Palanichamy, and Y. P. Zhang. 2006. Multiple maternal origins of chickens: Out of the
Asian jungles. Molecular Phylogenetics and Evolution 38:12-19.
los Santos, F. S. D., G. Tellez, M. B. Farnell, J. M. Balog, N. B. Anthony, H. O. Pavlidis, and A.
M. Donoghue. 2005. Hypobaric hypoxia in ascites resistant and susceptible broiler genetic lines
influences gut morphology. Poultry Science 84:1495-1498.
Lott, B. D., S. L. Branton, and J. D. May. 1996. The effect of photoperiod and nutrition on
ascites incidence in broilers. Avian Diseases 40:788-791.
Lubritz, D. L., and B. N. McPherson. 1994. Effect of genotype and cold stress on incidence of
ascites in cockerels. Journal of Applied Poultry Research 3:171-178.
Lubritz, D. L., J. L. Smith, and B. N. McPherson. 1995a. Heritability of ascites and the ratio of
right to total ventricle weight in broiler breeder male lines. Poultry Science 74:1237-1241.
MacDonald, J. M. 2008. The Economic Organization of U.S. Broiler Production in Economic
Information Bulletin No. 38. Economic Research Service, U.S. Department of Agriculture.
Mazzone, R. W. 1980. Influence of vascular and trans-pulmonary pressures on the functional
morphology of the pulmonary microcirculation. Microvascular Research 20:295-306.
Mirsalimi, S. M., R. J. Julian, and E. J. Squires. 1993. Effect of hypobaric hypoxia on slow-
growing and fast-growing chickens fed diets with high and low-protein levels. Avian Diseases
37:660-667.

27
Moghadam, H. K., I. McMillan, J. R. Chambers, and R. J. Julian. 2001. Estimation of genetic
parameters for ascites syndrome in broiler chickens. Poultry Science 80:844-848.
Olkowski, A. A., H. L. Classen, and L. Kumor. 1998. Left atrio-ventricular valve degeneration,
left ventricular dilation and right ventricular failure: A possible association with pulmonary
hypertension and aetiology of ascites in broiler chickens. Avian Pathology 27:51-59.
Olkowski, A. A., D. Korver, B. Rathgeber, and H. L. Classen. 1999. Cardiac index, oxygen
delivery, and tissue oxygen extraction in slow and fast growing chickens, and in chickens with
heart failure and ascites: a comparative study. Avian Pathology 28:137-146.
Owen, R. L., R. F. Wideman, A. L. Hattel, and B. S. Cowen. 1990. Use of a hypobaric chamber
as a model system for investigating ascites in broilers. Avian Diseases 34:754-758.
Pavlidis, H. O., J. M. Balog, L. K. Stamps, J. D. Hughes, W. E. Huff, and N. B. Anthony. 2007.
Divergent selection for ascites incidence in chickens. Poultry Science 86:2517-2529.
Petracci, M., and C. Cavani. 2012. Muscle growth and poultry meat quality issues. Nutrients 4:1-
12.
Pollock, D. L. 1999. A geneticist's perspective from within a broiler primary breeder company.
Poultry Science 78:414-418.
Rabie, T., R. Crooijmans, H. Bovenhuis, A. L. J. Vereijken, T. Veenendaal, J. J. van der Poel, J.
A. M. Van Arendonk, A. Pakdel, and M. A. M. Groenen. 2005. Genetic mapping of quantitative
trait loci affecting susceptibility in chicken to develop pulmonary hypertension syndrome.
Animal Genetics 36:468-476.
Sanda, A. J., O. Olowofeso, M. A. Adele, A. O. Oso, S. O. Durosaro, and M. O. Sanda. 2014.
Heritability and repeatability estimates of some measurable traits in meat type chickens
reared for ten weeks in Abeokuta, Nigeria. International Journal of Biological, Biomolecular,
Agricultural, Food and Biotechnological Engineering 8:782-785.
Sanger, V. L., L. Scott, A. Hamdy, C. Gale, and W. D. Pouden. 1958. Alimentary toxemia in
chickens. Journal of the American Veterinary Medical Association 133:172-176.
Sato, T., K. Tezuka, H. Shibuya, T. Watanabe, H. Kamata, and W. Shirai. 2002. Cold-induced
ascites in broiler chickens and its improvement by temperature-controlled rearing. Avian
Diseases 46:989-996.
Schmidt, C. J., M. E. Persia, E. Feierstein, B. Kingham, and W. W. Saylor. 2009. Comparison of
a modern broiler line and a heritage line unselected since the 1950s. Poultry Science 88:2610-
2619.

28
Schmittle, S. C., H. M. Edwards, and D. Morris. 1958. A disorder of chickens probably due to a
toxic feed-preliminary report. Journal of the American Veterinary Medical Association 132:216-
219.
Serjeantson, D. 2009. Birds. Cambridge University Press, Cambridge.
Shlosberg, A., M. Bellaiche, G. Zeitlin, M. Yaacobi, and A. Cahaner. 1996. Hematocrit values
and mortality from ascites in cold-stressed broilers from parents selected by hematocrit. Poultry
Science 75:1-5.
Siegel, P. B., J. B. Dodgson, and L. Andersson. 2006. Progress from chicken genetics to the
chicken genome. Poultry Science 85:2050-2060.
Siegel, P. B., and E. A. Dunnington. 1985. Reproductive complications associated with selection
for broiler growth. Longman Group, Harlow, Essex, UK.
Sobin, S. S., Rosenqui.Th, H. M. Tremer, and Y. C. Fung. 1972. Elasticity of pulmonary alveolar
microvascular sheet in cat. Circulation Research 30:440-450.
Soller, M. 1994. Marker assisted selection - An overview. Animal Biotechnology 5:193-207.
Soller, M., and Y. Eitan. 1984. Why does selection for liveweight gain increase fat deposition? A
model. World's Poultry Science Journal 40:5-9.
Speer, B. L. 2016. Current Therapy in Avian Medicine and Surgery. Elsevier, St. Louis, MO.
Stammers, A. H., S. N. Vang, B. L. Mejak, and E. D. Rauch. 2003. Quantification of the effect of
altering hematocrit and temperature on blood viscosity. The Journal of Extra Corporeal
Technology 35:143-151.
Tekeli, A. 2014. Effects of ascites (pulmonary hypertension syndrome) on blood gas, blood
oximetry parameters and heart sections of broilers grown at high altitude. Journal of Animal and
Plant Sciences 24:998-1002.
Tickle, P. G., H. Paxton, J. W. Rankin, J. R. Hutchinson, and J. R. Codd. 2014. Anatomical and
biomechanical traits of broiler chickens across ontogeny. Part I. Anatomy of the musculoskeletal
respiratory apparatus and changes in organ size. Peerj 2.
Titus, H. W. 1941. Scientific Feeding Of Chickens. Inter Science, Illinois.
Venturini, G. C., V. A. R. Cruz, J. O. Rosa, F. Baldi, L. El Faro, M. C. Ledur, J. O. Peixoto, and
D. P. Munari. 2014. Genetic and phenotypic parameters of carcass and organ traits of broiler
chickens. Genetics and Molecular Research 13:10294-10300.
Vogel, J. A., and P. D. Sturkie. 1963. Cardiovascular responses of the chicken to seasonal and
induced temperature changes. Science 140:1404-1406.

29
Wagenvoort, C. A., and N. Wagenvoort. 1970. Primary pulmonary hypertension: a pathologic
study of the lung vessels in 156 clinically diagnosed cases. Circulation 42:1163-1184.
Watson, R. R., Z. Fu, and J. B. West. 2008. Minimal distensibility of pulmonary capillaries in
avian lungs compared with mammalian lungs. Respiratory Physiology & Neurobiology 160:208-
214.
West, B., and B. X. Zhou. 1988. Did chickens go north? New evidence for domestication.
Journal of Archaeological science 15:515-533.
Wideman, R. F. 1999. Cardiac Output in four-, five-, and six-week-old broilers, and
hemodynamic responses to intravenous injections of epinephrine. Poultry Science 78:392-403.
Wideman, R. F., and G. F. Erf. 2002. Intravenous micro-particle injection and pulmonary
hypertension in broiler chickens: Cardio-pulmonary hemodynamic responses. Poultry Science
81:877-886.
Wideman, R. F., G. F. Erf, M. E. Chapman, W. Wang, N. B. Anthony, and L. Xiaofang. 2002.
Intravenous micro-particle injections and pulmonary hypertension in broiler chickens: Acute
post-injection mortality and ascites susceptibility. Poultry Science 81:1203-1217.
Wideman, R. F., and H. French. 2000. Ascites resistance of progeny from broiler breeders
selected for two generations using chronic unilateral pulmonary artery occlusion. Poultry Science
79:396-401.
Wideman, R. F., Jr., and K. R. Hamal. 2011. Idiopathic pulmonary arterial hypertension: An
avian model for plexogenic arteriopathy and serotonergic vasoconstriction. Journal of
Pharmacological and Toxicological Methods 63:283-295.
Wideman, R. F., and Y. K. Kirby. 1995. A pulmonary-artery clamp model for inducing
pulmonary-hypertension syndrome (ascites) in broilers. Poultry Science 74:805-812.
Wideman, R. F., D. D. Rhoads, G. F. Erf, and N. B. Anthony. 2013. Pulmonary arterial
hypertension (ascites syndrome) in broilers: A review. Poultry Science 92:64-83.
Wideman, R. F., T. Wing, Y. K. Kirby, M. F. Forman, N. Marson, C. D. Tackett, and C. A. Ruiz-
Feria. 1998. Evaluation of minimally invasive indices for predicting ascites susceptibility in three
successive hatches of broilers exposed to cool temperatures. Poultry Science 77:1565-1573.
Wilson, J. B., R. J. Julian, and I. K. Barker. 1988. Lesions of right heart failure and ascites in
broile chickens. Avian Diseases 32:246-261.
Wolc, A., A. Kranis, J. Arango, P. Settar, J. E. Fulton, N. P. O'Sullivan, A. Avendano, K. A.
Watson, J. M. Hickey, G. de los Campos, R. L. Fernando, D. J. Garrick, and J. C. M. Dekkers.
2016. Implementation of genomic selection in the poultry industry. Animal Frontiers 6:23-31.

30
Wolc, A., C. Stricker, J. Arango, P. Settar, J. E. Fulton, N. P. O'Sullivan, R. Preisinger, D.
Habier, R. Fernando, D. J. Garrick, S. J. Lamont, and J. C. M. Dekkers. 2011. Breeding value
prediction for production traits in layer chickens using pedigree or genomic relationships in a
reduced animal model. Genetics Selection Evolution 43.
Wong, G. K. S., B. Liu, J. Wang, Y. Zhang, X. Yang, Z. J. Zhang, Q. S. Meng, J. Zhou, D. W.
Li, J. J. Zhang, P. X. Ni, S. G. Li, L. H. Ran, H. Li, J. G. Zhang, R. Q. Li, S. T. Li, H. K. Zheng,
W. Lin, G. Y. Li, X. L. Wang, W. M. Zhao, J. Li, C. Ye, M. T. Dai, J. Ruan, Y. Zhou, Y. Z. Li,
X. M. He, Y. Z. Zhang, X. G. Huang, W. Tong, J. Chen, J. Ye, C. Chen, N. Wei, G. Q. Li, L.
Dong, F. D. Lan, Y. Q. Sun, Z. P. Zhang, Z. Yang, Y. P. Yu, Y. Q. Huang, D. D. He, Y. Xi, D.
Wei, Q. H. Qi, W. J. Li, J. P. Shi, M. H. Wang, F. Xie, J. J. Wang, X. W. Zhang, P. Wang, Y. Q.
Zhao, N. Li, N. Yang, W. Dong, S. N. Hu, C. Q. Zeng, W. M. Zheng, B. L. Hao, L. W. Hillier, S.
P. Yang, W. C. Warren, R. K. Wilson, M. Brandstrom, H. Ellegren, R. Crooijmans, J. J. van der
Poel, H. Bovenhuis, M. A. M. Groenen, I. Ovcharenko, L. Gordon, L. Stubbs, S. Lucas, T.
Glavina, A. Aerts, P. Kaiser, L. Rothwell, J. R. Young, S. Rogers, B. A. Walker, A. van Hateren,
J. Kaufman, N. Bumstead, S. J. Lamont, H. J. Zhou, P. M. Hocking, D. Morrice, D. J. de Koning,
A. Law, N. Bartley, D. W. Burt, H. Hunt, H. H. Cheng, U. Gunnarsson, P. Wahlberg, L.
Andersson, E. Kindlund, M. T. Tammi, B. Andersson, C. Webber, C. P. Ponting, I. M. Overton,
P. E. Boardman, H. Z. Tang, S. J. Hubbard, S. A. Wilson, J. Yu, H. M. Yang, and C. Int Chicken
Polymorphism Map. 2004. A genetic variation map for chicken with 2.8 million single-
nucleotide polymorphisms. Nature 432:717-722.
Xiang, H., J. Q. Gao, B. Q. Yu, H. Zhou, D. W. Cai, Y. W. Zhang, X. Y. Chen, X. Wang, M.
Hofreiter, and X. B. Zhao. 2014. Early Holocene chicken domestication in northern China.
Proceedings of the National Academy of Sciences of the United States of America 111:17564-
17569.

31
CHAPTER 2
Multi-generational genome wide association studies identify chromosomal regions associated
with ascites phenotype

32
ABSTRACT
Ascites is a multi-faceted disease commonly observed in fast growing broilers, which is initiated
when the body is insufficiently oxygenated. A series of events follow, including an increase in
pulmonary artery pressure, right ventricle hypertrophy, and accumulation of fluid in the
abdominal cavity and pericardium. Advances in management practices along with improved
selection programs have decreased ascites incidence in modern broilers. However, ascites
syndrome remains an economically important disease throughout the world, causing estimated
losses of $100 million/year. In this study, a 60K Illumina SNP BeadChip was used to perform a
series of GWAS (genome wide association study) on the 16th and 18th generation of our relaxed
(REL) line descended from a commercial elite broiler line beginning in 1995. Regions
significantly associated with ascites incidence were identified on chromosome 2 around 70
megabase pairs (Mbp) and on chromosome Z around 60 Mbp. Five candidate single nucleotide
polymorphism (SNP) were evaluated as indicators for these two regions in order to identify
association with ascites and right ventricle-to-total ventricle weight (RVTV) ratios.
Chromosome 2 SNPs showed an association with RVTV ratios in males phenotyped as ascites
resistant and ascites susceptible (P < 0.04). The chromosome Z region also indicates an
association to resistant female RVTV values (P < 0.01) and susceptible female RVTV values (P
< 0.03). Data also indicate a possible male-specific effect occurring in regards to ascites
incidence for the Z chromosome region. Regions of significance identified on chromosomes 2
and Z described in this study will be used as proposed candidate regions for further investigation
into the genetics of ascites. This information will lead to a better understanding of the
underlying genetics and gene networks contributing to ascites, and thus advances in ascites
reduction through commercial breeding schemes.

33
INTRODUCTION
Ascites, or pulmonary hypertension syndrome, encompasses a cascade of adverse affects
that begins with the impaired ability to adequately oxygenate tissues throughout the body of a
fast growing broiler and ultimately leads to death (Wideman, 1999; Balog et al., 2000;
Decuypere et al., 2005; Wideman et al., 2013). The development of ascites is credited to both
the genetics of the broiler and external environmental factors (Owen et al., 1990; Lubritz et al.,
1995; Wideman and French, 2000; Balog et al., 2003). The response of the body to the increase
in oxygen demand is increased blood flow, which leads to overloading of the heart and lungs
(Julian et al., 1986). Amplified pressure in the cardiovascular system will advance to eventual
right ventricle hypertrophy and concludes with right ventricle failure (Huchzermeyer and
Deruyck, 1986). Selection schemes and management techniques have been implemented to
reduce the overall incidence of ascites; however, it remains an economically important disease
causing an estimated economic loss of $100 million/year (Cooper and Gustin, 2015 personal
communication, Cobb-Vantress, Inc.).
Inducing ascites in an experimental setting can be achieved by altering the environment’s
temperature (Wideman et al., 1998; Sato et al., 2002), air quality (Chineme et al., 1995), and
altitude (Balog et al., 2000). The first documentation of ascites occurred in La Paz, Bolivia
where birds were being raised at an altitude of 3300 m above sea level (Hall and Machicao,
1968). An inverse correlation exists between elevation and the partial pressure of O2. Increasing
elevation leads to hypoxia, or the reduction of O2 inspired and transferred to the tissues. In
broiler chickens the depletion of oxygen in this manner leads to ascites syndrome (Ruiz-Feria
and Wideman, 2001). At the University of Arkansas we have used a hypobaric chamber to

34
simulate a high altitude environment as a non-invasive technique to reliably induce ascites
(Owen et al.,1990; Balog et al., 2000).
Wideman et al. (2013) proposed that the moderate to high heritabilites of ascites reported
from multiple studies (Lubritz et al., 1995; Wideman and French, 2000; de Greef, et al., 2001;
Moghadam et al., 2001; Druyan et al., 2007) are likely due to multiple genes. Recently, a
genome wide association study (GWAS) using a 3.4K SNPChip (Muira, et al., 2008) was
conducted to scan the genome for candidate SNPs associated with ascites in a reciprocal cross
between divergently selected ascites resistant and ascites susceptible lines developed at the
University of Arkansas (Krishnamoorthy et al., 2014). Identification of potential genes relevant
to sex biased ascites incidence were identified on chromosome 9. With advances in high
throughput SNP genotyping assays, followed by the development of a moderate density 60K
Illumina SNP BeadChip (Groenen et al., 2011), GWAS can be used to more comprehensibly
evaluate the broiler genome for ascites associated regions. Here, we report two GWAS for
ascites phenotype conducted on two different generations of a pedigreed research line derived
from a commercial elite broiler line and maintained at the University of Arkansas. Single regions
were identified on two chromosomes that were significantly associated with phenotype for both
generations. Single nucleotide polymorphisms for these regions were then used for additional
genotyping.
METHODS
Genome Data
All chromosomal positions are relative to the November 2011 ICGSC Gallus-gallus-
4.0/galGal4 (GCA_000002315.2) assembly.

35
Bird Stocks and Hypobaric Chamber Trials
Within the hypobaric chamber four batteries that house 40 identical cages measuring 0.6
x 0.6 x 0.3 m. Each cage has access to nipple waterers and trough feeders. The chamber is
designed to control simulated altitude, ventilation, and temperature. For the duration of the trial
the elevation was set to simulate approximately 2900 m above sea level, or 533 mm of Hg.
Daily, the elevation was observed with any adjustments being made to maintain the set altitude.
Chamber airflow was set at 17 m3/min and air filters were changed daily. The chamber was
warmed to 92 C prior to introducing the chicks and the temperature was decreased weekly. The
birds used for this study are from two different years spanning three generations. The 16th and
18th generation were used from a pedigreed elite broiler line that has remained under relaxed
(REL) selection since 1995 (Pavlidis, et al., 2007). Chicks were hatched at the University of
Arkansas hatchery, wing banded and immediately transferred randomly to cages in the hypobaric
chamber. For the next six weeks mortality was recorded and necropsies were completed to
record: probable cause of death, overt visual signs of ascites symptoms, total body weight, heart
shape, right and total ventricle weight, and gender. At the end of the six week trial all remaining
birds were euthanized by cervical dislocation and scored as above.
DNA Isolation
At four days of age 10 µl of blood was extracted from all birds via a lancet puncture
between the toes. A rapid DNA isolation method was used to isolate the DNA (Bailes, et al.,
2007). For GWAS submission crude genomic DNA was purified further using Mackery-Nagel
Plasmid prep plates for gDNA cleanup kit and quantified using a DyNA Quant from Hoefer and
Hoechst 33258 fluorescent stain (Thermo Fisher Scientific).

36
Genome Wide Association Study
A total of two GWAS were completed on two generations of REL line birds that were
phenotyped as described above in a six-week hypobaric chamber challenge. The GWAS was
conducted by DNA Landmarks (Quebec, Canada) using an Illumina 60K SNPChip on REL line
males. Thirty-seven males and 47 females representing REL line generation 16, and 68 males
from generation 18, were used for this study.
SNP allele frequencies were calculated independently for resistant and susceptible
individuals using Microsoft Excel (Microsoft Corp., Redmond, Wa). Loci with a minor allele
frequency of less than 0.05 were excluded. Allele frequencies were used to calculate expected
genotype counts. Deviations from Hardy-Weinberg were computed for each locus based on
observed vs expected genotype counts. Loci with a P-value less than 0.05 were excluded. A chi-
square test was performed comparing the actual and expected frequencies for genotypes
independently for resistant and susceptible phenotype groups. The P-values obtained from this
chi-square test were log transformed plotted as 1-log10(P) for visualization. For each locus an
average 1-Log10(P) was calculated for a sliding window of 10 flanking SNPs.
Real-Time PCR
Specific SNPs were used to develop exonuclease (Taqman® probe) assays for
quantitative real-time PCR genotyping. PCR primers and probes, along with annealing
temperatures are presented in Table 2-1. Genotyping was competed using a CFX96 Touch Real-
Time PCR Detection System (Bio-Rad Laboratories, Inc., Richmond, CA). Reaction volume
totaled 20 µL including 1x Taq-Buffer (50 mM Tris-Cl pH 8.3, 1 mM MgCl2, 30 μg/mL of
BSA), 0.2 mM MgCl2, 0.2 mM dNTP, 0.2 μM each forward and reverse primers, 0.05 μM each
probe, 2.5 units of Taq polymerase, and 2 μL of DNA. A two-step PCR procedure was used as

37
follows: 90°C for 30 seconds, 10 cycles of 90°C for 15 seconds and SNP-specific annealing
temperature for 30 seconds, followed by 90°C for 15 seconds, SNP-specific annealing
temperature for 30 second, and a plate read for a total of 30 cycles.
Statistical Methods
Genotyped individuals were evaluated by ascites phenotype and right ventricle-to-total
ventricle ratio (RVTV). Genotype frequency was calculated for ascites resistant and susceptible
individuals by gender. A chi-square test was performed on expected versus observed counts,
with a P-value of <0.05 indicating significance.
The RVTV ratio was calculated based on associated weights recorded during necropsy.
For each SNP locus a Student’s T-test was used to compare RVTV ratios for each corresponding
genotype, were resistant and susceptible individuals were compared independently. Male and
female RVTV ratios were calculated independently of each other, and RVTV ratios were
considered significant with a P-value of < 0.05.
RESULTS
After application of quality control filtering the 60K Illumina SNP BeadChip analysis
resulted in a total of 37,109 informative SNPs. Of these, 30,650 are mapped to chromosomes 1-
28, and the Z chromosome. Using 1-Log10P threshold of greater than 2.5, informative regions on
chromosomes 2 and Z were identified as candidates for investigation into the genetic causes of
ascites in broilers (P ≤ 0.0316). Out of a total of 4779 SNPs on chromosome 2, 4215 SNP were
polymorphic in the REL line (Figure 2-1). A region around 70 megabase pairs (Mbp) appeared
to show significant association in ascites resistant individuals in both generations. Similarly,
1178 of 1385 SNP were informative on the Z chromosome, for which a region of significance

38
was observed around 60 Mbp and detectable in both generations in susceptible individuals
(Figure 2-2).
Two representative SNPs from the chromosome 2 region, and 3 from the chromosome Z
region, were used for further genotype assays on a larger collection of DNAs from the REL line
(Table 2-2). For SNP 2.708 in the susceptible males the TT and CC genotype both have higher
RVTV averages than the heterozygous individuals. While greater RVTV value equates to a
higher ascites incidence in TT susceptible males, this trend is not replicated in the lower
frequency CC genotyped susceptible males. Right ventricle-to-total ventricle ratios did not vary
significantly between genotypes on chromosome 2 in females (Table 2-3). The average RVTV
for SNP 2.713 for resistant males varied significantly between genotypes (P < 0.05, Table 2-2).
The GG genotype males have the highest RVTV average ratio for the ascites resistant males, and
this genotype has the lowest frequency of ascites (GG-29% vs AG-55%, AA-58%; Table 2-2).
Similarly, homozygous AA genotype susceptible males have a significantly higher RVTV ratio
(0.47) when compared to AG (0.43) or GG (0.43) individuals. Overall, the higher RVTV ratio
for a genotype is associated with the highest percent ascites incidence between all 2.713
genotypes. The GG ascites susceptible males maintain an RVTV average approximately equal to
that of AG genotypes; however, due to the low number of GG susceptible individuals (n = 4), it
is not significantly different from the RVTV ratios representative of the other genotypes.
For all three chromosome Z SNPs, females (the heterogametic sex) have only two
possible genotypes, versus the three possible genotypes found in males. All Z chromosome
SNPs in males appear to be statistically similar in RVTV ratio averages across all genotypes. In
the case of SNP Z.600 resistant females, the C genotype individuals have significantly higher
RVTV values (0.32) than T genotype individuals (0.29; Table 2-3). For the Z.611 locus,

39
susceptible females have higher RVTV values in T genotype compared to C females.
Interestingly, the variation seen in the RVTV values of both susceptible males and females does
not correspond to an expected positive correlation in ascites incidence calculations for genotypes
at every SNP loci.
No significant differences were detected in Chi-square analyses of observed versus
expected counts for any genotype from males and females of all five SNP, although, significance
was approached for GG male genotype on SNP 2.713 and the TT genotype on SNP Z.611 (P-
value = 0.06). These males also represent the lowest ascites percent incidence compared to all
other genotypes in both sexes.
DISCUSSION
Multiple GWAS were conducted, spanning two generations in a randomly mated control
broiler line (REL), to detect loci that showed association with ascites phenotype in both
generations to identify loci that were robust and consistent in association with ascites. Ascites
resistant and susceptible individuals were evaluated on 29 chromosomes using a 60K SNP chip.
Evaluation of P-values at each SNP loci as an averaged sliding window reduced the overall
significance seen in a previously completed GWAS focusing on ascites incidence in REL line
broilers (Krishnamoorthy et al., 2014). It is important to note that the regions previously
identified on chromosome 9 were not significant in these analyses. The prior GWAS used a F2
cross of the resistant and susceptible lines, which were divergently selected from the predecessor
of the REL line. This suggests that epistasis can play a major role in ascites genetics since the F2
cross GWAS identified different regions than a GWAS in the REL line. Genome-wide
association studies provide a powerful insight into the genetic basis for complex diseases;
however, this genotyping technology is subject to Type 1 and Type 2 errors, depending on
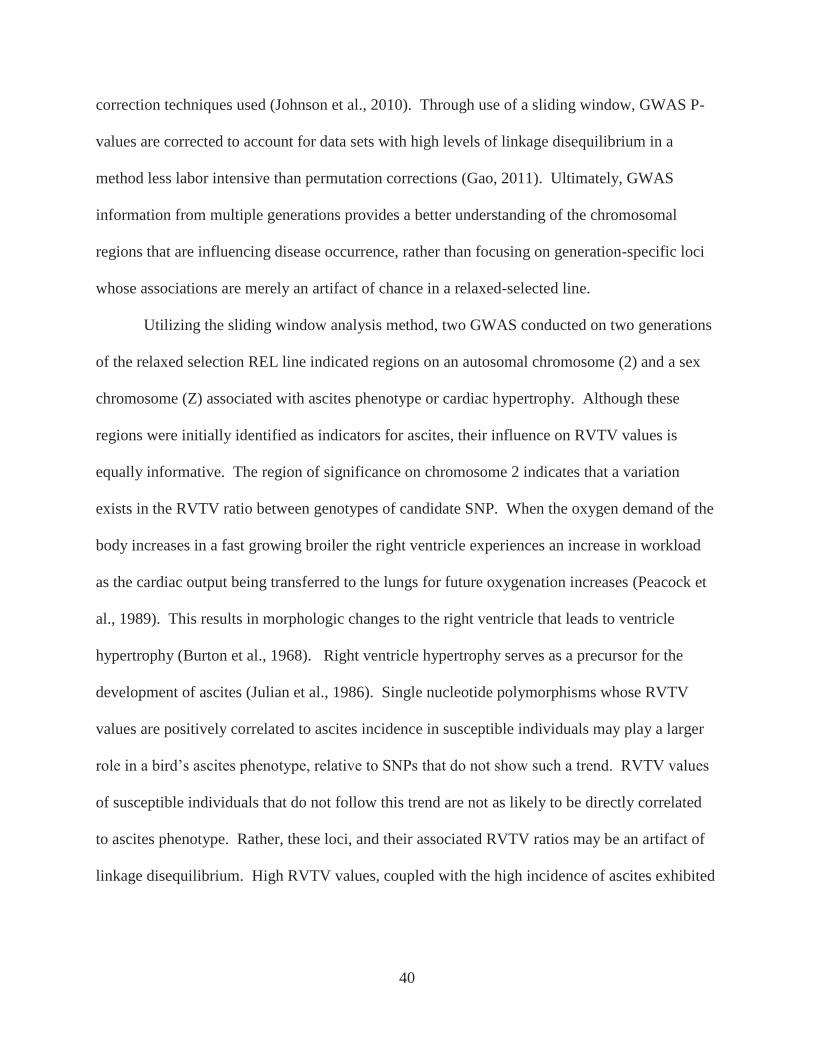
40
correction techniques used (Johnson et al., 2010). Through use of a sliding window, GWAS P-
values are corrected to account for data sets with high levels of linkage disequilibrium in a
method less labor intensive than permutation corrections (Gao, 2011). Ultimately, GWAS
information from multiple generations provides a better understanding of the chromosomal
regions that are influencing disease occurrence, rather than focusing on generation-specific loci
whose associations are merely an artifact of chance in a relaxed-selected line.
Utilizing the sliding window analysis method, two GWAS conducted on two generations
of the relaxed selection REL line indicated regions on an autosomal chromosome (2) and a sex
chromosome (Z) associated with ascites phenotype or cardiac hypertrophy. Although these
regions were initially identified as indicators for ascites, their influence on RVTV values is
equally informative. The region of significance on chromosome 2 indicates that a variation
exists in the RVTV ratio between genotypes of candidate SNP. When the oxygen demand of the
body increases in a fast growing broiler the right ventricle experiences an increase in workload
as the cardiac output being transferred to the lungs for future oxygenation increases (Peacock et
al., 1989). This results in morphologic changes to the right ventricle that leads to ventricle
hypertrophy (Burton et al., 1968). Right ventricle hypertrophy serves as a precursor for the
development of ascites (Julian et al., 1986). Single nucleotide polymorphisms whose RVTV
values are positively correlated to ascites incidence in susceptible individuals may play a larger
role in a bird’s ascites phenotype, relative to SNPs that do not show such a trend. RVTV values
of susceptible individuals that do not follow this trend are not as likely to be directly correlated
to ascites phenotype. Rather, these loci, and their associated RVTV ratios may be an artifact of
linkage disequilibrium. High RVTV values, coupled with the high incidence of ascites exhibited

41
by CC genotyped individuals for both chromosome 2 SNP in susceptible males, dictate that this
region can be used as an indicator for the potential of the broiler to develop ascites.
The region of significance identified on chromosome 2 contains two candidate genes,
MC4R and CDH6. MC4R encodes melanocortin-4 receptor that acts as a key regulator in
appetite and body size (Huszar et al., 1997). Mouse knockouts for MC4R have elevated food
intake and maturity-onset obesity (Huszar et al., 1997; Chen et al., 2000). Additionally, despite
being associated with obesity, MC4R deficient mice have lower mean arterial pressure and are
not hypertensive (Tallam et al., 2005; Tallam et al., 2006). Further, chronic hypothalamic
stimulation of MC4R in rats increased arterial pressure regardless of food intake and weight gain
(Kuo et al., 2003). Therefore, MC4R could play an integral role in regulation of arterial
pressures associated with ascites in broilers. CDH6 encodes cadherin 6; critical for the
development of the renal vesicle and proximal tubule through promotion of mesenchymal to
epithelial transition during embryogenesis (Cho et al., 1998). CDH6 is also found as a surface
receptor protein on platelets (Elrod et al., 2007) and can function in regulating platelet
aggregation (Edwards et al., 2007). Inhibition of CDH6 results in a reduction in thrombus
formation (Dunne et al., 2012). Therefore, dysregulation of CDH6 could contribute to
abnormalities in clotting or vascular lesions observed in the lungs during ascites progression in
broilers (Wideman et al., 2011).
Within the Z chromosome region we identified in the GWAS, is the gene for myocyte
enhancer factor 2C (MEF2c) a member of the family of MADS-box transcription factors
involved in myogenesis and morphogenesis of skeletal, smooth, and cardiac muscle cells (Black
and Olson, 1998). MEF2c is the earliest of the MEF2 family to be expressed in the chick, which
occurs at the beginning of cardiac and skeletal muscle differentiation during embryogenesis

42
(Edmondson et al., 1994). Embryonic inactivation of MEF2c in mice inhibits formation of the
right ventricle, and leads to embryonic lethality (Lin et al., 1997). MEF2C is a key regulator for
reprogramming fibroblasts to the myocyte lineage (Song et al., 2012) and is known to up
regulate other genes known for cardiocyte formation, GATA4 and NKX2.5 (Dodou et al., 2004;
Skerjanc et al., 1998). While significance did not reach the P-value standard set in this study,
resistant and susceptible males in this region identified in both GWAS indicate this location may
be critical to the development of ascites. Preliminary data suggests that SNP Z.611 homozygous
T male individuals phenotyped as ascites susceptible approach statistical significance for lower
RVTV ratios compared to other genotypes (P = 0.074).
Ascites occurs due to the manifestation of multiple symptoms (Olkowski et al., 1999),
and thus, is a complex disease, whose occurrence is subject to many genetic factors. In order to
aid commercial selection programs in the reduction of ascites, and increase overall heart health,
information from studies such as the one presented here will elucidate genetic causes to adverse
attributes evaluated in fast-growing broilers.

43
Table 2-1. Location of SNP identified from GWAS. Annealing temperature, forward and reverse primers, and probes also included
for each SNP.
SNP
ID Chr
SNP
Position
Reference
SNP (rs#)
Reference/
Alternative
Allele
(Strand)
Annealing
Temp (°C) Primer Probe
2.708 2 70835627 14203518 T/C (Fwd) 56.4 F CTCAGCTGGTCCTGCTAACAT Probe 1
CTAAAGTATGAGTAtCCAAGTC
TT1
R TCTGAGGGAGGGAAAAAGGT Probe 2 CTAAAGTATGAGTAcCCAAGTC
2.713 2 71320330 14203691 A/G (Fwd) 52 F
TAATGGAAACAACCTCTGTGCTCT
GGA Probe 1
TCCTAtCCTGAAGAAAGAGCAA
ATAAAT
R GCCTCCCATGTCTTTGGCTTGGA Probe 2 TCCTAcCCTGAAGAAAGAGCA
AATA
Z.591 Z 59169596 10723172 C/T (Fwd) 67 F GGGGGATAGAGGAGGCTGGTGT Probe 1
TAcGACACAATAGGCTTTTCCA
TAAG
R TCACCCTGTCATCGTTTTTGAAAC
ATG Probe 2
TAtGACACAATAGGCTTTTCCA
TAAGT
Z.600 Z 60058344 14748694 T/C (Rev) 68 F GTCCGGCTCTGTGTCTGCCCTGA Probe 1
ACaAAGAGTGGAAATATGGAT
TTCCAGCATC
R TCCAACAGAACTCCCTGGTGTTTC
ACC Probe 2
ACgAAGAGTGGAAATATGGAT
TTCCAGCAT
Z.611 Z 61154772 16774018 C/T (Rev) 59 F
AGGCATTGCTTCCTTCTGGGAGAA
C Probe 1
TGcTTGGATATTCATAAAGTTC
TCCC
R CAGCTGTTAGTTTGGTGGGGGCTT
T Probe 2
TGtTTGGATATTCATAAAGTTCTCCCA
1Lower case letters indicate loci specific for SNP
43

44
Table 2-2. Data collected from single nucleotide polymorphisms from male individuals on chromosomes 2 and Z. Included are SNP
identification names, location, individual counts, percent incidence of ascites-susceptible birds, observed genotypic frequencies, and
corresponding P-values calculated for Chi-squared tests. Additionally, RVTV averaged ratios for resistant and susceptible individuals
are included. Information for males and females presented separately.
REL Line Males
SNP
ID
SNP
Location
(Chr:Mbp) Genotype
Ascites
(%)
R
Count
(N)
S
Count
(N)
Ra
Freq
Sb
Freq Pval
R
RVTV
Avg
S
RVTV
Avg
2.708 Gga2:70.83
TT 62%
74 81
0.35 0.52 0.12 0.31 0.46a
TC 44% 0.47 0.34 0.21 0.32 0.42b
CC 46% 0.18 0.14 0.53 0.32 0.49a
2.713 Gga2:71.32
AA 58%
79 93
0.42 0.49 0.52 0.30b 0.47a
AG 55% 0.45 0.47 0.87 0.30b 0.44b
GG 29% 0.13 0.04 0.06 0.35a 0.44ab
Z.591 GgaZ:59.169
CC 37%
116 86
0.28 0.22 0.38 0.29 0.44
CT 43% 0.42 0.44 0.91 0.31 0.44
TT 47% 0.28 0.34 0.50 0.29 0.44
Z.600 GgaZ:60.058
TT 46%
189 151
0.18 0.19 0.80 0.32 0.45
TC 46% 0.44 0.48 0.70 0.31 0.44
CC 42% 0.37 0.33 0.53 0.30 0.45
Z.611 GgaZ:61.154
CC 39%
115 61
0.50 0.59 0.41 0.30 0.45
CT 36% 0.30 0.33 0.79 0.30 0.45
TT 18% 0.20 0.08 0.06 0.29 0.43 a R indicates birds that were phenotyped as ascites resistant following a high-altitude challenged hypobaric chamber trial. b S indicates birds that were phenotyped as ascites susceptible following a high-altitude challenged hypobaric chamber trial. *Means within the same column and with no common superscript differ significantly (P<0.05).
44

45
Table 2-3. Data collected from single nucleotide polymorphisms from female individuals on chromosomes 2 and Z. Included are
SNP identification names, location, individual counts, percent incidence of ascites-susceptible birds, observed genotypic frequencies,
and corresponding P-values calculated for Chi-squared tests. Additionally, RVTV averaged ratios for resistant and susceptible
individuals are included. Information for males and females presented separately.
REL Line Females
SNP
ID
SNP
Location
(Chr:Mbp) Genotype
Ascites
(%)
R
Count
(N)
S
Count
(N)
Ra
Freq
Sb
Freq Pval
R
RVTV
Avg
S
RVTV
Avg
2.708 Gga2:70.83
TT 58%
78 104
0.51 0.54 0.81 0.32 0.46
TC 57% 0.33 0.34 0.97 0.33 0.47
CC 52% 0.16 0.12 0.60 0.32 0.48
2.713 Gga2:71.32
AA 62%
86 119
0.45 0.53 0.45 0.44 0.44
AG 52% 0.50 0.39 0.26 0.46 0.46
GG 69% 0.05 0.08 0.41 0.45 0.45
Z.591 GgaZ:59.169 C 46%
72 69 0.46 0.41 0.64 0.28 0.43
T 51% 0.54 0.59 0.68 0.30 0.43
Z.600 GgaZ:60.058 T 45%
153 143 0.42 0.36 0.45 0.29b 0.45
C 51% 0.58 0.64 0.55 0.32a 0.45
Z.611 GgaZ:61.154 C 52%
73 79 0.71 0.71 0.98 0.31 0.43b
T 52% 0.29 0.29 0.97 0.29 0.46a a R indicates birds that were phenotyped as ascites resistant following a high-altitude challenged hypobaric chamber trial. b S indicates birds that were phenotyped as ascites susceptible following a high-altitude challenged hypobaric chamber trial. *Means within the same column and with no common superscript differ significantly (P<0.05).
45

46
Figure 2-1. Genome wide association study results indicate a region of interest around 70 Mbp
on chromosome 2 in resistant males comparing two generations of REL line individuals. Single
nucleotide polymorphism loci are identified as the corresponding Mbp along the chromosome 2.
Association of SNP loci to ascites resistance is visualized as a 1-LOGP value.
1.0
1.5
2.0
2.5
3.0
3.5
4.0
1-L
og
10(P
)
Mbp
Male Chromosome 2
Gen. 16
Gen. 18

47
Figure 2-2. Genome wide association results indicating a region of interest around 60 Mbp on
chromosome Z in susceptible males comparing two generations of REL line individuals. Single
nucleotide polymorphism loci are identified as the corresponding Mbp along the Z chromosome.
Association of SNP loci to ascites susceptibility is visualized as a 1-LOGP value.
1.0
1.5
2.0
2.5
3.0
3.5
4.0
1-L
og
10(P
)
Chr:Mbp
Male Chromosome ZGen. 16
Gen. 18

48
REFERENCES
Bailes, S. M., J. J. Devers, J. D. Kirby, and D. D. Rhoads. 2007. An inexpensive, simple protocol
for DNA isolation from blood for high-throughput genotyping by polymerase chain reaction or
restriction endonuclease digestion. Poult. Sci. 86:102-106.
Balog, J. M., N. B. Anthony, M. A. Cooper, B. D. Kidd, G. R. Huff, W. E. Huff, and N. C. Rath.
2000. Ascites syndrome and related pathologies in feed restricted broilers raised in a hypobaric
chamber. Poult. Sci. 79:318-323.
Balog, J. M., B. D. Kidd, W. E. Huff, G. R. Huff, N. C. Rath, and N. B. Anthony. 2003. Effect of
cold stress on broilers selected for resistance or susceptibility to ascites syndrome. Poult. Sci.
82:1383-1387.
Black, B. L., and E. N. Olson. 1998. Transcriptional control of muscle development by myocyte
enhancer factor-2 (MEF2) proteins. Annu. Rev. Cell Dev. Bio. 14:167-196.
Burton, R. R., E. L., Besch, A. H. Smith. 1968. Effect of chronic hypoxia on the pulmonary
arterial blood pressure of the chicken. Am. J. Physiol. 214:1438-1442.
Chen, A. S., J. M. Metzger, M. E. Trumbauer, X. M. Guan, H. Yu, E. G. Frazier, D. J. Marsh, M.
J. Forrest, S. Gopal-Truter, J. Fisher, R. E. Camacho, A. M. Strack, T. N. Mellin, D. E.
MacIntyre, H. Y. Chen, and L. H. T. Van der Ploeg. 2000. Role of the melanocortin-4 receptor in
metabolic rate and food intake in mice. Transgenic Res. 9:145-154.
Chineme, C. N., J. Buyse, N. Buys, M. Hassanzadeh Lademakhi, G. A. A. Albers, and E.
Decuypere. 1995. Interaction of genotype, egg-shell conductance and dietary T3
supplementation in the development of heart-failure syndrome and ascites in broiler-chicken.
Arch. Geflugelkunde 59:129-134.
Cho, E. A., L. T., Patterson, W. T., Brookhiser, S., Mah, C., Kintner, G. R. Dressler. 1998.
Differential expression and function of cadherin-6 during renal epithelium development.
Development 125:30-312.
de Greef, K. H., L. L. G. Janss, A. L. J. Vereijken, R. Pit, and C. L. M. Gerritsen. 2001. Disease-
induced variability of genetic correlations: Ascites in broilers as a case study. J. Anim. Sci.
79:1723-1733.
Decuypere, E., M. Hassanzadeh, and N. Buys. 2005. Further insights into the susceptibility of
broilers to ascites. Vet. J. 169:319-320.
Dodou, E., M. P. Verzi, J. R. Anderson, S. M. Xu, and B. L. Black. 2004. Mef2c is a direct
transcriptional target of ISL1 and GATA factors in the anterior heart field during mouse
embryonic development. Development 131:3931-3942.

49
Druyan, S., A. Ben-David, and A. Cahaner. 2007. Development of ascites-resistant and ascites-
susceptible broiler lines. Poult. Sci. 86:811-822.
Dunne, E., C. Spring, A. Reheman, W. Jin, M. C. Berndt, D. K. Newman, P. J. Newman, H. Ni.,
D. Kenny. 2012. Cadherin 6 has a functional role in platelet aggregation and thrombus
formation. Arterioscler. Thromb. Vasc. Biol. 32:1724-1731.
Edmondson, D. G., G. E. Lyons, J. F. Martin, and E. N. Olson. 1994. Mef2 gene-expression
marks the cardiac and skeletal-muscle lineages during mouse embryogenesis. Development
120:1251-1263.
Edwards, R. J., N. Moran, M. Devocelle, A. Kiernan, G. Meade, W. Signac, M. Foy, S. D. E.
Park, E., Dunne, D., Kenny, D. C. Shields. 2007. Bioinformatic discovery of novel bioactive
peptides. Nat. Chem. Biol. 3:108-112.
Elrod, J. W., J. H., Park, T., Oshima, C. D., Sharp, A., Minagar, J. S. Alexander. 2003.
Expression of junctional proteins in human platelets. Platelets 14:247-251.
Gao, X. Y. 2011. Multiple Testing Corrections for Imputed SNPs. Genet. Epidemiol. 35:154-
158.
Groenen, M. A. M., H.-J. Megens, Y. Zare, W. C. Warren, L. W. Hillier, R. P. M. A.
Crooijmans, A. Vereijken, R. Okimoto, W. M. Muir, and H. H. Cheng. 2011. The development
and characterization of a 60K SNP chip for chicken. BMC Genomics 12.
Hall, S. A., and N. Machicao. 1968. Myocarditis in broiler chickens reared at high altitude.
Avian Dis. 12:75.
Huchzermeyer, F. W., and A. M. C. Deruyck. 1986. Pulmonary-hypertension syndrome
associated with ascites in broilers. Vet. Rec. 119:94-94.
Huszar, D., C. A. Lynch, V. FairchildHuntress, J. H. Dunmore, Q. Fang, L. R. Berkemeier, W.
Gu, R. A. Kesterson, B. A. Boston, R. D. Cone, F. J. Smith, L. A. Campfield, P. Burn, and F.
Lee. 1997. Targeted disruption of the melanocortin-4 receptor results in obesity in mice. Cell
88:131-141.
Johnson, R. C., G. W. Nelson, J. L. Troyer, J. A. Lautenberger, B. D. Kessing, C. A. Winkler,
and S. J. O'Brien. 2010. Accounting for multiple comparisons in a genome-wide association
study (GWAS). BMC Genomics 11.
Julian, R. J., J. Summers, and J. B. Wilson. 1986. Right ventricular failure and ascites in brioler-
chickens caused by phosphorus-deficient diets. Avian Dis. 30:453-459.
Krishnamoorthy, S., C. D. Smith, A. A. Al-Rubaye, G. F. Erf, R. F. Wideman, N. B. Anthony,
and D. D. Rhoads. 2014. A quantitative trait locus for ascites on chromosome 9 in broiler
chicken lines. Poult. Sci. 93:307-317.

50
Kuo, J. J., A. A. Silva, and J. E. Hall. 2003. Hypothalamic melanocortin receptors and chronic
regulation of arterial pressure and renal function. Hypertension 41:768-774.
Lin, Q., J. Schwarz, C. Bucana, and E. N. Olson. 1997. Control of mouse cardiac morphogenesis
and myogenesis by transcription factor MEF2C. Science 276:1404-1407.
Lubritz, D. L., J. L. Smith, and B. N. McPherson. 1995. Heritability of ascites and the ratio of
right to total ventricle weight in broiler breeder males lines. Poult. Sci. 74:1237-1241.
Moghadam, H. K., I. McMillan, J. R. Chambers, and R. J. Julian. 2001. Estimation of genetic
parameters for ascites syndrome in broiler chickens. Poult. Sci. 80:844-848.
Muira, W. M., G. K.-S. Wong, Y. Zhang, J. Wang, M. A. M. Groenen, R. P. M. A. Crooijmans,
H.-J. Megens, H. Zhang, R. Okimoto, A. Vereijken, A. Jungerius, G. A. A. Albers, C. T. Lawley,
M. E. Delany, S. MacEachern, and H. H. Cheng. 2008. Genome-wide assessment of worldwide
chicken SNP genetic diversity indicates significant absence of rare alleles in commercial breeds.
Proc. Natl. Acad. Sci. USA 105:17312-17317.
Olkowski, A. A., D. Korver, B. Rathgeber, and H. L. Classen. 1999. Cardiac index, oxygen
delivery, and tissue oxygen extraction in slow and fast growing chickens, and in chickens with
heart failure and ascites: a comparative study. Avian Pathol. 28:137-146.
Owen, R. L., R. F. Wideman, A. L. Hattel, and B. S. Cowen. 1990. Use of a hypobaric chamber
as a model system for investigating ascites in broilers. Avian Dis. 34:754-758.
Pavlidis, H. O., J. M. Balog, L. K. Stamps, J. D. Hughes, W. E. Huff, and N. B. Anthony. 2007.
Divergent selection for ascites incidence in chickens. Poult. Sci. 86:2517-2529.
Peacock, A. J., C. Pickett, K. Morris, and J. T. Reeves. 1989. The relationship between rapid
growth and pulmonary hemodynamics in the fast-growing broiler chicken. Am. Rev.Respir. Dis.
139:1524-1530.
Ruiz-Feria, C. A., and R. F. Wideman. 2001. Taurine, cardiopulmonary hemodynamics, and
pulmonary hypertension syndrome in broilers. Poult. Sci. 80:1607-1618.
Sato, T., K. Tezuka, H. Shibuya, T. Watanabe, H. Kamata, and W. Shirai. 2002. Cold-induced
ascites in broiler chickens and its improvement by temperature-controlled rearing. Avian Dis.
46:989-996.
Skerjanc, I. S., H. Petropoulos, A. G. Ridgeway, and S. Wilton. 1998. Myocyte enhancer factor
2C and Nkx2-5 up-regulate each other's expression and initiate cardiomyogenesis in P19 cells. J.
Biol.Chem. 273:34904-34910.
Song, K., Y.-J. Nam, X. Luo, X. Qi, W. Tan, G. N. Huang, A. Acharya, C. L. Smith, M. D.
Tallquist, E. G. Neilson, J. A. Hill, R. Bassel-Duby, and E. N. Olson. 2012. Heart repair by
reprogramming non-myocytes with cardiac transcription factors. Nature 485:599-604.

51
Tallam, L. S., A. A. da Silva, and J. E. Hall. 2006. Melanocortin-4 receptor mediates chronic
cardiovascular and metabolic leptin. Hypertension 48:58-64.
Tallam, L. S., D. E. Stec, M. A. Willis, A. A. da Silva, and J. E. Hall. 2005. Melanocortin-4
receptor-deficient mice are not hypertensive or salt-sensitive despite obesity, hyperinsulinemia,
and hyperleptinemia. Hypertension 46:326-332.
Wideman, R. F. 1999. Cardiac Output in Four-, Five-, and Six-Week-Old Broilers, and
Hemodynamic Responses to Intravenous Injections of Epinephrine. Poult. Sci. 78:392-403.
Wideman, R. F., and H. French. 2000. Ascites resistance of progeny from broiler breeders
selected for two generations using chronic unilateral pulmonary artery occlusion. Poult. Sci.
79:396-401.
Wideman, R. F., K. R. Hamal, M. T. Bayona, A. G. Lorenzoni, D. Cross, F. Khajali, D. D.
Rhoads, G. F. Erf, and N. B. Anthony. 2011. Plexiform Lesions in the Lungs of Domestic Fowl
Selected for Susceptibility to Pulmonary Arterial Hypertension: Incidence and Histology. Anat.
Rec. 294:739-755.
Wideman, R. F., P. Maynard, and W. G. Bottje. 1999. Venous blood pressure in broilers during
acute inhalation of five percent carbon dioxide or unilateral pulmonary artery occlusion. Poult.
Sci. 78:1443-1451.
Wideman, R. F., D. D. Rhoads, G. F. Erf, and N. B. Anthony. 2013. Pulmonary arterial
hypertension (ascites syndrome) in broilers: A review. Poult. Sci. 92:64-83.
Wideman, R. F., T. Wing, Y. K. Kirby, M. F. Forman, N. Marson, C. D. Tackett, and C. A. Ruiz-
Feria. 1998. Evaluation of minimally invasive indices for predicting ascites susceptibility in three
successive hatches of broilers exposed to cool temperatures. Poult. Sci. 77:1565-1573.

52
CHAPTER 3
Marker assisted selection for ascites resistance in broilers using a chromosome Z locus

53
ABSTRACT
Ascites syndrome, or pulmonary hypertension, in broiler chickens remains an economically
relevant disease in the poultry industry despite continuous efforts in management practices and
genetic selection schemes to circumvent adverse effects in the broiler. Understanding ascites
genetics will help continue the progress made in reducing ascites frequency that has already been
achieved through utilizing selection techniques at the pedigree level. Here, we have assessed a
single locus in a region of significance evaluated through multi-generational genome wide
association studies in ascites susceptible individuals. Initially, a C/T SNP located at 60.058 Mbp
on chromosome Z indicated association with ascites incidence in male broilers from. This SNP
was used to genotype 576 male and female REL line broilers that were phenotyped for ascites in
a six week trial in a hypobaric chamber. In both males and females there were no significant
associations of ascites phenotype with genotype. However, detectable differences were present
in the percent of phenotyped ascites resistant male offspring through evaluation of the parent
genotypes. There were four possible parental crosses which result in a heterozygote male.
Interestingly, the CT x CW and TT x CW crosses produce CT male individuals for which 63%
and 36% of individuals are resistant, respectively. This data is consistent with a parental allele
effect (imprinting) influencing ascites outcome; an affect which has never before been found in
poultry.

54
INTRODUCTION
Generations of intensive genetic selection for fast growth and high yield has produced the
modern broiler. Broilers of today are more efficient, produce more muscle mass, and less fat
than the broilers of previous generations (Havenstein et al., 2003; Zuidhof et al., 2014).
Rigorous selection practices have resulted in changes in the physiology of the broiler compared
to its ancestor, which lead to novel diseases and disorders (Olkowski et al., 2007; Collins et al.,
2014). Ascites syndrome in broiler chickens is a disease that is linked to selection pressures for
economically important traits in meat-type chickens (Julian, 1998). Ascites is the manifestation
of multiple unfavorable effects, which culminates in death (Julian, 2000). Selection is
traditionally placed on economically important traits. These selective pressures do not
emphasize non-economically relevant traits that are essential to the proper physiological function
of the body, which has led to lung and heart being proportionally smaller to the body in the
modern broiler (Schmidt et al., 2009).
Genetic selection against ascites incidence, along with implementation of management
techniques such as reduced day length (Hassanzadeh et al., 2003) and feed restriction (Acar et
al., 1995), have aided in the reduction of ascites occurrence over the last two decades. However,
ascites remains an economically relevant disease in the poultry industry. The estimated cost due
to ascites syndrome was estimated at $100 million per year in North America in 2015 (Tarrant et
al., in review).
Genetic selection for resistant broilers includes challenging birds with invasive and non-
invasive techniques to induce ascites (Wideman and Erf, 2002; Pavlidis et al., 2007; Wideman,
2014). Birds that prove to be resistant to ascites by displaying resilience to such methods as
micro-particle injections are used as breeders. Environmental or overly-invasive challenge

55
techniques which result in ascites phenotyping through necropsy are used to determine family
data. Siblings of the birds that do not succumb will become breeders for the next generation,
which will hopefully provide an increased resistance to the offspring. These methods for
selectively breeding resistant broilers are effective because of the genetic component to ascites
incidence. Previous studies have indicated specific chromosomal regions associated with ascites
frequency (Krishnamoorthy, et al., 2014). Unfortunately, selection for resistance can only go so
far since resistance may be negatively correlated with production traits. Pulmonary hypertension
and right ventricle failure have been positively correlated with body weight (Moghadam et al.,
2001). Further, feed restriction can reduce ascites incidence, but will result in decreased breast
yield (Acar et al., 1995). There are many suggestions for the chromosomal regions associated
with ascites incidence, but there has yet to be a consensus on such a region in genetically
independent lines (Rabie et al., 2005; Krishnamoorthy et al., 2014). The purpose of this study
was to use a closed population of unselected, relaxed-mated (REL) line birds originating with a
population of broilers from an elite male line of the 1990s to evaluate a SNP identified from a
locus on the Z chromosome which has indicated an association with ascites incidence in male
broilers.
METHODS
Genome data
All chromosomal positions are relative to the ICGSC Gallus-gallus-4.0/galGal4
(GCA_000002315.2) assembly published in November 2011 (http://genome.ucsc.edu).

56
Bird stock
Relaxed (REL) line birds used in this study represent a pedigreed elite male boiler line
representative of the 1990s (Pavlidis et al., 2007). The REL line is maintained under unselected
conditions at the University of Arkansas under IACUC Protocol 15039.
Hypobaric Chamber Trials
A total of 481 male and female REL line broilers were raised in a total of three hypobaric
chamber trials for a duration of six weeks under IACUC protocol 15040. The chamber houses
four stainless steel batteries consisting of 10 pens in each battery measuring 0.6 x 0.6 x 0.3 m.
The pressure was set to simulate approximately 2900 m above sea level. Temperature and
ventilation were monitored and adjusted daily in the chamber, in accordance to industry
standards. Birds were provided ad libidum feed and water through access to waters and trough
feeders. At the end of the six-week trial all birds were necropsied to be phenotyped as ascites
resistant or susceptible based on cardiac morphometrics and abdominal fluid accumulation.
Floor Trial and Processing
Siblings representing most of the parent genotypic crosses were raised at sea level and
processed at eight weeks of age. Birds were allowed ad libidum feed and water. Weights were
recorded at d 0, d 14, d28, d35, and d42. Absolute weights were recorded for whole bird without
giblets (WOG), ab fat, chilled weight, rack, breast fillet, tenders, wings, and legs. Percent
weights were also calculated for breast, dark, fat, and WOG. Finally, pH and color values (L*,
a*, and b*) were measured on the right breast fillet. Each measurement was taken three times,
and the results were averaged for each individual.

57
Blood Extraction, DNA Isolation, and Genotyping
Blood was collected from the wing vein in breeders, or from between the toes of chicks at
four days of age. DNA was isolated using methods described in Bailes et al. (2007). A
previously conducted genome wide association study completed was completed on generation 16
and 18 indicated an association with ascites incidence in male individuals (Tarrant et al., in
review). Through this study a C/T SNP was identified on the Z chromosome in a region
indicated significance around 60 Mbp (rs14748694). To further investigate this locus an
exonuclease assay, using TaqMan probes, was developed for genotyping this SNP using real-
time PCR as described in Tarrant et al. (in review). Assay mix included 1x Taq-Buffer (50 mM
Tris-Cl pH 8.3, 1 mM MgCl 2 , 30 μg/mL of BSA), 0.2 mM MgCl 2 , 0.2 mM dNTP, 0.2 μM
each forward and reverse primers, 0.05 μM each probe, 2.5 units of Taq polymerase, and 2 μL of
DNA, for a total volume of 20 μL. Real time PCR followed two steps of 90°C for 30 seconds,
10 cycles of 90°C for 15 seconds 68oC for 30 seconds, followed by 30 cycles of 90°C for 15
seconds, 68°C for 30 seconds with a plate read.
Statistical Analysis
A Chi-squared analysis was used to determine the statistical variation in the raw count
totals for ascites phenotyped individuals. Processing values were evaluated using Tukey HSD
with an alpha value of 0.05.
RESULTS
The SNP selected from the previous GWAS studies (Tarrant et al., in review) was
employed as a representative for the Z chromosomal region around 60 Mbp. The locus was
identified as being sex-specific to males. The two GWAS represent two generations, separated
by two years, of the REL line birds phenotyped for ascites phenotype. According to the ICGSC

58
Gallus_gallus-4.0/galGal4 assembly the SNP is approximately 80 kbp upstream of the Ensembl
gene myocyte enhancement factor – 2 (Mef2c). Mef2c falls within the MADS-box transcription
factor family (Black and Olson, 1998). It is required in the process of myogenesis, specifically
in the differentiation of ventricular cardiomyocytes (Vong et al., 2006). The importance of the
Mef2c gene to healthy heart development can be evaluated in knock out mice, whose loss of the
Mef2c gene not only reduces the size of the left ventricle, but prevents right ventricle
development altogether (Lin et al., 1997).
REL line breeders were genotyped for the SNP and assigned to breeding groups based on
pre-determined genotypes. Pooled semen was used to inseminate hens within each group. Male
and female breeders within each group were selected to produce offspring of every possible
genotypic combination for hypobaric trials. Raw counts of genotypes and their phenotypes from
the hypobaric challenge are presented in Table 3-1. Females are the heterogametic sex,
therefore, they are presented as having only two genotypes, CW and TW. In male offspring, the
percent of individuals that were phenotyped as ascites resistant was highest in homozygous C
individuals, while heterozygous individuals had the lowest percent resistant. CW genotype
females exhibit a higher present resistance. A Chi-squared test was applied to individual counts
in males and females separately. Although the percent of resistant individuals for each genotype
is variable, there are no significant differences in either sex, or between allele frequencies when
comparing the sexes. It is likely the relatively low sample size in males and females exhibiting C
alleles contributes to the lack of significant variation. It was determined that the lowest
frequency genotypes in the parent generation were the CC sires and the CW dams. Compared to
the CT genotype (0.41) and the TT genotype (0.54) the frequency of CC sires was 0.05. Further,

59
the CW dam genotype frequency was at 0.26 compared to CW females compared to 0.74 for TW
dams.
The region selected for intensive study initially indicted an association with ascites in
both REL line generations 16 and 18. Using selected breedings to produce offspring genotyped
and raised in the hypobaric chamber did not relay findings determined through the GWAS. To
understand why regions of significance were detected from the initial GWAS it was then decided
to examine the parent genotypes. Table 3-2 shows the parental genotype crosses associated with
each male genotype outcome. Also shown are the raw counts for all offspring in each cross
group, raw counts for assignments resistant phenotype offspring, and raw counts for same
susceptible phenotype offspring. CC genotype male offspring that are the result of CC x CW
cross were excluded from further analysis because there were so few representatives. The CT x
CW crosses produce male offspring that are genotyped as either CC or CT. This cross produced
the individuals that were the most resistant to high altitude challenge (62% and 63%). Four
parental crosses result in heterozygote offspring, but crosses are significantly variable in their
resistance to ascites. Specifically, the highly resistant CT x CW cross (63%) and the TT x CW
cross (36%). Both crosses resulting in TT genotyped male offspring did not vary significantly.
Female offspring percent resistance was not variable between crosses resulting in CW genotypes,
or within TW genotypes (Table 3-3). Though the TW resistant individuals are approximately
10% lower calculated resistance column of each cross when compared to CW genotyped
females, these values are not significantly different.
Appraisal of processing data revealed male genotypes showed no significant differences
in parts evaluated for absolute weight (Table 3-4), percent of carcass and meat weights (Table 3-
5), or in breast fillet pH and color (Table 3-6). At d 0 and d 14 significant differences existed in

60
body weight, but these differences are not detectable at d 21, 28, 35 or 42 (Figure 3-1A).
Processing data was also evaluated as parent genotypic crosses. CC sires were not included in
mating combinations used for this study. Mean male wing and leg weights of the TT x CW cross
was significantly larger than that of the CT x TW cross (Table 3-7). The difference of WOG
weight of TT x CW approaches significance in comparison to CT x TW at a P-value of 0.12. TT
x CW males have significantly larger mean body weights at d 0, d 14, and at processing d 42
(Figure 3-1B). As would be expected, the TT x CW crosses exhibiting larger mean values are
associated with a reduced percent of ascites resistance (36%) compared to that of CT x TW
(57%). Despite these distinctions, breast and tender weights, percent weights (Table 3-8), and
breast traits (Table 3-9) showed no significant differences. Homozygous T males which were
processed that had resulted from a CT x TW or TT x TW cross showed no significant differences
in any trait measured (Tables 3-10, 11, and 12).
Female body weights differed at d 0 and d 14 by genotype (Figure 3-2A), but significant
differences between CW and TW females did not exist in processing trait evaluations (Tables 13,
14, 15). Absolute weight values (Table 3-16) and percent weight values (Table 3-17) showed no
differences in crosses resulting in CW female offspring. The b* value was greater in CT x CW
crosses versus CT x TW crosses, but all other breast traits showed no differences (Table 3-18).
Four crosses were evaluated that are associated with TW female offspring. For each of the traits
measured, or calculated, differences did not arise (Tables 3-19, 20, and 21). Crosses creating
both CW and TW offspring exhibit significant differences in body weight at d 0, but this
variation did not exist in any of the other time points measured (Figure 3-2B, C).

61
CONCLUSIONS
Major changes in the physiology of the chicken have resulted in modern broilers afflicted
with ascites incidence at an increased rate compared to broilers from 20 years ago (Figure 3-3).
Broiler mortality due to high altitude challenge in the hypobaric chamber is reported between
individuals representing the unselected REL line from the 1990s and individuals from two
modern broiler lines. By d 34 30% of the REL line birds had succumbed to ascites, while 50%
of the modern line birds died under high altitude conditions. This is likely a direct result of
selective breeding with emphasis on the increase of body weight exhibiting the associated influx
in ascites incidence due to this selection practice (Krishnamoorthy et al., 2016, unpublished
data).
Ultimately, phenotype is a direct result of genotype and the environment. Of course
environment plays a pivotal role in the manifestation of disease, as in ascites syndrome in
broilers. Induction of ascites through environmental manipulation has been used for the past
three decades to further explore details in ascites etiology (Julian and Wilson, 1992; Shlosber et
al., 1996; Ipek and Sahan, 2006; Shi et al., 2014; Tekeli, 2014).
Genome wide association studies identify regions in the genome that indicate significant
associations to economically important traits in valuable livestock species (Guo et al., 2012;
Wang et al., 2014; Reyer et al., 2015; Zhang et al., 2015). Identification of QTL have indicated
few complex traits or diseases explored through genome wide association studies are explained
solely by genetic variation (Altmüller et al., 2001; Manolio et al., 2009). For this reason there is
cause to suggest additional sources genetic correlation to traits be explored.
In concept, paternal and maternal genetic material that is passed to an offspring have an
equal chance of being active (Barlow and Bartolomei, 2014). Epigenetics challenges traditional

62
ideas of gene activation. Epigenetic processes lead to alterations in gene activity, with no
corresponding changes in the DNA sequence (Weinhold, 2006).
Maternal effects are defined as the influence on the offspring phenotype due to maternal
phenotype or genotype (Wolf and Wade, 2009). Maternal effects for ascites related traits have
been documented in cold stressed broilers (Pakdel et al., 2005) and in broilers raised in normal
rearing conditions (Navarro, et al., 2006). Parent – of – origin – dependent effects indicate that
gene function is directly related to chromosomal inheritance from the father or the mother (Reik
and Walter, 2001). Genomic imprinting is the disparity of genotypic expression owing to the
source of inheritance of genetic material (Hall, 1997). Specifically, gene expression of the male
or female offspring is limited to the chromosome of either parent in diploid organisms if that
gene is imprinted. This epigenetic mechanism has been identified in arthropods (Anaka et al.,
2009), marsupials (Renfree et al., 2009), human disorders (Nicholls, 2000; Dong et al., 2005),
and in economically important livestock species (Thomsen et al., 2004; O'Doherty et al., 2015).
These effects are caused by processes such as DNA methylation and chromatid modification
(Weinhold, 2006).
Conflicting reports of monoallelic (Koski et al., 2000) versus biallelic (O'Neill et al.,
2000) gene expression in chickens indicates that orthologs of known imprinted genes in
mammals may be expressed epigenetically. Although epigenetic mechanisms are not well
described in avian species (Fresard et al., 2013) it is possible that the discrepancy detected in
ascites resistance between parental crosses for this study are due to underlying epigenetic factors.
Interestingly, the respective parental crosses for the two ascites – resistant – extreme
heterozygote male offspring, CT x CW (63% resistance) and TT x CW (36% resistance), do not
fall into traditional parent – of – origin effects. Presumably, the CT heterozygous male offspring

63
obtains the T allele from the sire, and the C allele from the dam, in both the CT x CW and TT x
CW crosses. This negates the hypothesis that obtaining an allele from the sire or dam influences
ascites resistance based on the data presented here, but does not completely forgo the conclusion
that imprinting is at work. Further, results from processing data obtained from this study
indicate that the elimination of the most ascites-susceptible cross (TT x CW) would do little to
impact the economic value of the male bird being produced from the REL line.
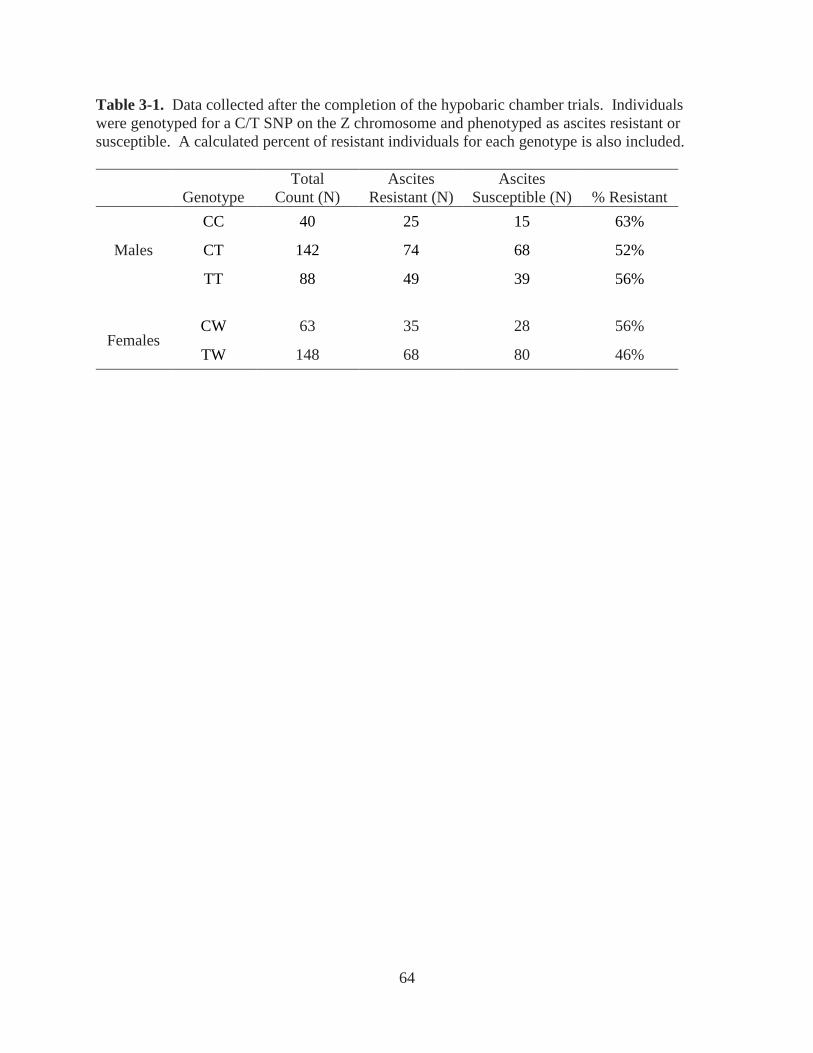
64
Table 3-1. Data collected after the completion of the hypobaric chamber trials. Individuals
were genotyped for a C/T SNP on the Z chromosome and phenotyped as ascites resistant or
susceptible. A calculated percent of resistant individuals for each genotype is also included.
Genotype
Total
Count (N)
Ascites
Resistant (N)
Ascites
Susceptible (N) % Resistant
Males
CC 40 25 15 63%
CT 142 74 68 52%
TT 88 49 39 56%
Females CW 63 35 28 56%
TW 148 68 80 46%

65
Table 3-2. Counts of ascites resistant and susceptible males with associated genotype and
parental genotypic cross.
Genotype
Parental Crosses
(Sire x Dam)
Total
Count (N)
Ascites
Resistant (N)
Ascites
Susceptible (N) % Resistant
CC CT x CW 37 23 14 62%a
CT CT x CW 52 33 19 63%a
CT CT x TW 40 20 20 50%ab
CT CC x TW 14 8 6 57%ab
CT TT x CW 36 13 23 36%b
TT CT x TW 35 19 16 54%ab
TT TT x TW 53 30 23 57%ab
1Different letter superscripts indicate significant differences (P 0.05).

66
Table 3-3. Counts of ascites resistant and susceptible females with associated genotype and
parental genotypic cross.
Genotype
Parental Crosses
(Sire x Dam)
Total
Count (N)
Ascites
Resistant (N)
Ascites
Susceptible (N) % Resistant
CW CC x TW 9 5 4 56%
CW CT x CW 54 30 24 56%
CW CT x TW 43 23 20 53%
TW CT x CW 36 19 17 53%
TW CT x TW 50 23 27 46%
TW TT x CW 32 15 17 47%
TW TT x TW 66 30 36 45%

67
Table 3-4. Absolute weight means1 for male offspring.
Male Genotypes CC CT TT
% Resistance2 63 52 56
N 36 87 57 A
bso
lute
Wei
ghts
(g)
WOG3 2018 ± 38 2003 ± 24 1946 ± 29
Ab Fat 96 ± 3 91 ± 2 89 ± 2
Chilled 2079 ± 40 2059 ± 25 2002 ± 30
Breast 395 ± 10 391 ± 6 384 ± 8
Tenders 102 ± 2 102 ± 1 101 ± 2
Wings 221 ± 3 219 ± 2 214 ± 2
Legs 299 ± 6 297 ± 3 290 ± 4
Thighs 396 ± 9 397 ± 5 385 ± 6
Rack 648 ± 13 636 ± 8 610 ± 10
1Average means ± SE in grams; 2 Percentage mortality due to ascites; 3 Carcass weight without
giblets.
*Means within the same row with superscripts that differ are significantly different (p<0.05)

68
Table 3-5. Percent weight means1 for male offspring.
Male Genotypes CC CT TT
% Resistance2 63 52 56
N 36 87 57
Per
cent
Wei
ghts
(g)
% Breast3 0.1721 ± 0.0025 0.1721 ± 0.0016 0.1728 ± 0.0019
% WOG4 0.6996 ± 0.0024 0.6995 ± 0.0016 0.6981 ± 0.0019
% Fat5 0.0335 ± 0.0012 0.0320 ± 0.0008 0.0317 ± 0.0299
% Dark6 0.2412 ± 0.0026 0.2416 ± 0.0017 0.2410 ± 0.0020
1Average percent means ± SE in grams; 2Percentage mortality due to ascites; 3((Pectoralis Major
+ Pectoralis Minor)/Dock Weight) *100; 4((WOG)/Dock Weight); 5(Abdominal Fat/Dock
Weight)*100; 6((Thigh + Leg)/Dock Weight)*100.

69
Table 3-6. Averaged breast fillet traits for male offspring.
Male Genotypes CC CT TT
% Resistance1 63 52 56
N 36 87 57
Bre
ast
Tra
its
pH 5.86 ± 0.11 5.78 ± 0.06 5.65 ± 0.07
L* 49.29 ± 0.45 49.43 ± 0.29 49.99 ± 0.34
a* 4.20 ± 0.16 4.28 ± 0.10 4.20 ± 0.12
b* 1.19 ± 0.23 1.06 ± 0.15 1.44 ± 0.18
1Percentage mortality due to ascites.

70
Table 3-7. Absolute weight means1 for parental crosses resulting in heterozygous male offspring.
CT Offspring Parental Cross CTxCW CTxTW TTxCW
% Resistance2 50 57 36
N 24 28 24
Abso
lute
Wei
ghts
(g)
WOG3 1967 ± 37ab 1960 ± 40
b 2087 ± 32
a
Ab Fat 93 ± 3 88 ± 4 93 ± 3
Chilled 2018 ± 38 2028 ± 41 2114 ± 37
Breast 381 ± 10 390 ± 12 399 ± 10
Tenders 97 ± 3ab
102 ± 3b 107 ± 3
a
Wings 215 ± 3b 213 ± 4
b 2279± 3a
Legs 291 ± 7ab 286 ± 5
b 312 ± 5a
Thighs 390 ± 11ab
383 ± 10b 415 ± 9
a
Rack 635 ± 14 625 ± 13 649 ± 13
1Average means ± SE in grams; 2 Percentage mortality due to ascites; 3 Carcass weight without
giblets.
*Means within the same row with superscripts that differ are significantly different (p<0.05)

71
Table 3-8. Percent weight means1 for parental crosses resulting in heterozygous male offspring.
CT Offspring Parental Cross CTxCW CTxCW CTxCW
% Resistance2 50 57 36
N 24 28 24
Per
cent
Wei
ghts
(g)
% Breast3 0.1706 ± 0.0031 0.1752 ± 0.0030 0.1704 ± 0.0023
% WOG4 0.7023 ± 0.0029 0.6993 ± 0.0033 0.6972 ± 0.0025
% Fat5 0.0333 ± 0.0012 0.0317 ± 0.0016 0.0317 ± 0.0292
% Dark6 0.2404 ± 0.0036 0.2391 ± 0.0027 0.2441 ± 0.0028
1Average percent means ± SE in grams; 2Percentage mortality due to ascites; 3((Pectoralis Major
+ Pectoralis Minor)/Dock Weight) *100; 4((WOG)/Dock Weight); 5(Abdominal Fat/Dock
Weight)*100; 6((Thigh + Leg)/Dock Weight)*100.
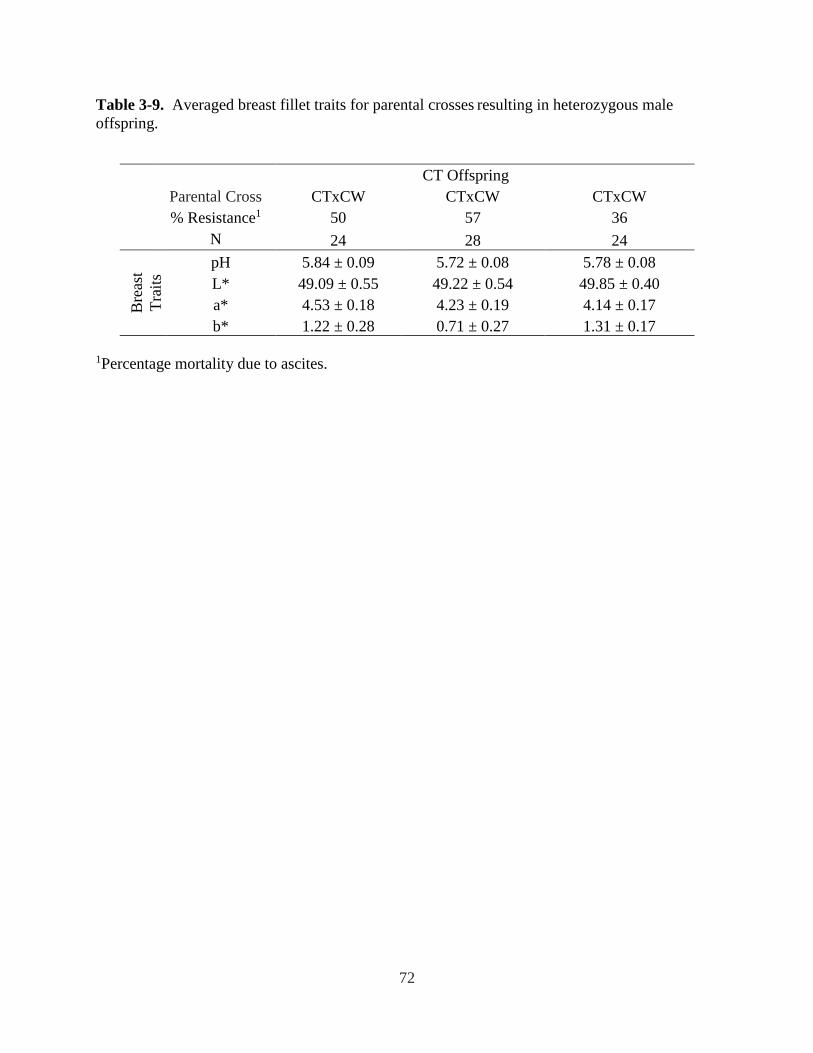
72
Table 3-9. Averaged breast fillet traits for parental crosses resulting in heterozygous male
offspring.
CT Offspring Parental Cross CTxCW CTxCW CTxCW
% Resistance1 50 57 36
N 24 28 24
Bre
ast
Tra
its
pH 5.84 ± 0.09 5.72 ± 0.08 5.78 ± 0.08
L* 49.09 ± 0.55 49.22 ± 0.54 49.85 ± 0.40
a* 4.53 ± 0.18 4.23 ± 0.19 4.14 ± 0.17
b* 1.22 ± 0.28 0.71 ± 0.27 1.31 ± 0.17
1Percentage mortality due to ascites.

73
Table 3-10. Absolute weight means1 for parental crosses resulting in homozygous T male
offspring.
TT Offspring Parental Cross CTxTW TTxTW
% Resistance2 54 57
N 22 35
Abso
lute
Wei
ghts
(g)
WOG3 1921 ± 71 1950 ± 43
Ab Fat 86 ± 5 90 ± 4
Chilled 1981 ± 75 2001 ± 45
Breast 385 ± 17 381 ± 11
Tenders 100 ± 4 101 ± 3
Wings 210 ± 5 216 ± 4
Legs 279 ± 10 294 ± 6
Thighs 372 ± 17 390 ± 8
Rack 615 ± 23 608 ± 15
1Average means ± SE in grams; 2 Percentage mortality due to ascites; 3 Carcass weight without
giblets.

74
Table 3-11. Percent weight means1 for parental crosses resulting in homozygous T male
offspring.
TT Offspring Parental Cross CTxTW TTxTW
% Resistance2 54 57
N 22 35
Per
cent
Wei
ghts
(g)
% Breast3 0.1752 ± 0.0031 0.1709 ± 0.0031
% WOG4 0.7010 ± 0.0024 0.6955 ± 0.0028
% Fat5 0.0308 ± 0.0014 0.0322 ± 0.0013
% Dark6 0.2355 ± 0.0038 0.2431 ± 0.0020
1Average percent means ± SE in grams; 2Percentage mortality due to ascites; 3((Pectoralis Major
+ Pectoralis Minor)/Dock Weight) *100; 4((WOG)/Dock Weight); 5(Abdominal Fat/Dock
Weight)*100; 6((Thigh + Leg)/Dock Weight)*100.

75
Table 3-12. Averaged breast fillet traits resulting in homozygous T male offspring.
TT Offspring Parental Cross CTxTW TTxTW
% Resistance1 54 57
N 22 35
Bre
ast
Tra
its
pH 5.58 ± 0.15 5.66 ± 0.10
L* 50.45 ± 0.70 49.77 ± 0.51
a* 4.13 ± 0.22 4.22 ± 0.19
b* 1.37 ± 0.32 1.63 ± 0.28
1Percentage mortality due to ascites.

76
Table 3-13. Absolute weight means1 for female offspring.
Female Genotypes Parental Cross CW TW
% Resistance2 56 46
N 46 147 A
bso
lute
Wei
ghts
(g)
WOG3 1686 ± 19 1679 ± 16
Ab Fat 90 ± 3 90 ± 1
Chilled 1742 ± 20 1742 ± 17
Breast 345 ± 6 338 ± 4
Tenders 93 ± 1 94 ± 1
Wings 183 ± 1 185 ± 1
Legs 236 ± 2 238 ± 2
Thighs 318 ± 5 321 ± 4
Rack 541 ± 8 537 ± 5
1Average means ± SE in grams; 2 Percentage mortality due to ascites; 3 Carcass weight without
giblets.

77
Table 3-14. Percent weight means1 for female offspring.
Female Genotypes Parental Cross CW TW
% Resistance2 56 46
N 46 147
Per
cent
Wei
ghts
(g)
% Breast3 0.1822 ± 0.0021 0.1786 ± 0.0013
% WOG4 0.7001 ± 0.0027 0.6954 ± 0.0015
% Fat5 0.0376 ± 0.0010 0.0372 ± 0.0007
% Dark6 0.2302 ± 0.0017 0.2323 ± 0.0013
1Average percent means ± SE in grams; 2Percentage mortality due to ascites; 3((Pectoralis Major
+ Pectoralis Minor)/Dock Weight) *100; 4((WOG)/Dock Weight); 5(Abdominal Fat/Dock
Weight)*100; 6((Thigh + Leg)/Dock Weight)*100.

78
Table 3-15. Averaged breast fillet traits for female offspring.
Female Genotypes Parental Cross CW TW
% Resistance1 56 46
N 46 147
Bre
ast
Tra
its
pH 5.62 ± 0.09 5.66 ± 0.05
L* 51.36 ± 0.30 50.89 ± 0.22
a* 3.75 ± 0.14 3.92 ± 0.07
b* 2.42 ± 0.20 2.22 ± 0.11
1Percentage mortality due to ascites.

79
Table 3-16. Absolute weight means1 for parental crosses resulting in hemizygous C female
offspring.
CW Offspring Parental Cross CTxCW CTxTW
% Resistance2 56 53
N 25 21 A
bso
lute
Wei
ghts
(g)
WOG3 1695 ± 28 1675 ± 27
Ab Fat 94 ± 4 85 ± 3
Chilled 1752 ± 29 1730 ± 29
Breast 345 ± 9 346 ± 8
Tenders 95 ± 2 91 ± 1
Wings 183 ± 2 183 ± 2
Legs 238 ± 3 233 ± 4
Thighs 324 ± 6 311 ± 7
Rack 540 ± 11 541 ± 12
1Average means ± SE in grams; 2percent mortality due to ascites incidence for each genotype; 3carcass without giblets.

80
Table 3-17. Percent weight means1 for parental crosses resulting in hemizygous C female
offspring.
CW Offspring Parental Cross CTxCW CTxTW
% Resistance2 56 53
N 25 21
Per
cent
Wei
ghts
(g)
% Breast3 0.1811 ± 0.0031 0.1834 ± 0.0026
% WOG4 0.6977 ± 0.0034 0.7029 ± 0.0044
% Fat5 0.0392 ± 0.0018 0.0359 ± 0.0013
% Dark6 0.2315 ± 0.0021 0.2288 ± 0.0027
1Average percent means ± SE in grams; 2Percentage mortality due to ascites; 3((Pectoralis Major
+ Pectoralis Minor)/Dock Weight) *100; 4((WOG)/Dock Weight); 5(Abdominal Fat/Dock
Weight)*100; 6((Thigh + Leg)/Dock Weight)*100.

81
Table 3-18. Averaged breast fillet traits resulting in hemizygous C female offspring.
CW Offspring Parental Cross CTxCW CTxTW
% Resistance1 56 53
N 25 21
Bre
ast
Tra
its
pH 5.74 ± 0.09 5.45 ± 0.16
L* 51.45 ± 0.34 51.24 ± 0.52
a* 3.81 ± 0.23 3.68 ± 0.14
b* 2.88 ± 0.26a 1.88 ± 0.27b
1Percentage mortality due to ascites.

82
Table 3-19. Absolute weight means1 for parental crosses resulting in hemizygous T female
offspring.
TW Offspring Parental Cross CTxCW CTxTW TTxCW TTxTW
% Resistance2 53 46 47 45
N 24 29 44 50
Abso
lute
Wei
ghts
(g)
WOG3 1700 ± 36 1655 ± 40 1674 ± 29 1687 ± 26
Ab Fat 94 ± 3 86 ± 3 86 ± 2 94 ± 4
Chilled 1762 ± 39 1715 ± 42 1747 ± 33 1742 ± 27
Breast 342 ± 12 341 ± 11 334 ± 7 337 ± 7
Tenders 94 ± 3 91 ± 2 94 ± 2 94 ± 2
Wings 186 ± 3 184 ± 3 185 ± 2 185 ± 2
Legs 241 ± 4 231 ± 6 240 ± 4 238 ± 3
Thighs 323 ± 8 316 ± 9 326 ± 8 320 ± 6
Rack 551 ± 12 532 ± 13 531 ± 10 540 ± 9
1Average means ± SE in grams; 2 Percentage mortality due to ascites; 3 Carcass weight without
giblets.

83
Table 3-20. Percent weight means1 for parental crosses resulting in hemizygous T female
offspring.
TW Offspring Parental Cross CTxCW CTxTW TTxCW TTxTW
% Resistance2 53 46 47 45
N 24 29 44 50
Per
cent
Wei
ghts
(g)
% Breast3 0.1789 ± 0.0033 0.1810 ± 0.0030 0.1776 ± 0.0019 0.1777 ± 0.0023
% WOG4 0.7007 ± 0.0030 0.6960 ± 0.0033 0.6948 ± 0.0018 0.6929 ± 0.0033
% Fat5 0.0388 ± 0.0012 0.0365 ± 0.0011 0.0356 ± 0.0338 0.0381 ± 0.0010
% Dark6 0.2327 ± 0.0028 0.2306 ± 0.0030 0.2351 ± 0.0022 0.2304 ± 0.0022
1Average percent means ± SE in grams; 2Percentage mortality due to ascites; 3((Pectoralis Major
+ Pectoralis Minor)/Dock Weight) *100; 4((WOG)/Dock Weight); 5(Abdominal Fat/Dock
Weight)*100; 6((Thigh + Leg)/Dock Weight)*100.

84
Table 3-21. Averaged breast fillet traits resulting in hemizygous T female offspring.
TW Offspring Parental Cross CTxCW CTxTW TTxCW TTxTW
% Resistance2 53 46 47 45
N 24 29 44 50
Bre
ast
Tra
its
pH 5.74 ± 0.15 5.67 ± 0.09 5.63 ± 0.09 5.62 ± 0.06
L* 51.71 ± 0.64 50.93 ± 0.48 50.90 ± 0.37 50.41 ± 0.36
a* 3.81 ± 0.18 3.84 ± 0.14 4.10 ± 0.11 3.85 ± 0.13
b* 2.48 ± 0.32 2.33 ± 0.21 2.16 ± 0.20 2.07 ± 0.15
1Percentage mortality due to ascites.

85
Figure 3-1. Growth of male broilers measured over 42 days SE. Birds are displayed by their
SNP genotype (A). Additionally, heterozygote offspring (B) and homozygous T offspring (C)
are shown with respect to their parent genotypic crosses.
0
500
1000
1500
2000
2500
3000
3500
Day 0 Day 14 Day 21 Day 28 Day 35 Day 42
Male Weight by Genotype
CCCTTT
0
500
1000
1500
2000
2500
3000
3500
Day 0 Day 14 Day 21 Day 28 Day 35 Day 42
Heterozygote Male Weight by Cross
CTx
CW
0
500
1000
1500
2000
2500
3000
3500
Day 0 Day 14 Day 21 Day 28 Day 35 Day 42
Homozygous T Male Weight by Cross
CTxTW
TTxTW
*
*
*
*
A
B
A
C
A

86
Figure 3-2. Growth of female broilers measured over 42 days SE. Birds are displayed by
their SNP genotype (A). Additionally, heterozygote offspring (B) and homozygous T offspring
(C) are shown with respect to their parent genotypic crosses.
0
500
1000
1500
2000
2500
3000
Day 0 Day 14 Day 21 Day 28 Day 35 Day 42
Female Weight by Genotype
CW
TW
0
500
1000
1500
2000
2500
3000
Day 0 Day 14 Day 21 Day 28 Day 35 Day 42
CW Female Weight by Cross
CTxCW
CTxTW
0
500
1000
1500
2000
2500
3000
Day 0 Day 14 Day 21 Day 28 Day 35 Day 42
TW Female Weight by Cross
CTxCW
CTxTW
TTxCW
* *
*
*
A
B
A
C
A

87
Figure 3-3. Mortality due to ascites of a 1990s unselected REL line and data combined from
two modern genetic lines when challenged in a high-altitude simulated environment
(unpublished data).
0%
10%
20%
30%
40%
50%
60%
1 6 11 16 21 26 31
Day
Cumulative Percent Mortality
1990s REL Line
Modern Lines

88
REFERENCES
Acar, N., F. G. Sizemore, G. R. Leach, R. F. Wideman, R. L. Owen, and G. F. Barbato. 1995.
Growth of broiler chickens in response to feed restriction regimens to reduce ascites. Poult. Sci.
74:833-843.
Altmuller, J., L. J. Palmer, G. Fischer, H. Scherb, and M. Wjst. 2001. Genomewide scans of
complex human diseases: True linkage is hard to find. Am. J. Hum. Genet. 69:936-950.
Anaka, M., A. Lynn, P. McGinn, and V. K. Lloyd. 2009. Genomic Imprinting in Drosophila has
properties of both mammalian and insect imprinting. Dev. Genes Evol. 219:59-66.
Bailes, S. M., J. J. Devers, J. D. Kirby, and D. D. Rhoads. 2007. An inexpensive, simple protocol
for DNA isolation from blood for high-throughput genotyping by polymerase chain reaction or
restriction endonuclease digestion. Poult. Sci. 86:102-106.
Barlow, D. P., and M. S. Bartolomei. 2014. Genomic Imprinting in Mammals. Cold Spring Harb.
Perspect. Biol. 6:20.
Black, B. L., and E. N. Olson. 1998. Transcriptional control of muscle development by myocyte
enhancer factor-2 (MEF2) proteins. Annu. Rev. Cell Dev. Biol. 14:167-196.
Collins, K. E., B. H. Kiepper, C. W. Ritz, B. L. McLendon, and J. L. Wilson. 2014. Growth,
livability, feed consumption, and carcass composition of the Athens Canadian Random Bred
1955 meat-type chicken versus the 2012 high-yielding Cobb 500 broiler. Poult. Sci. 93:2953-
2962.
Dong, C. H., W. D. Li, F. Geller, L. Lei, D. Li, O. Y. Gorlova, J. Hebebrand, C. I. Amos, R. D.
Nicholls, and R. A. Price. 2005. Possible genomic imprinting of three human obesity-related
genetic loci. Am. J. Hum. Genet. 76:427-437.
Fresard, L., M. Morisson, J.-M. Brun, A. Collin, B. Pain, F. Minvielle, and F. Pitel. 2013.
Epigenetics and phenotypic variability: some interesting insights from birds. Genet. Sel. Evo. 45.
Guo, J. Z., H. Jorjani, and O. Carlborg. 2012. A genome-wide association study using
international breeding-evaluation data identifies major loci affecting production traits and stature
in the Brown Swiss cattle breed. BMC Genetics 13.
Hall, J. G. 1997. Genomic imprinting: Nature and clinical relevance. Annu. Rev. Med. 48:35-44.
Hassanzadeh, M., M. H. B. Fard, J. Buyse, and E. Decuypere. 2003. Beneficial effects of
alternative lighting schedules on the incidence of ascites and on metabolic parameters of broiler
chickens. Acta Vet. Hung. 51:513-520.

89
Havenstein, G. B., P. R. Ferket, and M. A. Qureshi. 2003. Growth, livability, and feed
conversion of 1957 versus 2001 broilers when fed representative 1957 and 2001 broiler diets.
Poult. Sci. 82:1500-1508.
Ipek, A., and U. Sahan. 2006. Effects of cold stress on broiler performance and ascites
susceptibility. Asian Australas. J. Ani. Sci. 19:734-738.
Julian, R. J. 1998. Rapid growth problems: Ascites and skeletal deformities in broilers. Poult.
Sci. 77:1773-1780.
Julian, R. J. 2000. Physiological, management and environmental triggers of the ascites
syndrome: a review. Avian Pathol. 29:519-527.
Julian, R. J., and B. Wilson. 1992. Pen oxygen concentration and pulmonary hypertension-
induced right ventricular failure and ascites in meat-type chickens at low altitude. Avian Dis.
36:733-735.
Koski, L. B., E. Sasaki, R. D. Roberts, J. Gibson, and R. J. Etches. 2000. Monoalleleic
transcription of the insulin-like growth factor-II gene (Igf2) in chick embryos. Mol. Reprod.
Dev.56:345-352.
Krishnamoorthy, S., C. D. Smith, A. A. Al-Rubaye, G. F. Erf, R. F. Wideman, N. B. Anthony,
and D. D. Rhoads. 2014. A quantitative trait locus for ascites on chromosome 9 in broiler
chicken lines. Poult. Sci. 93:307-317.
Lin, Q., J. Schwarz, C. Bucana, and E. N. Olson. 1997. Control of mouse cardiac morphogenesis
and myogenesis by transcription factor MEF2C. Science 276:1404-1407.
Manolio, T. A., F. S. Collins, N. J. Cox, D. B. Goldstein, L. A. Hindorff, D. J. Hunter, M. I.
McCarthy, E. M. Ramos, L. R. Cardon, A. Chakravarti, J. H. Cho, A. E. Guttmacher, A. Kong,
L. Kruglyak, E. Mardis, C. N. Rotimi, M. Slatkin, D. Valle, A. S. Whittemore, M. Boehnke, A.
G. Clark, E. E. Eichler, G. Gibson, J. L. Haines, T. F. C. Mackay, S. A. McCarroll, and P. M.
Visscher. 2009. Finding the missing heritability of complex diseases. Nature 461:747-753.
Moghadam, H. K., I. McMillan, J. R. Chambers, and R. J. Julian. 2001. Estimation of genetic
parameters for ascites syndrome in broiler chickens. Poult. Sci. 80:844-848.
Navarro, P., P. M. Visscher, D. Chatziplis, A. N. M. Koerhuis, and C. S. Haley. 2006. Genetic
parameters for blood oxygen saturation, body weight and breast conformation in 4 meat-type
chicken lines. Brit. Poult. Sci. 47:659-670.
Nicholls, R. D. 2000. The impact of genomic imprinting for neurobehavioral and developmental
disorders. J. Clin.Invest. 105:413-418.
O'Doherty, A. M., D. E. MacHugh, C. Spillane, and D. A. Magee. 2015. Genomic imprinting
effects on complex traits in domesticated animal species. Front. Genet. 6:156.

90
O'Neill, M. J., R. S. Ingram, P. B. Vrana, and S. M. Tilghman. 2000. Allelic expression of IGF2
in marsupials and birds. Dev. Genes Evol. 210:18-20.
Olkowski, A. A. 2007. Pathophysiology of heart failure in broiler chickens: Structural,
biochemical, and molecular characteristics. Poult. Sci. 86:999-1005.
Pakdel, A., J. A. M. Van Arendonk, A. L. J. Vereijken, and H. Bovenhuis. 2005. Genetic
parameters of ascites-related traits in broilers: effect of cold and normal temperature conditions.
Brit. Poult. Sci. 46:35-42.
Pavlidis, H. O., J. M. Balog, L. K. Stamps, J. D. Hughes, W. E. Huff, and N. B. Anthony. 2007.
Divergent selection for ascites incidence in chickens. Poult. Sci. 86:2517-2529.
Rabie, T., R. Crooijmans, H. Bovenhuis, A. L. J. Vereijken, T. Veenendaal, J. J. van der Poel, J.
A. M. Van Arendonk, A. Pakdel, and M. A. M. Groenen. 2005. Genetic mapping of quantitative
trait loci affecting susceptibility in chicken to develop pulmonary hypertension syndrome. An.
Genet. 36:468-476.
Reik, W., and J. Walter. 2001. Genomic imprinting: Parental influence on the genome. Nat. Rev.
Genet. 2:21-32.
Renfree, M. B., T. A. Hore, G. Shaw, J. A. M. Graves, and A. J. Pask. 2009. Evolution of
Genomic Imprinting: Insights from Marsupials and Monotremes. Annu. Rev. Genomics Hum.
Genet. 10:241-262.
Reyer, H., R. Hawken, E. Murani, S. Ponsuksili, and K. Wimmers. 2015. The genetics of feed
conversion efficiency traits in a commercial broiler line. Sci. Rep.5.
Schmidt, C. J., M. E. Persia, E. Feierstein, B. Kingham, and W. W. Saylor. 2009. Comparison of
a modern broiler line and a heritage line unselected since the 1950s. Poult. Sci. 88:2610-2619.
Shi, S. R., Y. R. Shen, Z. H. Zhao, Z. C. Hou, Y. Yang, H. J. Zhou, J. M. Zou, and Y. M. Guo.
2014. Integrative analysis of transcriptomic and metabolomic profiling of ascites syndrome in
broiler chickens induced by low temperature. Mol. Biosyst. 10:2984-2993.
Shlosberg, A., M. Bellaiche, G. Zeitlin, M. Yaacobi, and A. Cahaner. 1996. Hematocrit values
and mortality from ascites in cold-stressed broilers from parents selected by hematocrit. Poult.
Sci. 75:1-5.
Tekeli, A. 2014. Effects of ascites (pulmonary hypertension syndrome) on blood gas, blood
oximetry parameters and heart sections of broilers grown at high altitude. J. Anim. Plant. Sci.
24:998-1002.

91
Thomsen, H., H. K. Lee, M. F. Rothschild, M. Malek, and J. C. M. Dekkers. 2004.
Characterization of quantitative trait loci for growth and meat quality in a cross between
commercial breeds of swine. J. Ani. Sci. 82:2213-2228.
Vong, L., W. Z. Bi, K. E. O'Connor-Halligan, C. Y. Li, P. Cserjesi, and J. J. Schwarz. 2006.
MEF2C is required for the normal allocation of cells between the ventricular and sinoatrial
precursors of the primary heart field. Dev. Dyn. 235:1809-1821.
Wang, Z. P., H. Zhang, H. Yang, S. Z. Wang, E. G. Rong, W. Y. Pei, H. Li, and N. Wang. 2014.
Genome-Wide Association Study for Wool Production Traits in a Chinese Merino Sheep
Population. Plos One 9.
Weinhold, B. 2006. Epigenetics - The science of change. Environ. Health Perspect. 114:A160-
A167.
Wideman, R. F., and G. F. Erf. 2002. Intravenous micro-particle injection and pulmonary
hypertension in broiler chickens: Cardio-pulmonary hemodynamic responses. Poult. Sci. 81:877-
886.
Wideman, R. F., D. D. Rhoads, G. F. Erf, and N. B. Anthony. 2013. Pulmonary arterial
hypertension (ascites syndrome) in broilers: A review. Poult. Sci. 92:64-83.
Wolf, J. B., and M. J. Wade. 2009. What are maternal effects (and what are they not)? Philos.
Trans. R. Soc. Long. B Biol. Sci. 364:1107-1115.
Zhang, C. Y., Z. Q. Wang, H. Bruce, R. A. Kemp, P. Charagu, Y. Miar, T. Yang, and G.
Plastow. 2015. Genome-wide association studies (GWAS) identify a QTL close to PRKAG3
affecting meat pH and colour in crossbred commercial pigs. BMC Genet. 16.
Zuidhof, M. J., B. L. Schneider, V. L. Carney, D. R. Korver, and F. E. Robinson. 2014. Growth,
efficiency, and yield of commercial broilers from 1957, 1978, and 2005. Poult. Sci. 93:2970-
2982.

92
CHAPTER 4
Predicting ascites incidence in simulated altitude-challenge using single nucleotide
polymorphisms identified in multi-generational genome wide association studies

93
ABSTRACT
Assessing pedigreed broiler lines for ascites resistance in an industry setting is time consuming
and reduces genetic accuracy with the implementation of sibling selection. The purpose of this
study is to evaluate the effectiveness of developing prediction models produced with SNPs with
the goal of predicting ascites incidence. Ascites is the manifestation of a series of adverse
changes in a broiler which results in losses estimated at $100 million/year in the U.S. A multi-
generational genome wide association study (GWAS) in an unselected REL-line maintained at
the University of Arkansas since the 1990s identified chromosomal regions associated with
ascites incidence in males when challenged at high altitude. From the identified regions of
significance 8 SNPs were identified on chromosome 11, and 12 SNP were identified on
chromosome Z. Ascites phenotype and genotype data were determined for 295 male and female
individuals from lines originating with the REL line. Five regression modeling techniques were
compared for their ascites predictive ability using a 70/30 validation. For both males and females
the neural networking model was the best fit prediction model. In males the training and
validation data set R2 were 0.929 and 0.942, respectively. Reduction of the model to the 13 most
important SNPs resulted in an increase in the prediction accuracy and fit of the model to R2
values of 0.999 and 0.998. In females the training and validation data set R2 were 0.944 and
0928, respectively; although, reduction in the number of SNP inputs into the model decreased the
overall model robustness. These models indicate we have elucidated the genetic predictors to
ascites outcome in male broilers from an elite line of the 1990s with a high level of accuracy.
Keywords: broiler, ascites, QTL, neural network

94
INTRODUCTION
Ascites, or pulmonary hypertension syndrome, is an accumulation of adverse
physiological changes that occur in fast growing broilers (Julian and Wilson, 1992). At the
beginning of onset, oxygenation of the body is maintained through an elevation in the pulmonary
arterial pressure, followed by an increase in right ventricle work load (Julian, et al. 1987;
Wideman and French, 1999). Eventually, this work load causes change in the right ventricle
morphology that will result in hypertrophy and death. It is clear that in addition to environmental
conditions, genetics plays a role in ascites incidence (Lubritz et al., 1995; Wideman and French,
1999; Wideman and French, 2000; Anthony et al., 2001; de Greef et al., 2001; Deeb et al., 2002;
Pakdel et al., 2005; Pavlidis et al., 2007). Progress in selection for ascites resistance and
susceptibility due to moderate to high heritabilities of ascites incidence and ascites-related traits
like right ventricle-to-total ventricle ratio are reported in these studies.
Ascites incidence has been successfully reduced as a result of selection practices and
through maintaining ideal flock management practices; however, it remains an economically
important disease estimated to cause loss of $100 million annually (as reported in Tarrant et al.,
in review). For this reason commercial genetic companies consistently rely on methods to
induce ascites to evaluate disease incidence in genetic lines so ascites susceptible individuals can
be identified and removed from the breeding population.
Current methods for assessing ascites incidence in commercial lines includes assessing
ascites development during chronic high altitude challenge in a hypobaric chamber (Pavlidis et
al., 2007) and through acute challenged micro-particle injections (Wideman et al., 2002). While
chronic evaluations methods require the bird to be terminated after ascites susceptibility or
resistance is appraised, acute evaluations consider ascites frequency at a single time point in the

95
broiler’s growth. To incorporate findings from chronic evaluations into broiler lines sibling
selection is be used to integrate the genetics of ascites-resistant families into breeding schemes.
Further, this method necessitates that birds are raised to several weeks of age, which is both
costly and time consuming.
The development of a successful prediction model that allows ascites susceptibility to be
evaluated immediately post-hatch would provide a time- and cost-efficient solution useful
throughout the broiler’s growth phase compared to current techniques being used to appraise
ascites potential. This method of ascites screening would also result in the smallest genetic
impact to the selected line by eliminating the requirement of sacrificing the bird, and the
requisite for implementing sibling selection demanded in chronic evaluations. In this study, we
consider several regression modeling types to estimate the outcome of ascites resistance and
susceptibility in pedigreed broiler lines maintained since the 1990s.
METHODS
Bird Handling
The three hundred fourteen broilers used for this study were from two divergently
selected ascites lines and an unselected control line, which all originate with an elite broiler line
of the 1990s that is maintained at the University of Arkansas under IACUC Protocol 15040. To
determine ascites phenotype, broilers were challenged in a high – altitude environment during a
six weeks trial simulating 2900 m above sea level. Birds were raised with ad libitum feed in four
batteries measuring 2.4 x 3.7 x 2.4 m. Each battery contains 10 cages and is equipped with
trough feeders and nipple waters. Temperature, ventilation, altitude, and humidity were
monitored and regulated throughout the duration of the trial.

96
Genome Data
Chromosomal positions presented are relative to the November 2011 ICGSC Gallus-
gallus-4.0/galGal4 (GCA_000002315.2) assembly.
DNA Isolation
A total of 297 male and female individuals were lanceted and 20 µl of blood was
collected into 20 µl of citrate solution. Samples were re-suspended in lysis buffer (1 M Tris-
HCl, pH 8.0, 5 M NaCl, 0.4 M disodium EDTA) in round bottomed centrifuge tubes. A 10%
solution of SDS was added and inverted, followed by addition of 20 mg/ml of proteinase K.
Samples were stored in an orbital shaker at 37 °C overnight. Sodium chloride (5M) was added
and the samples were hand shaken until a foam appearance was observed, and spun at 5000 rpm
for 15 minutes. Supernatant was pipetted into 15 mL centrifuge tubes with 100% ethanol and
inverted. A hook made from melting the tip of a Pasteur pipette into a hook shape was used to
collect the DNA, which was then rinsed in 70% ethanol. The ethanol was allowed to evaporate,
and the DNA was transferred to a screw top tube containing 1 ml of TE pH 8.0. Samples were
placed in an orbital shaker overnight at 37 °C until the DNA dissolved.
Genotyping
Twenty SNP were identified as regions of interest in ascites phenotype based on genome
wide association studies previously conducted (Tarrant et al., in review; Table 4-1). Twelve
SNP reside in three regions on the Z chromosome, and the remaining eight are from a single
region on chromosome 11. Genotyping for SNPs were completed using KASP™ chemistry in
16x well format. The PCR conditions for all SNP were 94 °C for 15 minutes, 94 °C for 20
seconds, 65 °C for 1 minute nine times (-0.8 °C per cycle), followed by up to 35 cycles of 94 °C
for 20 seconds, 55 °C for 1 minute.

97
Statistical Analysis
All analyses were completed in the latest version of JMP® Pro (v. 12.1.0; SAS Institute
Inc., 2015). Models were created in order to predict the ascites outcome in the individuals
sampled. In order to determine the most effective prediction model, five models were initially
created to evaluate three subsets of data: SNPs only on chromosome 11, SNPs only on
chromosome Z, and a combination of all SNPs. Sexes were evaluated independently of each
other. Models evaluated included a logistic regression, two gradient boosting tree methods,
decision tree and boosted tree, and two black box models, bootstrap forest and neural network.
To avoid overfitting of the data for each model, 70% of the birds were used for training the
models, and the remaining 30% were used to validate the models. Model outputs were then
compared to determine the most robust and well-fitting model when considering chromosome 11
SNPs, chromosome Z SNPs, and SNPs on both chromosomes independently. Comparisons were
made on evaluation of the R2, root mean square error (RMSE), mean absolute deviation (MAD),
misclassification rate (MCR), and area under the curve (AUC) values. A Chi-squared test was
then performed on the AUC for each model to determine if the variation seen in the AUC values
reported for each model was statistically different. Additionally, the most impactful SNPs for
each model were determined through the main effect value that describes the variance of each
SNP in respect to the distribution of other SNPs.
RESULTS AND CONCLUSIONS
Initial selection of SNPs in this study was based on regions that indicate association with
ascites outcome phenotype through genome wide association studies conducted on REL line
broilers (Tarrant et al., Chapter 2). Single nucleotide polymorphisms selected from chromosome
11 lie in, and around, cadherin 13 (Cdh13; Table 4-1). The Cdh13 gene encodes T-cadherin,

98
which acts as an adiponectin receptor (Hug et al., 2004). Adiponectin is a blood circulating
protein, whose levels are associated with atherosclerosis, insulin resistance, and cardiovascular
disease (Hotta et al., 2000; Yamauchi et al., 2003; Hashimoto et al., 2006). Three SNPs were
selected from the 19 Mbp region on chromosome Z. Within this region is the 5-
hydroxytryptamine (serotonin) receptor 1A (HTR1A) gene. Mice with HTR1A receptor
knockouts experience an increase in heart rate and a vulnerability to cardiac death (Carnevali et
al., 2012). The SNP identified around 60 Mbp on chromosome Z is in a region that appears to
have several possible contributing factors to cardiac health in an individual. The coding
sequence of a member of the MADS-Box transcription factors, myocyte enhancer factor 2C
(Mef2c), is located around 60.25 Mbp. Mef2c is essential to the development of the right
ventricle (Lin et al., 1997). Further, varied expression in Mef2c results in attenuation of cardiac
hypertrophy in mice (Pereira et al., 2009). MicroRNA 9-2, located on chromosome Z at 60.29
Mbp, has the capability of targeting the myocardin pathway (Wang et al., 2010). Consequently,
this pathway induces cardiac hyptertrophy in response to hypertrophic stress signals (Xing et al.,
2006). Finally, SNPs chosen in the area of 80 Mbp on chromosome Z were selected in their
relative location to lysyl oxidase (LOX). The LOX gene contributes to the structuring of
collagen and elastin extracellular matrices during development, for which, LOX abnormalities
contribute to the deterioration of the cardiovascular development (Mäki et al., 2002).
A model comparison was initially completed on five model types developed for each
SNP input: chromosome 11 SNP, chromosome Z SNP, and SNP from both chromosomes. Upon
evaluating all SNP, Chr 11, and Chr Z input combinations, the neural networking model was
identified as the most robust model for predicting ascites incidence in male individuals in each
case (Table 4-2). Within each input the largest R2 value, coupled with the lowest RMSE, was

99
associated with the neural networks. Further, statistically significant variation between the
modeling techniques were detected in the evaluation of AUC values. The receiver operative
characteristic (ROC) curve is used as an indicator for decision performance in neural networking
models (Woods and Bowyer, 1997). Specifically, the ROC curve can be used to judge the
predictive ability of statistical methods by quantifying the area under the ROC curve, otherwise
known as AUC (Hanley and McNeil, 1982). In the male ALL SNP input, the neural networking
AUC is significantly larger than all models, aside from the boosted tree model. Ultimately, a
largely superior R2 value dictate that the neural network is the best fitting prediction model. A
similar pattern is seen in the Chr 11 SNP inputs, with the neural networking model AUC
remaining significantly larger than all other models, except the boosted tree. The Chr Z AUC
inputs show AUC values of the boosted tree, nominal logistic, and neural networking model to
be statistically similar. The MCR of the neural network indicates this model has a lower
predictive error rate than other models using only chromosome Z SNPs as inputs. The modeling
statistics indicate that Chr Z SNP inputs are better ascites incidence predictors than Chr 11
inputs; however, the neural networking model that incorporates SNPs from both chromosomes
appears to be the best fitting model with a undoubtedly larger R2 value, and lower MCR.
Descriptive statistics on female neural network prediction models show greater robustness
compared to other modeling techniques as seen in male neural networking models for all SNP
inputs (Table 4-3). Additionally, the neural networking model created with SNPs from both
chromosomes demonstrates a superior model when compared to neural networking models
created with SNPs from single chromosomes. Interestingly, Chr 11 inputs create a better
prediction model than Chr Z inputs, contrary to the patter seen in male inputs.

100
Neural networks are a black box computational method modeled off of neurological
connections present in the brain (Amari, 1990). Neural networks act in a similar manner to use a
series of weighted connections to connect the variables being input into the system to potential
outcomes through connective nodes (Spining et al., 1994; Dayhoff and DeLeo, 2001). The
effectiveness of neural networks is attributed to the superior fit of the data in a non-linear fashion
and the ability of the model to learn and adapt the internal workings of the system to a
fluctuating environment (Basheer and Hajmeer, 2000).
Because the neural network considers all variables when constructing a predictive model,
an effort was made to reduce the number of SNPs used in the model, while attempting to
maintain the level of predictability. This process was completed by determining the main effect
value attributed to each SNP, and removing the SNP contributing the least to the model. In
males, seven SNP from both chromosome 11 and Z were removed; however, in females, removal
of the lowest contributing SNP decreased the model’s accuracy. It was determined that the most
robust model for females includes all 20 SNPs.
A reduction in the number of SNPs used for male individuals, from 20 total to 13 total
SNPs spanning both chromosomes, increased the training and validation R2 value from 0.929 and
0.942 to 0.999 and 0.998 (Table 4-4). Additionally, the neural network model that uses fewer
SNPs as inputs has lower RSME, MAD, and MCR values. It is therefore concluded that the
robustness of the model increases when fewer SNP are used. Additionally, due to the similarity
seen in the training and validation R2 values for the model using the most informative SNPs, it
was determined that this is a well fit model. The 13 most informative SNPs used for the male
neural networking model are denoted in Table 4-5, along with their respective total effect
contributions to the model. The initial neural network created included 20 SNP from four

101
regions (one region on chromosome 11 and three regions on chromosome Z). Interestingly,
when the number of SNP inputs were reduced to create a more accurate predictive model, SNPs
from each of the four regions remained. Yet, the top four highest contributing SNPs reside on
the Z chromosome: 19,850,532, 19,853,553, 60,189,777, and 80,805,286. While all SNPs were
originally selected for this study with the knowledge of their potential association with ascites
incidence the high level of contribution, seen specifically in two SNPs from 19 Mbp, indicates
the impact of the Z chromosome on male ascites incidence.
Descriptive statistics for the training and validation data sets of the best fitting model for
predicting female ascites phenotype, which includes all 20 SNPs evaluated for this study, is
shown in Table 4-6. While the statistics reported are inferior to that of the model developed for
males, the training and validation R2 values of 0.944 and 0.928 still indicate a moderately high
level in the goodness-of-fit for this model. Because more SNPs were used to construct this
model than that for males, the contribution of the total effect of individual SNPs is not as high as
seen in males (Table 4-7). Furthermore, the highest contributing SNPs are located on
chromosome 11 (15,617,716 and 15,846,469), indicating that the influence of the Z chromosome
on ascites incidence in males is not replicated in females. This information demonstrates the
conclusion that the genetic component behind ascites phenotype in male and female broilers is
variable.
When considering either i) SNPs located on chromosome 11, ii) SNPs located on
chromosome Z, or iii) a combination of SNPs from both locations, the neural network model is
the best-fit and most robust model for either sex. After determining the effectiveness of the
neural networking models when using SNPs from both chromosomes, an attempt was made to
determine the fewest SNPs required to maintain the prediction ability of the models, which

102
increased the model robustness in males, but not in females. This data indicates that the SNPs
selected for this study were particularly important in ascites association in male broilers. The
accuracy for prediction of disease outcome for males was greater because initial SNP selection
was completed by locating regions of significance in male broilers identified from two genome
wide association studies completed on REL line individuals phenotyped for ascites outcome
(Tarrant et al., in review). Though not as predictive, the SNP inputs used in this study create an
effective female prognostic model.
In commercial flocks over the last two decades’ efforts have been placed in reducing
ascites through genetic selection and through regulation of environmental conditions. It is clear
these methods have aided in the reduction of overall incidence, but using these tactics alone is
not enough to eradicate the disease. For this reason, it is important to determine methods that
can bring selection practices even closer to eliminating ascites presence in modern broilers. The
use of SNP panels in predicting future ascites outcome will be useful in retaining genetic
accuracy lost through sibling selection, thus, contributing to a decline in ascites frequency that is
currently being experienced in the poultry industry.

103
Table 4-1. SNPs identified from chromosomes 11 and Z used to develop predictive models.
Chr. Position
Reference
SNP
Reference Allele/
Alternative Allele SNP Location
11 15,398,867 rs14027234 A/G Intergenic Region
11 15,481,212 rs14027310 A/G Cdh13 Intron
11 15,501,981 rs312593326 A/G Cdh13 Intron
11 15,617,716 rs14027422 T/C Cdh13 Intron
11 15,677,381 rs14966647 A/G Cdh13 Intron
11 15,810,516 rs14966714 T/C Cdh13 Intron
11 15,810,521 rs14966715 G/A Cdh13 Intron
11 15,846,469 rs14027623 C/T Intergenic Region
Z 19,850,532 rs14753903 G/T Intergenic Region
Z 19,853,553 rs16761496 T/G HTR1A Exon
Z 19,855,351 rs316810252 G/C Intergenic Region
Z 60,058,344 rs14748694 A/G Intergenic Region
Z 60,076,934 rs14748688 C/T Intergenic Region
Z 60,189,777 rs317821780 G/A Intergenic Region
Z 60,287,175 rs14747886 A/G Intergenic Region
Z 60,441,865 rs14690172 A/G Intergenic Region
Z 61,301,140 rs14774275 A/C Intergenic Region
Z 80,794,843 rs14684720 T/C Intergenic Region
Z 80,805,286 rs735134779 A/G LOX Intron
Z 80,838,161 rs15990713 T/C Intergenic Region

104
Table 4-2. Comparisons between regression modeling techniques for male broilers. Three sets
of SNPs were used as inputs for models: SNPs from both chromosomes, SNPs from
chromosome 11, and SNPs from chromosome Z.
SNP Input Model R2 RMSE 1 MAD 2 MCR 3 AUC 4
All SNP
Boosted Tree 0.831 0.23 0.138 0.053 0.976ab
Bootstrap Forest 0.569 0.349 0.323 0.093 0.954b
Nominal Logistic 0.756 0.281 0.167 0.098 0.955c
Neural Networking 0.940 0.136 0.049 0.016 0.993a
Partition 0.656 0.325 0.214 0.139 0.916cd
R2 RMSE MAD MCR AUC
Chr 11
Boosted Tree 0.591 0.349 0.254 0.159 0.904ab
Bootstrap Forest 0.475 0.384 0.354 0.185 0.906b
Nominal Logistic 0.583 0.351 0.226 0.179 0.891bc
Neural Networking 0.684 0.321 0.197 0.162 0.923a
Partition 0.553 0.362 0.243 0.179 0.872c
R2 RMSE MAD MCR AUC
Chr Z
Boosted Tree 0.661 0.33 0.252 0.179 0.932a
Bootstrap Forest 0.492 0.376 0.262 0.172 0.849b
Nominal Logistic 0.697 0.326 0.213 0.157 0.923a
Neural Networking 0.758 0.296 0.194 0.128 0.956a
Partition 0.386 0.412 0.355 0.219 0.792b
1 RMSE = root mean squared error, 2 MAD = mean absolute deviation; 3 MCR =
misclassification rate; 4 AUC = area under the curve. *Means within the same column and with
no common superscript differ significantly (P<0.05).

105
Table 4-3. Comparisons between regression modeling techniques for female broilers. Three
sets of SNPs were used as inputs for models: SNPs from both chromosomes, SNPs from
chromosome 11, and SNPs from chromosome Z.
SNP Input Model R2 RMSE 1 MAD 2 MCR 3 AUC 4
All SNP
Boosted Tree 0.786 0.268 0.181 0.090 0.968b
Bootstrap Forest 0.497 0.378 0.351 0.139 0.921cd
Nominal Logistic 0.722 0.292 0.181 0.137 0.950bc
Neural Networking 0.927 0.127 0.071 0.030 0.994a
Partition 0.608 0.352 0.256 0.174 0.907d
R2 RMSE MAD MCR AUC
Chr 11
Boosted Tree 0.565 0.376 0.279 0.201 0.914b
Bootstrap Forest 0.262 0.444 0.432 0.257 0.865c
Nominal Logistic 0.563 0.377 0.279 0.210 0.912b
Neural Networking 0.729 0.321 0.206 0.162 0.957a
Partition 0.459 0.401 0.325 0.264 0.887c
R2 RMSE MAD MCR AUC
Chr Z
Boosted Tree 0.549 0.371 0.294 0.201 0.883b
Bootstrap Forest 0.283 0.439 0.421 0.299 0.823cd
Nominal Logistic 0.543 0.376 0.285 0.217 0.875bc
Neural Networking 0.654 0.337 0.229 0.168 0.921a
Partition 0.441 0.403 0.330 0.236 0.833d
1 RMSE = root mean squared error, 2 MAD = mean absolute deviation; 3 MCR =
misclassification rate; 4 AUC = area under the curve. *Means within the same column and with
no common superscript differ significantly (P<0.05).

106
Table 4-4. Training and validation statistics on two neural networking models developed from
SNPs on chromosomes 11 and Z in males. The All SNPs model includes 8 SNP inputs on
chromosome 11 and 12 SNP inputs on chromosome Z. The 13 SNPs model displays descriptive
statistics for a neural network completed using seven fewer SNPs to complete the analysis.
All SNPs 13 SNPs
Training Validation Training Validation
R2 0.929 0.942 0.999 0.998
RMSE 1 0.156 0.129 0.002 0.008
MAD 2 0.071 0.068 <0.001 0.002
MCR 3 0.022 0.000 0.000 0.000
AUC 4 0.992 0.997 1.000 1.000
1 RMSE = root mean squared error, 2 MAD = mean absolute deviation; 3 MCR =
misclassification rate; 4 AUC = area under the curve.

107
Table 4-5. Contributions of individual SNPs to the neural network model developed to predict
male ascites incidence using the fewest number of SNPs. Contributions are evaluated by the
calculated total effect value standard error.
Chromosome Position Total Effect
11 15,398,867 0.020 0.001
11 15,481,212 0.174 0.003
11 15,501,981 0.106 0.002
11 15,617,716 0.212 0.003
11 15,846,469 0.069 0.002
Z 19,850,532 0.457 0.005
Z 19,853,553 0.493 0.005
Z 19,855,351 0.041 0.001
Z 60,058,344 0.146 0.003
Z 60,189,777 0.235 0.004
Z 61,301,140 0.076 0.002
Z 80,794,843 0.054 0.002
Z 80,805,286 0.239 0.004

108
Table 4-6. Training and validation statistics on a neural networking model developed from SNPs
on chromosomes 11 and Z in female individuals.
All SNPs
Training Validation
R2 0.944 0.928
RMSE 1 0.158 0.177
MAD 2 0.052 0.071
MCR 3 0.043 0.073
AUC 4 0.995 0.992
1 RMSE = root mean squared error, 2 MAD = mean absolute deviation; 3 MCR =
misclassification rate; 4 AUC = area under the curve.

109
Table 4-7. Contributions of individual SNPs to the neural network model developed to predict
female ascites incidence using 20 SNPs. Contributions are evaluated by the calculated total
effect value standard error.
Chromosome Position Total Effect
11 15,398,867 0.055 0.002
11 15,481,212 0.046 0.001
11 15,501,981 0.187 0.003
11 15,617,716 0.381 0.005
11 15,677,381 0.013 0.001
11 15,810,516 0.045 0.002
11 15,810,521 <0.001 <0.001
11 15,846,469 0.249 0.004
Z 19,850,532 0.192 0.003
Z 19,853,553 0.144 0.003
Z 19,855,351 0.009 0.001
Z 60,058,344 0.021 0.001
Z 60,076,934 0.050 0.002
Z 60,189,777 0.032 0.001
Z 60,287,175 0.022 0.001
Z 60,441,865 0.044 0.001
Z 61,301,140 0.121 0.002
Z 80,794,843 0.020 0.001
Z 80,805,286 0.020 0.001
Z 80,838,161 0.015 0.001

110
REFERENCES
Amari, S. 1990. Mathematical foundations of neurocomputing. Proc. IEEE 78:1443-1463.
Anthony, N. B., J. M. Balog, J. D. Hughes Jr., L. Stamps, M. A. Cooper, B. D. Kidd, X. Lui, G.
R. Huff, W. E. Huff, and N. C. Rath. 2001. Genetic selection of broiler lines that differ in their
ascites susceptibility 1. Selection under hypobaric conditions. Pages 327-328 in Proc. 13th
European Symposium in Poultry Nutrition, Blankenberge, Belgium.
Basheer, I. A., and M. Hajmeer. 2000. Artificial neural networks: fundamentals, computing,
design, and application. J. Microbiol. Methods 43:3-31.
Carnevali, L., F. Mastorci, E. Audero, G. Graiani, S. Rossi, E. Macchi, S. Callegari, A.
Bartolomucci, E. Nalivaiko, F. Quaini, C. Gross, and A. Sgoifo. 2012. Stress-induced
susceptibility to sudden cardiac death in mice with altered serotonin homeostasis. PloS One 7.
Dayhoff, J. E., and J. M. DeLeo. 2001. Artificial neural networks - Opening the black box.
Cancer 91:1615-1635.
de Greef, K. H., L. L. G. Janss, A. L. J. Vereijken, R. Pit, and C. L. M. Gerritsen. 2001. Disease-
induced variability of genetic correlations: Ascites in broilers as a case study. J. of Anim. Sci.
79:1723-1733.
Deeb, N., A. Shlosberg, and A. Cahaner. 2002. Genotype-by-environment interaction with
broiler genotypes differing in growth rate. 4. Association between responses to heat stress and to
cold-induced ascites. Poult. Sci. 81:1454-1462.
Hanley, J. A., and B. J. McNeil. 1982. The meaning and use of the area under a receiver
operating characteristic (ROC) curve. Radiology 143:29-36.
Hashimoto, N., J. Kanda, T. Nakamura, A. Horie, H. Kurosawa, T. Hashimoto, K. Sato, S.
Kushida, M. Suzuki, S. Yano, R. Iwai, H. Takahashi, and S. Yoshida. 2006. Association of
hypoadiponectinemia in men with early onset of coronary heart disease and multiple coronary
artery stenoses. Metabolism 55:1653-1657.
Hotta, K., T. Funahashi, Y. Arita, M. Takahashi, M. Matsuda, Y. Okamoto, H. Iwahashi, H.
Kuriyama, N. Ouchi, K. Maeda, M. Nishida, S. Kihara, N. Sakai, T. Nakajima, K. Hasegawa, M.
Muraguchi, Y. Ohmoto, T. Nakamura, S. Yamashita, T. Hanafusa, and Y. Matsuzawa. 2000.
Plasma concentrations of a novel, adipose-specific protein, adiponectin, in type 2 diabetic
patients. Arterioscler. Thromb.Vasc. Biol. 20:1595-1599.
Hug, C., J. Wang, N. S. Ahmad, J. S. Bogan, T. S. Tsao, and H. F. Lodish. 2004. T-cadherin is a
receptor for hexameric and high-molecular-weight forms of Acrp30/adiponectin. Proc. Natl.
Acad. Sci. USA. 101:10308-10313.

111
Julian, R. J., and B. Wilson. 1992. Pen oxygen concentration and pulmonary hypertension-
induced right ventricular failure and ascites in meat-type chickens at low altitude. Avian Dis.
36:733-735.
Julian, R. J., G. W. Friars, H. French, and M. Quinton. 1987. The relationship of right ventricular
hypertrophy, right ventricular failure, and ascites to weight-gain in broiler and roaster chickens.
Avian Dis. 31:130-135.
Lin, Q., J. Schwarz, C. Bucana, and E. N. Olson. 1997. Control of mouse cardiac morphogenesis
and myogenesis by transcription factor MEF2C. Science 276:1404-1407.
Lubritz, D. L., J. L. Smith, and B. N. McPherson. 1995. Heritability of ascites and the ratio of
right to total ventricle weight in broiler breeder males lines. Poult. Sci.74:1237-1241.
Mäki, J. M., J. Rasanen, H. Tikkanen, R. Sormunen, K. Makikallio, K. I. Kivirikko, and R.
Soininen. 2002. Inactivation of the lysyl oxidase gene Lox leads to aortic aneurysms,
cardiovascular dysfunction, and perinatal death in mice. Circulation 106:2503-2509.
Pakdel, A., J. A. M. Van Arendonk, A. L. J. Vereijken, and H. Bovenhuis. 2005. Genetic
parameters of ascites-related traits in broilers: effect of cold and normal temperature conditions.
Br. Poult. Sci. 46:35-42.
Pavlidis, H. O., J. M. Balog, L. K. Stamps, J. D. Hughes, W. E. Huff, and N. B. Anthony. 2007.
Divergent selection for ascites incidence in chickens. Poult. Sci. 86:2517-2529.
Pereira, A. H. M., C. Clemente, A. C. Cardoso, T. H. Theizen, S. A. Rocco, C. C. Judice, M. C.
Guido, V. D. B. Pascoal, I. Lopes-Cendes, J. R. M. Souza, and K. G. Franchini. 2009. MEF2C
silencing attenuates load-induced left ventricular hypertrophy by modulating mTOR/S6K
pathway in mice. PloS One 4:12.
Spining, M. T., J. A. Darsey, B. G. Sumpter, and D. W. Noid. 1994. Opening up the black-box of
artificial neural networks. J. Chem. Edu. 71:406-411.
Wang, K., B. Long, J. Zhou, and P. F. Li. 2010. miR-9 and NFATc3 regulate myocardin in
cardiac hypertrophy. J. Biol. Chem. 285:11903-11912.
Wideman, R. F., and H. French. 1999. Broiler breeder survivors of chronic unilateral pulmonary
artery occlusion produce progeny resistant to pulmonary hypertension syndrome (ascites)
induced by cool temperatures. Poult. Sci. 78:404-411.
Wideman, R. F., and H. French. 2000. Ascites resistance of progeny from broiler breeders
selected for two generations using chronic unilateral pulmonary artery occlusion. Poult. Sci.
79:396-401.
Wideman, R. F., G. F. Erf, M. E. Chapman, W. Wang, N. B. Anthony, and L. Xiaofang. 2002.
Intravenous micro-particle injections and pulmonary hypertension in broiler chickens: Acute
post-injection mortality and ascites susceptibility. Poult. Sci. 81:1203-1217.

112
Woods, K., and K. W. Bowyer. 1997. Generating ROC curves for artificial neural networks.
IEEE Trans. Med. Imag. 16:329-337.
Xing, W. B., T. C. Zhang, D. S. Cao, Z. G. Wang, C. L. Antos, S. J. Li, Y. B. Wang, E. N.
Olson, and D. Z. Wang. 2006. Myocardin induces cardiomyocyte hypertrophy. Circ. Res.
98:1089-1097.
Yamauchi, T., J. Kamon, H. Waki, Y. Imai, N. Shimozawa, K. Hioki, S. Uchida, Y. Ito, K.
Takakuwa, J. Matsui, M. Takata, K. Eto, Y. Terauchi, K. Komeda, M. Tsunoda, K. Murakami,
Y. Ohnishi, T. Naitoh, K. Yamamura, Y. Ueyama, P. Froguel, S. Kimura, R. Nagai, and T.
Kadowaki. 2003. Globular adiponectin protected ob/ob mice from diabetes and ApoE-deficient
mice from atherosclerosis. J. Biol. Chem. 278:2461-2468.

113
CHAPTER 5
Discussion

114
The rise in chicken production has resulted from increased availability (Figure 4-1),
improved pricing (Figure 2), and increasing health conscious behavior by consumers (Figure 4-
3), which has resulted in chicken per capita consumption surpassing that of its red meat
counterparts. Chicken meat is a healthier option to beef and pork. Trans-fats that are found in
red meat are not present in chicken (Farrell, 2010). Additionally, poultry meat can also be used
as a vector, termed enriched meat, to transport additional nutrients to the consumer like omega
(n)-3 fatty acids and the antioxidant selenium whose absence can be fatal if left out of the diet
(Yu et al., 2008). Further, the choice of chicken over red meat consumption is linked to a
decreased risk of colorectal cancer (English et al., 2004) and is associated with a reduced risk for
age-related macular degeneration when chosen as a protein source over beef or pork (Chong et
al. 2009). The increasing importance of chicken products has led to intensive selection on traits
relevant to the consumer market. Specifically, emphasis on highly heritable growth performance
traits, including both rapid gain in body weight and high feed efficiency, has led to a
dramatically different broiler than the broiler being marketed in previous decades (Havenstein et
al., 2003). Jointly, selection for production traits has led to an increase in welfare related issues,
like as lameness (Knowles et al., 2008), and pulmonary hypertension (Julian, 1998). Further,
management practices to optimize broiler performance, such as increased day length (Schwean-
Lardner et al., 2013) and ad libitum feeding schedules (Ozkan et al., 2006) are further
accentuating these issues. A direct result for these selection practices include an increase in
cardiovascular disease (Julian, 1993). While management techniques can be used to manipulate
ascites incidence genetic selection in broilers will be the answer to decreasing PHS incidence,
and creating prevention parameters, in fast growing meat type chickens.

115
We began looking into the genetic causation of ascites incidence by evaluating a next
generation sequencing technique: genome wide association studies. The GWAS were conducted
to evaluate chromosomal regions associated with the syndrome. Identification of a region on
chromosome 2 indicated an association with right ventricle to total ventricle ratio, which
indicated an affiliation to heart hypertrophy detected in PHS susceptible individuals. These
findings were consistent with previous studies on the correlation between heart morphology on
chromosome 2 in broilers (Rabie et al., 2005). An additional region on chromosome Z
consisting of three additional SNP indicated further association with heart morphology in ascites
susceptible and resistant individuals. Further investigation into a single SNP in the chromosome
Z region indicated that the genotype of the parents to male broilers, but not female, from a 1990s
line are associated with the male broiler’s ascites phenotype. Avian species do not operate under
the same dosage effect that is seen in mammals. In species with X and Y sex chromosomes gene
dosage dictates that in many genes seen, for example, on the X chromosome are evaluated at the
same expression levels in females as in males (Lin et al., 2007). The absence of a dosage
mechanism in organisms, like chickens, containing Z and W sex chromosomes, result in male
bias for genes on the Z chromosome (Ellegren et al., 2007). This explanation may be the
reasoning behind regions of significance evaluated solely on male individuals. Finally, it was
shown that a collection of 20 SNPs located on two chromosomes were effective at predicting
ascites incidence at a high level of accuracy using both traditional regression techniques, but to a
greater degree, using a black box artificial neural networking model.
The findings from these studies represent further knowledge into the genetics behind
ascites syndrome in rapidly-growing broilers. The broiler production market is a global-reaching
market with continually increasing demand. The countries with the broiler production are

116
America, China, and Brazil, with America exporting 6.7 billion pounds, representing
approximately 16.7% of the total production, in 2015 alone (FAO USDA). These values are
expected to increase as a result of world population growth, and novel integration of large
poultry production schemes into developing countries. As estimated in 2015 in the U.S. 0.05%
of plant condemnations and carcass downgrading are contributed to ascites incidence (Cooper
and Gustin, 2015, personal communication). If this approximated rate was applied to the total
broiler production in pounds recorded for 2015 almost 2 billion pounds produced would be
afflicted. Despite ascites continually decreasing in frequency, due to intensive selection and
management practices, there remains the opportunity to retain millions of dollars of what is lost
annually with the better understanding of ascites genetics, and application of this knowledge to
large scale breeding schemes.

117
Figure 5-1. Pounds per person of produced beef, pork, and chicken in the U.S. Data available
through USDA ERS.
0
50
100
150
Pou
nd
s P
er P
erso
nRed Meat and Poultry Pounds Available Per Capita
Beef Pork Chicken

118
Figure 5-2. Price per pound of beef, pork, and chicken parts evaluated since 2000. Data
available through USDA ERS.
$-
$0.50
$1.00
$1.50
$2.00
$2.50
$3.00
Average Price Per Pound
Beef Pork Chicken

119
Figure 5-3. Consumer perception of healthfulness of beef versus chicken. Values presented as
percent of 3000 individuals surveyed from a balanced representation of U.S. population. Data is
as reported in Husted (2005).
6
71
24
6
68
26
0
10
20
30
40
50
60
70
80
Beef is healthier Chicken is healthier Both are the same
Consumer Perception of Chicken vs. Beef
Youth/Young Adults Adults

120
REFERENCES
Chong, E. W. T., J. A. Simpson, L. D. Robman, A. M. Hodge, K. Z. Aung, D. R. English, G. G.
Giles, and R. H. Guymer. 2009. Red meat and chicken consumption and its association with age-
related macular degeneration. Am. J. Epidemiol. 169:867-876.
Ellegren, H., L. Hultin-Rosenberg, B. Brunstrom, L. Dencker, K. Kultima, and B. Scholtz. 2007.
Faced with inequality: chicken does not have general dosage compensation of sex-linked genes.
BMC Biol. 5:40.
English, D. R., R. J. MacInnis, A. M. Hodge, J. L. Hopper, A. M. Haydon, and G. G. Giles.
2004. Red meat, chicken, and fish consumption and risk of colorectal cancer. Cancer Epidemiol.
Biomarkers Prev. 13:1509-1514.
Farrell, D. 2010. Farrell D., 2010. The role of poultry in human nutrition. Poultry development
review. Available from: www.fao.org
Havenstein, G. B., P. R. Ferket, and M. A. Qureshi. 2003. Growth, livability, and feed
conversion of 1957 versus 2001 broilers when fed representative 1957 and 2001 broiler diets.
Poult. Sci. 82:1500-1508.
Husted, R. 2005. Consumers say they are eating beef less often and cite health concerns. Pages
46-48 in Issues Update National Cattlemen's Beef Association.
Julian, R. J. 1993. Ascites in Poultry. Avian Pathol. 22:419-454.
Julian, R. J. 1998. Rapid growth problems: Ascites and skeletal deformities in broilers. Poult.
Sci. 77:1773-1780.
Knowles, T. G., S. C. Kestin, S. M. Haslam, S. N. Brown, L. E. Green, A. Butterworth, S. J.
Pope, D. Pfeiffer, and C. J. Nicol. 2008. Leg disorders in broiler chickens: Prevalence, risk
factors and prevention. Plos One 3:5.
Lin, H., V. Gupta, M. D. VerMilyea, F. Falciani, J. T. Lee, L. P. O'Neill, and B. M. Turner.
2007. Dosage compensation in the mouse balances up-regulation and silencing of X-linked
genes. Plos Biology 5:2809-2820.
Ozkan, S., I. Plavnik, and S. Yahav. 2006. Effects of early feed restriction on performance and
ascites development in broiler chickens subsequently raised at low ambient temperature. J. Appl.
Poultry Res. 15:9-19.
Rabie, T., R. Crooijmans, H. Bovenhuis, A. L. J. Vereijken, T. Veenendaal, J. J. van der Poel, J.
A. M. Van Arendonk, A. Pakdel, and M. A. M. Groenen. 2005. Genetic mapping of quantitative
trait loci affecting susceptibility in chicken to develop pulmonary hypertension syndrome. Anim
Genet. 36:468-476.

121
Schwean-Lardner, K., B. I. Fancher, S. Gomis, A. Van Kessel, S. Dalal, and H. L. Classen. 2013.
Effect of day length on cause of mortality, leg health, and ocular health in broilers. Poult. Sci.
92:1-11.
Yu, D. J., J. C. Na, S. H. Kim, J. H. Kim, G. H. Kang, H. K. Kim, O. S. Seo, and J. C. Lee. 2008.
Effects of dietary selenium sources on the growth performance and selenium retention of meat in
broiler chickens in Proceedings XIII World's Poultry Congress, Brisbane, Queensland, Australia.

122
CHAPTER 6 Appendix

123

124