Embed Size (px)
Citation preview
Elsevier Editorial System(tm) for Journal of Non-Crystalline Solids
Manuscript Draft
Manuscript Number:
Title: EFFECT OF PHOSPHATE CONTENT IN TWO SERIES OF QUATERNARY BIOGLASSES ON
STRUCTURE AND PROPERTIES STUDIED BY MAGIC-ANGLE-SPINNING NUCLEAR MAGNETIC
RESONANCE (MAS-NMR) SPECTROSCOPY - PART II: PHYSICAL PROPERTIES
Article Type: Regular Submission
Section/Category:
Keywords: Bioglass, structure, DSC, density, XRD, Rietveld, network connectivity, silicate
Corresponding Author: Dr. Matthew David O'Donnell, MEng, PhD
Corresponding Author's Institution: Imperial College London
First Author: Matthew David O'Donnell, MEng, PhD
Order of Authors: Matthew David O'Donnell, MEng, PhD; Robert H Hill; Robert V Law; Sally Watts
Manuscript Region of Origin:
Abstract: The effect of the variation in phosphate (P2O5) content on the properties two series of bioactive
glasses in the quaternary system SiO2-Na2O-CaO-P2O5 was studied. The first series (I) was a simple
substitution of P2O5 for SiO2 keeping the Na2O:CaO ratio fixed (1:0.87). The second series (II) was
designed to ensure charge neutrality in the orthophosphate (PO43-), therefore as P2O5 was added the
Na2O and CaO content was varied to provide sufficient Na+ and Ca2+ cations to charge balance the
orthophosphate present. Network connectivity's of the glasses were calculated, and densities and thermal
expansion coefficients predicated using the Appen and Doweidar models respectively. Theoretical densities
were measured using the Archimedes principle. Characteristic temperatures, namely the glass transition
temperature, Tg, and crystallisation temperatures, Tx, were obtained using differential analysis (DTA). Two
crystallisation exotherms were observed for both glass series (Txi and Txii). Both Tg and Tx decreased with
P2O5 addition for both series. The working range of the glasses, Tx-Tg was shown to increase to a
maximum at around 4 mol. % P2O5 then decrease at higher P2O5 contents for both series. Thermal
expansion coefficients were measured using dilatometry increasing with P2O5 addition and showed good
agreement with the Appen values. Dilatometric softening points, Ts, were also measured, which increased
with P2O5 addition. X-ray diffraction (XRD) was performed on the glasses to confirm their amorphous nature.
The glass containing 9.25 mol. % P2O5 from series I exhibited well defined peaks on the XRD trace,
indicating the presence of a crystalline phase.
Phosphate bioglass NMR paper – part II; MDO 1
EFFECT OF PHOSPHATE CONTENT IN TWO SERIES OF
QUATERNARY BIOGLASSES ON STRUCTURE AND
PROPERTIES STUDIED BY MAGIC-ANGLE-SPINNING NUCLEAR
MAGNETIC RESONANCE (MAS-NMR) SPECTROSCOPY – PART
II: PHYSICAL PROPERTIES
M. D. O’Donnell1,2*, S. J. Watts1, R. V. Law2, R. G. Hill1*
1 Department of Materials, Imperial College London, London, SW7 2AZ, UK2 Department of Chemistry, Imperial College London, London, SW7 2AZ, UK
* Corresponding author: E-mail: [email protected], Tel: +44(0)20 7594 6783
Fax: +44(0)20 7594 6757 or [email protected], Tel: +44 (0)20 7594 6814, Fax:
+44(0)20 7594 6757
Abstract
The effect of the variation in phosphate (P2O5) content on the properties two series of
bioactive glasses in the quaternary system SiO2-Na2O-CaO-P2O5 was studied. The first
series (I) was a simple substitution of P2O5 for SiO2 keeping the Na2O:CaO ratio fixed
(1:0.87). The second series (II) was designed to ensure charge neutrality in the
orthophosphate (PO43-), therefore as P2O5 was added the Na2O and CaO content was
varied to provide sufficient Na+ and Ca2+ cations to charge balance the orthophosphate
present. Network connectivity’s of the glasses were calculated, and densities and thermal
expansion coefficients predicated using the Appen and Doweidar models respectively.
Theoretical densities were measured using the Archimedes principle. Characteristic
temperatures, namely the glass transition temperature, Tg, and crystallisation
temperatures, Tx, were obtained using differential analysis (DTA). Two crystallisation
exotherms were observed for both glass series (Txi and Txii). Both Tg and Tx decreased
with P2O5 addition for both series. The working range of the glasses, Tx-Tg was shown to
increase to a maximum at around 4 mol. % P2O5 then decrease at higher P2O5 contents for
both series. Thermal expansion coefficients were measured using dilatometry increasing
* Manuscript
Phosphate bioglass NMR paper – part II; MDO 2
with P2O5 addition and showed good agreement with the Appen values. Dilatometric
softening points, Ts, were also measured, which increased with P2O5 addition. X-ray
diffraction (XRD) was performed on the glasses to confirm their amorphous nature. The
glass containing 9.25 mol. % P2O5 from series I exhibited well defined peaks on the XRD
trace, indicating the presence of a crystalline phase.
1. Introduction
Pure phosphate and binary alkali-phosphate glasses do not have the commercial
importance as that of silicate and borosilicate glasses due to their extreme sensitivity to
water and thus find limited applications. In binary alkali-phosphate glasses, properties
such as density and refractive index do not vary linearly and there is an abrupt change in
properties at around 50 mol. % alkali oxide [1]. Van Wazer [2] proposed that below 50
mol. % alkali oxide, the phosphate glasses form a three-dimensional network structure
much like silicates. Above 50 mol. %, chains and rings form, with no phosphate taking
part in the network structure, again analogous to the silicate Qn structure (REF). Phase
separation occurs in many inorganic glass systems. This phenomenon has been exploited
in many applications and is particularly useful for controlled crystallisation. For example,
a relatively complex glass composition can be formed from SiO2, Al2O3, MgO, Na2O /
K2O, CaO, P2O5 and NaF [1]. On cooling two droplet phases form in a silicate rich glass
matrix. The coarse droplet glass phase is PO4 and CaO rich and forms fluorapatite on heat
treatment. The fine droplet silicate rich glass phase also crystallises to phlogopite mica.
This glass ceramic has the advantage of bioactivity (fluorapatite) and machinability
(phlogopite).
There is also some controversy as to the role of P2O5 in bioactivity and bone
mineralisation. The Hench model [3, 4] predicts that the presence of phosphate is
required in the implant material. However this model does not predict the bioactivity of
some glass compositions which do not contain phosphate [5] and neglect the network
connectivity of the glass [6-8].
Part I of this study examined the structure of two series of bioglasses with varying
phosphate contents using solid state MAS-NMR spectroscopy. The purpose of the second
Phosphate bioglass NMR paper – part II; MDO 3
part of the study is to use more conventional characterisation techniques to validate the
NMR findings and assess properties important for processing promising compositions.
Glass densities were measured to compare experimental values to calculated values from
glass network connectivities based on glass composition (Doweidar’s model [9, 10]) and
using network connectivities obtained from fitting of the 29Si MAS-NMR data. Thermal
expansion coefficients were obtained from dilatometry and values compared to
calculations using the Appen model [11]. Thermal expansion coefficients are important to
characterise, particularly for applications which may involve coatings. If bioactive glass
compositions can be identified with thermal expansion coefficients matched to metals
typically used in prosthetic implants (or preferably slightly higher than the metal so the
glass is in compression), this could provide an important component to the next
generation of biomedical devices. Characteristic temperatures were observed using
differential thermal analysis (DTA) to examine the effect of phosphate addition on the
glass transition temperature and devitrification behaviour. The working range, Tx-Tg, is an
important parameter in various applications such as viscous flow sintering (coatings) and
fibre drawing. Finally, X-ray diffraction, on amorphous and again on subsequently heat
treated samples, was used to investigate if any crystallites were present, and if so how this
might relate to the structure of the devitrified material to the parent glass.
2. Experimental
2.1. Glass melting
Details of glass melting can be found in part I of this paper (REF). Glasses for thermal
expansion coefficient (TEC) measurements and density were remelted from the frit
described above for 30 min. and cast into preheated ( Tg-10C) graphite moulds and
annealed in an electric furnace overnight. The rod shaped samples formed were cut into
sections of 6 mm in diameter and 25 mm in length using a slow speed diamond saw. The
ends of these rods were ground flat using SiC abrasive paper. It should be noted, not all
samples could be cast in rod form due to devitrification and / or phase separation.
Phosphate bioglass NMR paper – part II; MDO 4
2.2 Density
Using Archimides principles the density of each cast sample at room temperature was
determined. The weight of each glass was measured in air and in distilled water using a
balance measuring to +0.1 mg. The weight was measured three times and an average
taken in order to minimise sources of error. The sample density, , was determined by
equation (1).
sd
wd
mm
m
(1)
where md = mass of sample dry, w = density of water at the measurement temperature
and ms = mass of sample submerged in water. Care was taken to make sure that all of the
cast samples were bubble free and that the glass samples were fully wetted when
immersed in the distilled water.
2.3. Dilatometry
A Netzsch Dil 402C dilatometer was used in order to determine the glass transition
temperature (Tg), the dilatometric softening temperature (Ts) and the thermal expansion
coefficient () for each glass. The 25 6 mm cut samples were analysed from room
temperature up until the point just before melting at a heating rate of 5C.min.-1. , Ts and
Tg were determined by using system software and was measured between 25 and
400C.
2.4. Differential thermal analysis (DTA)
The glasses were characterised by simultaneous DTA/TGA using a Stanton Redcroft
DTA 1600. Alumina was used as the reference material and both reference and sample
were contained within platinum-rhodium alloy crucibles. The < 45µm particle size
powders were heated from room temperature to 1300C at a heating rate of 10C.min.-1 in
Phosphate bioglass NMR paper – part II; MDO 5
an inert argon atmosphere. The glass transition temperature (Tg) and crystallisation
temperatures (Tx) for each glass were then obtained from the corresponding traces, with
Tg represented by a small endothermic change in slope of the baseline and Tx represented
by the presence of an exotherm.
2.5. X-ray diffraction (XRD)
A Phillips powder diffractometer with a copper (Cu Kα) X-ray source (Philips PW 1700
series diffractometer, Philips, Endhoven, NL) was used to characterise the glass samples.
The powdered samples (< 45µm particle size) were scanned between 2θ values of 5 to
80 with a step size of 2θ = 0.04, in order to try and determine the amorphous nature of
each glass. In order to try and verify the existence of any crystalline phases the frit was
heat treated using a Centurion Quartz porcelain furnace, then ground to < 45µm particle
size powder. DTA analysis was undertaken prior to heat treatment in order to determine
the actual temperature at which the samples were to be heat treated at - corresponding to
the peak crystallisation temperature. The powder samples were heat treated to such a
temperature at a rate of 10C.min.-1, held for one hour, and then allowed to cool to room
temperature. XRD was then carried out and the results analysed using software
containing a database of standard diffraction files. Rietveld refinement was performed
with GSAS and EXPGUI software.
3. Results and discussion
3.1. Density
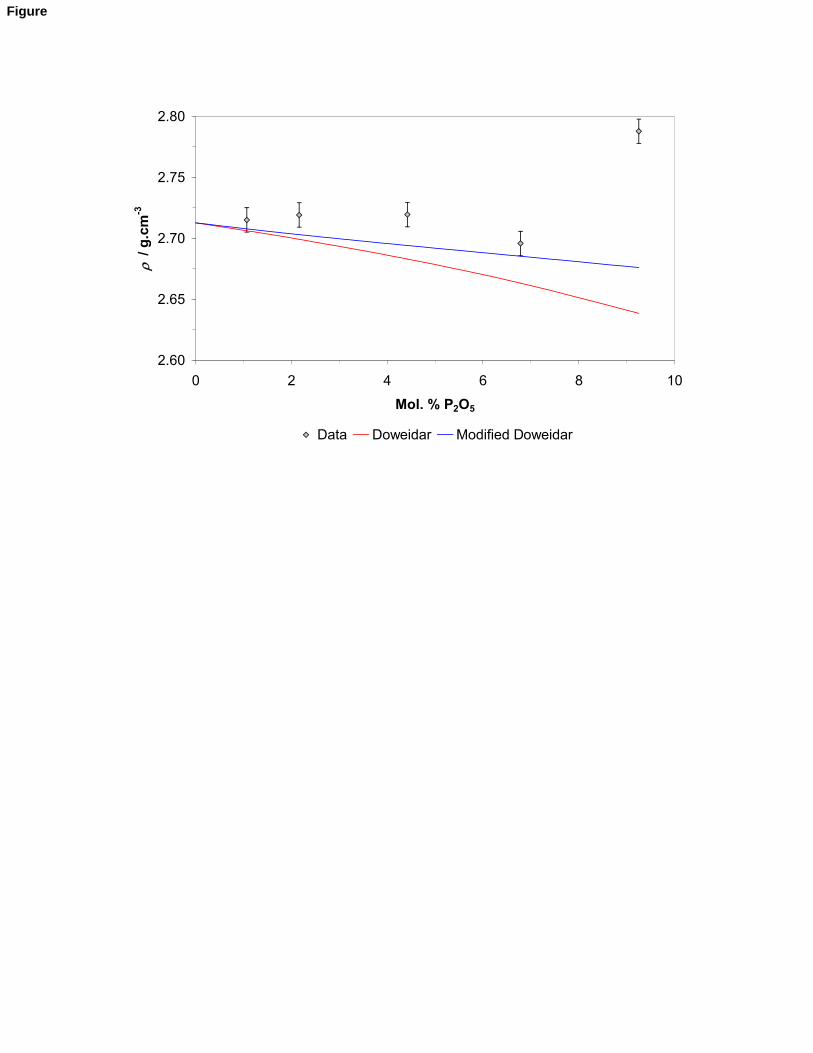
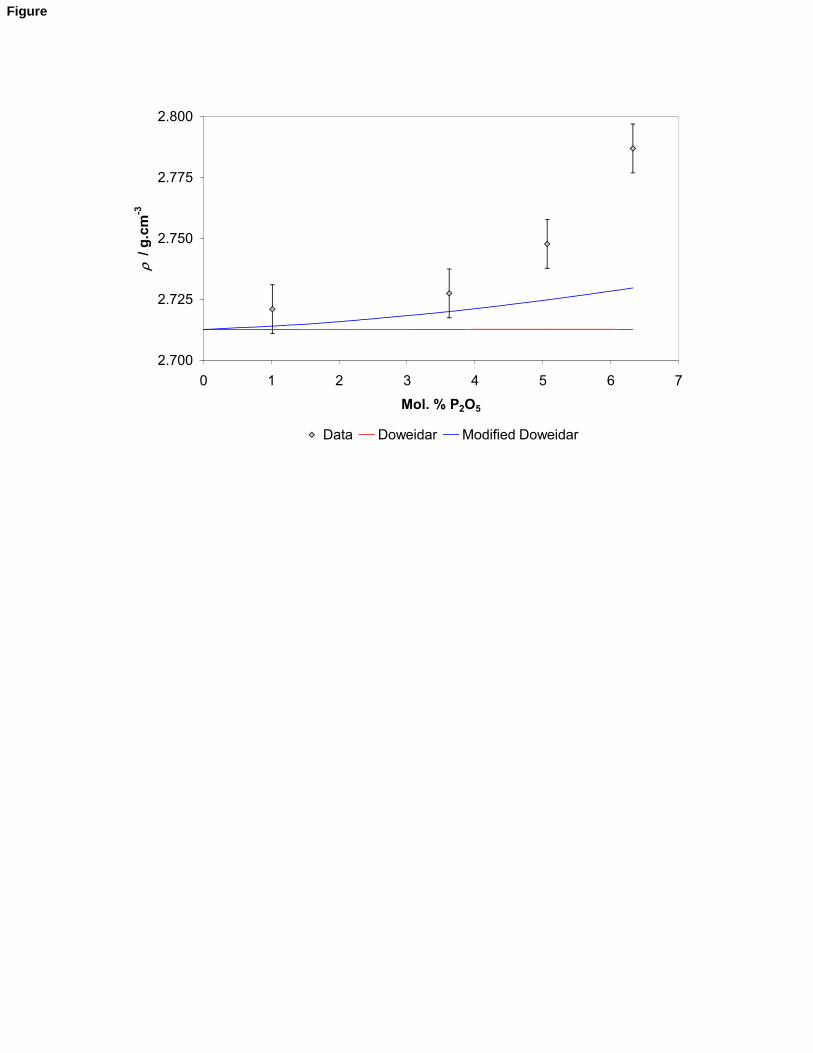
Fig. (1) and (2) show the density measurements for the glasses from series I and II
respectively.
***Fig. 1***
***Fig.2 ***
Phosphate bioglass NMR paper – part II; MDO 6
The plots also show the density values calculated using Doweidar’s model [9, 10] which
assumes a binary distribution of Qn species. All glass compositions were normalised to
exclude the phosphate content, and all fell in the 33 ≤ xt ≤ 50 mol. % region (where xt is
the total modifier mol. %), therefore the Qn distribution was Q3 and Q2 in the binary
distribution model. The relative proportions of the Qn species were calculated using the
following equations (2a-d), where a denotes Na+ containing Qn species and b Ca+2
containing Qn species:
CaOONa
ONaCaOONa
a
ff
fffQ
2
2
2]1)(3[2 (2a)
CaOONa
CaOCaOONa
b
ff
fffQ
2
2]1)(3[2 (2b)
CaOONa
ONaCaOONa
a
ff
fffQ
2
2
2)](42[3 (2c)
CaOONa
CaOCaOONa
b
ff
fffQ
2
2)](42[3 (2d)
where fMxOy is the fraction of oxide component MxOy. These vales were then normalised
to give the fractions of each species (xn) and the density calculated using this equation
(3):
bbaabbaa xxxx 33332222 (3)
The densities of the Qn species can be found in Table (1).
**Table 1**
Phosphate bioglass NMR paper – part II; MDO 7
The plots also show modified Doweidar values, calculated assuming the P2O5 enters the
glasses as a separate orthophospahe phase, based on the MAS-NMR of part I, and is
charge balanced by Na+ and Ca2+ in the same proportion as that present in the overall
glass compositions. Using density values of sodium and calcium orthophosphate (Table
(2)),
**Table 2**
equation (3) was modified to incorporate the fractions of Na3PO4 and Ca3(PO4)2 in the
separate orthophosphate phase. It can be seen from Fig. (1) and (2) that the experimental
density values deviate from the calculated values, however the modified (orthophosphate)
values show better correlation. As the densities seem to increase more rapidly than
predicted with P2O5 content, this would seem to indicate the present of a higher density
component in the sample than the silicate glass such as an amorphous orthophosphate,
pyrophosphate and in the case of ICSW4 crystalline phases.
3.2. Dilatometry
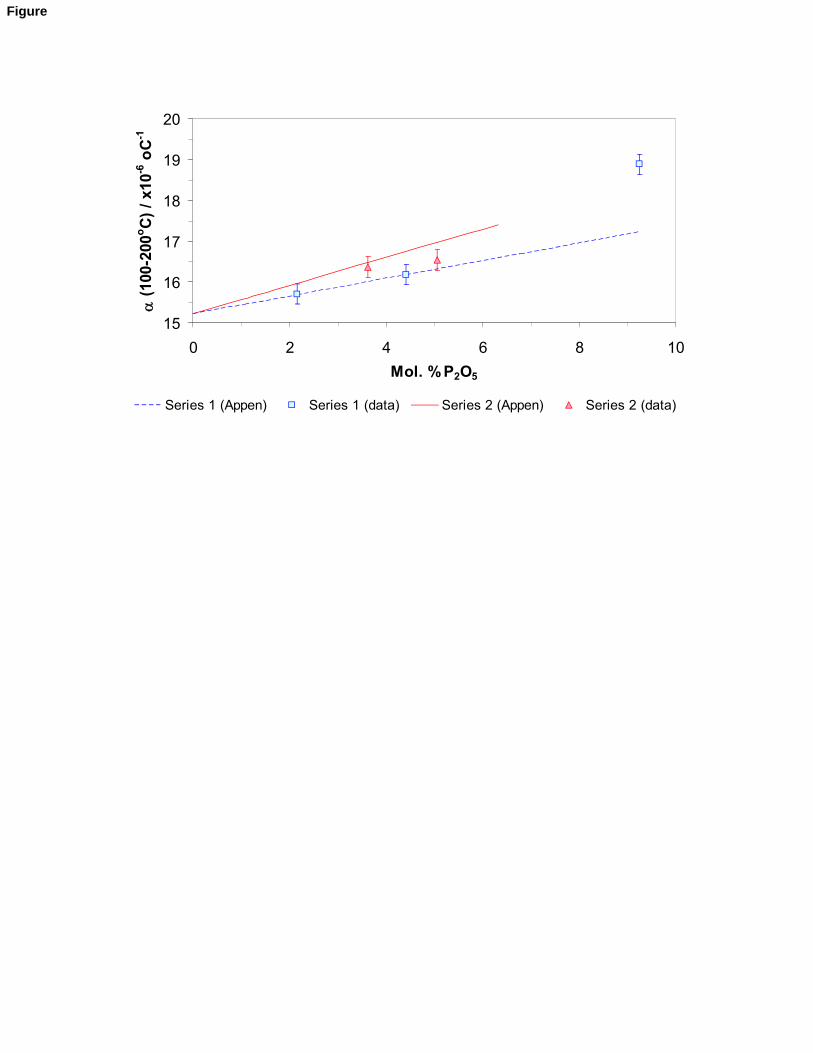
Fig. (3) shows the relationship between the thermal expansion coefficient () and
phosphate content for both series of phosphate glasses.
**Fig.3**
Due to problems with casting as a result of phase separation and / or crystallisation, only
three samples of series II and two samples of series II could be run in the dilatometer –
their corresponding values are tabulated in Table (1). For series I in Fig. (3), the
expectation would be that due to the polymerisation of the silicate network, as phosphate
is added, the glass would then find it harder to expand resulting in lower values down
the series. Actually the opposite is observed – an increasing with increasing phosphate
content. It must not be forgotten however that these glasses are in fact phase separated.
The composite glass thermal expansion coefficient, c, given by equation (4).
Phosphate bioglass NMR paper – part II; MDO 8
)]1([)( abaac VV (4)
where a, is the thermal expansion coefficient of phase a, Va the volume fraction of phase
a and b the thermal expansion coefficient of phase b. The results therefore indicate that
as phosphate is added, a composite thermal expansion coefficient may result. As
phosphate is added and the amount of the phosphate phase is increased, the weaker P-O
bond strength would result in a weaker glass structure thus explaining the increase in
across the series. Consideration however also has to be taken into the actual shape and
dimensions of the secondary phosphate phase. Dilatometry is known to be governed
dramatically by the dominant matrix phase of a glass. The results therefore suggest that as
the phosphate content increases the dimensions of the secondary phase are significant
enough to contribute to the thermal expansion of the glass.
Fig. (3) also shows the TEC values calculated from Appen’s model [11]. The fraction
of each component in the glass compositions (fMxOy) were multiplied by the Appen factors
(aMxOy) shown in Table (3) giving as shown by equation (5).
52522222 OPOPONaONaCaOCaOSiOSiO afafafaf (5)
**Table 3**
The values over the 100-200°C range show relatively good agreement with the Appen
figures. Table (1) summarises the dilatometric softening points, Ts, of glasses which were
cast into rods. It can be seen that Ts increases with P2O5 addition. As P2O5 addition
increases the network connectivity of the dominant silicate phase due to formation of a
separate phosphate phase (see part I), it would be expected to see an increase in the
softening point of the glass.
3.3. Differential thermal analysis (DTA)
Phosphate bioglass NMR paper – part II; MDO 9
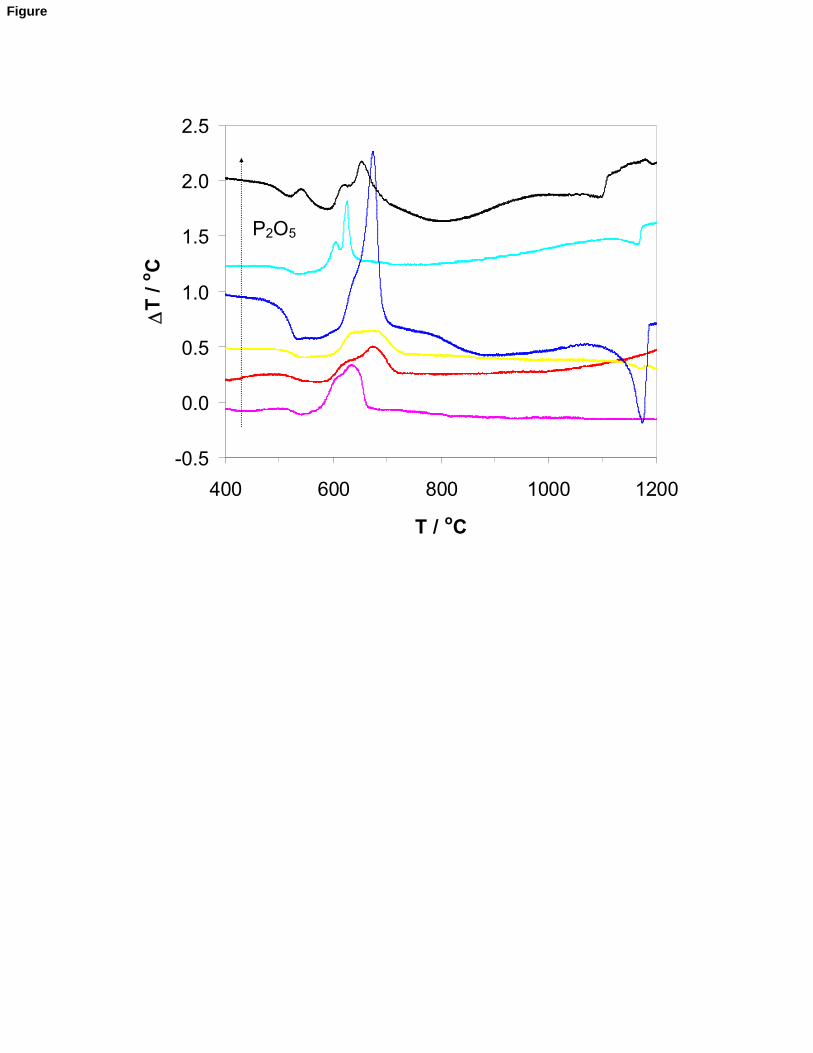
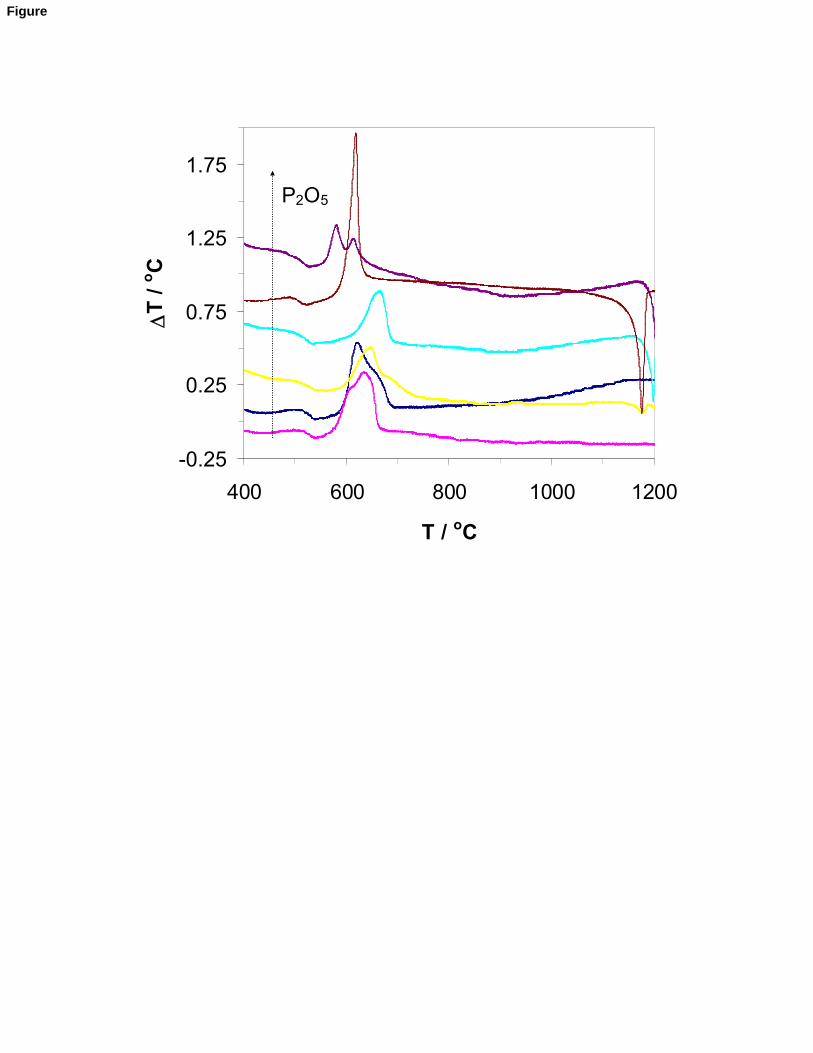
Fig. (4) and (5) illustrate the DTA traces for the phosphate glasses, series I and II. From
these traces the glass transition temperature and crystallisation temperature for each glass
were determined.
**Fig. 4**
**Fig. 5**
In general the glasses manifested a Tg and two exotherms corresponding to Txi and Txii
crystallisation temperatures. Only glass ICSW4 (9.25 mol. % P2O5 from series I) showed
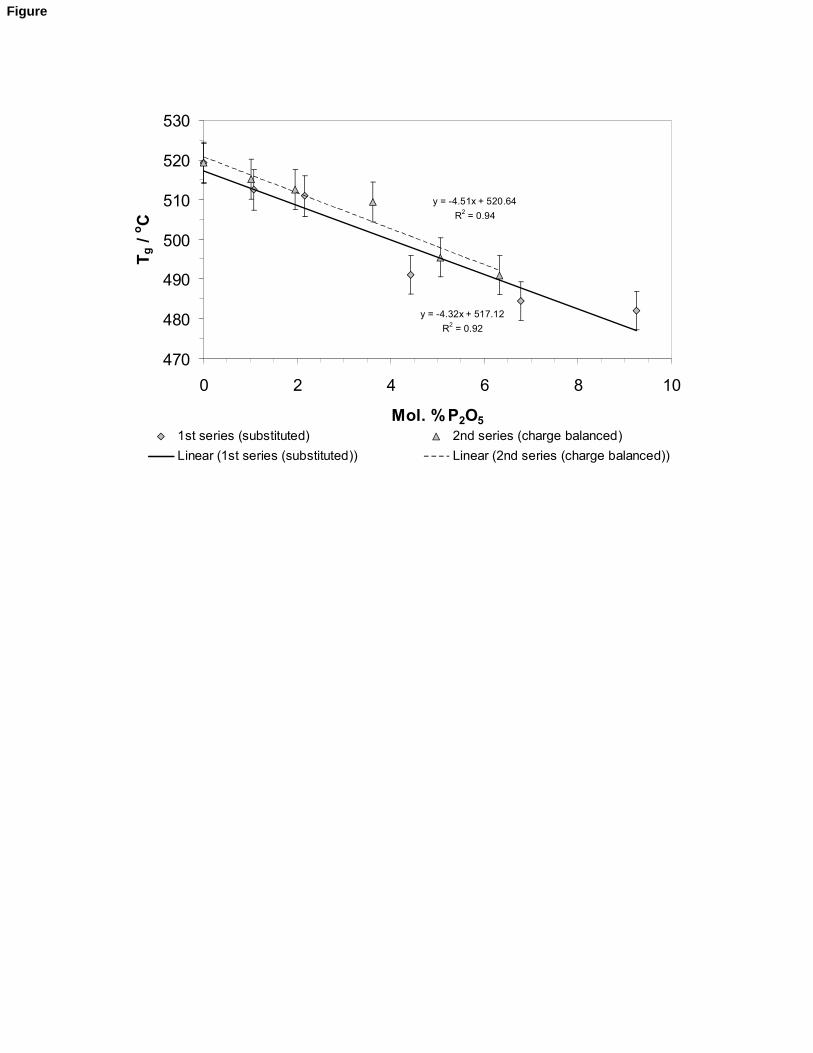
a third crystallisation exotherm (Txiii). If Tg is plotted against the amount of phosphate
added for both series (Fig. (6)) it is clear that as phosphate is increased, Tg decreases.
**Fig. 6**
This apparently contradicts the theory that phosphate addition is charge balanced
resulting in polymerisation of the silicate network and also the corresponding NMR
results discussed in part I. In series I, phosphate was simply added to the glass requiring
Na+ and Ca2+ ions to charge compensate the phosphate complexes, removing them from
their modifying role and thus polymerising the network. The expectation would have
been a corresponding increase in Tg. In the case of series II, the need for charge balancing
is compensated for and thus the silicate network remains unchanged. The expectation
would have been to see no real change in Tg, however experimentally it was seen once
again to decrease with increasing phosphate. There is therefore an obvious difference
between the expected behaviour of the glass and the actual behaviour with respect to Tg.
For both series the expected Tg correlation theories are based on the degree of disruption
of the silicate network. This theory in turn bases itself on the idea that Tg is affected
solely by the silicate phase. Elgayar et al. [12] have already discussed the affects of Na2O
replacement of CaO and the loss of ionic bridges affecting Tg. However there is no
change with respect to any modifying cations so there must be another phenomena
occurring with the addition of phosphate and its corresponding affect on the glass
Phosphate bioglass NMR paper – part II; MDO 10
transition temperature. From the 31P MAS-NMR data discussed in part I, it is already
known that the glasses have a clustered or phase separated phosphate structure. An
expectation might be a second glass transition temperature corresponding to the
phosphate phase. From the traces however there seems to be no evidence of one. This
could mean it is simply being masked by the other features in the DTA trace or even due
to the small amount of phosphate in the glass and / or the actual phase size being too
small, that it is not detectable. It is however suggested that what is being observed is a
composite glass transition temperature (i.e. due to a number of competing factors) due to
the fact that Tg decreases when the NC’ is the same (series II) and even when NC’
increases (series I). It could also be suggested that as the phosphate content increases the
corresponding phosphate phase size increases, then surpassing some critical size
dimension to be of significance to affect the Tg values.
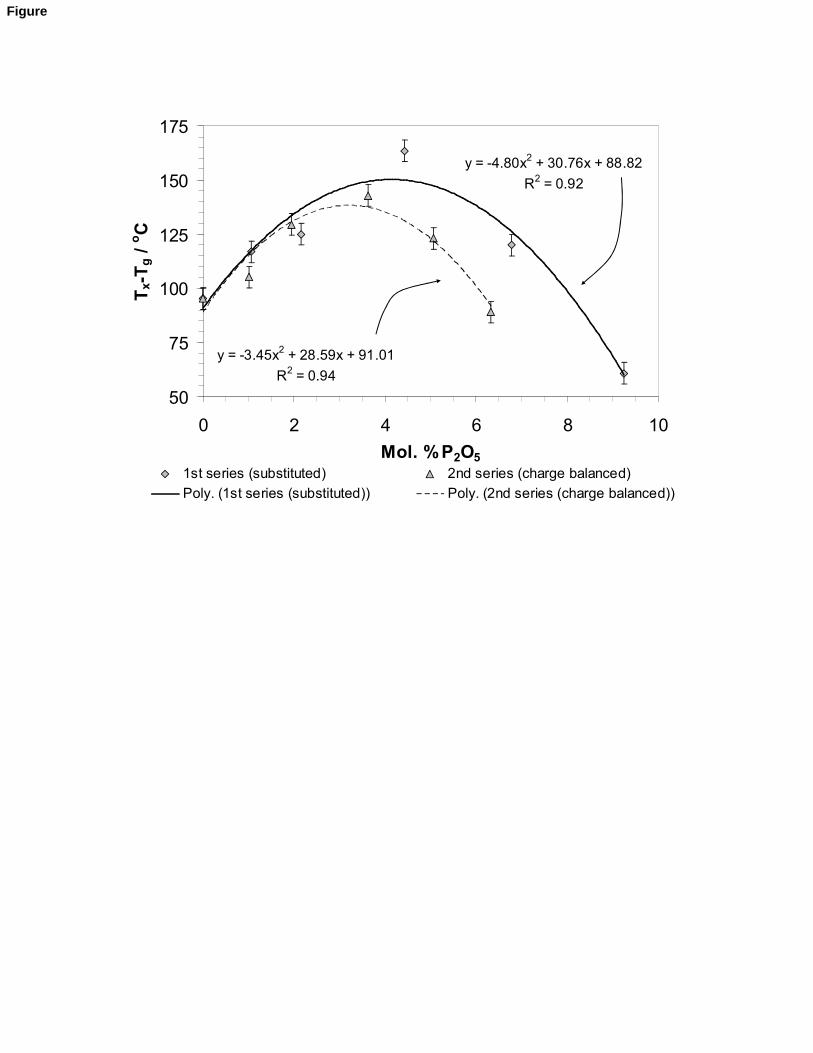
Fig. (7) illustrates the working range or glass stability (Txi-Tg) with respect to the
amount of P2O5 added.
**Fig. 7**
It can be seen that Txi-Tg increases to a maximum in both series at a molar ratio of
around 4 P2O5 then decreases. This working range is important in processes such as
sintering and fibre drawing and should ideally be maximised for both to avoid
crystallisation at temperatures where the glass viscosity is sufficient to allow viscous flow
to occur. The traces show the presence of two crystallisation exotherms in both series
which often overlap. These two exotherms could correspond to, most probably, the
crystallisation of two separate crystal phases or, maybe, the crystallisation of the same
phase in two phase separated regions or by two different mechanisms. It is suggested that
it is most likely to be the crystallisation of two separate crystal phases i.e., crystal phase
A and crystal phase B. It should be noted that the order of crystallisation temperatures
observed could switch within the series – for example in one glass Txi could correspond to
crystal phase A and Txii to crystal phase B while in another glass Txi could correspond to
crystal phase B and Txii to crystal phase A, depending on composition and the
crystallisation mechanisms involved.
Phosphate bioglass NMR paper – part II; MDO 11
In both series I and II, Txi and Txii seem to be relatively independent of phosphate
content (Table (1)), with a small decrease with increasing P2O5 content. This suggests
that phosphate aids crystallisation at lower temperatures. For series I however, with the
polymerisation of the network across the series it would be expected that more energy
would be required to re-arrange the ions into a crystal state thus an increase in
crystallisation temperature would be expected across the series. This trend however is not
seen suggesting that once again the addition of phosphate somehow aids crystallisation.
With respect to the observed endotherms, within series I, all are broad and weak and
seem to be probably as a result of the melting of the residual glassy phase. In series 2
however ICSW8 and ICSW9 exhibit very sharp and definite melting endotherms with an
onset of melting approximately 1180C. This suggests that ICSW8 and 9 crystallise to the
same phase. This endotherm is missing from all the other glasses in the series with
exception to ICSW6 – which shows a much weaker endotherm however at the same
temperature. This suggests that the other members of the series do not crystallise to this
unknown phase. From the DTA information on crystallisation exotherms and melting
endotherms it can be predicted that there are probably three crystalline phases occurring
one of which is common to ICSW8 and ICSW9 with a very small amount of the same
phase in ICSW6.
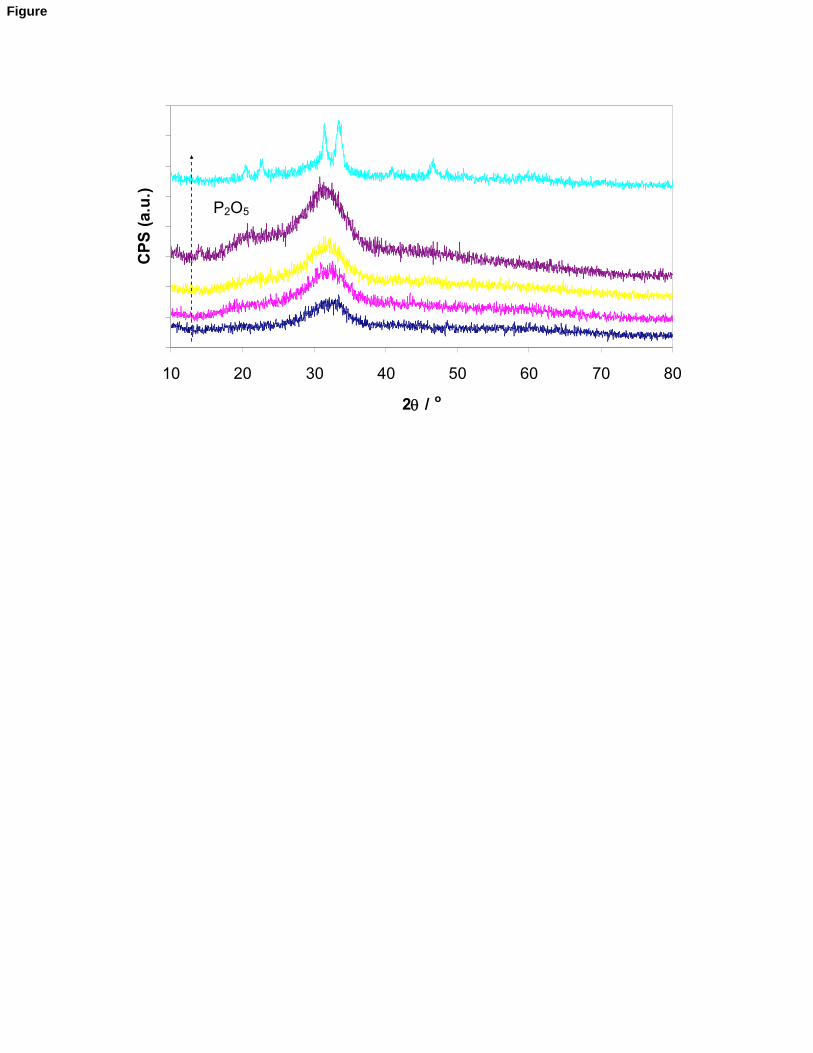
3.4. X-ray diffraction (XRD)
XRD is a limited technique for amorphous materials as only long range periodic order or
disorder can be probed. X-ray diffraction was therefore used just to confirm the glassy
nature of the ICSW phosphate glasses series I and II. Fig. (8)
**Fig. 8**
indeed shows the characteristic amorphous halo for glasses in series I. There is one
exception within both series – ICSW4, which also gave higher density and TEC values
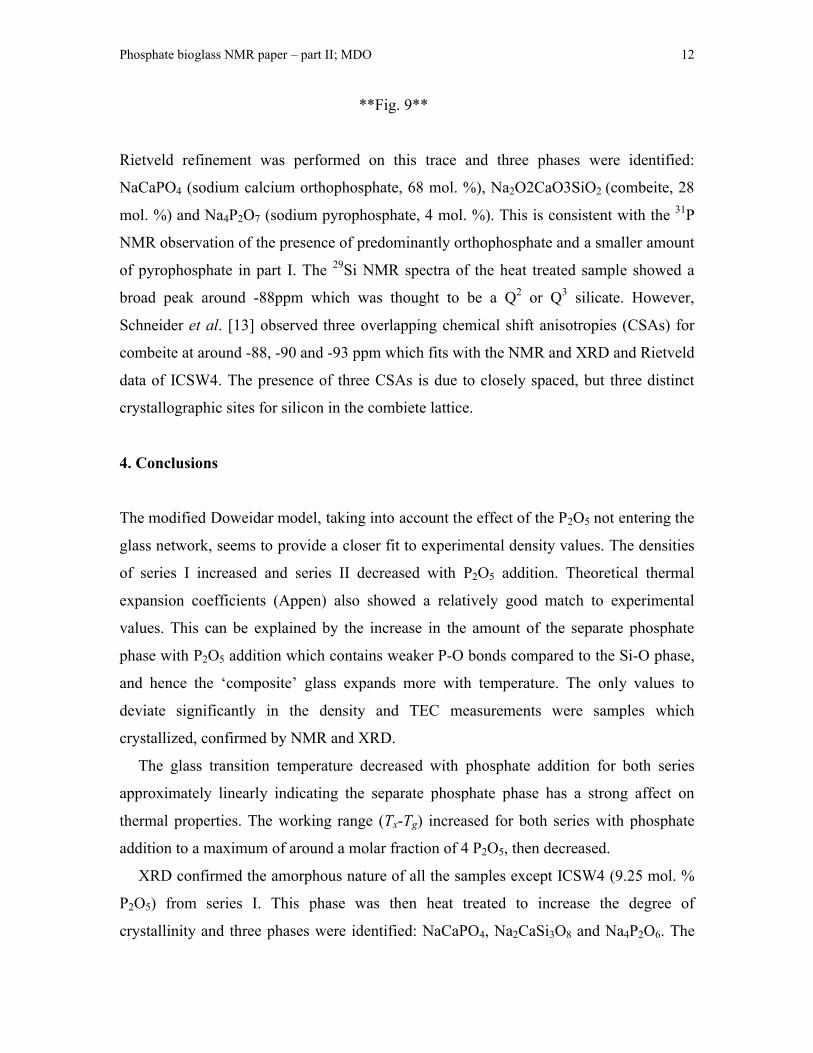
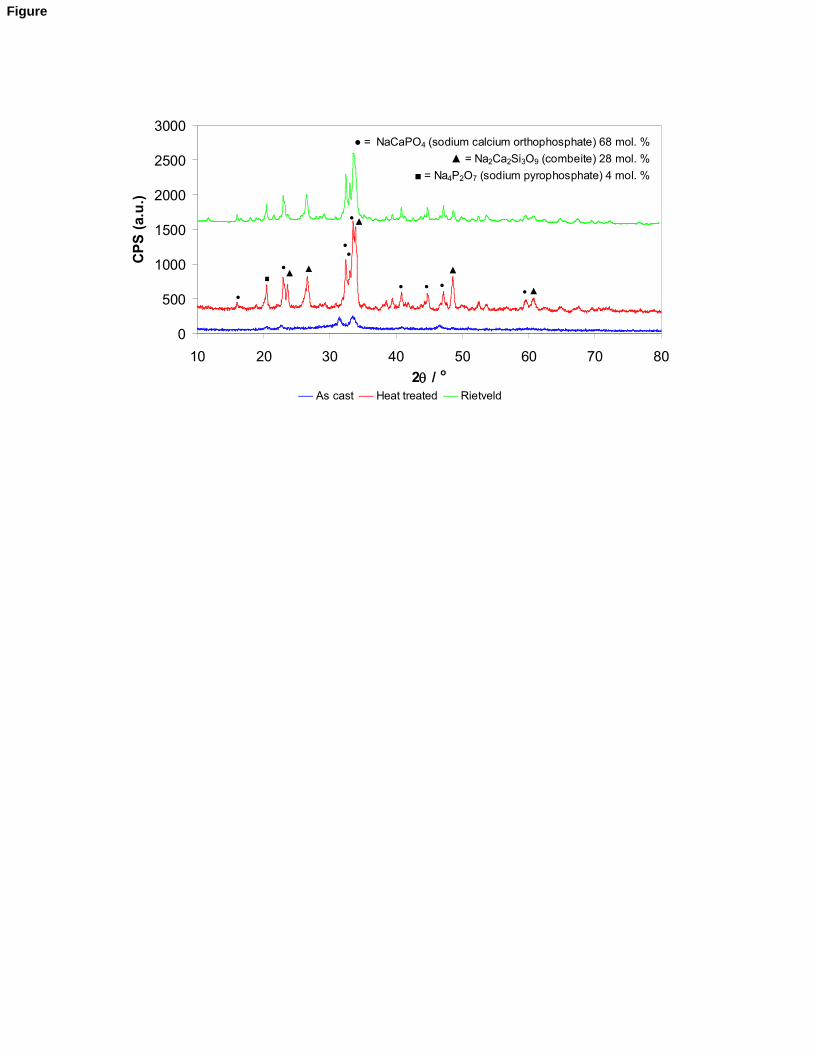
shown in (1) and (3) respectively. The XRD pattern of heat treated ICSW4 in Fig. (9)
exhibits characteristic sharp crystalline peaks.
Phosphate bioglass NMR paper – part II; MDO 12
**Fig. 9**
Rietveld refinement was performed on this trace and three phases were identified:
NaCaPO4 (sodium calcium orthophosphate, 68 mol. %), Na2O2CaO3SiO2 (combeite, 28
mol. %) and Na4P2O7 (sodium pyrophosphate, 4 mol. %). This is consistent with the 31P
NMR observation of the presence of predominantly orthophosphate and a smaller amount
of pyrophosphate in part I. The 29Si NMR spectra of the heat treated sample showed a
broad peak around -88ppm which was thought to be a Q2 or Q3 silicate. However,
Schneider et al. [13] observed three overlapping chemical shift anisotropies (CSAs) for
combeite at around -88, -90 and -93 ppm which fits with the NMR and XRD and Rietveld
data of ICSW4. The presence of three CSAs is due to closely spaced, but three distinct
crystallographic sites for silicon in the combiete lattice.
4. Conclusions
The modified Doweidar model, taking into account the effect of the P2O5 not entering the
glass network, seems to provide a closer fit to experimental density values. The densities
of series I increased and series II decreased with P2O5 addition. Theoretical thermal
expansion coefficients (Appen) also showed a relatively good match to experimental
values. This can be explained by the increase in the amount of the separate phosphate
phase with P2O5 addition which contains weaker P-O bonds compared to the Si-O phase,
and hence the ‘composite’ glass expands more with temperature. The only values to
deviate significantly in the density and TEC measurements were samples which
crystallized, confirmed by NMR and XRD.
The glass transition temperature decreased with phosphate addition for both series
approximately linearly indicating the separate phosphate phase has a strong affect on
thermal properties. The working range (Tx-Tg) increased for both series with phosphate
addition to a maximum of around a molar fraction of 4 P2O5, then decreased.
XRD confirmed the amorphous nature of all the samples except ICSW4 (9.25 mol. %
P2O5) from series I. This phase was then heat treated to increase the degree of
crystallinity and three phases were identified: NaCaPO4, Na2CaSi3O8 and Na4P2O6. The
Phosphate bioglass NMR paper – part II; MDO 13
NaCaPO4 phase is in agreement with the conclusions from the NMR data in part I, i.e.
presence of a separate orthophosphate phase, however the stoichiometry does not fit with
the observed 31P chemical shift of the heat treated sample. This possibly indicates a non-
stoiciometric Ca-Na solid solution orthophosphate or the presence of defects such as
vacancies. Van Wazer stated the presence of orthopohosphate groups in anhydrous
sodium-phosphate glasses was highly unlikely due to the high concentration of negative
charge on the orthophosphate ion pushing the following equilibrium towards the left
(terminal groups) [2]:
2R−[PO4]2- R−[PO4]
-−R + [PO4]3- (6)
However in the presence of water the formation of orthophosphate becomes more likely,
due to the similar electronegativity of hydrogen and phosphorous, enabling the proton to
form a covalent bond with an oxygen, or satisfy a charge in the phosphate ion [2]. In the
glasses studied here, as the modifier content far exceeds the phosphate content (over
10:1) saturation occurs resulting in a higher probability of orthophosphate formation.
Hydrolysis from the melt (during frit casting) could also contribute to orthophosphate
presence.
All the glasses were amorphous on casting except ICSW4, which had the highest NC’
of the series (2.62). Previous studies [14] have shown the presence of pyrophosphate as
well orthophosphate of bioglasses with similar connectivities. Three phases crystallized
from the heat treated ICSW4 sample: sodium calcium orthophosphate, sodium
pyrophosphate and combeite. These phases are consistent with the observed 29Si and 31P
NMR chemical shifts shown in part I of this study: 14 ppm (NaCaPO4), 3 ppm (Na4P2O7)
and -88 ppm (Na2Ca2Si3O9).
Acknowledgements
MDO and SW would like to thanks EPSRC (grant no. EP/C549309/1) and Imperial
College London for funding this work. MDO would like to thank Dr. Steve Skinner for
useful discussions on Rietveld refinement.
Phosphate bioglass NMR paper – part II; MDO 14
References
[1] W. Vogel, Glass chemistry, Springer-Verlag, Berlin, 1994.[2] J. R. Van Wazer, J. Am. Chem. Soc., 72, (1950) 644.[3] L. L. Hench, J. Am. Ceram. Soc., 74, (1991) 1487.[4] L. L. Hench, in: B. D. Ratner (Eds.), Biomaterials science an introduction to
materials in medicine, Academic Press, London, 2004.[5] Y. Ebisawa, T. Kokubo, K. Ohura and T. Yamamuro, J. Mater. Sci. - Mater.
Med., 1, (1990) 239.[6] R. Hill, J. Mater. Sci. Lett., 15, (1996) 1122.[7] L. Holliday, Ionic polymers, Wiley, New York, 1975.[8] N. H. Ray, Inorganic polymers, Academic Press, London, 1978.[9] H. Doweidar, J. Non-Cryst. Solids, 240, (1998) 55.[10] H. Doweidar, J. Non-Cryst. Solids, 249, (1999) 194.[11] A. A. Appen, Khimiia stekla, Khimiia, Leningradskoe otd-nie, Leningrad, 1970.[12] I. Elgayar, A. E. Aliev, A. R. Boccaccini and R. G. Hill, J. Non-Cryst. Solids,
351, (2005) 173.[13] J. Schneider, V. R. Mastelaro, H. Panepucci and E. D. Zanotto, J. Non-Cryst.
Solids, 273 (2000) 8.[14] H. Grussaute, L. Montagne, G. Palavit and J. L. Bernard, J. Non-Cryst. Solids,
263, (2000) 312.[15] J. A. Kerr, CRC Handbook of Chemistry and Physics, CRC Press, Florida, 2000.
Phosphate bioglass NMR paper – part II; MDO 15
Table captions
Table (1): Glasses from series I (fixed Na2O:CaO = 1:0.87) and II (charge balanced), showing characteristic temperatures, glass transition Tg , dilatometric softening point, Ts, and crystallisation Tx, thermal expansion coefficient (100-200˚C), , and densities, .
Table (2): Densities of species thought to be present in the glasses studied [15].
Table (3): Appen factors (aMO) for components in the glasses studied [11].
Figure captions
Fig. (1): Variation in density with P2O5 content for series I with calculated values.
Fig. (2): Variation in density with P2O5 content for series II with calculated values.
Fig. (3): TECs () for series I and II with calculated (Appen) values.
Fig. (4): DTA traces for series I (ICSW1 magenta, ICIE1 red, ICSW2 yellow, ICSW5 cyan, ICSW4 black).
Fig. (5): DTA traces for series II (ICSW1 magenta, ICSW6 blue, ICSW7 yellow, ICSW8 sian, ICSW10 brown, ICSW9 purple).
Fig. (6): Tg for series I and II.
Fig. (7): Tx–Tg for series I and II.
Fig. (8): X-Ray diffraction patterns for series I cast glasses with increasing P2O5 content.
Fig. (9): X-Ray diffraction pattern for crystalline sample ICSW4 before and after heat treatment with phases identified and Rietveld refinement, with molar proportions of phases shown (note – additional sodium pyrophosphate peak are masked in the region around 32° which contains the strongest lines from the other two phases).
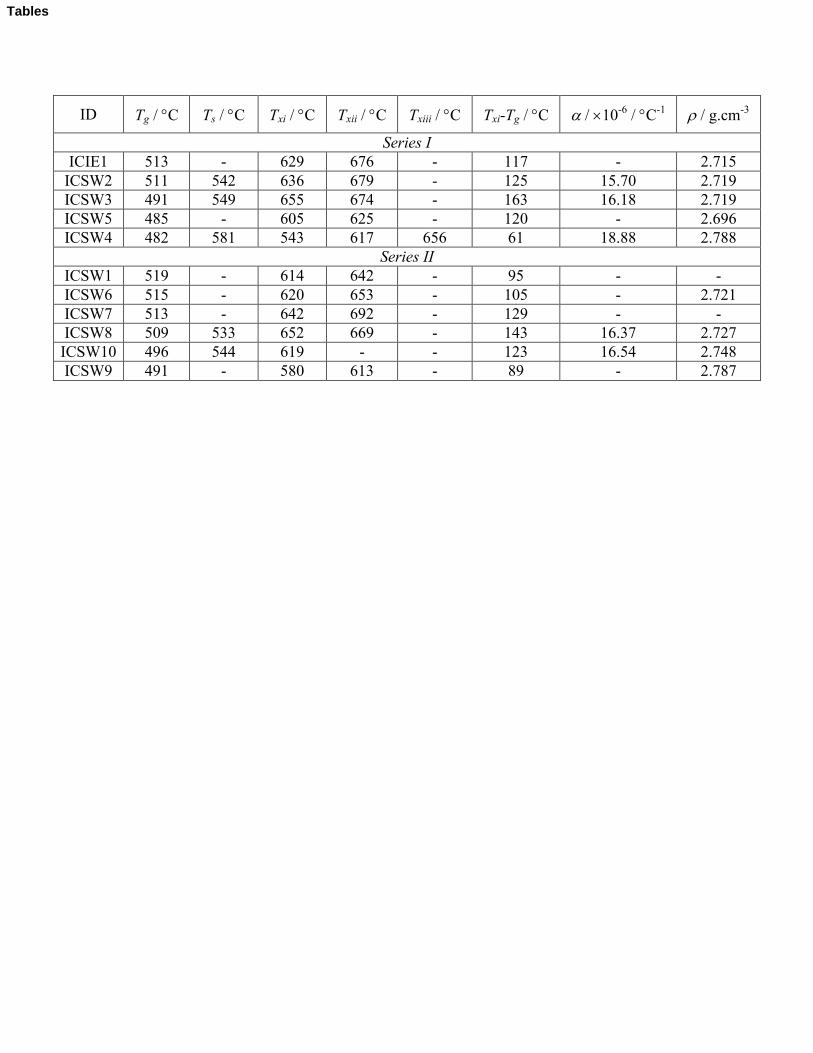
ID Tg / C Ts / C Txi / C Txii / C Txiii / C Txi-Tg / C / 10-6 / C-1 / g.cm-3
Series IICIE1 513 - 629 676 - 117 - 2.715
ICSW2 511 542 636 679 - 125 15.70 2.719ICSW3 491 549 655 674 - 163 16.18 2.719ICSW5 485 - 605 625 - 120 - 2.696ICSW4 482 581 543 617 656 61 18.88 2.788
Series IIICSW1 519 - 614 642 - 95 - -ICSW6 515 - 620 653 - 105 - 2.721ICSW7 513 - 642 692 - 129 - -ICSW8 509 533 652 669 - 143 16.37 2.727ICSW10 496 544 619 - - 123 16.54 2.748ICSW9 491 - 580 613 - 89 - 2.787
Tables
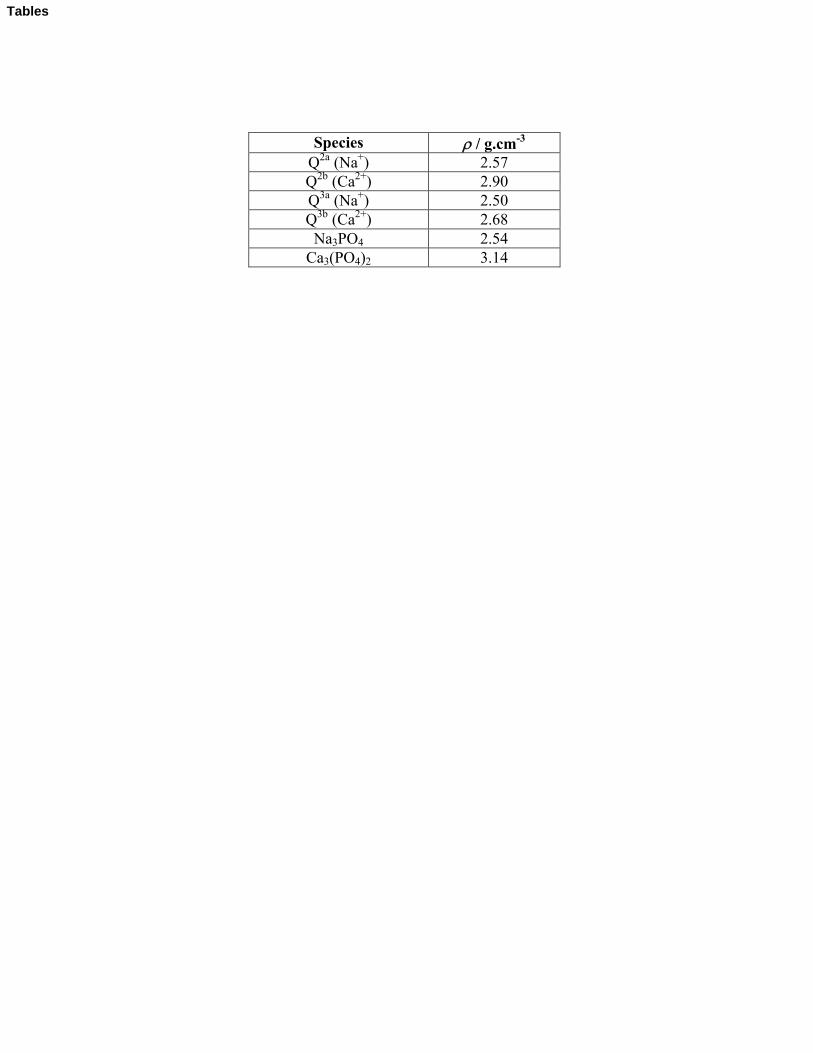
Species / g.cm-3
Q2a (Na+) 2.57Q2b (Ca2+) 2.90Q3a (Na+) 2.50Q3b (Ca2+) 2.68
Na3PO4 2.54Ca3(PO4)2 3.14
Tables
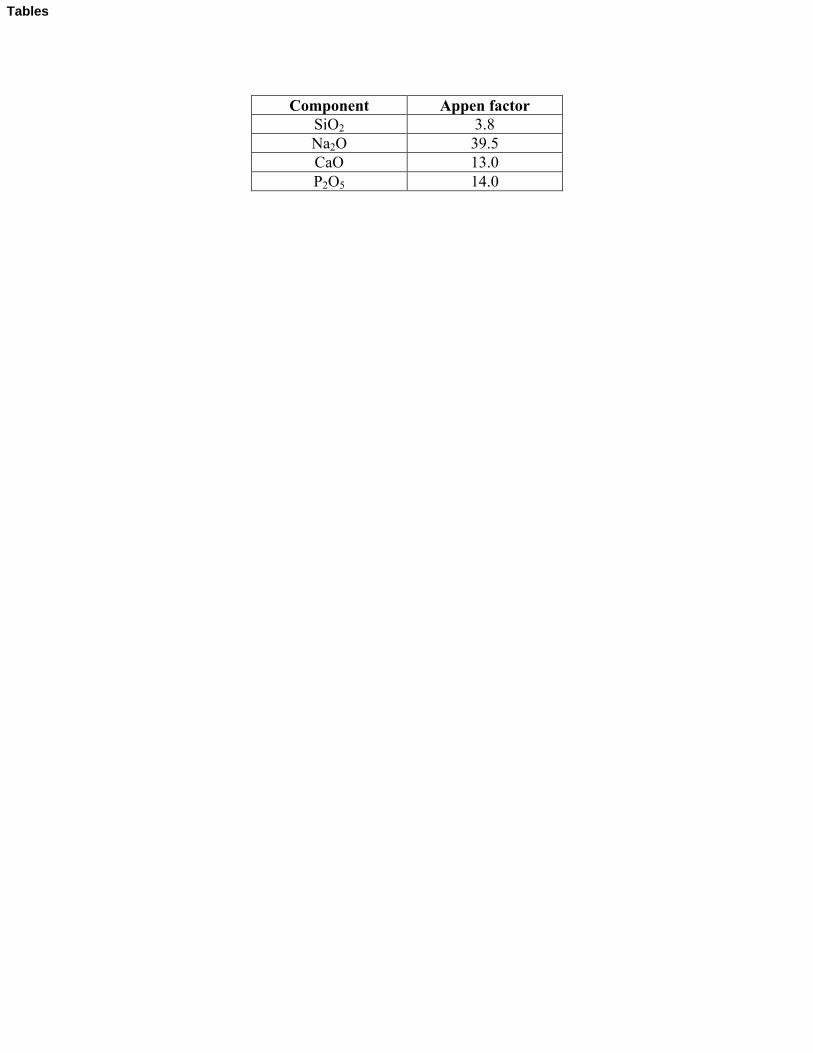
Component Appen factorSiO2 3.8Na2O 39.5CaO 13.0P2O5 14.0
Tables
2.60
2.65
2.70
2.75
2.80
0 2 4 6 8 10
Mol. % P2O5
r /
g.c
m-3
Data Doweidar Modified Doweidar
Figure
2.700
2.725
2.750
2.775
2.800
0 1 2 3 4 5 6 7
Mol. % P2O5
r /
g.c
m-3
Data Doweidar Modified Doweidar
Figure
15
16
17
18
19
20
0 2 4 6 8 10
Mol. % P2O5
a (
100-
200o
C)
/ x1
0-6 o
C-1
Series 1 (Appen) Series 1 (data) Series 2 (Appen) Series 2 (data)
Figure
-0.5
0.0
0.5
1.0
1.5
2.0
2.5
400 600 800 1000 1200
T / oC
DT
/ o
C
P2O5
Figure
-0.25
0.25
0.75
1.25
1.75
400 600 800 1000 1200
T / oC
DT
/ o
C
P2O5
Figure
y = -4.32x + 517.12
R2 = 0.92
y = -4.51x + 520.64
R2 = 0.94
470
480
490
500
510
520
530
0 2 4 6 8 10
Mol. % P2O5
Tg /
oC
1st series (substituted) 2nd series (charge balanced)
Linear (1st series (substituted)) Linear (2nd series (charge balanced))
Figure
y = -3.45x2 + 28.59x + 91.01
R2 = 0.94
y = -4.80x2 + 30.76x + 88.82
R2 = 0.92
50
75
100
125
150
175
0 2 4 6 8 10
Mol. % P2O5
Tx-T
g /
oC
1st series (substituted) 2nd series (charge balanced)
Poly. (1st series (substituted)) Poly. (2nd series (charge balanced))
Figure
10 20 30 40 50 60 70 80
2q / o
CP
S (
a.u
.)
P2O5
Figure
0
500
1000
1500
2000
2500
3000
10 20 30 40 50 60 70 80
2q / o
CP
S (
a.u
.)
As cast Heat treated Rietveld
● = NaCaPO4 (sodium calcium orthophosphate) 68 mol. %
▲ = Na2Ca2Si3O9 (combeite) 28 mol. %
■ = Na4P2O7 (sodium pyrophosphate) 4 mol. %
▲ ▲
▲
▲
▲■
Figure
Journal of
Non-Crystalline Solids
Confirmation of Authorship
Please save a copy of this file, complete and upload as the “Confirmation of Authorship” file.
As corresponding author, I Dr. M. D. O’Donnell, hereby confirm on behalf of all authors that:
1. This manuscript has not been published, was not, and is not being submitted to any other journal. If presented at a conference, the conference is identified. If published in conference proceedings, substantial justification for re-publication must be presented.
2. All necessary permissions for publication were secured prior to submission of the manuscript.
3. All authors each made a significant contribution to the research reported and have read and approved the submitted manuscript.
* Confirmation of Authorship