Embed Size (px)
Citation preview

Last Updated 23 June 2015
Instructions for Use
For the quantitative measurement of Gas1 in mouse serum, plasma, urine, cell culture supernatant, cell and tissue extracts.
This product is for research use only and is not intended for diagnostic use.
ab205573 – Gas1 Mouse SimpleStep ELISA® Kit

Discover more at www.abcam.com 1
Table of ContentsINTRODUCTION1. BACKGROUND 22. ASSAY SUMMARY 3
GENERAL INFORMATION3. PRECAUTIONS 44. STORAGE AND STABILITY 45. MATERIALS SUPPLIED 46. MATERIALS REQUIRED, NOT SUPPLIED 47. LIMITATIONS 58. TECHNICAL HINTS 5
ASSAY PREPARATION9. REAGENT PREPARATION 710. STANDARD PREPARATION 811. SAMPLE PREPARATION 912. PLATE PREPARATION 12
ASSAY PROCEDURE13. ASSAY PROCEDURE 13
DATA ANALYSIS14. CALCULATIONS 1515. TYPICAL DATA 1616. TYPICAL SAMPLE VALUES 1817. ASSAY SPECIFICITY 2318. SPECIES REACTIVITY 23
RESOURCES19. TROUBLESHOOTING 2420. NOTES 25

Discover more at www.abcam.com 2
INTRODUCTION
1. BACKGROUND
Abcam’s Gas1 in vitro SimpleStep ELISA® (Enzyme-Linked Immunosorbent Assay) kit is designed for the quantitative measurement of Gas1 protein in mouse serum, plasma, urine, cell culture supernatant, cell and tissue extracts.
The SimpleStep ELISA® employs an affinity tag labeled capture antibody and a reporter conjugated detector antibody which immunocapture the sample analyte in solution. This entire complex (capture antibody/analyte/detector antibody) is in turn immobilized via immunoaffinity of an anti-tag antibody coating the well. To perform the assay, samples or standards are added to the wells, followed by the antibody mix. After incubation, the wells are washed to remove unbound material. TMB substrate is added and during incubation is catalyzed by HRP, generating blue coloration. This reaction is then stopped by addition of Stop Solution completing any color change from blue to yellow. Signal is generated proportionally to the amount of bound analyte and the intensity is measured at 450 nm. Optionally, instead of the endpoint reading, development of TMB can be recorded kinetically at 600 nm.
Gas1 (Growth arrest-specific protein 1) is involved in growth suppression by inhibiting entry into S phase. Gas1 prevents cycling of normal and transformed cells. Mature Gas1 protein is generated following removal of an N-terminal signal peptide and a C-terminal propeptide. The antibodies in this assay were generated using the mature form of mouse Gas1.

Discover more at www.abcam.com 3
INTRODUCTION
2. ASSAY SUMMARY
Remove appropriate number of antibody coated well strips. Equilibrate all reagents to room temperature. Prepare all reagents, samples, and standards as instructed.
Add standard or sample to appropriate wells.
Add Antibody Cocktail to all wells. Incubate at room temperature.
Aspirate and wash each well. Add TMB Substrate to each well and incubate. Add Stop Solution at a defined endpoint. Alternatively, record color development kinetically after TMB substrate addition.
Discover more at www.abcam.com 4
GENERAL INFORMATION
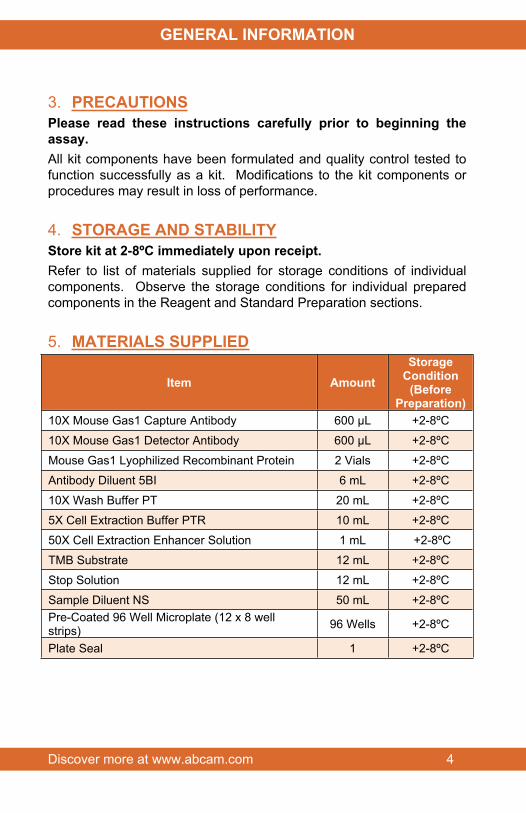
3. PRECAUTIONSPlease read these instructions carefully prior to beginning the assay.All kit components have been formulated and quality control tested to function successfully as a kit. Modifications to the kit components or procedures may result in loss of performance.
4. STORAGE AND STABILITYStore kit at 2-8ºC immediately upon receipt.Refer to list of materials supplied for storage conditions of individual components. Observe the storage conditions for individual prepared components in the Reagent and Standard Preparation sections.
5. MATERIALS SUPPLIED
Item AmountStorage
Condition(Before
Preparation)10X Mouse Gas1 Capture Antibody 600 µL +2-8ºC
10X Mouse Gas1 Detector Antibody 600 µL +2-8ºC
Mouse Gas1 Lyophilized Recombinant Protein 2 Vials +2-8ºC
Antibody Diluent 5BI 6 mL +2-8ºC
10X Wash Buffer PT 20 mL +2-8ºC
5X Cell Extraction Buffer PTR 10 mL +2-8ºC
50X Cell Extraction Enhancer Solution 1 mL +2-8ºC
TMB Substrate 12 mL +2-8ºC
Stop Solution 12 mL +2-8ºC
Sample Diluent NS 50 mL +2-8ºCPre-Coated 96 Well Microplate (12 x 8 well strips) 96 Wells +2-8ºC
Plate Seal 1 +2-8ºC

Discover more at www.abcam.com 5
GENERAL INFORMATION
6. MATERIALS REQUIRED, NOT SUPPLIEDThese materials are not included in the kit, but will be required to successfully utilize this assay:
Microplate reader capable of measuring absorbance at 450 or 600 nm.
Method for determining protein concentration (BCA assay recommended).
Deionized water.
PBS (1.4 mM KH2PO4, 8 mM Na2HPO4, 140 mM NaCl, 2.7 mM KCl, pH 7.4).
Multi- and single-channel pipettes.
Tubes for standard dilution.
Plate shaker for all incubation steps.
Phenylmethylsulfonyl Fluoride (PMSF) (or other protease inhibitors).
7. LIMITATIONS Assay kit intended for research use only. Not for use in diagnostic
procedures.
Do not mix or substitute reagents or materials from other kit lots or vendors. Kits are QC tested as a set of components and performance cannot be guaranteed if utilized separately or substituted.
8. TECHNICAL HINTS Samples generating values higher than the highest standard
should be further diluted in the appropriate sample dilution buffers.
Avoid foaming or bubbles when mixing or reconstituting components.
Avoid cross contamination of samples or reagents by changing tips between sample, standard and reagent additions.

Discover more at www.abcam.com 6
GENERAL INFORMATION
Ensure plates are properly sealed or covered during incubation steps.
Complete removal of all solutions and buffers during wash steps is necessary to minimize background.
As a guide, typical ranges of sample concentration for commonly used sample types are shown below in Sample Preparation (section 11).
All samples should be mixed thoroughly and gently.
Avoid multiple freeze/thaw of samples.
Incubate ELISA plates on a plate shaker during all incubation steps.
When generating positive control samples, it is advisable to change pipette tips after each step.
The provided 5X Cell Extraction Buffer contains phosphatase inhibitors and protease inhibitor aprotinin. Additional protease inhibitors can be added if required.
The provided Antibody Diluents and Sample Diluents contain protease inhibitor aprotinin. Additional protease inhibitors can be added if required.
The provided 50X Cell Extraction Enhancer Solution may precipitate when stored at + 4ºC. To dissolve, warm briefly at + 37ºC and mix gently. The 50X Cell Extraction Enhancer Solution can be stored at room temperature to avoid precipitation.
To avoid high background always add samples or standards to the well before the addition of the antibody cocktail.
This kit is sold based on number of tests. A ‘test’ simply refers to a single assay well. The number of wells that contain sample, control or standard will vary by product. Review the protocol completely to confirm this kit meets your requirements. Please contact our Technical Support staff with any questions.

Discover more at www.abcam.com 7
ASSAY PREPARATION
9. REAGENT PREPARATION Equilibrate all reagents to room temperature (18-25°C) prior to
use. The kit contains enough reagents for 96 wells. The sample volumes below are sufficient for 48 wells (6 x 8-well strips); adjust volumes as needed for the number of strips in your experiment.
Prepare only as much reagent as is needed on the day of the experiment. Capture and Detector Antibodies have only been tested for stability in the provided 10X formulations.
9.1 1X Cell Extraction Buffer PTR (For cell and tissue extracts only)
Prepare 1X Cell Extraction Buffer PTR by diluting 5X Cell Extraction Buffer PTR and 50X Cell Extraction Enhancer Solution to 1X with deionized water. To make 10 mL 1X Cell Extraction Buffer PTR combine 7.8 mL deionized water, 2 mL 5X Cell Extraction Buffer PTR and 200 µL 50X Cell Extraction Enhancer Solution Mix thoroughly and gently. If required protease inhibitors can be added.Alternative – Enhancer may be added to 1X Cell Extraction Buffer PTR after extraction of cells or tissue. Refer to note in the Troubleshooting section.
9.2 1X Wash Buffer PTPrepare 1X Wash Buffer PT by diluting 10X Wash Buffer PT with deionized water. To make 50 mL 1X Wash Buffer PT combine 5 mL 10X Wash Buffer PT with 45 mL deionized water. Mix thoroughly and gently.
9.3 Antibody CocktailPrepare Antibody Cocktail by diluting the capture and detector antibodies in Antibody Diluent 5BI. To make 3 mL of the Antibody Cocktail combine 300 µL 10X Capture Antibody and 300 µL 10X Detector Antibody with 2.4 mL Antibody Diluent 5BI. Mix thoroughly and gently.

Discover more at www.abcam.com 8
ASSAY PREPARATION
10.STANDARD PREPARATIONPrepare serially diluted standards immediately prior to use. Always prepare a fresh set of positive controls for every use.The protein standard included in this kit is a peptide fragment that has been calibrated against the active form of the protein. The following section describes the preparation of a standard curve for duplicate measurements (recommended).
10.1 For serum, plasma, urine and cell culture supernatant samples reconstitute the Gas1 protein standard by adding 500 µL Sample Diluent NS. For cell and tissue extracts reconstitute the Gas1 protein standard by adding 500 µL 1X Cell Extraction Buffer PTR. Mix thoroughly and gently. Hold at room temperature for 10 minutes and mix gently. This is the 13,333 pg/mL Stock Standard Solution.
10.2 Label eight tubes, Standards 1– 8.10.3 Add 232.5 μL appropriate diluent (see Step 10.1) into tube
number 1 and 150 μL of appropriate diluent (see Step 10.1) into numbers 2-8.
10.4 Use the Stock Standard to prepare the following dilution series. Standard #8 contains no protein and is the Blank control:
13,333 pg/mL
3,000pg/mL
1,500pg/mL
750pg/mL
375pg/mL
187.5pg/mL
93.8pg/mL
46.9pg/mL
67.5 µL150 µL
µ150 µL
µ150 µL
µ150 µL
µ150 µL
µ150 µL
µ
0pg/mL

Discover more at www.abcam.com 9
ASSAY PREPARATION
11.SAMPLE PREPARATION
TYPICAL SAMPLE DYNAMIC RANGE
Sample Type Range
Mouse Serum 1-25%
Mouse Plasma - Citrate 1-25%
Mouse Plasma - EDTA 1-50%
L929 Stimulated Cell Culture Supernatant 3-25%
Urine 2-50%
NIH3T3 Extract 8-250 µg/mL
L929 Stimulated Extract 8-250 µg/mL
11.1 PlasmaCollect plasma using citrate or EDTA. Centrifuge samples at 2,000 x g for 10 minutes. Dilute samples into Sample Diluent NS and assay. Store un-diluted plasma samples at -20ºC or below for up to 3 months. Avoid repeated freeze-thaw cycles.
11.2 SerumSamples should be collected into a serum separator tube. After clot formation, centrifuge samples at 2,000 x g for 10 minutes and collect serum. Dilute samples into Sample Diluent NS and assay. Store un-diluted serum at -20ºC or below. Avoid repeated freeze-thaw cycles.
11.3 Cell Culture SupernatantsCentrifuge cell culture media at 2,000 x g for 10 minutes to remove debris. Collect supernatants and assay. Or dilute samples into Sample Diluent NS and assay. Store undiluted

Discover more at www.abcam.com 10
ASSAY PREPARATION
samples at -20°C or below. Avoid repeated freeze-thaw cycles.
11.4 UrineCentrifuge urine at 2,000 x g for 10 minutes to remove debris. Collect supernatants, dilute in Sample Diluent NS and assay. Store samples at -20°C or below. Avoid repeated freeze-thaw cycles.
11.5 Preparation of extracts from cell pellets11.5.1 Collect non-adherent cells by centrifugation or
scrape to collect adherent cells from the culture flask. Typical centrifugation conditions for cells are 500 x g for 5 minutes at 4ºC.
11.5.2 Rinse cells twice with PBS.11.5.3 Solubilize pellet at 2x10⁷ cell/mL in chilled 1X Cell
Extraction Buffer PTR.11.5.4 Incubate on ice for 20 minutes. 11.5.5 Centrifuge at 18,000 x g for 20 minutes at 4°C. 11.5.6 Transfer the supernatants into clean tubes and
discard the pellets. 11.5.7 Assay samples immediately or aliquot and store at
-80°C. The sample protein concentration in the extract may be quantified using a protein assay.
11.5.8 Dilute samples to desired concentration in 1X Cell Extraction Buffer PTR.
11.6 Preparation of extracts from adherent cells by direct lysis (alternative protocol)11.6.1 Remove growth media and rinse adherent cells 2
times in PBS.11.6.2 Solubilize the cells by addition of chilled 1X Cell
Extraction Buffer PTR directly to the plate (use 750 µL - 1.5 mL 1X Cell Extraction Buffer PTR per confluent 15 cm diameter plate).
Discover more at www.abcam.com 11
ASSAY PREPARATION
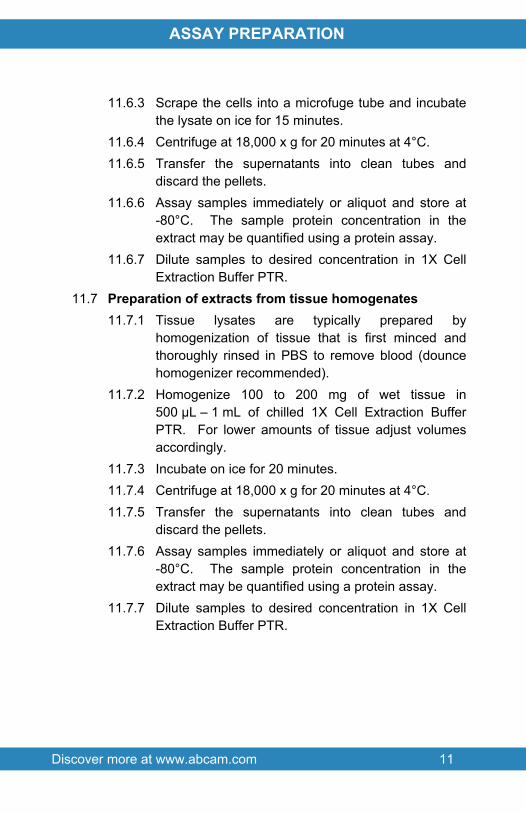
11.6.3 Scrape the cells into a microfuge tube and incubate the lysate on ice for 15 minutes.
11.6.4 Centrifuge at 18,000 x g for 20 minutes at 4°C. 11.6.5 Transfer the supernatants into clean tubes and
discard the pellets. 11.6.6 Assay samples immediately or aliquot and store at
-80°C. The sample protein concentration in the extract may be quantified using a protein assay.
11.6.7 Dilute samples to desired concentration in 1X Cell Extraction Buffer PTR.
11.7 Preparation of extracts from tissue homogenates 11.7.1 Tissue lysates are typically prepared by
homogenization of tissue that is first minced and thoroughly rinsed in PBS to remove blood (dounce homogenizer recommended).
11.7.2 Homogenize 100 to 200 mg of wet tissue in 500 µL – 1 mL of chilled 1X Cell Extraction Buffer PTR. For lower amounts of tissue adjust volumes accordingly.
11.7.3 Incubate on ice for 20 minutes. 11.7.4 Centrifuge at 18,000 x g for 20 minutes at 4°C. 11.7.5 Transfer the supernatants into clean tubes and
discard the pellets. 11.7.6 Assay samples immediately or aliquot and store at
-80°C. The sample protein concentration in the extract may be quantified using a protein assay.
11.7.7 Dilute samples to desired concentration in 1X Cell Extraction Buffer PTR.

Discover more at www.abcam.com 12
ASSAY PREPARATION
12.PLATE PREPARATION The 96 well plate strips included with this kit are supplied ready to
use. It is not necessary to rinse the plate prior to adding reagents.
Unused plate strips should be immediately returned to the foil pouch containing the desiccant pack, resealed and stored at 4°C.
For each assay performed, a minimum of two wells must be used as the zero control.
For statistical reasons, we recommend each sample should be assayed with a minimum of two replicates (duplicates).
Differences in well absorbance or “edge effects” have not been observed with this assay.

Discover more at www.abcam.com 13
ASSAY PROCEDURE
13.ASSAY PROCEDURE Equilibrate all materials and prepared reagents to room
temperature prior to use. It is recommended to assay all standards, controls and
samples in duplicate.13.1 Prepare all reagents, working standards, and samples as
directed in the previous sections.13.2 Remove excess microplate strips from the plate frame,
return them to the foil pouch containing the desiccant pack, reseal and return to 4ºC storage.
13.3 Add 50 µL of all sample or standard to appropriate wells.13.4 Add 50 µL of the Antibody Cocktail to each well.13.5 Seal the plate and incubate for 1 hour at room temperature
on a plate shaker set to 400 rpm.13.6 Wash each well with 3 x 350 µL 1X Wash Buffer PT. Wash
by aspirating or decanting from wells then dispensing 350 µL 1X Wash Buffer PT into each well. Complete removal of liquid at each step is essential for good performance. After the last wash invert the plate and blot it against clean paper towels to remove excess liquid.
13.7 Add 100 µL of TMB Substrate to each well and incubate for 10 minutes in the dark on a plate shaker set to 400 rpm.
13.8 Add 100 µL of Stop Solution to each well. Shake plate on a plate shaker for 1 minute to mix. Record the OD at 450 nm. This is an endpoint reading.Alternative to 13.7 – 13.8: Instead of the endpoint reading at 450 nm, record the development of TMB Substrate kinetically. Immediately after addition of TMB Development Solution begin recording the blue color development with elapsed time in the microplate reader prepared with the following settings:

Discover more at www.abcam.com 14
ASSAY PROCEDURE
Mode: Kinetic
Wavelength: 600 nm
Time: up to 15 min
Interval: 20 sec - 1 min
Shaking: Shake between readings
Note that an endpoint reading can also be recorded at the completion of the kinetic read by adding 100 µL Stop Solution to each well and recording the OD at 450 nm.
13.9 Analyze the data as described below.

Discover more at www.abcam.com 15
DATA ANALYSIS
14.CALCULATIONS14.1 Calculate the average absorbance value for the blank control
(zero) standards. Subtract the average blank control standard absorbance value from all other absorbance values.
14.2 Create a standard curve by plotting the average blank control subtracted absorbance value for each standard concentration (y-axis) against the target protein concentration (x-axis) of the standard. Use graphing software to draw the best smooth curve through these points to construct the standard curve. Note: Most microplate reader software or graphing software will plot these values and fit a curve to the data. A four parameter curve fit (4PL) is often the best choice; however, other algorithms (e.g. linear, semi-log, log/log, 4 parameter logistic) can also be tested to determine if it provides a better curve fit to the standard values.
14.3 Determine the concentration of the target protein in the sample by interpolating the blank control subtracted absorbance values against the standard curve. Multiply the resulting value by the appropriate sample dilution factor, if used, to obtain the concentration of target protein in the sample.
14.4 Samples generating absorbance values greater than that of the highest standard should be further diluted and reanalyzed. Similarly, samples which measure at an absorbance values less than that of the lowest standard should be retested in a less dilute form.

Discover more at www.abcam.com 16
DATA ANALYSIS
15.TYPICAL DATATYPICAL STANDARD CURVE – Data provided for demonstration purposes only. A new standard curve must be generated for each assay performed.
Standard Curve Measurements
Conc. O.D. 450 nm Mean(pg/mL) 1 2 O.D.
0 0.061 0.064 0.06346.88 0.107 0.110 0.10893.75 0.157 0.154 0.156187.5 0.257 0.258 0.257375 0.468 0.455 0.462750 0.916 0.892 0.904
1,500 1.945 1.935 1.940
3,000 3.431 3.394 3.412
Figure 1. Example of mouse Gas1 standard curve diluted in Sample Diluent NS. The Gas1 standard curve was prepared as described in Section 10. Raw data values are shown in the table. Background-subtracted data values (mean +/- SD) are graphed.
Discover more at www.abcam.com 17
DATA ANALYSIS
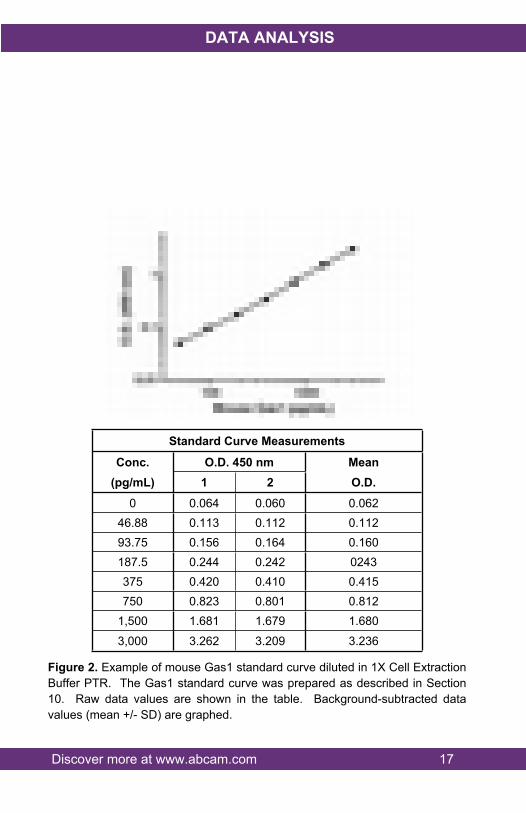
Standard Curve Measurements
Conc. O.D. 450 nm Mean(pg/mL) 1 2 O.D.
0 0.064 0.060 0.06246.88 0.113 0.112 0.11293.75 0.156 0.164 0.160187.5 0.244 0.242 0243375 0.420 0.410 0.415750 0.823 0.801 0.812
1,500 1.681 1.679 1.680
3,000 3.262 3.209 3.236
Figure 2. Example of mouse Gas1 standard curve diluted in 1X Cell Extraction Buffer PTR. The Gas1 standard curve was prepared as described in Section 10. Raw data values are shown in the table. Background-subtracted data values (mean +/- SD) are graphed.
Discover more at www.abcam.com 18
DATA ANALYSIS
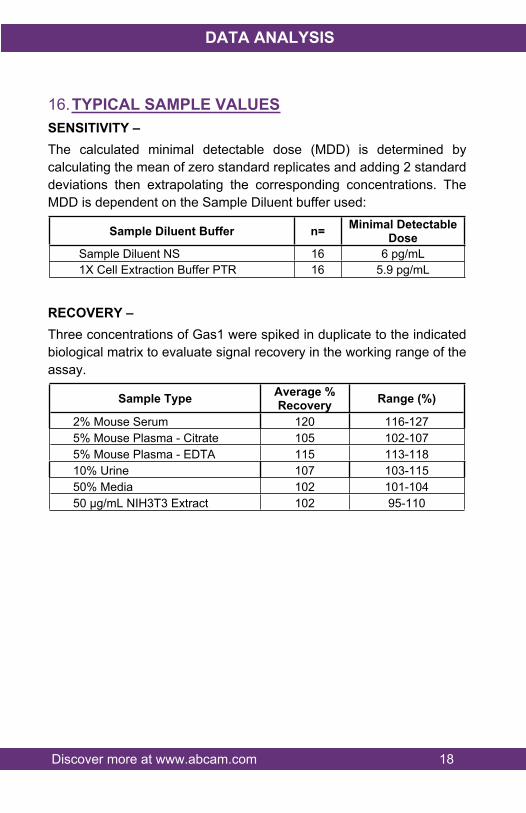
16.TYPICAL SAMPLE VALUESSENSITIVITY –The calculated minimal detectable dose (MDD) is determined by calculating the mean of zero standard replicates and adding 2 standard deviations then extrapolating the corresponding concentrations. The MDD is dependent on the Sample Diluent buffer used:
Sample Diluent Buffer n= Minimal Detectable Dose
Sample Diluent NS 16 6 pg/mL1X Cell Extraction Buffer PTR 16 5.9 pg/mL
RECOVERY – Three concentrations of Gas1 were spiked in duplicate to the indicated biological matrix to evaluate signal recovery in the working range of the assay.
Sample Type Average % Recovery Range (%)
2% Mouse Serum 120 116-1275% Mouse Plasma - Citrate 105 102-1075% Mouse Plasma - EDTA 115 113-11810% Urine 107 103-11550% Media 102 101-10450 µg/mL NIH3T3 Extract 102 95-110

Discover more at www.abcam.com 19
DATA ANALYSIS
LINEARITY OF DILUTION –
Linearity of dilution is determined based on interpolated values from the standard curve. Linearity of dilution defines a sample concentration interval in which interpolated target concentrations are directly proportional to sample dilution.Native mouse Gas1 was measured in the following biological samples in a 2-fold dilution series. Sample dilutions are made in Sample Diluent NS or 1X Cell Extraction Buffer PTR.
DilutionFactor Interpolated value
25%Mouse Serum
25%Mouse Plasma (Citrate)
50%Mouse Plasma (EDTA)
50%Mouse Urine
pg/mL 1,161 494.4 1,077 950.5Undiluted % Expected value 100 100 100 100
pg/mL 625.3 294.3 617.1 499.82 % Expected value 108 119 115 105
pg/mL 339.6 141.4 295.1 246.64 % Expected value 117 114 110 104
pg/mL 153.3 55.7 117.9 125.28 % Expected value 106 90 88 105
pg/mL 62.6 - - 57.8816 % Expected value 86 NL NL 97
DilutionFactor Interpolated value
250 µg/mL NIH3T3 Extract
250 µg/mL L929
Stimulated Extract
12.5%L929
Stimulated Supernatant
pg/mL 1,693 1,056 140.3Undiluted % Expected value 100 100 100
pg/mL 905.6 584.8 67.322 % Expected value 107 111 96
pg/mL 463.3 296.9 31.914 % Expected value 109 112 91
pg/mL 218.1 135.4 13.938 % Expected value 90 103 79
pg/mL 94.9 58.4 7.2216 % Expected value 92 89 82
NL – Non-Linear

Discover more at www.abcam.com 20
DATA ANALYSIS
PRECISION – Mean coefficient of variations of interpolated values from 3 concentrations of mouse serum within the working range of the assay.
Intra-Assay
Inter-Assay
n= 5 3CV (%) 2.6 5.9
Figure 3. Interpolated concentrations of Gas1 in mouse serum, plasma (citrate), and plasma (EDTA). The concentrations of Gas1 were measured in duplicate and interpolated from the Gas1 standard curve and corrected for sample dilution. The interpolated dilution factor corrected values are plotted (mean +/- SD, n=2). The mean Gas1 concentration was determined to be 4,798 pg/mL in mouse serum, 2,094 pg/mL in mouse plasma (Citrate), and 2,217 pg/mL in mouse plasma (EDTA).

Discover more at www.abcam.com 21
DATA ANALYSIS
Figure 4. Interpolated concentrations of Gas1 in NIH3T3 Extract and L929 Extract based on an extract load of 250 µg/mL. Extracts were prepared as described above in Section 11. The concentrations of Gas1 were measured in duplicate and interpolated from the Gas1 standard curve and corrected for sample dilution. The interpolated dilution factor corrected values are plotted (mean +/- SD, n=2). The mean Gas1 concentration was determined to be 1,724pg/mL in NIH3T3 Extract and 1,086pg/mL in L929 extract.

Discover more at www.abcam.com 22
DATA ANALYSIS
Figure 5. Comparison of secreted Gas1 in unstimulated and PMA/PHA-stimulated L929 Cells. L929 cells were grown in the absence (unstimulated) or presence of Phorbol Myristate Acetate (PMA) and phytohemagglutinin (PHA) (stimulated) for 3 days. Gas1 was measured in 2-fold diluted cell culture supernatants of unstimulated and PMA/PHA stimulated L929 and cell culture media. Measured values were interpolated from the Gas1 Standard Curve diluted in Sample Diluent NS and corrected for dilution factor. Mean of duplicate values +/-SD are graphed: 143.5 pg/mL unstimulated, 1264 pg/mL stimulated, and undetectable in media.

Discover more at www.abcam.com 23
DATA ANALYSIS
17.ASSAY SPECIFICITYThis kit recognizes both native and recombinant mouse Gas1 protein in serum, plasma, cell culture supernatant, urine, cell and tissue extract samples only.
18.SPECIES REACTIVITYThis kit recognizes mouse Gas1 protein.
Other species reactivity was determined by measuring 10- fold diluted serum samples of various species, interpolating the protein concentrations from the mouse standard curve, and expressing the interpolated concentrations as a percentage of the protein concentration in mouse serum assayed at the same dilution.
Reactivity < 3% was determined for the following species:
Human Rabbit Dog Goat Pig
Please contact our Technical Support team for more information

Discover more at www.abcam.com 24
RESOURCES
19.TROUBLESHOOTING
Problem Cause Solution
Difficulty pipetting lysate; viscous
lysate.
Genomic DNA solubilized
Prepare 1X Cell Extraction Buffer PTR (without
enhancer). Add enhancer to lysate after extraction.
Inaccurate Pipetting Check pipettes
Poor standardcurve Improper standard
dilution
Prior to opening, briefly spin the stock standard tube and
dissolve the powder thoroughly by gentle mixing
Incubation times too brief
Ensure sufficient incubation times; increase to 2 or 3 hour standard/sample incubation
Inadequate reagent volumes or improper
dilution
Check pipettes and ensure correct preparationLow Signal
Incubation times with TMB too brief
Ensure sufficient incubation time until blue color develops prior addition of Stop solution
Plate is insufficiently washed
Review manual for proper wash technique. If using a
plate washer, check all ports for obstructions.Large CV
Contaminated wash buffer Prepare fresh wash buffer
Low sensitivity Improper storage of the ELISA kit
Store your reconstituted standards at -80°C, all other
assay components 4°C. Keep TMB substrate solution
protected from light.
Precipitate in Diluent
Precipitation and/or coagulation of
components within the Diluent.
Precipitate can be removed by gently warming the
Diluent to 37ºC.

Discover more at www.abcam.com 25
RESOURCES
20.NOTES

Discover more at www.abcam.com 26
RESOURCES

RESOURCES 27
UK, EU and ROWEmail: [email protected] | Tel: +44-(0)1223-696000
AustriaEmail: [email protected] | Tel: 019-288-259
FranceEmail: [email protected] | Tel: 01-46-94-62-96 GermanyEmail: [email protected] | Tel: 030-896-779-154 SpainEmail: [email protected] | Tel: 911-146-554 SwitzerlandEmail: [email protected] Tel (Deutsch): 0435-016-424 | Tel (Français): 0615-000-530
US and Latin AmericaEmail: [email protected] | Tel: 888-77-ABCAM (22226)
CanadaEmail: [email protected] | Tel: 877-749-8807
China and Asia Pacific Email: [email protected] | Tel: 108008523689 (中國聯通) JapanEmail: [email protected] | Tel: +81-(0)3-6231-0940
www.abcam.com | www.abcam.cn | www.abcam.co.jp
Copyright © 2015 Abcam, All Rights Reserved. The Abcam logo is a registered trademark.
All information / detail is correct at time of going to print.