Embed Size (px)
Citation preview

November 2011
Oklahoma Councilof Public Affairs
Eliminating theState Income Taxin Oklahoma:An EconomicAssessment

About the Oklahoma Council of Public Affairs
Founded in 1993, the Oklahoma Council of Public Affairs
(OCPA) is an independent, nonprofit public policy organiza-
tion—a think tank—which formulates and promotes public
policy research and analysis consistent with the principles of
free enterprise and limited government.
About Arduin, Laffer and Moore Econometrics
Arduin, Laffer and Moore Econometrics is a research firm
which advises governments and private entities on economic,
fiscal, and state policies. The firm operates under the leader-
ship of acclaimed economist Wayne Winegarden; former Cali-
fornia, Florida, New York, and Michigan budget director
Donna Arduin; and the visionary “Father of Supply-Side Eco-
nomics,” Arthur Laffer.

OCPA’s speakers don’t disappoint.OCPA’s speakers don’t disappoint.
ELIMINATING THE STATE INCOME TAX IN OKLAHOMA: AN ECONOMIC ASSESSMENT • NOVEMBER 2011 1
Executive Summary
baseline scenario between 2013 and 2022.
o By 2022, personal income in Oklahoma would
be $47.4 billion, or 20.6 percent, larger than it
would be without the tax reform.
• The annual growth rate of real annual GDP in-
creasing to 2.95 percent in 2013 and accelerating
to 5.44 percent by 2022—compared to 2.03 percent
in the baseline scenario.
o By 2022, state GDP would be $53.4 billion, or 21.7
percent, larger than it would be without the tax
reform.
By 2022, the proposed tax reform would create
312,000 more jobs in Oklahoma than the number of
jobs that would be created in Oklahoma under the
baseline scenario.
Additionally, while the individual income tax cur-
rently raises more than one-third of total tax revenues
in Oklahoma, the dynamic revenue benefits created
by the accelerated economic growth recaptures
about one-half of the static revenue losses. Thus,
while appropriated revenue growth would be slower
under the proposed tax reform than it would be under
the baseline scenario, total appropriated revenues for
the state would grow over this time period.
From a theoretical perspective, the gradual elimi-
nation of the individual income tax would simulta-
neously improve two separate parts of Oklahoma’s
economic environment: (1) it would eliminate the tax
on individual income, thereby increasing the incentive
to work, produce, and save in Oklahoma; and (2) it
would reduce the overall cost of government on the
taxpayer, reinforcing the positive incentives to work,
produce, and save.
The anecdotal evidence supports the statistical
conclusions of our analysis. Those states that do not
levy an individual income tax and/or levy a lower over-
all tax and expenditure burden consistently experi-
ence greater economic growth than the nation—and
Oklahoma.
Based on both the statistical and anecdotal evidence,
it is clear that Oklahoma’s economy would soar if the
Oklahoma has the opportunity to establish itself
as America’s premier destination for economic
freedom, through a complete phaseout of the state’s
personal income tax. This would create a long-lasting
economic boom, benefiting generations to come. A
phaseout of Oklahoma’s personal income tax would
result in Oklahoma having the lowest tax burden of
any state except Alaska. Eliminating the personal in-
come tax would provide Oklahomans with approxi-
mately the following savings (based on 2010 data) in
state personal income taxes:
• Single Person, Gross Income $30,000 – Savings: $950
• Family of 4, Gross Income $50,000 – Savings: $1,373
• Family of 4, Gross Income $60,000 – Savings: $1,924
• Family of 4, Gross Income $75,000 – Savings: $2,748
• Family of 4, Gross Income $100,000 – Savings: $3,651
OCPA and Arduin, Laffer & Moore Econometrics
(ALME) have evaluated the economic impacts of a
complete phaseout of the personal income tax. The
evidence illustrates that Oklahoma could expect a
significant increase in state GDP growth, personal in-
come growth, and employment growth if the proposal
were implemented.
The reductions of waste and non-core government
spending necessary to accomplish this proposal are
not draconian by any measure—approximately $300–
$400 million, or 6 percent of current appropriations. By
gradually lowering personal income taxes, the pro-
posal does slow the total growth in appropriations
and in total tax collections. This is an outcome to be
desired, especially considering how much the
economy and state and local tax revenues would
grow if the proposal were implemented.
Based on the analysis, Oklahoma could expect the
following economic impacts with the proposed tax re-
form from 2013 through 2022 compared to a baseline
scenario:
• Oklahoma’s real annual personal income growth
increasing to 3.27 percent in 2013 and accelerating
to 5.65 percent by 2022—compared to real annual
personal income growth of 2.39 percent in the
2 ELIMINATING THE STATE INCOME TAX IN OKLAHOMA: AN ECONOMIC ASSESSMENT • NOVEMBER 2011
proposed economic plan were implemented.
It used to be the case that the sole purpose of the
tax code was to raise the necessary funds to run gov-
ernment. But in today’s world taxes play many other
roles, including redistributing income, rewarding fa-
vored industries, and punishing unfavorable behavior.
Even with the greatly expanded tax mandate, find-
ing an appropriate tax code would be relatively
straightforward if only people would stop changing
what they do when the tax code changes. The system
is like dodgeball; if only the opponent would not duck
when we threw the ball at him it would be easy to win.
But the opponent does duck, and he almost always
ducks just when we throw the ball at him.
Economics is all about incentives—ducking to
avoid being hit by the dodgeball. When a state’s eco-
nomic policies establish pro-growth economic incen-
tives, strong economic growth follows. The reverse is
true as well. Overall, Oklahoma’s economic policies
are good. According to the 2011 edition of Rich States,
Poor States: ALEC-Laffer State Economic Competi-
tiveness Index, Oklahoma ranked 14th—and that was
before the personal income tax rate was cut to 5.25
percent (effective January 1, 2012).
Oklahoma’s Achilles’ heel remains the state’s pro-
gressive personal income tax. Progressive income
taxes filled with special interest loopholes and exemp-
tions are especially bad. Progressive income taxes
produce disproportionately large distortions and rev-
enue volatility, and thereby seriously damage the
economy. The damage they cause to the economy al-
ways reduces other tax revenues.
Oklahoma can significantly increase its economic
competitiveness by phasing out its state personal in-
come tax. Before reviewing the proposal in Section II,
it is helpful to review the evidence that illustrates why
phasing out Oklahoma’s personal income tax will in-
crease economic growth in the state so significantly.
The Overall Tax Burden Matters
States that have high and/or increasing taxes rela-
tive to the nation experience relative declines in in-
come, housing values, and population as well as ris-
ing relative unemployment rates. Consistently, eco-
nomic growth rates in the states that have the highest
government tax and expenditure burdens lag the eco-
nomic growth rates in the states with the lowest gov-
ernment tax and expenditure burdens.
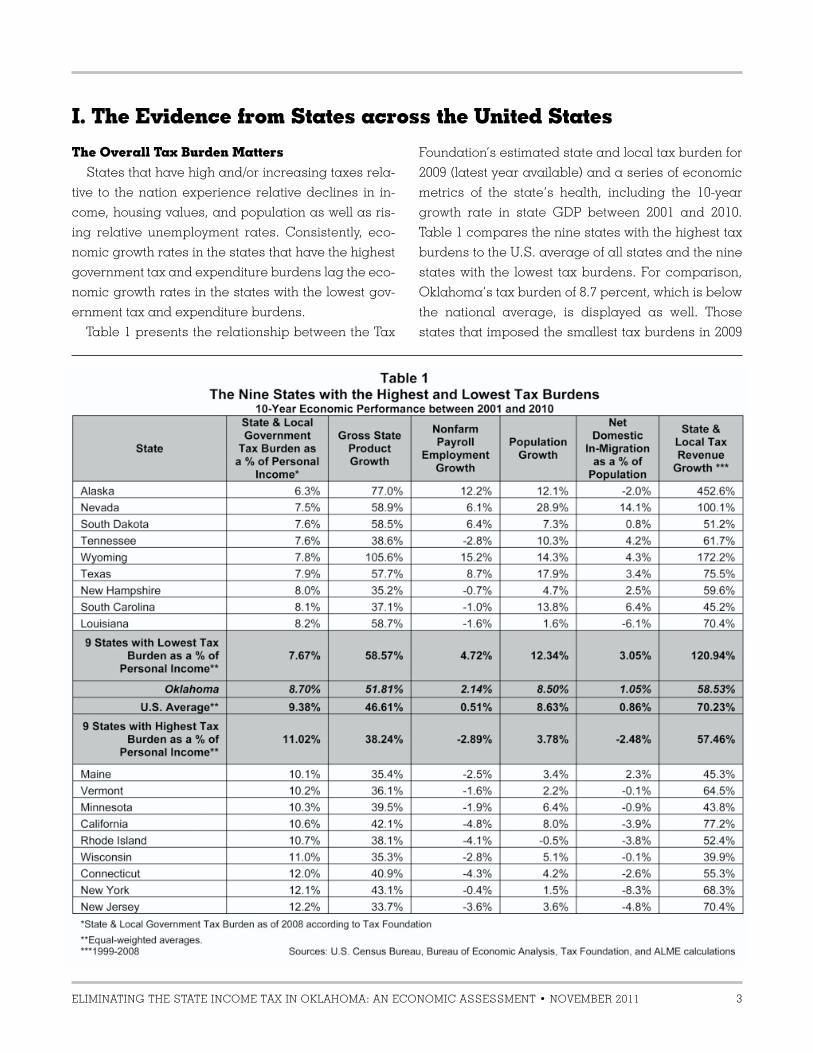
Table 1 presents the relationship between the Tax
Foundation’s estimated state and local tax burden for
2009 (latest year available) and a series of economic
metrics of the state’s health, including the 10-year
growth rate in state GDP between 2001 and 2010.
Table 1 compares the nine states with the highest tax
burdens to the U.S. average of all states and the nine
states with the lowest tax burdens. For comparison,
Oklahoma’s tax burden of 8.7 percent, which is below
the national average, is displayed as well. Those
states that imposed the smallest tax burdens in 2009
ELIMINATING THE STATE INCOME TAX IN OKLAHOMA: AN ECONOMIC ASSESSMENT • NOVEMBER 2011 3
I. The Evidence from States across the United States

state due to its below-average—albeit not in the best
group—tax burden. In this 10-year period,
Oklahoma’s Gross State Product growth, employment
growth, and net domestic in-migration (current U.S.
residents choosing to live in Oklahoma on net) well
outperformed the nation. However, population growth
lagged the nation, and neighboring Texas has a lower
overall tax burden and outperformed Oklahoma in
every category. While Oklahoma’s overall tax environ-
ment is competitive, it can do better.
The Personal Income Tax
It is not just the size of the tax burden that matters—
experienced higher rates of economic growth than
both the average state and those states that imposed
the largest tax burdens.
There are two notable generalizations in Table 1.
The first is that, on average, low-tax states signifi-
cantly outperform the highest-taxed states whether
one focuses on Gross State Product growth, employ-
ment growth, population growth, in-migration, and,
yes, even tax revenue growth. These types of differ-
ences are not achieved by chance. Taxes matter and
they matter a lot.
The second noteworthy feature of Table 1 is how
well Oklahoma has performed relative to the average
4 ELIMINATING THE STATE INCOME TAX IN OKLAHOMA: AN ECONOMIC ASSESSMENT • NOVEMBER 2011
although clearly size does matter. The manner in
which the tax burden is levied also matters. Economic
growth is stronger in states with no personal income
tax and weaker in states with the highest marginal
personal income tax rates—in good times and bad
(see Table 2). States without an income tax also ex-
hibit less economic volatility. States without a personal
income tax exhibit more tax revenue stability during
bad economic times and stronger tax revenue growth
during good economic times.
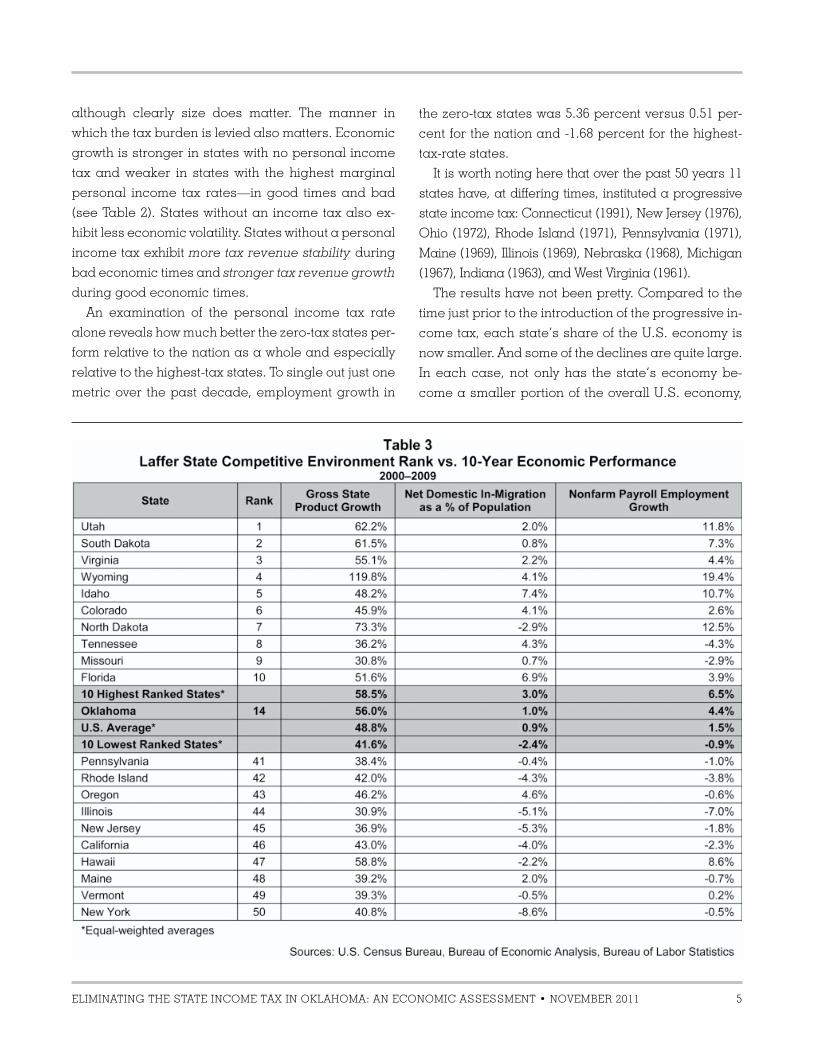
An examination of the personal income tax rate
alone reveals how much better the zero-tax states per-
form relative to the nation as a whole and especially
relative to the highest-tax states. To single out just one
metric over the past decade, employment growth in
the zero-tax states was 5.36 percent versus 0.51 per-
cent for the nation and -1.68 percent for the highest-
tax-rate states.
It is worth noting here that over the past 50 years 11
states have, at differing times, instituted a progressive
state income tax: Connecticut (1991), New Jersey (1976),
Ohio (1972), Rhode Island (1971), Pennsylvania (1971),
Maine (1969), Illinois (1969), Nebraska (1968), Michigan
(1967), Indiana (1963), and West Virginia (1961).
The results have not been pretty. Compared to the
time just prior to the introduction of the progressive in-
come tax, each state’s share of the U.S. economy is
now smaller. And some of the declines are quite large.
In each case, not only has the state’s economy be-
come a smaller portion of the overall U.S. economy,
ELIMINATING THE STATE INCOME TAX IN OKLAHOMA: AN ECONOMIC ASSESSMENT • NOVEMBER 2011 5

but also the state’s citizens have seen their prosperity
dramatically reduced, and the population of each of
these states has given their state government a big
raspberry by voting with their feet and leaving. The in-
troduction of a progressive personal income tax in
each state that has implemented it over the past 50
years has been a total failure.
Oklahoma’s 5.25 percent top marginal personal in-
come tax rate is near the national average of 5.47 per-
cent. And Oklahoma’s performance, while better than
average, is falling behind compared to the states with
no personal income tax (including Texas).
ALEC-Laffer Competitive Environment Ranking
Of course, factors other than taxes matter as well.
Table 3 accounts for those other factors that also impact
growth. Table 3 presents the latest results from the
ALEC-Laffer state competitive environment rankings.
The following 15 policy factors are included in the ALEC-
Laffer State Economic Competitiveness Index:
• Highest Marginal Personal Income Tax Rate
• Highest Marginal Corporate Income Tax Rate
• Personal Income Tax Progressivity
• Property Tax Burden
• Sales Tax Burden
• Tax Burden from All Remaining Taxes
• Estate Tax/Inheritance Tax (Yes or No)
• Recently Legislated Tax Policy Changes
• Debt Service as a Share of Tax Revenue
• Public Employees per 1,000 Residents
• Quality of State Legal System
• State Minimum Wage
• Workers’ Compensation Costs
• Right-to-Work State (Yes or No)
• Tax or Expenditure Limits
The rank is based on the above 15 state-policy vari-
ables. States that spend less (especially on income-
transfer programs), states that tax less (particularly
on productive activities such as working or investing),
and states that regulate less experience higher
growth rates than states that tax and spend more.
Based on this comprehensive measure of state eco-
nomic policies, Oklahoma ranks well, but not within
the top 10 states. And, as would be expected,
Oklahoma’s economic performance is strong, but not
within the top economic performers in the country.
6 ELIMINATING THE STATE INCOME TAX IN OKLAHOMA: AN ECONOMIC ASSESSMENT • NOVEMBER 2011
II. The Proposal
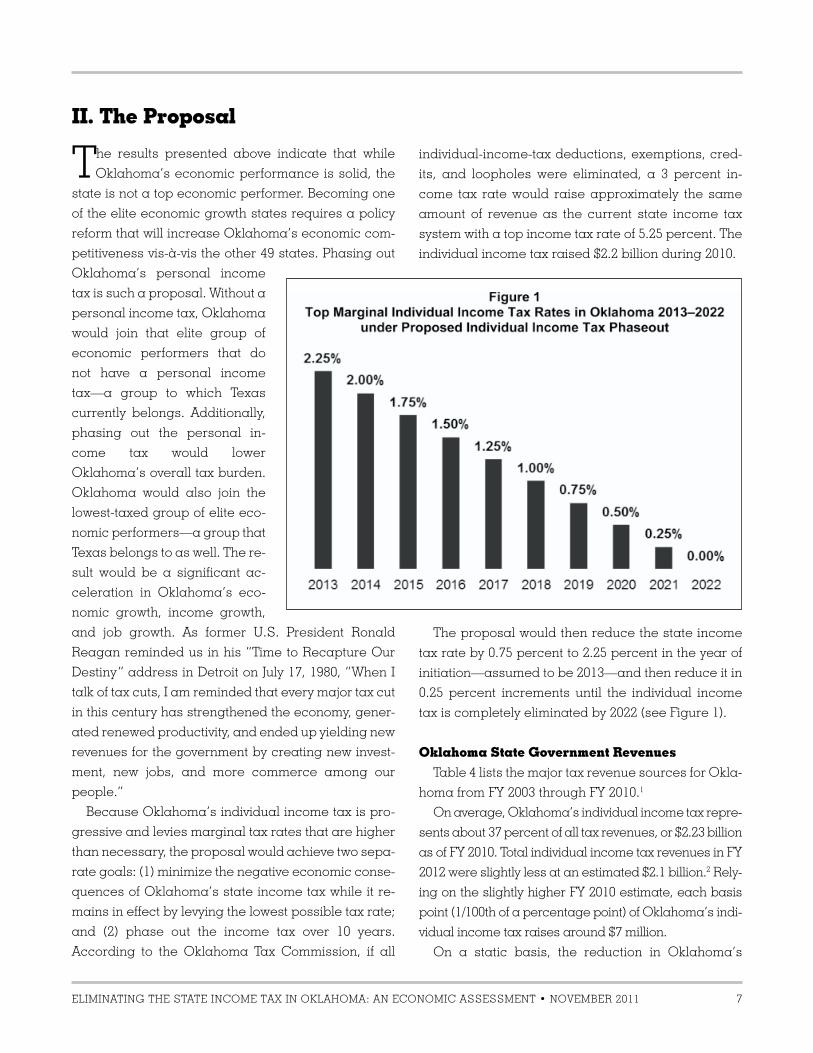
individual-income-tax deductions, exemptions, cred-
its, and loopholes were eliminated, a 3 percent in-
come tax rate would raise approximately the same
amount of revenue as the current state income tax
system with a top income tax rate of 5.25 percent. The
individual income tax raised $2.2 billion during 2010.
The proposal would then reduce the state income
tax rate by 0.75 percent to 2.25 percent in the year of
initiation—assumed to be 2013—and then reduce it in
0.25 percent increments until the individual income
tax is completely eliminated by 2022 (see Figure 1).
Oklahoma State Government Revenues
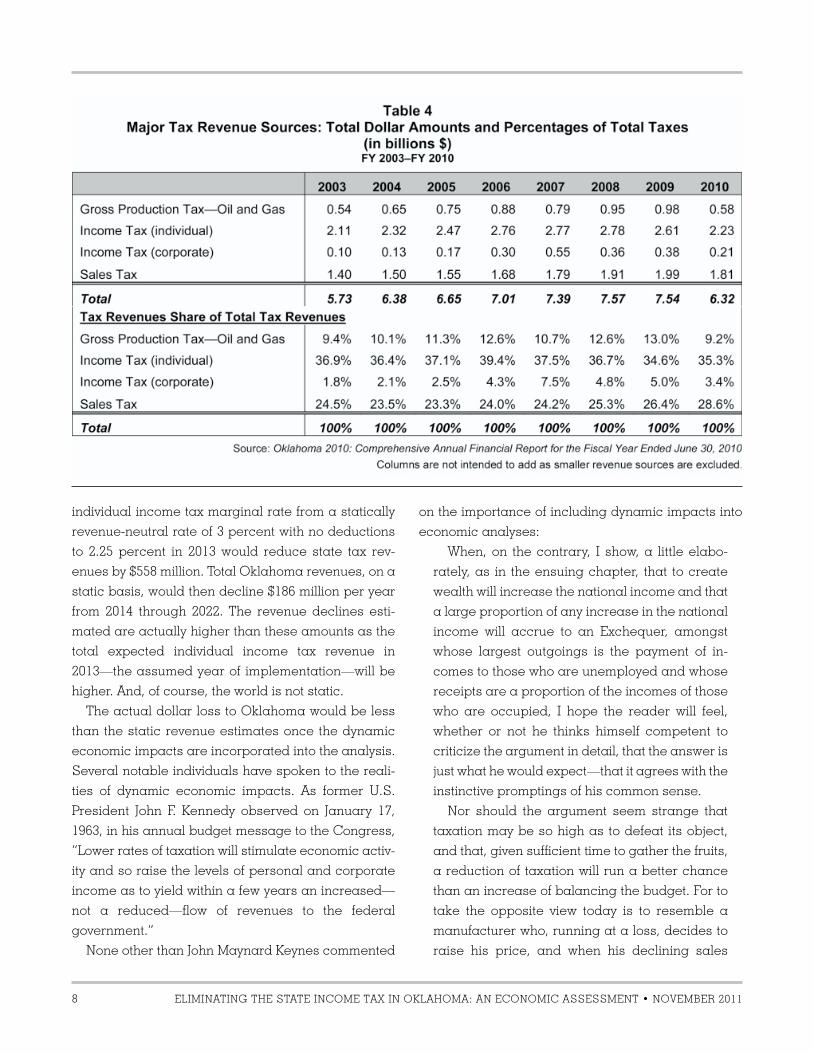
Table 4 lists the major tax revenue sources for Okla-
homa from FY 2003 through FY 2010.1
On average, Oklahoma’s individual income tax repre-
sents about 37 percent of all tax revenues, or $2.23 billion
as of FY 2010. Total individual income tax revenues in FY
2012 were slightly less at an estimated $2.1 billion.2 Rely-
ing on the slightly higher FY 2010 estimate, each basis
point (1/100th of a percentage point) of Oklahoma’s indi-
vidual income tax raises around $7 million.
On a static basis, the reduction in Oklahoma’s
ELIMINATING THE STATE INCOME TAX IN OKLAHOMA: AN ECONOMIC ASSESSMENT • NOVEMBER 2011 7
The results presented above indicate that while
Oklahoma’s economic performance is solid, the
state is not a top economic performer. Becoming one
of the elite economic growth states requires a policy
reform that will increase Oklahoma’s economic com-
petitiveness vis-à-vis the other 49 states. Phasing out
Oklahoma’s personal income
tax is such a proposal. Without a
personal income tax, Oklahoma
would join that elite group of
economic performers that do
not have a personal income
tax—a group to which Texas
currently belongs. Additionally,
phasing out the personal in-
come tax would lower
Oklahoma’s overall tax burden.
Oklahoma would also join the
lowest-taxed group of elite eco-
nomic performers—a group that
Texas belongs to as well. The re-
sult would be a significant ac-
celeration in Oklahoma’s eco-
nomic growth, income growth,
and job growth. As former U.S. President Ronald
Reagan reminded us in his “Time to Recapture Our
Destiny” address in Detroit on July 17, 1980, “When I
talk of tax cuts, I am reminded that every major tax cut
in this century has strengthened the economy, gener-
ated renewed productivity, and ended up yielding new
revenues for the government by creating new invest-
ment, new jobs, and more commerce among our
people.”
Because Oklahoma’s individual income tax is pro-
gressive and levies marginal tax rates that are higher
than necessary, the proposal would achieve two sepa-
rate goals: (1) minimize the negative economic conse-
quences of Oklahoma’s state income tax while it re-
mains in effect by levying the lowest possible tax rate;
and (2) phase out the income tax over 10 years.
According to the Oklahoma Tax Commission, if all
individual income tax marginal rate from a statically
revenue-neutral rate of 3 percent with no deductions
to 2.25 percent in 2013 would reduce state tax rev-
enues by $558 million. Total Oklahoma revenues, on a
static basis, would then decline $186 million per year
from 2014 through 2022. The revenue declines esti-
mated are actually higher than these amounts as the
total expected individual income tax revenue in
2013—the assumed year of implementation—will be
higher. And, of course, the world is not static.
The actual dollar loss to Oklahoma would be less
than the static revenue estimates once the dynamic
economic impacts are incorporated into the analysis.
Several notable individuals have spoken to the reali-
ties of dynamic economic impacts. As former U.S.
President John F. Kennedy observed on January 17,
1963, in his annual budget message to the Congress,
“Lower rates of taxation will stimulate economic activ-
ity and so raise the levels of personal and corporate
income as to yield within a few years an increased—
not a reduced—flow of revenues to the federal
government.”
None other than John Maynard Keynes commented
on the importance of including dynamic impacts into
economic analyses:
When, on the contrary, I show, a little elabo-
rately, as in the ensuing chapter, that to create
wealth will increase the national income and that
a large proportion of any increase in the national
income will accrue to an Exchequer, amongst
whose largest outgoings is the payment of in-
comes to those who are unemployed and whose
receipts are a proportion of the incomes of those
who are occupied, I hope the reader will feel,
whether or not he thinks himself competent to
criticize the argument in detail, that the answer is
just what he would expect—that it agrees with the
instinctive promptings of his common sense.
Nor should the argument seem strange that
taxation may be so high as to defeat its object,
and that, given sufficient time to gather the fruits,
a reduction of taxation will run a better chance
than an increase of balancing the budget. For to
take the opposite view today is to resemble a
manufacturer who, running at a loss, decides to
raise his price, and when his declining sales
8 ELIMINATING THE STATE INCOME TAX IN OKLAHOMA: AN ECONOMIC ASSESSMENT • NOVEMBER 2011

increase the loss, wrapping himself in the recti-
tude of plain arithmetic, decides that prudence
requires him to raise the price still more—and
who, when at last his account is balanced with
nought on both sides, is still found righteously
declaring that it would have been the act of a
gambler to reduce the price when you were al-
ready making a loss.3
The basic idea behind the relationship between tax
rates and tax revenues is that changes in tax rates
have two effects on revenues: the arith-
metic effect and the economic effect.
• The arithmetic effect simply states that if
tax rates are lowered, tax revenues per
dollar of tax base will be lowered by the
amount of the decrease in the rate. And
the reverse is true for an increase in tax
rates.
• The economic effect recognizes the
positive impact that lower tax rates
have on work, output, and employment
and thereby the tax base by providing
incentives to increase these activities.
Raising tax rates has the opposite eco-
nomic effect by penalizing participation
in the taxed activities.
The arithmetic effect always works in the
opposite direction from the economic effect. There-
fore, when the economic and the arithmetic effects of
tax-rate changes are combined, the consequences of
the change in tax rates on total tax revenues are no
longer quite so obvious.
Figure 2 is a graphic illustration of this concept as
illustrated by the Laffer Curve. At a tax rate of 0 per-
cent, the government would collect no tax revenues,
no matter how large the tax base. Likewise, at a tax
rate of 100 percent, the government would also collect
no tax revenues because no one would be willing to
work for an after-tax wage of zero—there would be no
tax base. Between these two extremes, there are two
tax rates that will collect the same amount of revenue:
a high tax rate on a small tax base and a low tax rate
on a large tax base.
The Laffer Curve itself does not say whether a tax
cut will raise or lower revenues. Revenue responses to
a tax-rate change will depend upon the tax system in
place, the time period being considered, the ease of
moving into untaxed activities, the level of tax rates al-
ready in place, the prevalence of legal and account-
ing-driven tax loopholes, and the proclivities of the
productive factors. If the existing tax rate is too high—
in the “prohibitive range” shown below—then a tax-
rate cut would result in increased tax revenues. The
economic effect of the tax cut would outweigh the
arithmetic effect of the tax cut.
Oklahoma has demonstrated the dynamic effects
of tax cuts. For example, prior to personal income tax
cuts beginning in FY-2005, the annual state sales tax
growth rate was 2.7 percent for the preceding four
years. Once the personal income tax cuts began in
FY-2005, annual sales tax growth for the following five
years was 6.6 percent. It is important to note that, ac-
cording to the 2005 Oklahoma Senate session sum-
mary, 2005 session tax cuts were estimated to have a
static loss of $150.8 million in FY-2007. Despite this esti-
mate, individual income tax collections grew by more
than $305 million, and state sales tax collections grew
by more than $243 million.
In the case of the proposal in Oklahoma, the
ELIMINATING THE STATE INCOME TAX IN OKLAHOMA: AN ECONOMIC ASSESSMENT • NOVEMBER 2011 9
economic effects would reduce the static revenue loss
of the arithmetic effect, although not completely. Con-
sequently, the proposed tax reform needs to be imple-
mented with requisite spending restraint. By
rightsizing Oklahoma’s government, however, the
spending restraint would further enhance the growth
benefits to Oklahoma’s economy. These benefits are
examined in the next section.
Projected Economic Benefits
To empirically examine the poten-
tial economic benefit from the
gradual phaseout of Oklahoma’s in-
dividual income tax, we employed a
pooled regression analysis, de-
tailed in the appendix to this paper.
The purpose of the tax reform
proposal is to accelerate economic
activity in the state. Based on the an-
ecdotal evidence presented in the
previous section, Oklahoma should
expect higher state GDP growth,
higher income growth, and higher
employment growth. The economet-
ric estimates illustrated in the ap-
pendix provide further support. The
coefficients (column 2, Table A1) for
both the PIT and EXP variables are
both negative and highly significant.
Consequently, accelerated per-
sonal income growth should result
through both the lowering (and
eventual elimination) of Oklahoma’s
individual income tax rate and the
reduction in the total government
expenditure burden. Based on the
close relationship between income
growth and state GDP growth and
employment growth, the impacts on
state GDP and employment can
also be estimated.
To get a sense of how much
Oklahoma’s economy would benefit
10 ELIMINATING THE STATE INCOME TAX IN OKLAHOMA: AN ECONOMIC ASSESSMENT • NOVEMBER 2011
from the proposal, we examined the impact from the
proposed tax reform on total income, state GDP, and
employment from 2013 through 2022 compared to a
baseline economic projection over this same time pe-
riod. The baseline economic projection is based on
the following assumptions:
• Population growth remains at its 10-year average
growth rate of 0.9 percent per year;
• The total top personal income tax rate in Oklahoma
ELIMINATING THE STATE INCOME TAX IN OKLAHOMA: AN ECONOMIC ASSESSMENT • NOVEMBER 2011 11
(including all federal taxes and the deductibility of
state taxes from federal taxes) is 41.3 percent;
• The total state and local expenditure burden in
Oklahoma remains at its 2008 level of 19.8 percent;
and
• Inflation is estimated to be 2.3 percent per year, or
the average annual inflation between 2001 and 2010.
Based on these assumptions, and using the coeffi-
cients estimated in Table A1, Oklahoma’s real annual
personal income growth in the baseline scenario is
estimated to be 2.39 percent between 2013 and 2022.
Based on the relationship between personal income
growth and state GDP growth in Oklahoma between
1980 and 2010, real annual GDP growth is estimated
to be 2.03 percent between
2013 and 2022. Under the pro-
posed tax reform, real annual
personal income growth in-
creases to 3.27 percent in 2013
and accelerates up to 5.65
percent by 2022. Real annual
GDP growth is similarly stron-
ger, jumping to 2.95 percent in
2013 and accelerating up to
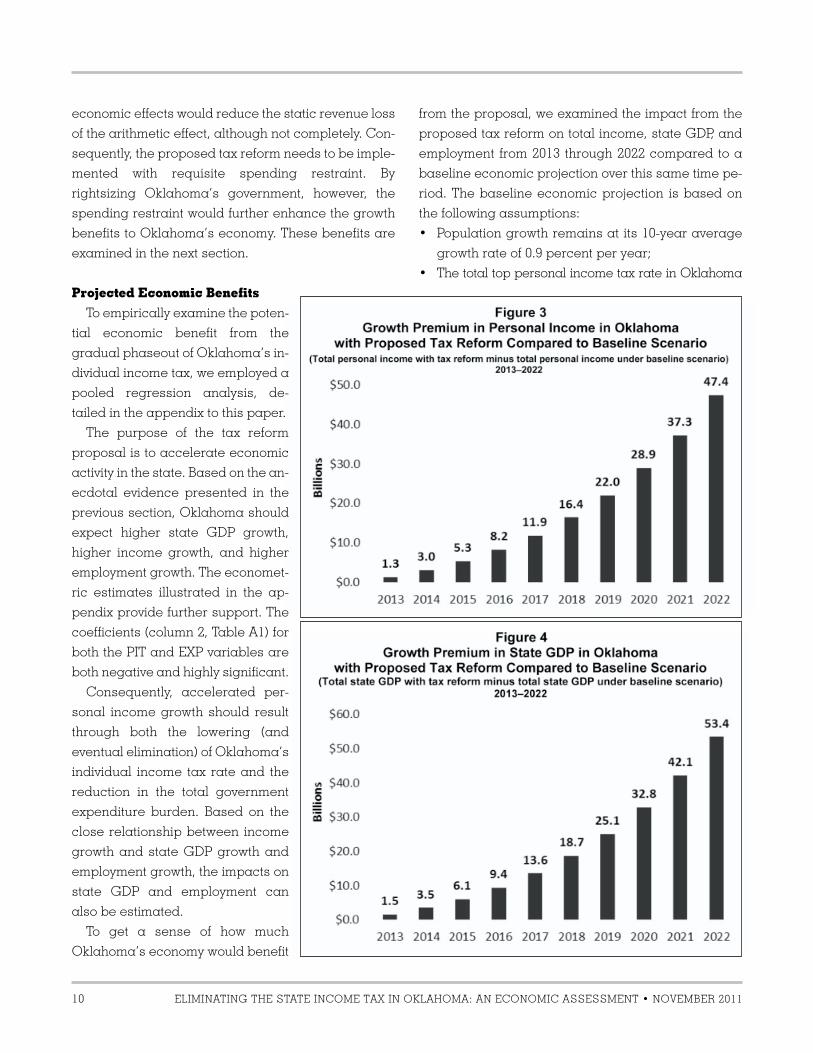
5.44 percent by 2022. Figures 3
and 4 (see page 10) illustrate
how much larger both income
and state GDP could be in
Oklahoma if the proposed tax
reform were implemented. By
2022, personal income in
Oklahoma would be $47.4 bil-
lion, or 20.6 percent, larger
than it would be without the tax
reform, and state GDP would
be $53.4 billion, or 21.7 per-
cent, larger than it would be
without the tax reform.
The growth in income and
state GDP would also benefit
overall employment in Okla-
homa. Output per worker in
Oklahoma grew at an average
rate of 2½ percent per year
between 2001 and 2010. Pro-
jecting the growth rate in out-
put per worker for the 2013
through 2022 period and ap-
plying the projected output
per worker to the total output
12 ELIMINATING THE STATE INCOME TAX IN OKLAHOMA: AN ECONOMIC ASSESSMENT • NOVEMBER 2011
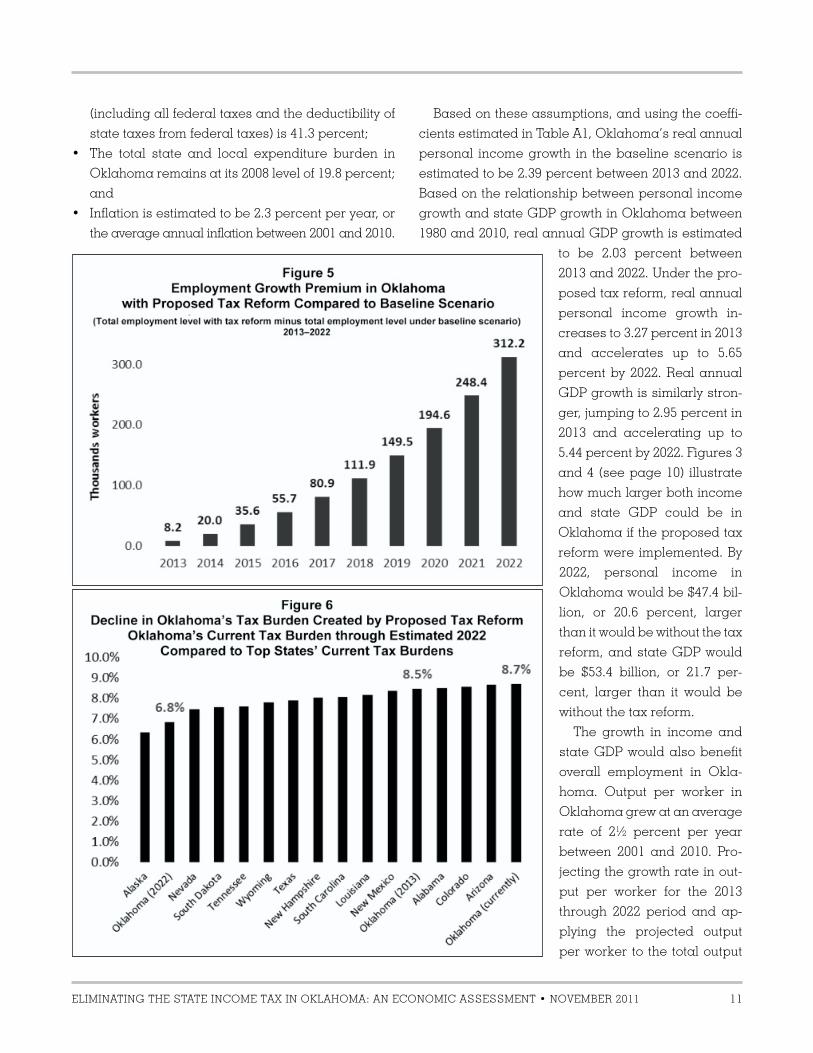
(state GDP) under the tax reform and baseline sce-
narios reveals that by 2022 the proposed tax reform
would create 312,000 more jobs in Oklahoma than the
number of jobs that would be created in Oklahoma
under the baseline scenario (see Figure 5).
The proposed tax reform would also reduce
Oklahoma’s overall tax burden from 8.7 percent of
personal income currently (as estimated by the Tax
Foundation) down to an estimated 6.8 percent by 2022
(see Figure 6). Compared to the current tax burdens
across all 50 states, a tax burden of 6.8 percent would
be the second smallest tax burden in the country, with
only Alaska having a lower tax burden.
The proposed tax reform, consequently, would have a
significant and positive impact on Oklahoma’s economy.
The rate of income growth, state GDP growth, and em-
ployment growth would all accelerate each year.
While the benefits quantified above end at 2022, the
benefits to Oklahoma’s economy would continue as
the accelerated rate of economic growth continued.
Projected Impacts on State Revenues
These accelerated economic benefits would also
increase the tax revenues Oklahoma receives from
the state sales tax, the state corporate income tax, the
state excise taxes, and the other state tax revenue
sources that grow naturally when Oklahoma’s
economy grows. These dynamic state tax revenue
benefits would offset about one-half of the static
revenue losses created by the elimination of the state
individual income tax. Importantly, due to these
dynamic benefits, total tax revenues received by
Oklahoma would grow over the 2013 through 2022 pe-
riod—they would just not grow as quickly as they
would under the baseline scenario.
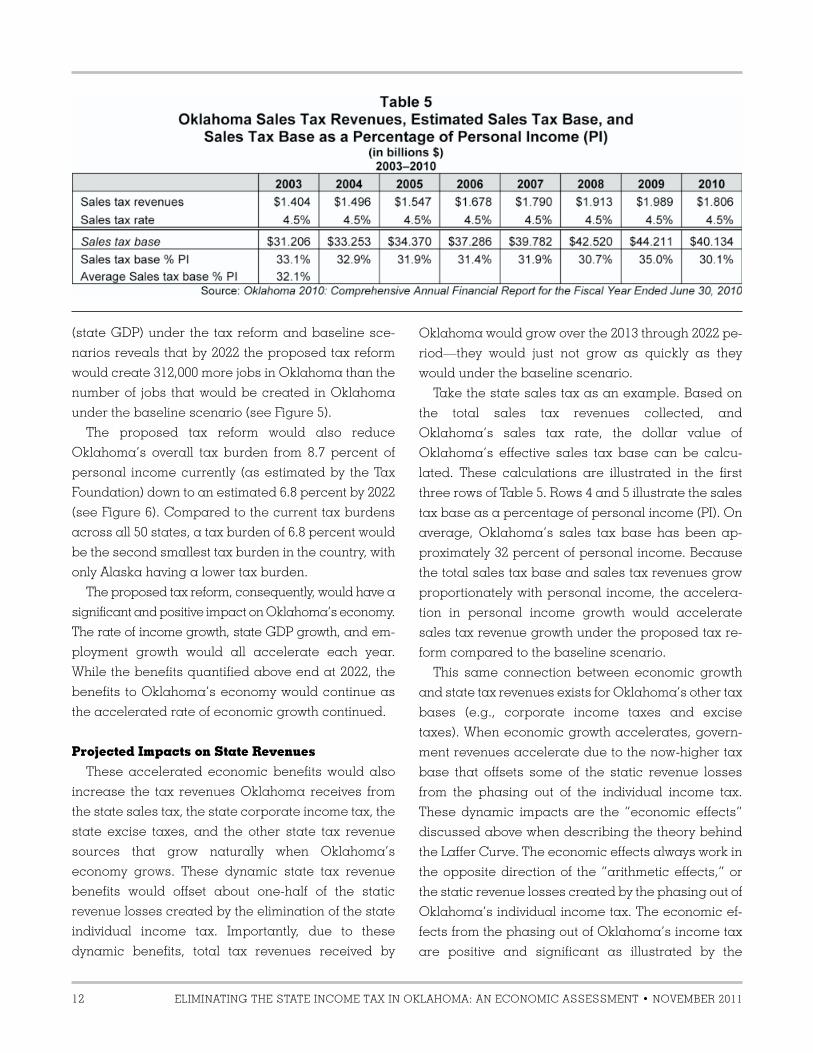
Take the state sales tax as an example. Based on
the total sales tax revenues collected, and
Oklahoma’s sales tax rate, the dollar value of
Oklahoma’s effective sales tax base can be calcu-
lated. These calculations are illustrated in the first
three rows of Table 5. Rows 4 and 5 illustrate the sales
tax base as a percentage of personal income (PI). On
average, Oklahoma’s sales tax base has been ap-
proximately 32 percent of personal income. Because
the total sales tax base and sales tax revenues grow
proportionately with personal income, the accelera-
tion in personal income growth would accelerate
sales tax revenue growth under the proposed tax re-
form compared to the baseline scenario.
This same connection between economic growth
and state tax revenues exists for Oklahoma’s other tax
bases (e.g., corporate income taxes and excise
taxes). When economic growth accelerates, govern-
ment revenues accelerate due to the now-higher tax
base that offsets some of the static revenue losses
from the phasing out of the individual income tax.
These dynamic impacts are the “economic effects”
discussed above when describing the theory behind
the Laffer Curve. The economic effects always work in
the opposite direction of the “arithmetic effects,” or
the static revenue losses created by the phasing out of
Oklahoma’s individual income tax. The economic ef-
fects from the phasing out of Oklahoma’s income tax
are positive and significant as illustrated by the
ELIMINATING THE STATE INCOME TAX IN OKLAHOMA: AN ECONOMIC ASSESSMENT • NOVEMBER 2011 13
econometric results in the appendix. The Oklahoma
state government’s revenue losses would, conse-
quently, be much smaller than the static revenue
losses would indicate.
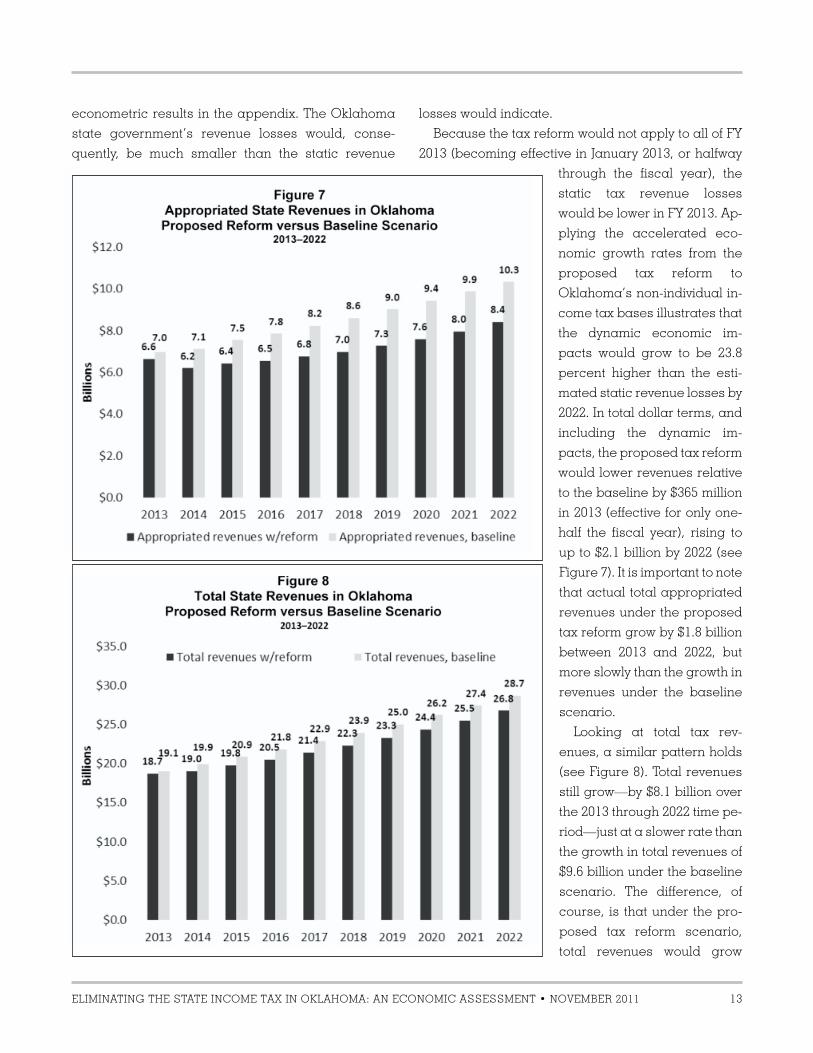
Because the tax reform would not apply to all of FY
2013 (becoming effective in January 2013, or halfway
through the fiscal year), the
static tax revenue losses
would be lower in FY 2013. Ap-
plying the accelerated eco-
nomic growth rates from the
proposed tax reform to
Oklahoma’s non-individual in-
come tax bases illustrates that
the dynamic economic im-
pacts would grow to be 23.8
percent higher than the esti-
mated static revenue losses by
2022. In total dollar terms, and
including the dynamic im-
pacts, the proposed tax reform
would lower revenues relative
to the baseline by $365 million
in 2013 (effective for only one-
half the fiscal year), rising to
up to $2.1 billion by 2022 (see
Figure 7). It is important to note
that actual total appropriated
revenues under the proposed
tax reform grow by $1.8 billion
between 2013 and 2022, but
more slowly than the growth in
revenues under the baseline
scenario.
Looking at total tax rev-
enues, a similar pattern holds
(see Figure 8). Total revenues
still grow—by $8.1 billion over
the 2013 through 2022 time pe-
riod—just at a slower rate than
the growth in total revenues of
$9.6 billion under the baseline
scenario. The difference, of
course, is that under the pro-
posed tax reform scenario,
total revenues would grow
14 ELIMINATING THE STATE INCOME TAX IN OKLAHOMA: AN ECONOMIC ASSESSMENT • NOVEMBER 2011
robustly because the economy would be growing
more strongly, as opposed to the government appro-
priating a larger share of a smaller economy.
And the effects measured here still understate the
total impact on Oklahoma’s budget because the ac-
celerated economic growth would reduce the need
for government expenditures
on Medicaid and other in-
come-support programs. Less
government spending would
be necessary if the proposed
tax reform were implemented
compared to the baseline sce-
nario. (These impacts are not
included in Figure 7 above.)
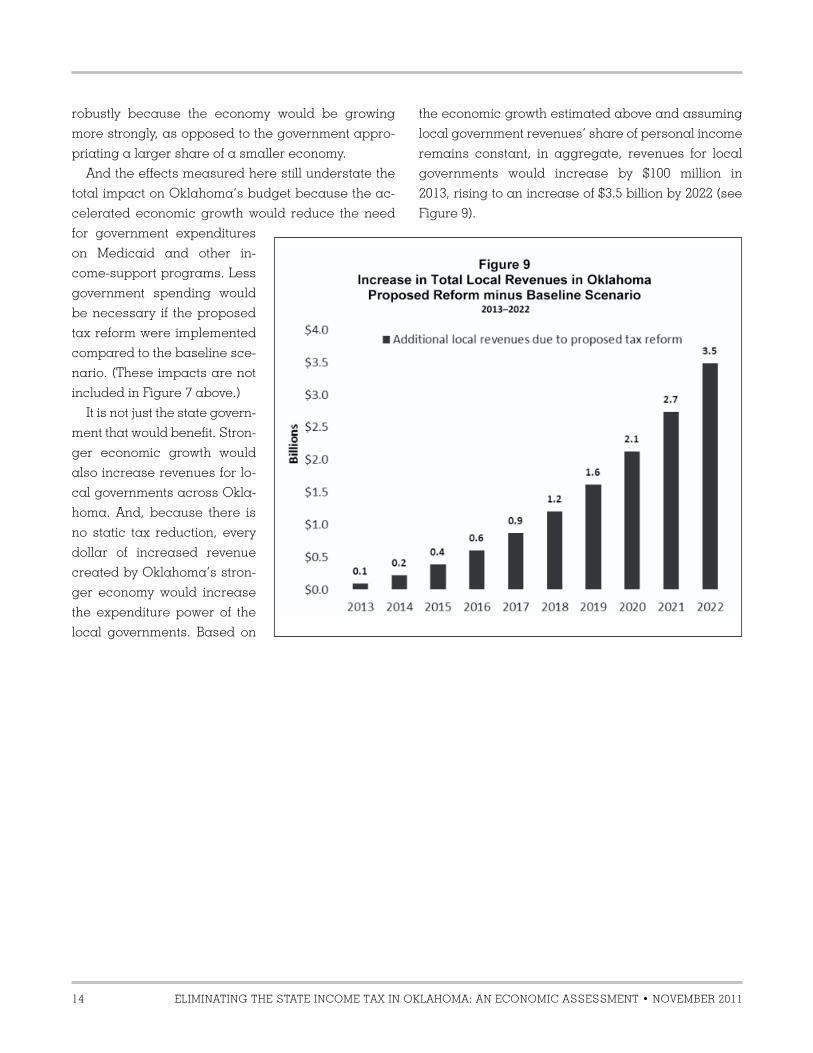
It is not just the state govern-
ment that would benefit. Stron-
ger economic growth would
also increase revenues for lo-
cal governments across Okla-
homa. And, because there is
no static tax reduction, every
dollar of increased revenue
created by Oklahoma’s stron-
ger economy would increase
the expenditure power of the
local governments. Based on
the economic growth estimated above and assuming
local government revenues’ share of personal income
remains constant, in aggregate, revenues for local
governments would increase by $100 million in
2013, rising to an increase of $3.5 billion by 2022 (see
Figure 9).
ELIMINATING THE STATE INCOME TAX IN OKLAHOMA: AN ECONOMIC ASSESSMENT • NOVEMBER 2011 15
Conclusion
Oklahoma’s economic policies are quite good.
There is room for improvement, however. Okla-
homa can increase its rate of economic growth, in-
come growth, and job growth by adopting reforms
that transform Oklahoma’s currently competitive eco-
nomic policy environment into a top-tier economic
policy environment. The proposal to phase out
Oklahoma’s current individual income tax would
achieve this goal.
Under the proposal, the current tax system with a
top individual income tax rate of 5.25 percent would
be converted to a revenue-neutral 3.0 percent by
eliminating all individual-income-tax exemptions, de-
ductions, and credits. The tax rate would then be
phased down to 0 percent by 2022.
The gradual elimination of the individual income
tax would simultaneously improve two separate parts
of Oklahoma’s economic environment: (1) it would
eliminate the tax on individual income, thereby in-
creasing the incentive to work, produce, and save in
Oklahoma; and (2) it would reduce the overall cost of
government on the taxpayer, reinforcing the positive
incentives to work, produce, and save in the state. Due
to the greater economic incentives directly attribut-
able to the tax reform, the total revenue losses to the
state would not be as large as static revenue esti-
mates would indicate.
This study illustrates that, based on both anecdotal
and statistical evidence, Oklahoma could expect a
significant increase in economic activity following the
proposed tax reform. Anecdotally, those states that do
not levy an individual income tax and/or levy a lower
overall tax and expenditure burden consistently experi-
ence greater economic growth than the nation—and
Oklahoma. Our statistical analysis confirmed this result.
Based on this evidence, it is clear that Oklahoma’s
economy would soar if the proposed economic plan
were implemented. Oklahoma has the opportunity to
establish itself as the premier destination for eco-
nomic freedom, through a complete phaseout of the
state’s personal income tax. This would be a historic
choice for Oklahoma, one that would create an endur-
ing economic boom benefiting generations to come.
16 ELIMINATING THE STATE INCOME TAX IN OKLAHOMA: AN ECONOMIC ASSESSMENT • NOVEMBER 2011
Appendix
Pooled regression analyses are based on the use
of panel data, a combination of time series and
cross-sectional data. There are a couple of reasons
why we chose to use pooled regression techniques.
The first reason is that with the use of panel data, one
can better get a feel for the effects that typically can-
not be observed using time series or cross-sectional
data alone. Additionally, pooled regressions using
panel data allow us to understand complicated be-
havioral models, such as the behavior of an economy
in response to both the size of the tax burden as well
as the top marginal individual income tax rate.
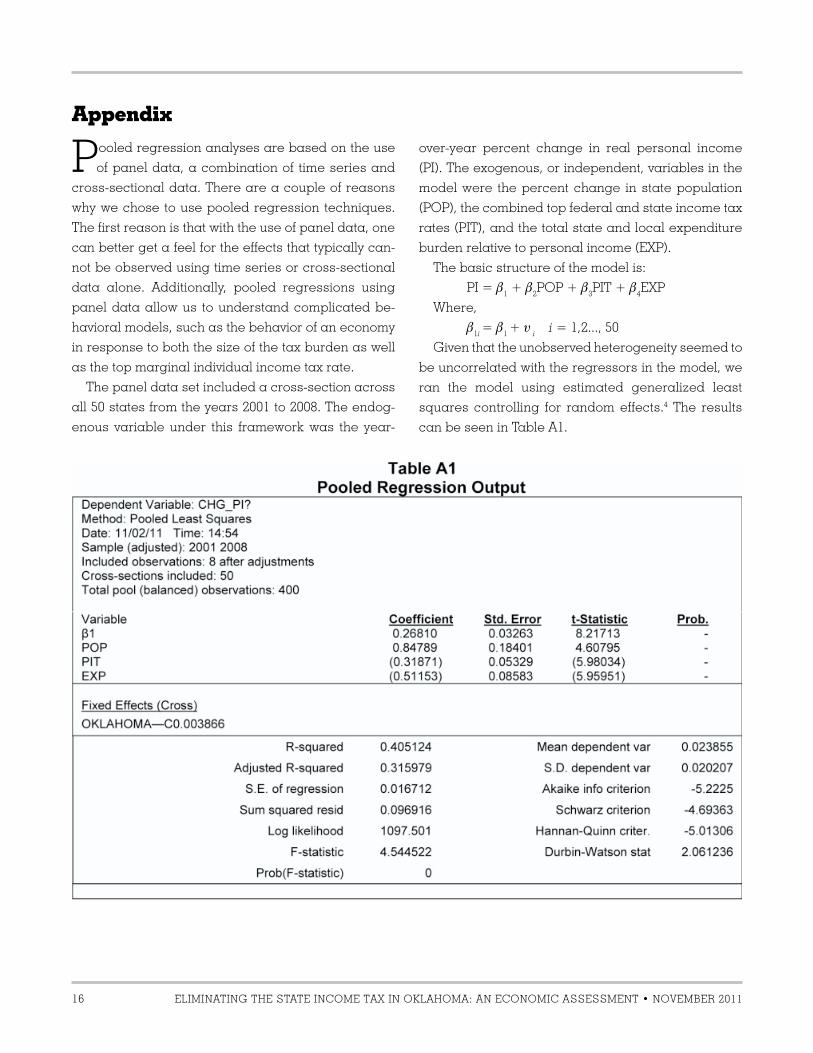
The panel data set included a cross-section across
all 50 states from the years 2001 to 2008. The endog-
enous variable under this framework was the year-
over-year percent change in real personal income
(PI). The exogenous, or independent, variables in the
model were the percent change in state population
(POP), the combined top federal and state income tax
rates (PIT), and the total state and local expenditure
burden relative to personal income (EXP).
The basic structure of the model is:
PI = β1 + β
2POP + β
3PIT + β
4EXP
Where,
β1i
= β1 + υ
i i = 1,2..., 50
Given that the unobserved heterogeneity seemed to
be uncorrelated with the regressors in the model, we
ran the model using estimated generalized least
squares controlling for random effects.4 The results
can be seen in Table A1.

Endnotes
1 Governor Brad Henry, Oklahoma 2010: Comprehensive Annual
Financial Report for the Fiscal Year Ended June 30, 2010 (Office of
State Finance, December 30); http://www.ok.gov/OSF/documents/
cafr10.pdf.
2 Shelly Paulk, “State Budget Outlook: Multi-Year Trend Analysis”
(Office of State Finance, January 5, 2011); http://www.ok.gov/OSF/
Budget/State_Budget_Outlook.html.
3 John Maynard Keynes, The Collected Writings of John Maynard
Keynes (London: Macmillan, 1972).
4 A Hausman Test was conducted with a Chi-Square statistic being
equal to zero. As such, there was a failure to reject the null hypoth-
esis suggesting that a random effects model is appropriate.

Oklahoma Council of Public Affairs
1401 N. Lincoln Blvd.
Oklahoma City, OK 73104
Tel: 405.602.1667
Fax: 405.602.1238
ocpathink.org
Arduin, Laffer and Moore Econometrics205 South Adam Street
Tallahassee, FL 32301
Tel: 850-205-8020
arduinlaffermoore.com