Embed Size (px)
Citation preview
Eliminating EV Range Anxiety,Predicting Personalized Fuel Economy, and Enabling Vehicle-Grid Integration
Samveg Saxena, Ph.D
November 19, 2014
v2gsim.lbl.gov | powertrains.lbl.gov
MyGreenCarV2G‐Sim
Samveg Saxenav2gsim.lbl.gov
November 19, 2014 2Eliminating EV range anxiety,
Predicting personalized fuel economy,Enabling vehicle-grid integration
V2G-Sim | MyGreenCar
Charging Ahead onClean Transportation
Vehicles account for ~¼ of global GHG emissions Substantial urban pollutants from tailpipe emissions
Transportation electrification is needed soon, at large scale to meet climate goals, but many obstacles: Range anxiety, available charging infrastructure, cost, etc.
If not electrification, at least needmarked increases in fuel economy
MyGreenCar
Samveg Saxenav2gsim.lbl.gov
November 19, 2014 3Eliminating EV range anxiety,
Predicting personalized fuel economy,Enabling vehicle-grid integration
V2G-Sim | MyGreenCar
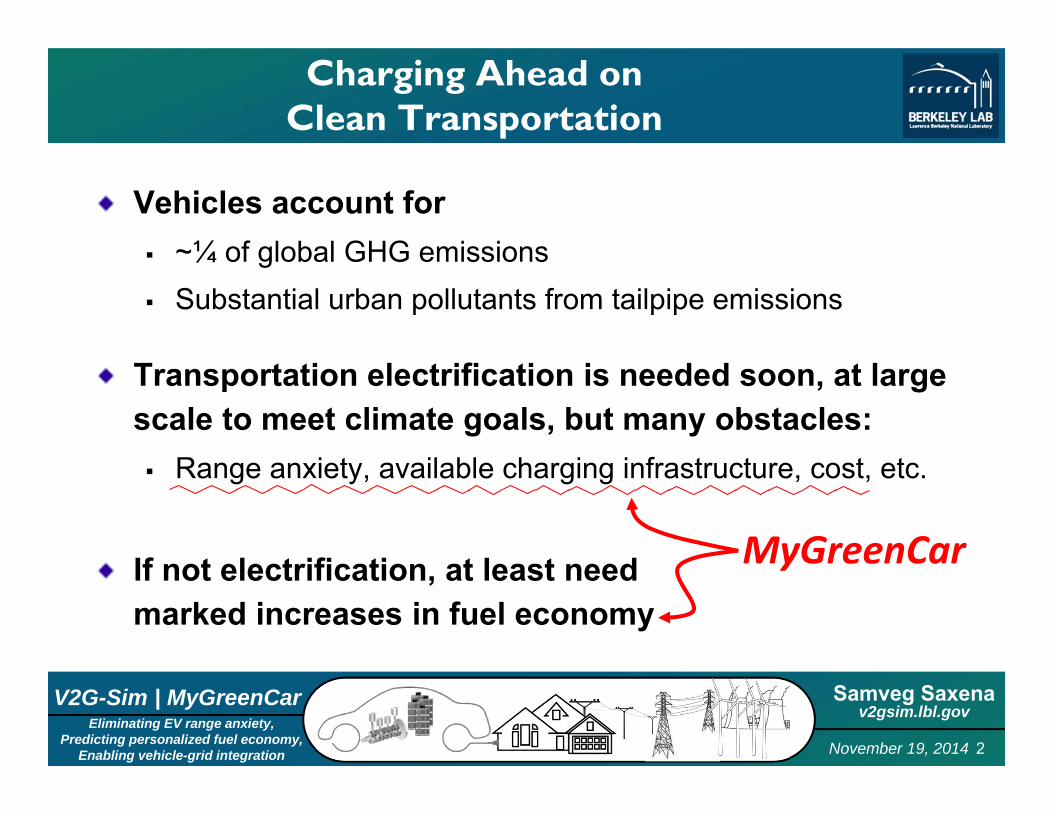
V2G-Sim: Understanding how cleantransport enables a clean grid
If ¼ US vehicles were PHEVs= Grid storage for >1 hour of full US grid operations (~1,000 GWh) Grid storage becomes a side-effect of deploying clean transportation Enables substantial renewables integration… Clean transportation enables clean grid Many coupled variables, each with large uncertainties…
VehiclePowertrain
Models
ChargingModels
Automateddrive-cycleGenerationAutomated
TravelPattern
Generationfor each PEV
Responseto managed
charging/V2G
User inputs(fleet usagestatistics,i.e. NHTS)
Aggregatebi-directionalcharging of
each vehicle
Grid-scaleimpacts &
opportunitiesfrom PEVs
DetailedBattery Models
BatteryDegradation
Models
1
2
3a
3b
4a
4b
5a
5b
6
V2G-Sim models the driving and charging behavior of individual PEVs to generate
temporal and spatial grid-scale impact/opportunity predictions
Individual PEV driving/charging/V2G profile
PEV 1 PEV 2 PEV N
Grid‐scale impacts
V2G‐Sim
Samveg Saxenav2gsim.lbl.gov
November 19, 2014 4Eliminating EV range anxiety,
Predicting personalized fuel economy,Enabling vehicle-grid integration
V2G-Sim | MyGreenCar
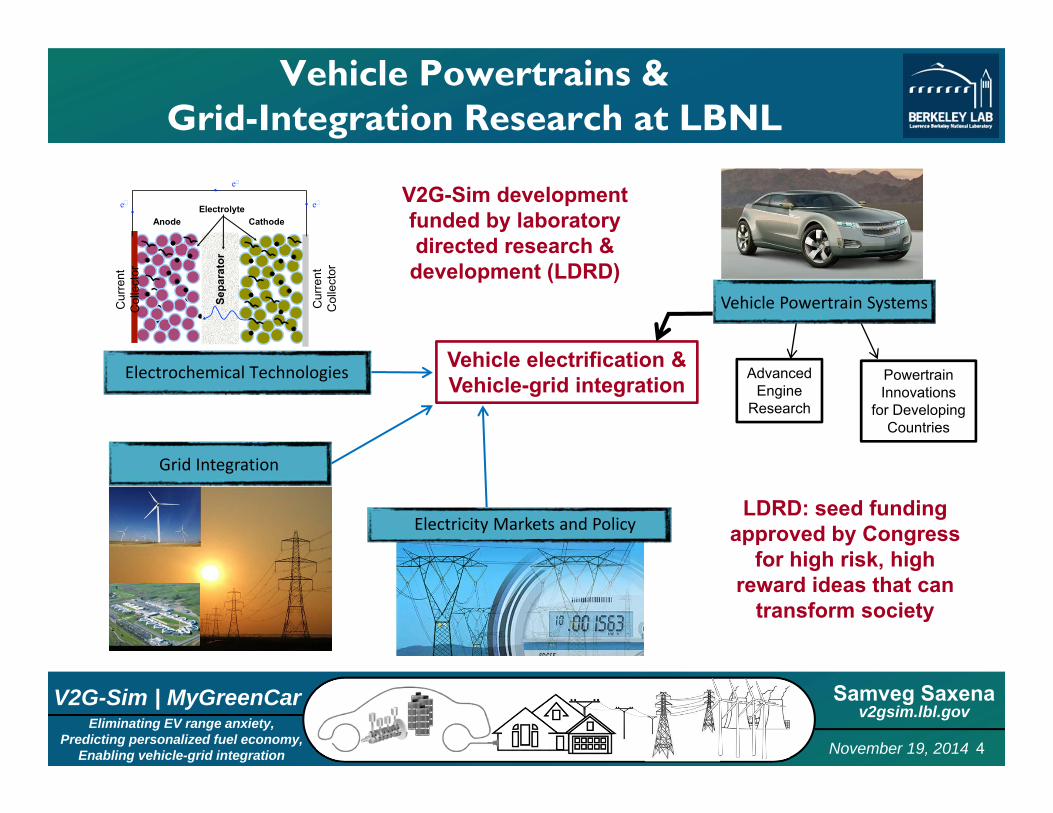
Vehicle Powertrains &Grid-Integration Research at LBNL
Grid Integration
Sepa
rato
rCathodeAnode
ee
e
Electrolyte
Electrochemical Technologies
Electricity Markets and Policy
Vehicle Powertrain Systems
Vehicle electrification &Vehicle-grid integration Advanced
EngineResearch
PowertrainInnovations
for DevelopingCountries
LDRD: seed funding approved by Congress
for high risk, high reward ideas that can
transform society
V2G-Sim development funded by laboratory directed research & development (LDRD)
Samveg Saxenav2gsim.lbl.gov
November 19, 2014 5Eliminating EV range anxiety,
Predicting personalized fuel economy,Enabling vehicle-grid integration
V2G-Sim | MyGreenCar
Methodology: Travel Itinerary Inputs
1) Statistical approach: Categorize vehicleusage into finite number of “bins” Describe how/when vehicles are used
2) Deterministic approach: Direct simulation with actual vehicle usage data E.g. National Household Travel Survey / Real-time data
2.5) Automatically deriving inputs statisticsfrom actual vehicle usage data
Samveg Saxenav2gsim.lbl.gov
November 19, 2014 6Eliminating EV range anxiety,
Predicting personalized fuel economy,Enabling vehicle-grid integration
V2G-Sim | MyGreenCar
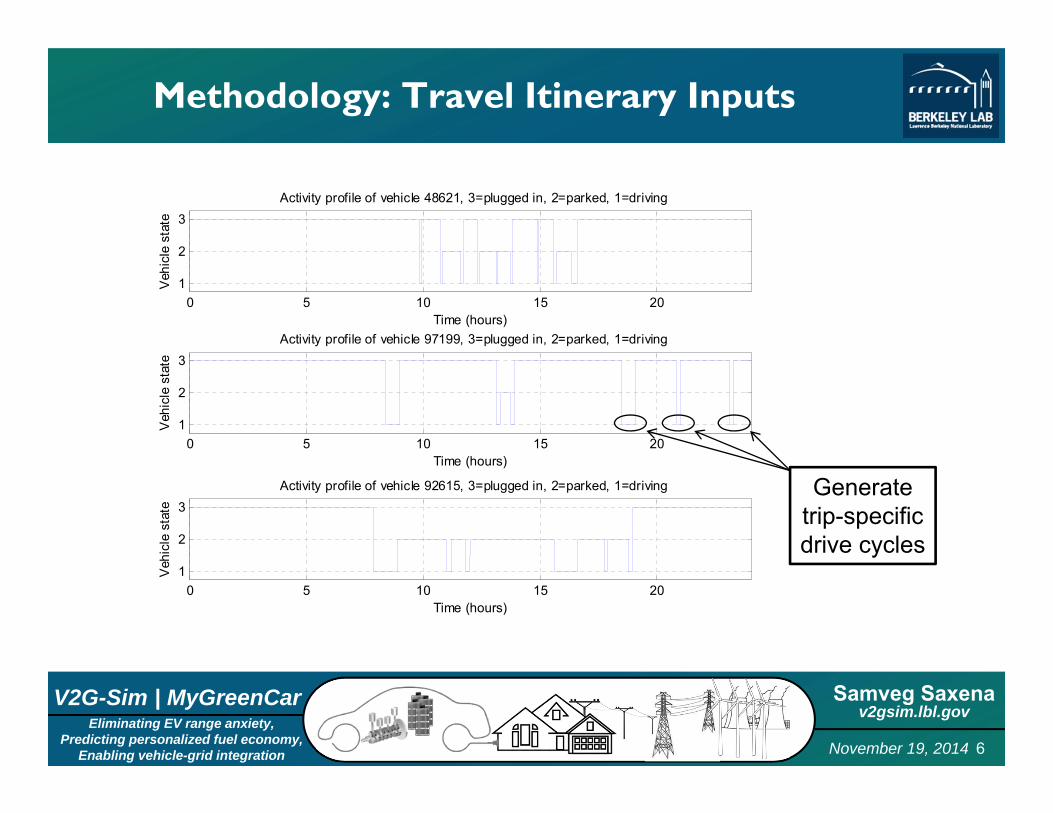
Methodology: Travel Itinerary Inputs
0 5 10 15 201
2
3
Time (hours)
Veh
icle
sta
te
Activity profile of vehicle 48621, 3=plugged in, 2=parked, 1=driving
0 5 10 15 201
2
3
Time (hours)
Veh
icle
sta
te
Activity profile of vehicle 97199, 3=plugged in, 2=parked, 1=driving
0 5 10 15 201
2
3
Time (hours)
Veh
icle
sta
te
Activity profile of vehicle 92615, 3=plugged in, 2=parked, 1=driving Generatetrip-specificdrive cycles
Samveg Saxenav2gsim.lbl.gov
November 19, 2014 7Eliminating EV range anxiety,
Predicting personalized fuel economy,Enabling vehicle-grid integration
V2G-Sim | MyGreenCar
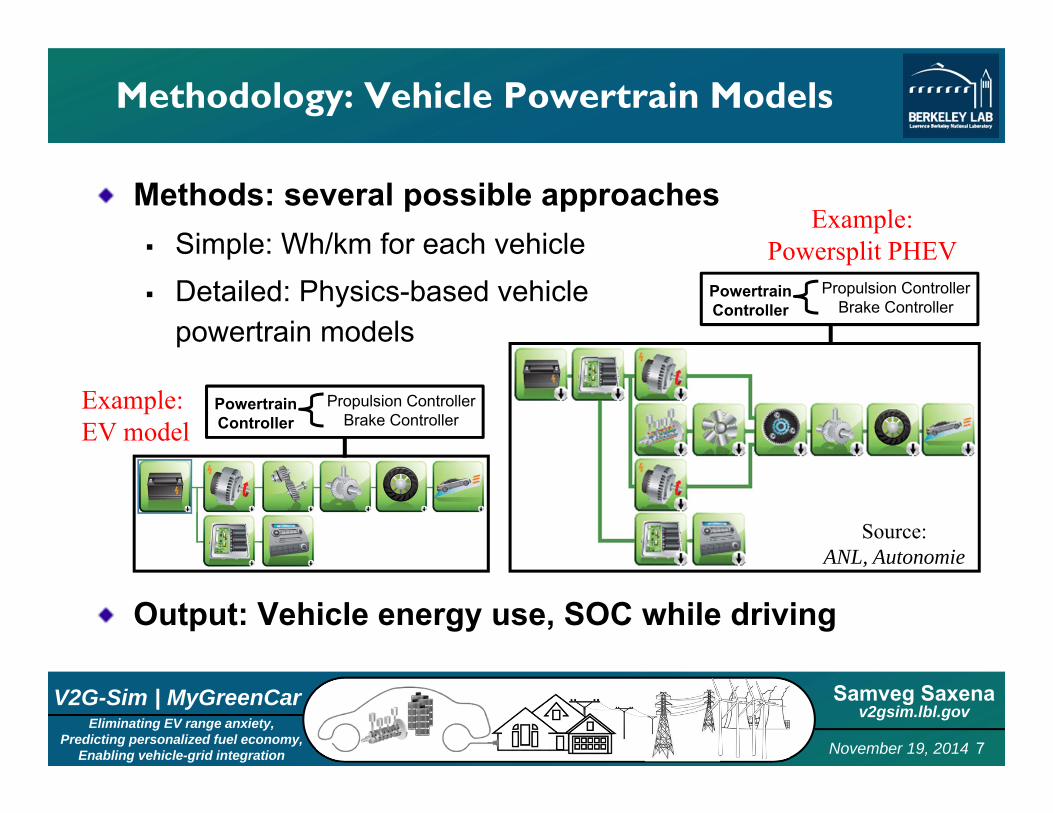
Methodology: Vehicle Powertrain Models
Methods: several possible approaches Simple: Wh/km for each vehicle Detailed: Physics-based vehicle
powertrain models
Output: Vehicle energy use, SOC while driving
PowertrainController
Propulsion ControllerBrake Controller
PowertrainController
Propulsion ControllerBrake Controller
Example:EV model
Example:Powersplit PHEV
Source:ANL, Autonomie
Samveg Saxenav2gsim.lbl.gov
November 19, 2014 8Eliminating EV range anxiety,
Predicting personalized fuel economy,Enabling vehicle-grid integration
V2G-Sim | MyGreenCar
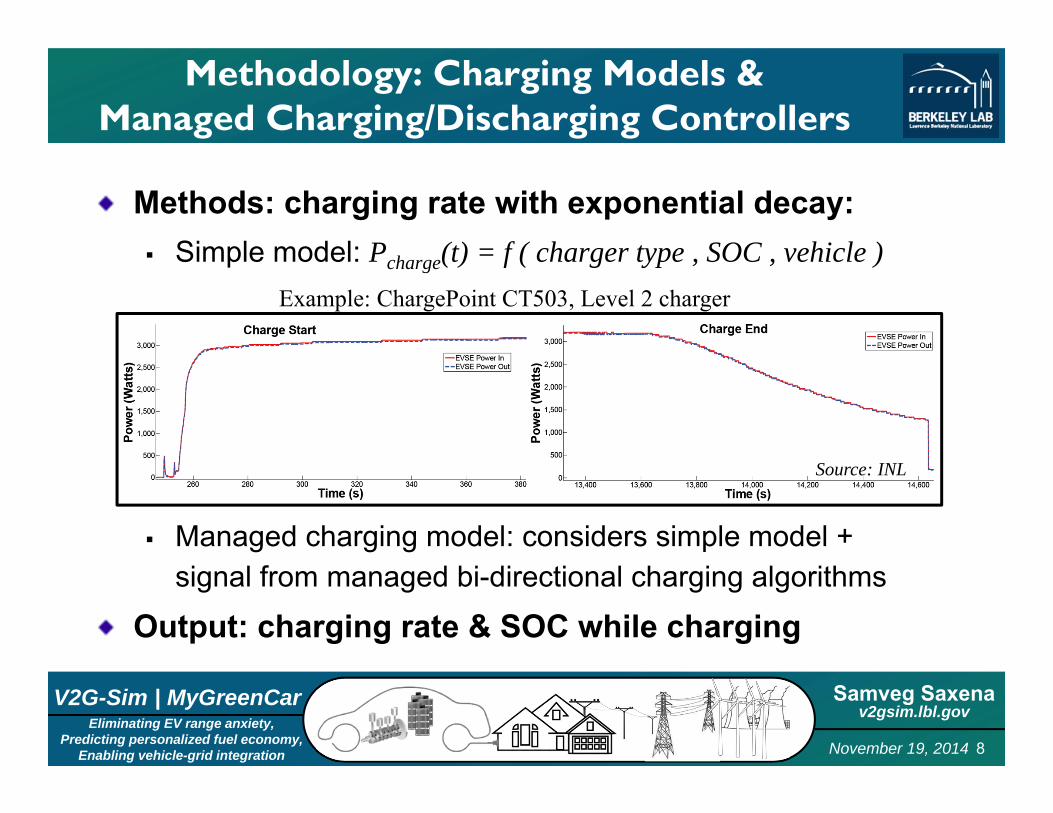
Methodology: Charging Models &Managed Charging/Discharging Controllers
Methods: charging rate with exponential decay: Simple model: Pcharge(t) = f ( charger type , SOC , vehicle )
Managed charging model: considers simple model +signal from managed bi-directional charging algorithms
Output: charging rate & SOC while charging
Example: ChargePoint CT503, Level 2 charger
Source: INL
Samveg Saxenav2gsim.lbl.gov
November 19, 2014 9Eliminating EV range anxiety,
Predicting personalized fuel economy,Enabling vehicle-grid integration
V2G-Sim | MyGreenCar
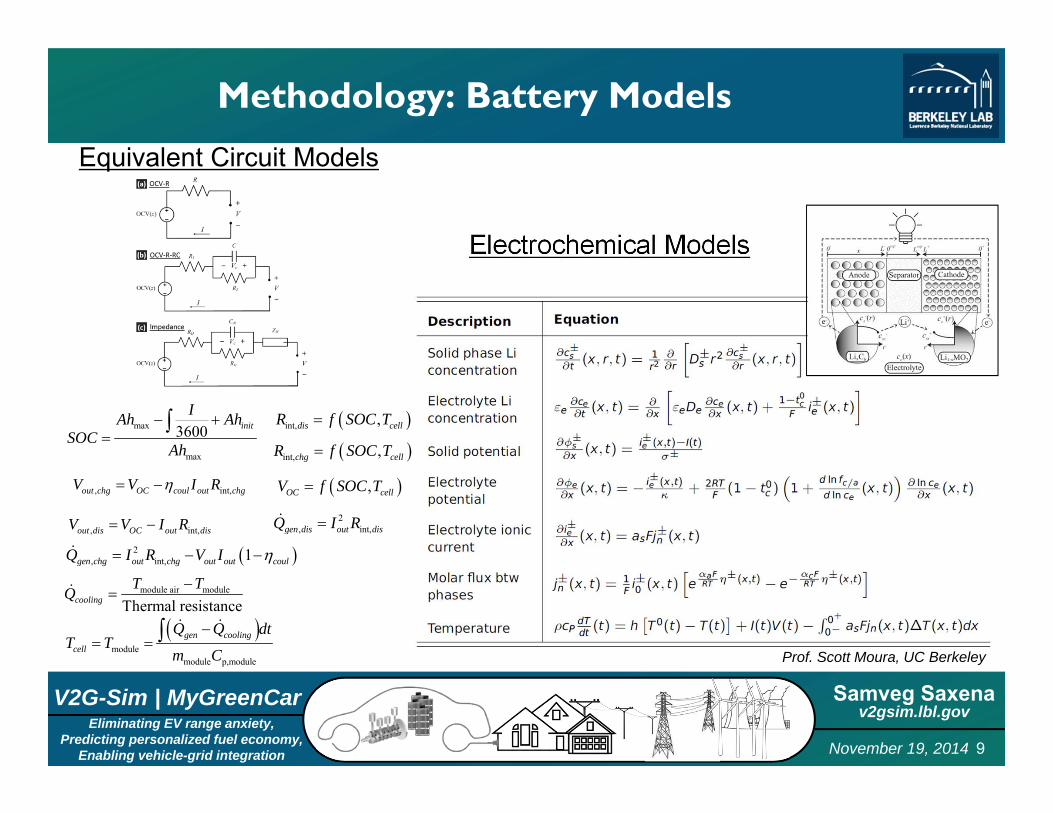
Methodology: Battery Models
Electrochemical Models
Equivalent Circuit Models
, int,out chg OC coul out chgV V I R
, int,out dis OC out disV V I R
int, ,dis cellR f SOC T
int, ,chg cellR f SOC T
,OC cellV f SOC T
max
max
3600 initIAh Ah
SOCAh
2, int, 1gen chg out chg out out coulQ I R V I
2, int,gen dis out disQ I R
module air module
Thermal resistancecoolingT TQ
module
module p,module
gen coolingcell
Q Q dtT T
m C
Prof. Scott Moura, UC Berkeley
Samveg Saxenav2gsim.lbl.gov
November 19, 2014 10Eliminating EV range anxiety,
Predicting personalized fuel economy,Enabling vehicle-grid integration
V2G-Sim | MyGreenCar
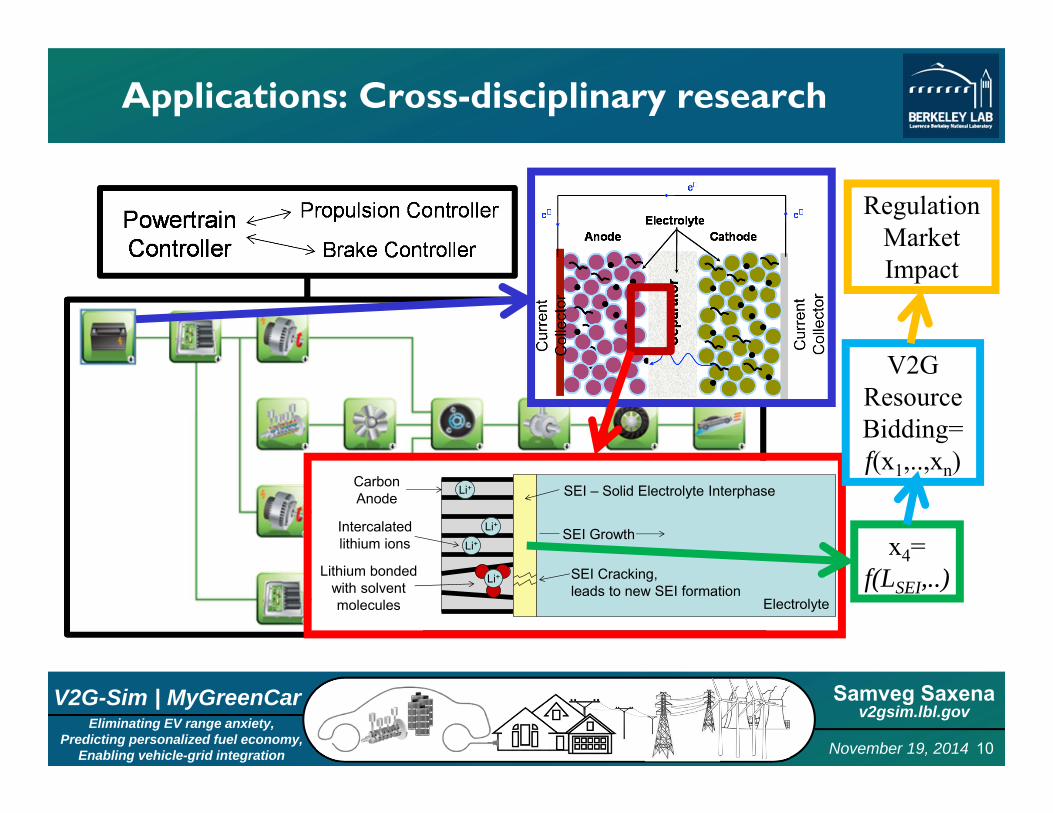
Applications: Cross-disciplinary research
CarbonAnode
Li+
Li+
Li+
SEI – Solid Electrolyte Interphase
SEI Growth
Electrolyte
Li+
Intercalatedlithium ions
Lithium bondedwith solventmolecules
SEI Cracking,leads to new SEI formation
V2GResourceBidding=f(x1,..,xn)
x4=f(LSEI,..)
RegulationMarketImpact
Samveg Saxenav2gsim.lbl.gov
November 19, 2014 11Eliminating EV range anxiety,
Predicting personalized fuel economy,Enabling vehicle-grid integration
V2G-Sim | MyGreenCar
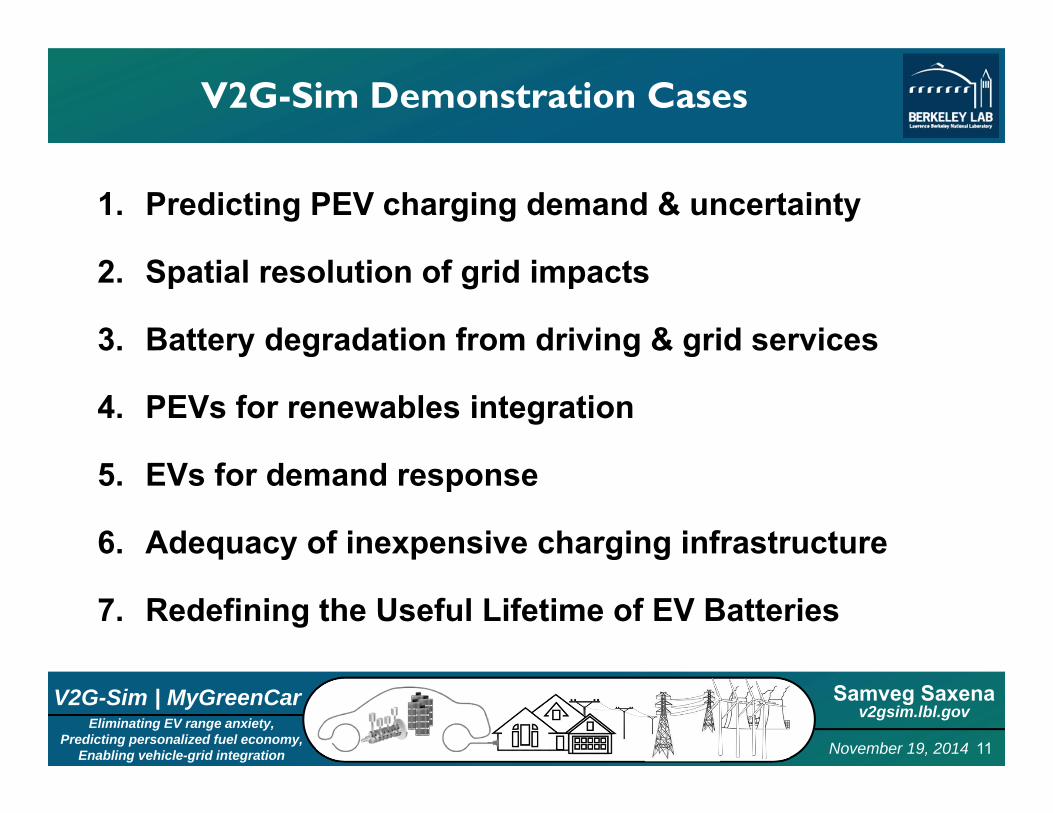
V2G-Sim Demonstration Cases
1. Predicting PEV charging demand & uncertainty
2. Spatial resolution of grid impacts
3. Battery degradation from driving & grid services
4. PEVs for renewables integration
5. EVs for demand response
6. Adequacy of inexpensive charging infrastructure
7. Redefining the Useful Lifetime of EV Batteries
Samveg Saxenav2gsim.lbl.gov
November 19, 2014 12Eliminating EV range anxiety,
Predicting personalized fuel economy,Enabling vehicle-grid integration
V2G-Sim | MyGreenCar
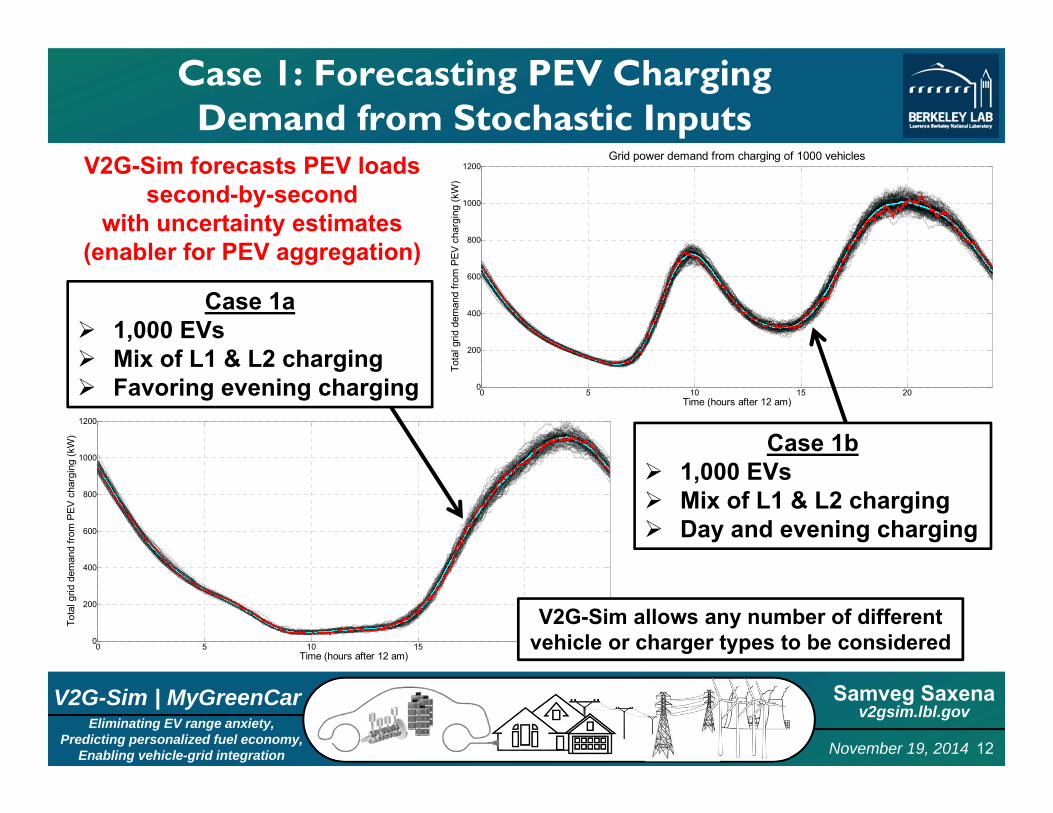
Case 1: Forecasting PEV ChargingDemand from Stochastic Inputs
0 5 10 15 200
200
400
600
800
1000
1200
Time (hours after 12 am)
Tota
l grid
dem
and
from
PEV
cha
rgin
g (k
W)
Grid power demand from charging of 1000 vehicles
0 5 10 15 200
200
400
600
800
1000
1200
Time (hours after 12 am)
Tota
l grid
dem
and
from
PEV
cha
rgin
g (k
W)
V2G-Sim allows any number of differentvehicle or charger types to be considered
Case 1a 1,000 EVs Mix of L1 & L2 charging Favoring evening charging
Case 1b 1,000 EVs Mix of L1 & L2 charging Day and evening charging
V2G-Sim forecasts PEV loadssecond-by-second
with uncertainty estimates(enabler for PEV aggregation)
Samveg Saxenav2gsim.lbl.gov
November 19, 2014 13Eliminating EV range anxiety,
Predicting personalized fuel economy,Enabling vehicle-grid integration
V2G-Sim | MyGreenCar
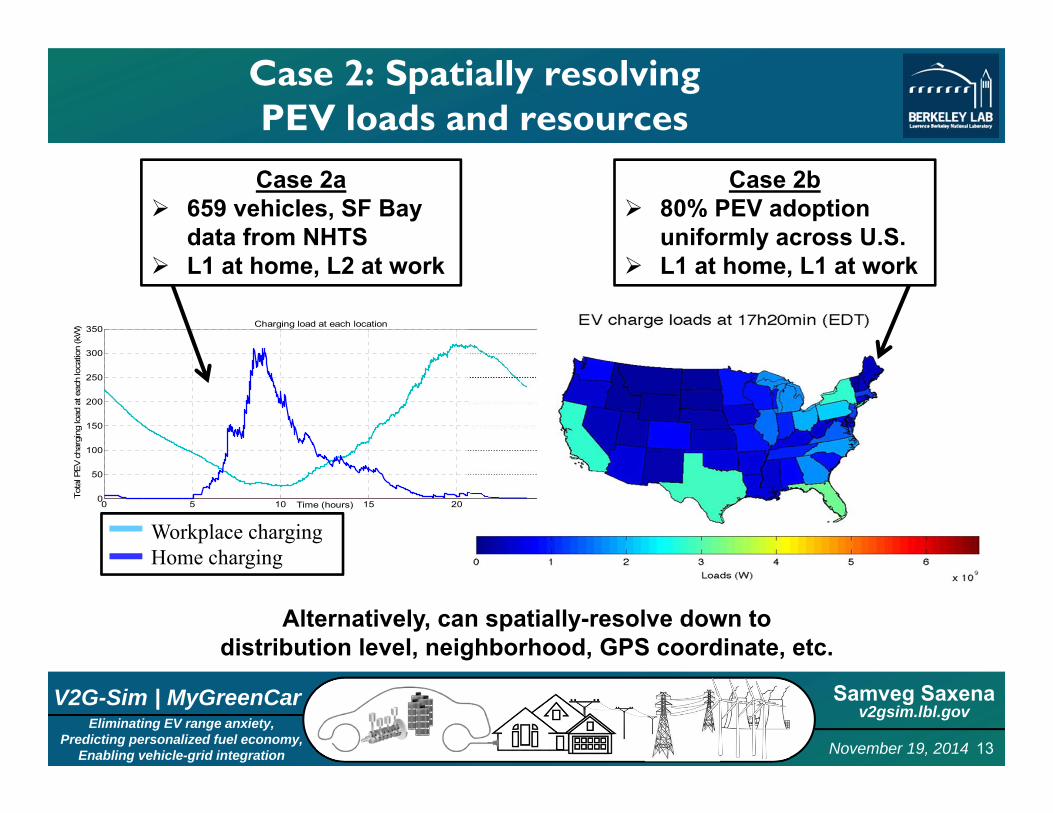
Case 2: Spatially resolvingPEV loads and resources
0 5 10 15 200
50
100
150
200
250
300
350
Time (hours)
Tota
l PEV
cha
rgin
g lo
ad a
t eac
h lo
catio
n (k
W) Charging load at each location
Workplace chargingHome charging
Case 2a 659 vehicles, SF Bay
data from NHTS L1 at home, L2 at work
Case 2b 80% PEV adoption
uniformly across U.S. L1 at home, L1 at work
Alternatively, can spatially-resolve down todistribution level, neighborhood, GPS coordinate, etc.
Samveg Saxenav2gsim.lbl.gov
November 19, 2014 14Eliminating EV range anxiety,
Predicting personalized fuel economy,Enabling vehicle-grid integration
V2G-Sim | MyGreenCar
0 1 2 3 4 5 6 7 8 9 1075
80
85
90
95
100
Elapsed time (years)
Perc
ent b
atte
ry c
apac
ity re
mai
ning
(%)
PEV2 no grid dischargePEV5 no grid dischargePEV7 no grid dischargePEV10 no grid dischargePEV12 no grid discharge
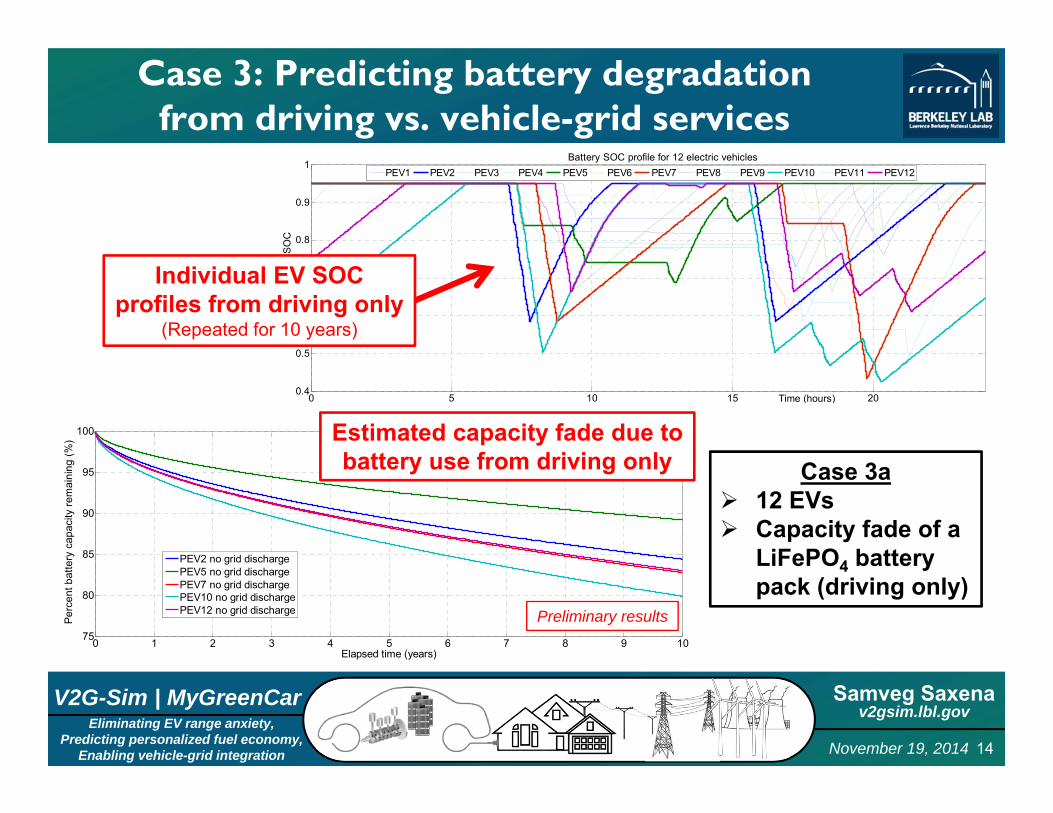
Case 3: Predicting battery degradationfrom driving vs. vehicle-grid services
Case 3a 12 EVs Capacity fade of a
LiFePO4 battery pack (driving only)
0 5 10 15 200.4
0.5
0.6
0.7
0.8
0.9
1
Time (hours)
Vehi
cle
Batte
ry S
OC
Battery SOC profile for 12 electric vehicles
PEV1 PEV2 PEV3 PEV4 PEV5 PEV6 PEV7 PEV8 PEV9 PEV10 PEV11 PEV12
Individual EV SOCprofiles from driving only
(Repeated for 10 years)
Preliminary results
Estimated capacity fade due tobattery use from driving only
Samveg Saxenav2gsim.lbl.gov
November 19, 2014 15Eliminating EV range anxiety,
Predicting personalized fuel economy,Enabling vehicle-grid integration
V2G-Sim | MyGreenCar
0 1 2 3 4 5 6 7 8 9 1075
80
85
90
95
100
Elapsed time (years)
Perc
ent b
atte
ry c
apac
ity re
mai
ning
(%)
PEV2 no grid dischargePEV5 no grid dischargePEV7 no grid dischargePEV10 no grid dischargePEV12 no grid dischargePEV2 with grid dischargePEV5 with grid dischargePEV7 with grid dischargePEV10 with grid dischargePEV12 with grid discharge
0 5 10 15 200
0.2
0.4
0.6
0.8
1
Time (hours)
Vehi
cle
Batte
ry S
OC
Battery SOC profile for 12 electric vehicles
PEV1 PEV2 PEV3 PEV4 PEV5 PEV6 PEV7 PEV8 PEV9 PEV10 PEV11 PEV12
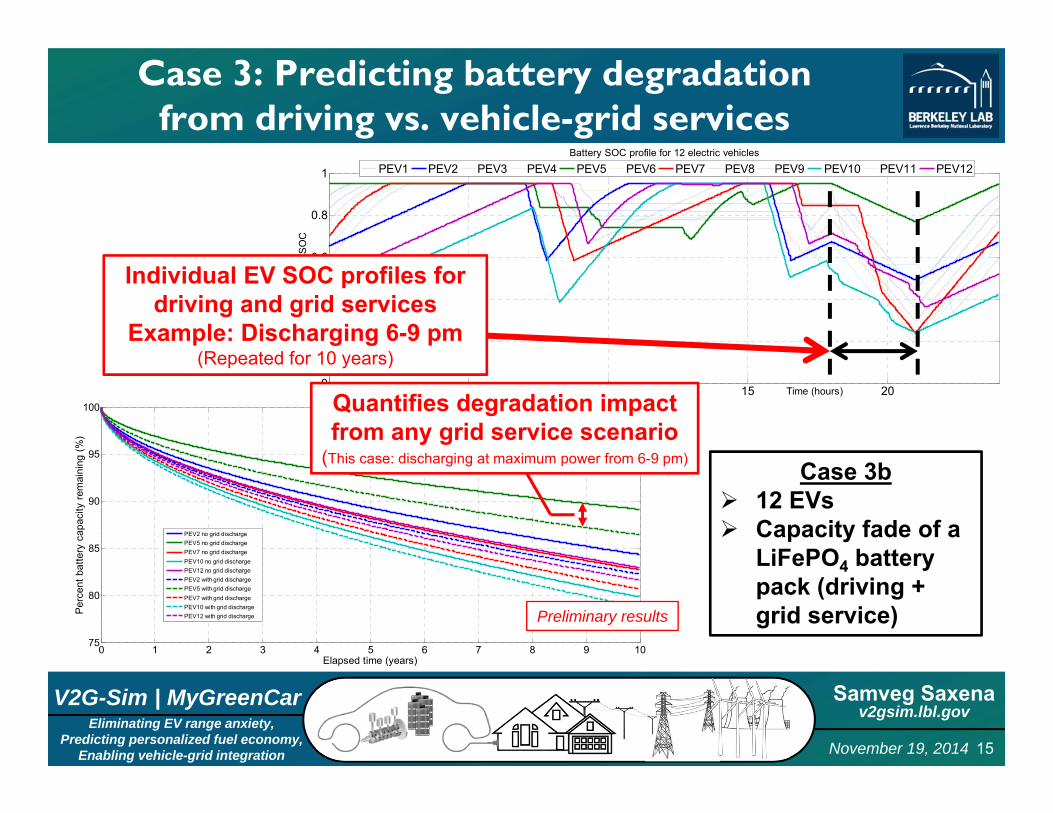
Case 3: Predicting battery degradationfrom driving vs. vehicle-grid services
Case 3b 12 EVs Capacity fade of a
LiFePO4 battery pack (driving + grid service)
Individual EV SOC profiles for driving and grid services
Example: Discharging 6-9 pm(Repeated for 10 years)
Preliminary results
Quantifies degradation impact from any grid service scenario
(This case: discharging at maximum power from 6-9 pm)
Samveg Saxenav2gsim.lbl.gov
November 19, 2014 16Eliminating EV range anxiety,
Predicting personalized fuel economy,Enabling vehicle-grid integration
V2G-Sim | MyGreenCar
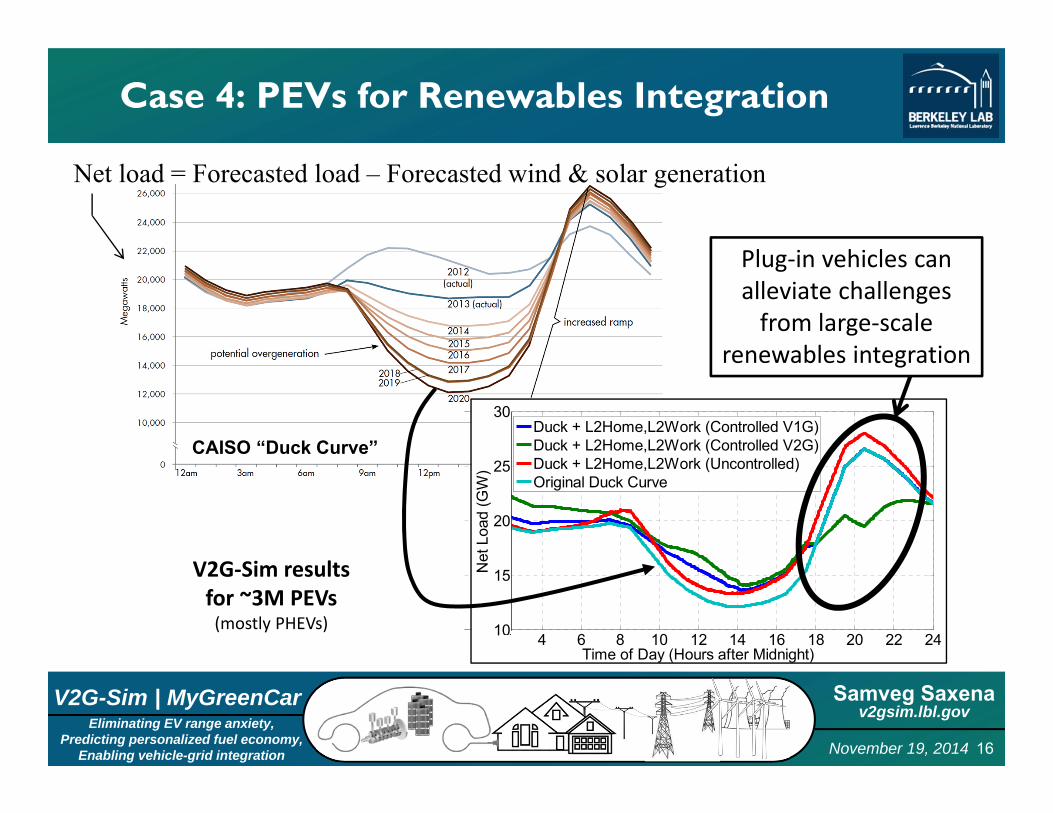
Case 4: PEVs for Renewables Integration
4 6 8 10 12 14 16 18 20 22 24Time of Day (Hours after Midnight)
Duck + L2Home,L2Work (Controlled V1G)Duck + L2Home,L2Work (Controlled V2G)Duck + L2Home,L2Work (Uncontrolled)Original Duck Curve
010
15
20
25
30
Net
Loa
d (G
W)
Net load = Forecasted load – Forecasted wind & solar generation
CAISO “Duck Curve”
V2G‐Sim resultsfor ~3M PEVs(mostly PHEVs)
Plug‐in vehicles canalleviate challengesfrom large‐scale
renewables integration
Samveg Saxenav2gsim.lbl.gov
November 19, 2014 17Eliminating EV range anxiety,
Predicting personalized fuel economy,Enabling vehicle-grid integration
V2G-Sim | MyGreenCar
70%
75%
80%
85%
90%
95%
100%
6:00 AM 9:00 AM 12:00 PM 3:00 PM 6:00 PM 9:00 PMPercen
t Red
uctio
n in EV Ch
arging
Loa
d
Start Time of Demand Response Event
1 hour DR ‐ L2 Home, L2 Work2 hour DR ‐ L2 Home, L2 Work4 hour DR ‐ L2 Home, L2 Work
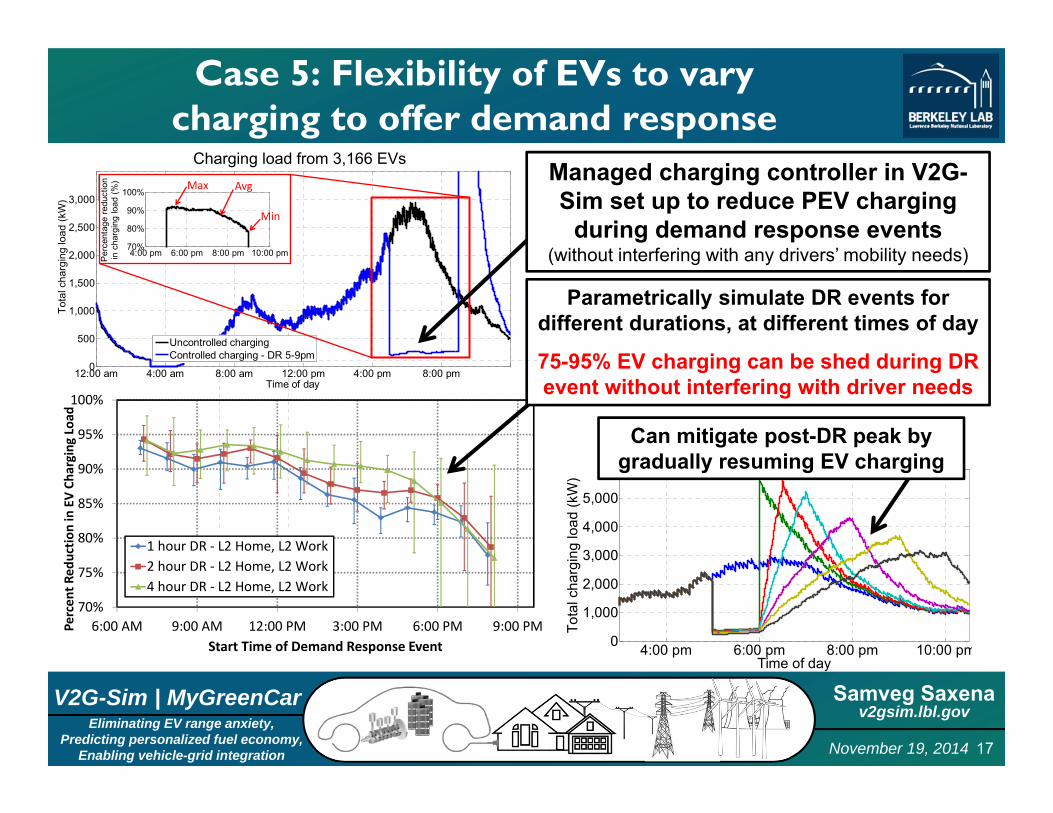
Case 5: Flexibility of EVs to varycharging to offer demand response
Parametrically simulate DR events for different durations, at different times of day
75-95% EV charging can be shed during DR event without interfering with driver needs
Charging load from 3,166 EVs
12:00 am 4:00 am 8:00 am 12:00 pm 4:00 pm 8:00 pm0
500
1,000
1,500
2,000
2,500
3,000
Time of day (hours)
Uncontrolled chargingControlled charging - DR 5-9pm
Uncontrolled chargingControlled charging - DR 5-9pm
4:00 pm 6:00 pm 8:00 pm 10:00 pm70%
80%
90%
100%
Perc
enta
ge re
duct
ion
in c
harg
ing
load
(%)
Tota
l cha
rgin
g lo
ad (k
W)
Max Avg
Min
Managed charging controller in V2G-Sim set up to reduce PEV charging
during demand response events(without interfering with any drivers’ mobility needs)
4:00 pm 6:00 pm 8:00 pm 10:00 pm0
1,000
2,000
3,000
4,000
5,000
Time of day
Tota
l cha
rgin
g lo
ad (k
W)
Can mitigate post-DR peak by gradually resuming EV charging
Samveg Saxenav2gsim.lbl.gov
November 19, 2014 18Eliminating EV range anxiety,
Predicting personalized fuel economy,Enabling vehicle-grid integration
V2G-Sim | MyGreenCar
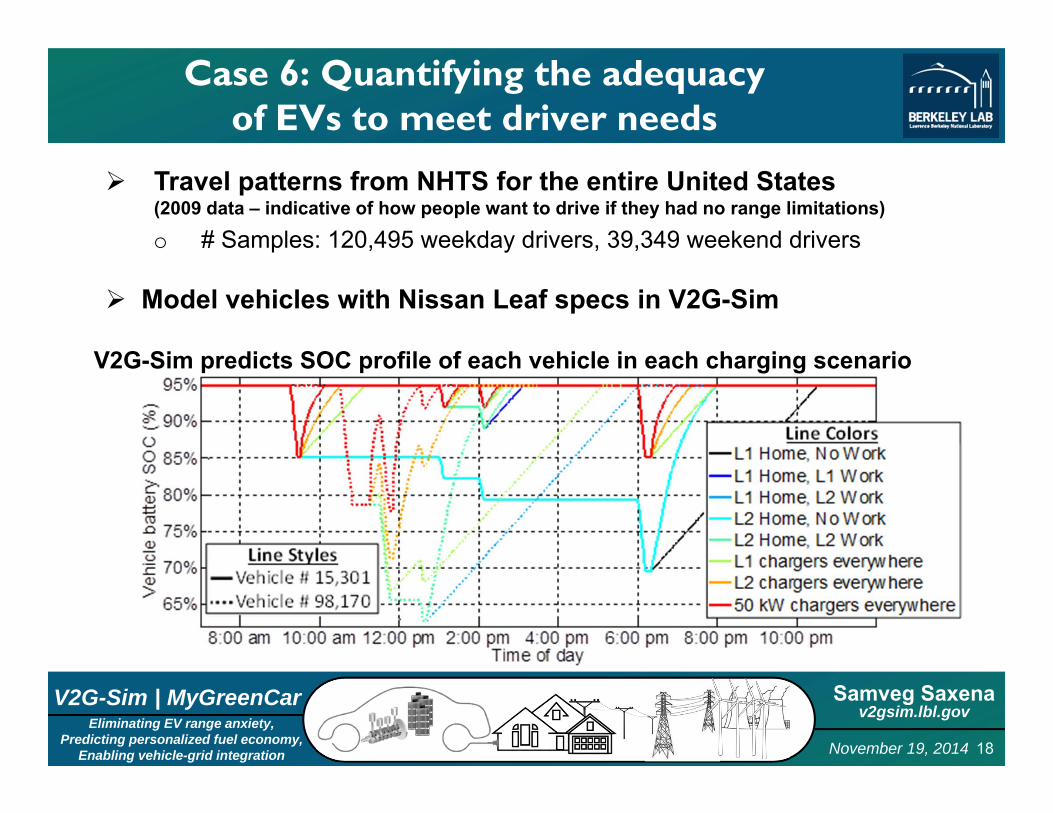
Case 6: Quantifying the adequacyof EVs to meet driver needs
Travel patterns from NHTS for the entire United States(2009 data – indicative of how people want to drive if they had no range limitations)o # Samples: 120,495 weekday drivers, 39,349 weekend drivers
Model vehicles with Nissan Leaf specs in V2G-Sim
V2G-Sim predicts SOC profile of each vehicle in each charging scenario
Samveg Saxenav2gsim.lbl.gov
November 19, 2014 19Eliminating EV range anxiety,
Predicting personalized fuel economy,Enabling vehicle-grid integration
V2G-Sim | MyGreenCar
84%
86%
88%
90%
92%
94%
96%
98%
U.S. Weekday travel U.S. Weekend travel
Fractio
n of U.S. travel nee
ds satisfied by
EVs (%
)
L1 Home, No Work
L1 Home, L1 Work
L1 Home, L2 Work
L2 Home, No Work
L2 Home, L2 Work
L1 All Locations
L2 All Locations
50 kW All Locations
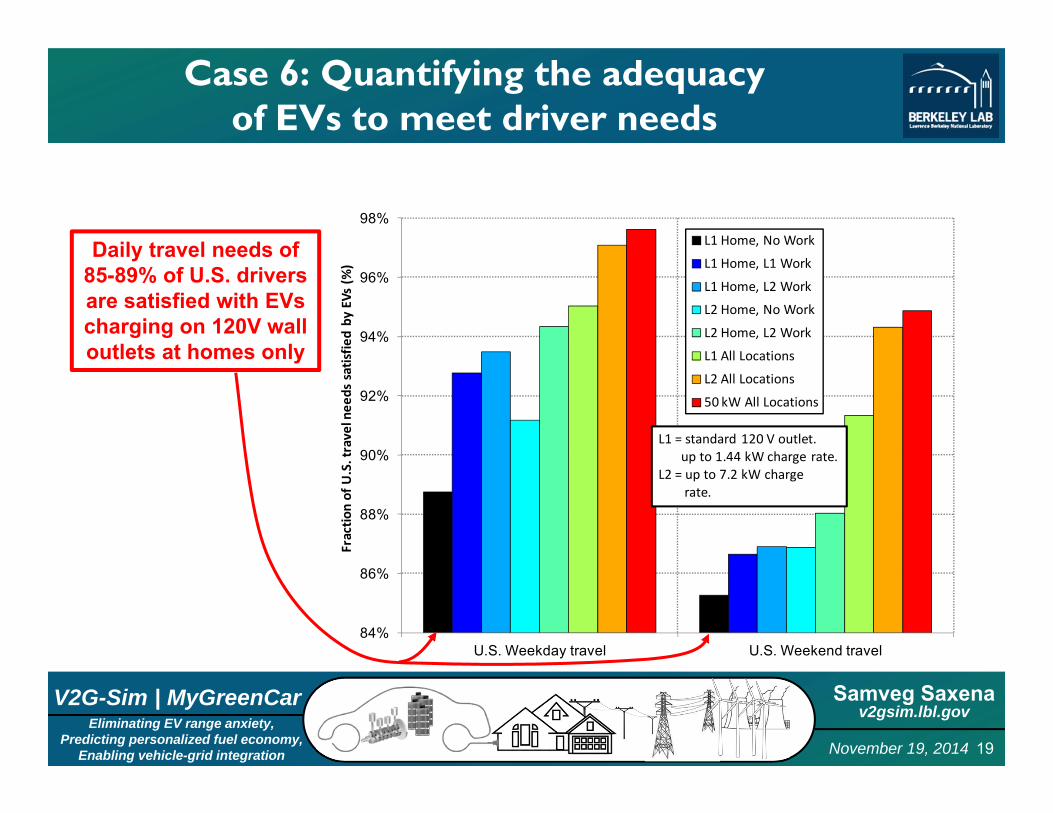
L1 = standard 120 V outlet. up to 1.44 kW charge rate.
L2 = up to 7.2 kW chargerate.
Case 6: Quantifying the adequacyof EVs to meet driver needs
Daily travel needs of 85-89% of U.S. drivers are satisfied with EVs charging on 120V wall outlets at homes only
Samveg Saxenav2gsim.lbl.gov
November 19, 2014 20Eliminating EV range anxiety,
Predicting personalized fuel economy,Enabling vehicle-grid integration
V2G-Sim | MyGreenCar
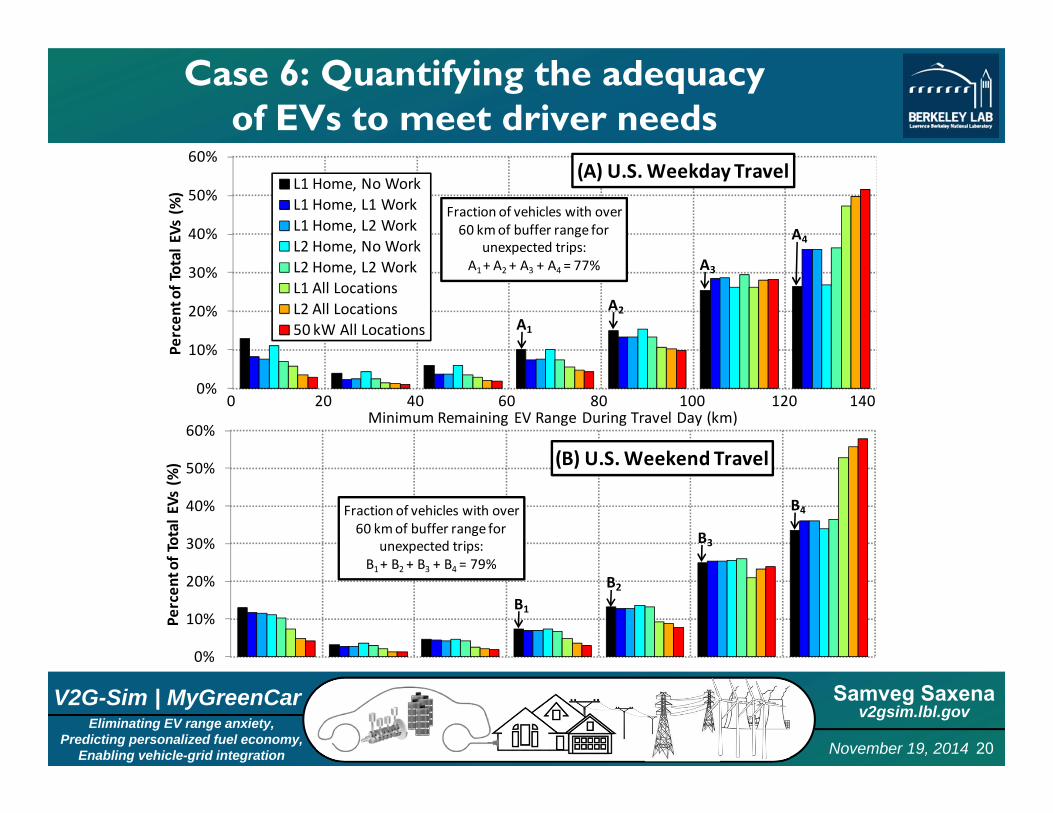
Case 6: Quantifying the adequacyof EVs to meet driver needs
0%
10%
20%
30%
40%
50%
60%
Percen
t of Total EVs (%)
0%
10%
20%
30%
40%
50%
60%Pe
rcen
t of Total EVs (%) L1 Home, No Work
L1 Home, L1 WorkL1 Home, L2 WorkL2 Home, No WorkL2 Home, L2 WorkL1 All LocationsL2 All Locations50 kW All Locations
(A) U.S. Weekday Travel
A1
A2
A3
A4
Fraction of vehicles with over60 km of buffer range for
unexpected trips:A1 + A2 + A3 + A4 = 77%
(B) U.S. Weekend Travel
0 20 40 60 80 100 120 140Minimum Remaining EV Range During Travel Day (km)
Fraction of vehicles with over60 km of buffer range for
unexpected trips:B1 + B2 + B3 + B4 = 79%
B1
B2
B3
B4
Samveg Saxenav2gsim.lbl.gov
November 19, 2014 21Eliminating EV range anxiety,
Predicting personalized fuel economy,Enabling vehicle-grid integration
V2G-Sim | MyGreenCar
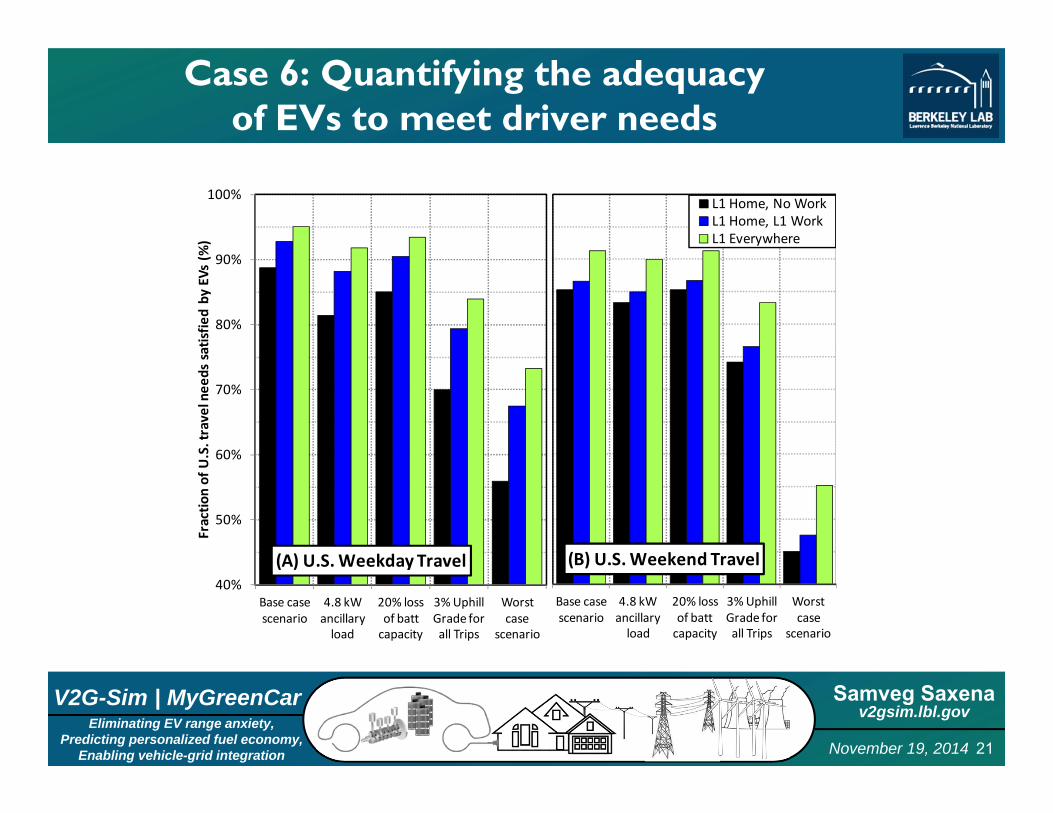
40%
50%
60%
70%
80%
90%
100%
Base case scenario
4.8 kW ancillary load
20% loss of batt capacity
3% Uphill Grade for all Trips
Worst case
scenario
Fractio
n of U.S. travel nee
ds satisfied by
EVs (%
)
Base case scenario
4.8 kW ancillary load
20% loss of batt capacity
3% Uphill Grade for all Trips
Worst case
scenario
L1 Home, No WorkL1 Home, L1 WorkL1 Everywhere
(B) U.S. Weekend Travel(A) U.S. Weekday Travel
Case 6: Quantifying the adequacyof EVs to meet driver needs
Samveg Saxenav2gsim.lbl.gov
November 19, 2014 22Eliminating EV range anxiety,
Predicting personalized fuel economy,Enabling vehicle-grid integration
V2G-Sim | MyGreenCar
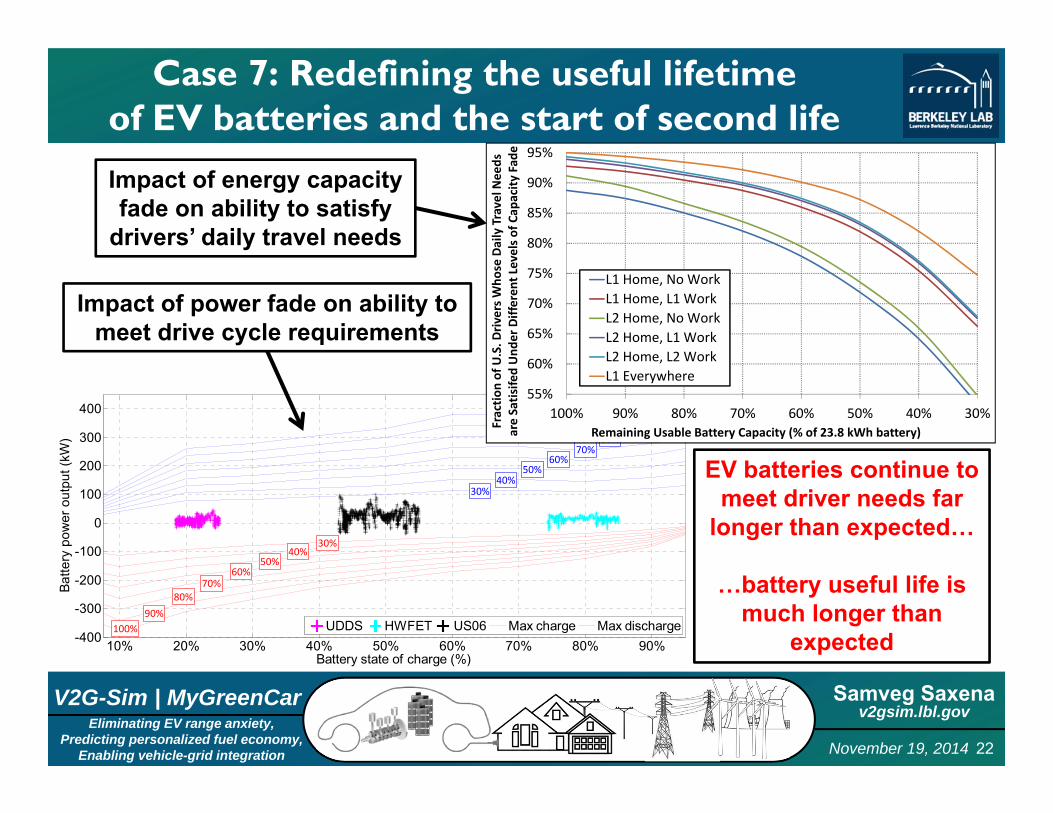
Case 7: Redefining the useful lifetimeof EV batteries and the start of second life
10% 20% 30% 40% 50% 60% 70% 80% 90%-400
-300
-200
-100
0
100
200
300
400
Battery state of charge (%)
Batte
ry p
ower
out
put (
kW)
UDDS HWFET US06 Max charge Max discharge
100%90%
80%70%
60%50%
40%30%
100%90%
80%70%
60%50%
40%30%
55%
60%
65%
70%
75%
80%
85%
90%
95%
30%40%50%60%70%80%90%100%
Fractio
n of U.S. D
rivers W
hose Daily Travel N
eeds
are Satisife
d Und
er Differen
t Levels o
f Cap
acity
Fad
e
Remaining Usable Battery Capacity (% of 23.8 kWh battery)
L1 Home, No WorkL1 Home, L1 WorkL2 Home, No WorkL2 Home, L1 WorkL2 Home, L2 WorkL1 Everywhere
Impact of energy capacityfade on ability to satisfy
drivers’ daily travel needs
Impact of power fade on ability to meet drive cycle requirements
EV batteries continue to meet driver needs far
longer than expected…
…battery useful life is much longer than
expected
Samveg Saxenav2gsim.lbl.gov
November 19, 2014 23Eliminating EV range anxiety,
Predicting personalized fuel economy,Enabling vehicle-grid integration
V2G-Sim | MyGreenCar
MyGreenCar: Leveraging V2G-Sim to accelerate deployment of clean vehicles
Drivers and fleet managers are often unaware of the benefits of clean vehicles
Many are unaware whether these vehicles even meet their individual needs
o E.g. range anxiety is a key obstacle for EV adoption
MyGreenCar is an end user application of V2G-Sim that provides drivers with personalized information on how clean vehicles meet their needs
Samveg Saxenav2gsim.lbl.gov
November 19, 2014 24Eliminating EV range anxiety,
Predicting personalized fuel economy,Enabling vehicle-grid integration
V2G-Sim | MyGreenCar
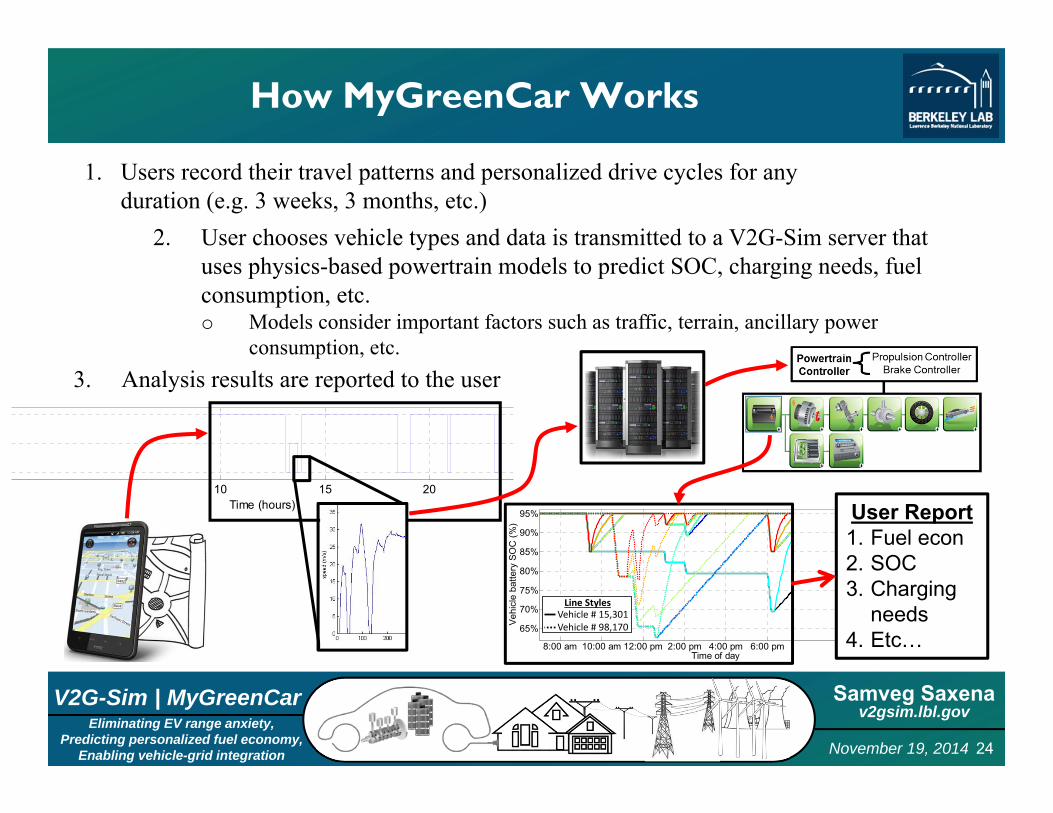
How MyGreenCar Works
1. Users record their travel patterns and personalized drive cycles for any duration (e.g. 3 weeks, 3 months, etc.)
2. User chooses vehicle types and data is transmitted to a V2G-Sim server that uses physics-based powertrain models to predict SOC, charging needs, fuel consumption, etc.o Models consider important factors such as traffic, terrain, ancillary power
consumption, etc.3. Analysis results are reported to the user
8:00 am 10:00 am 12:00 pm 2:00 pm 4:00 pm 6:00 pm
65%
70%
75%
80%
85%
90%
95%
Time of day
Vehi
cle
batte
ry S
OC
(%)
Vehicle # 15,301Vehicle # 98,170
Line Styles
10 15 20Time (hours) User Report
1. Fuel econ2. SOC3. Charging
needs4. Etc…
Samveg Saxenav2gsim.lbl.gov
November 19, 2014 25Eliminating EV range anxiety,
Predicting personalized fuel economy,Enabling vehicle-grid integration
V2G-Sim | MyGreenCar
MyGreenCar Application 1: Eliminatingrange anxiety for prospective car buyers
Accelerating EV adoption by eliminating range anxiety for prospective EV ownerso Does an EV provide the range requirements for my normal travel
patterns? Am I ever in danger of running out of charge?o How much range will I have if I need to make an unexpected trip?o Do I need a level 2 charger at home, or is level 1 sufficient?o Do I need a charger at work or other locations?
o How much will I pay for electricity? How does this compare to what I will pay for gasoline in a comparable conventional car?
o What incentives are available?
Samveg Saxenav2gsim.lbl.gov
November 19, 2014 26Eliminating EV range anxiety,
Predicting personalized fuel economy,Enabling vehicle-grid integration
V2G-Sim | MyGreenCar
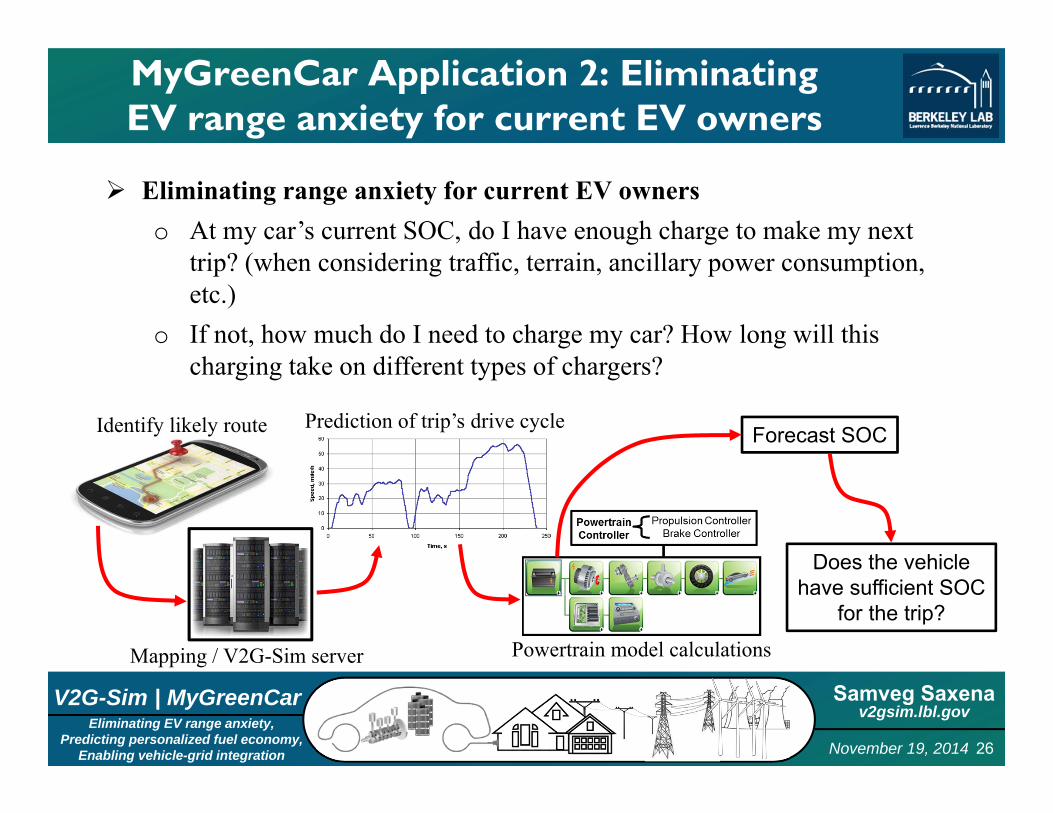
MyGreenCar Application 2: EliminatingEV range anxiety for current EV owners
Eliminating range anxiety for current EV ownerso At my car’s current SOC, do I have enough charge to make my next
trip? (when considering traffic, terrain, ancillary power consumption, etc.)
o If not, how much do I need to charge my car? How long will this charging take on different types of chargers?
Prediction of trip’s drive cycleIdentify likely route
Mapping / V2G-Sim server Powertrain model calculations
Forecast SOC
Does the vehiclehave sufficient SOC
for the trip?
Samveg Saxenav2gsim.lbl.gov
November 19, 2014 27Eliminating EV range anxiety,
Predicting personalized fuel economy,Enabling vehicle-grid integration
V2G-Sim | MyGreenCar
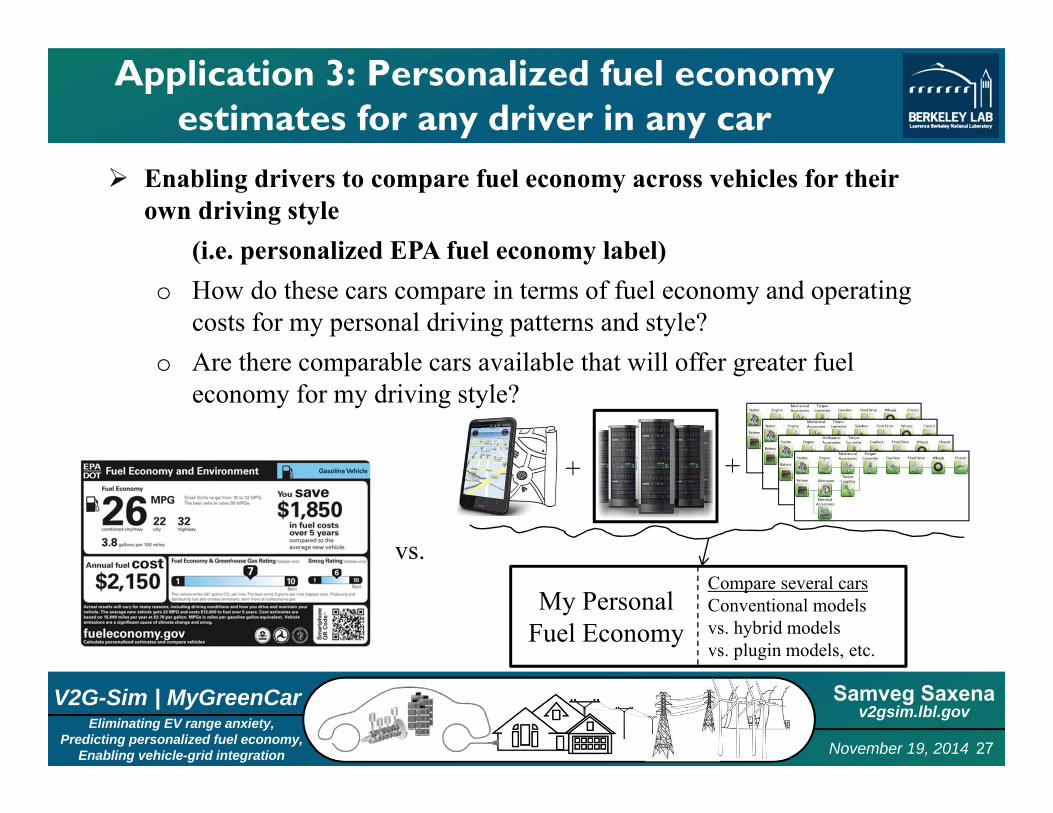
Application 3: Personalized fuel economy estimates for any driver in any car
Enabling drivers to compare fuel economy across vehicles for their own driving style
(i.e. personalized EPA fuel economy label)o How do these cars compare in terms of fuel economy and operating
costs for my personal driving patterns and style?o Are there comparable cars available that will offer greater fuel
economy for my driving style?
vs.Compare several carsConventional modelsvs. hybrid modelsvs. plugin models, etc.
My PersonalFuel Economy
+ +
Samveg Saxenav2gsim.lbl.gov
November 19, 2014 28Eliminating EV range anxiety,
Predicting personalized fuel economy,Enabling vehicle-grid integration
V2G-Sim | MyGreenCar
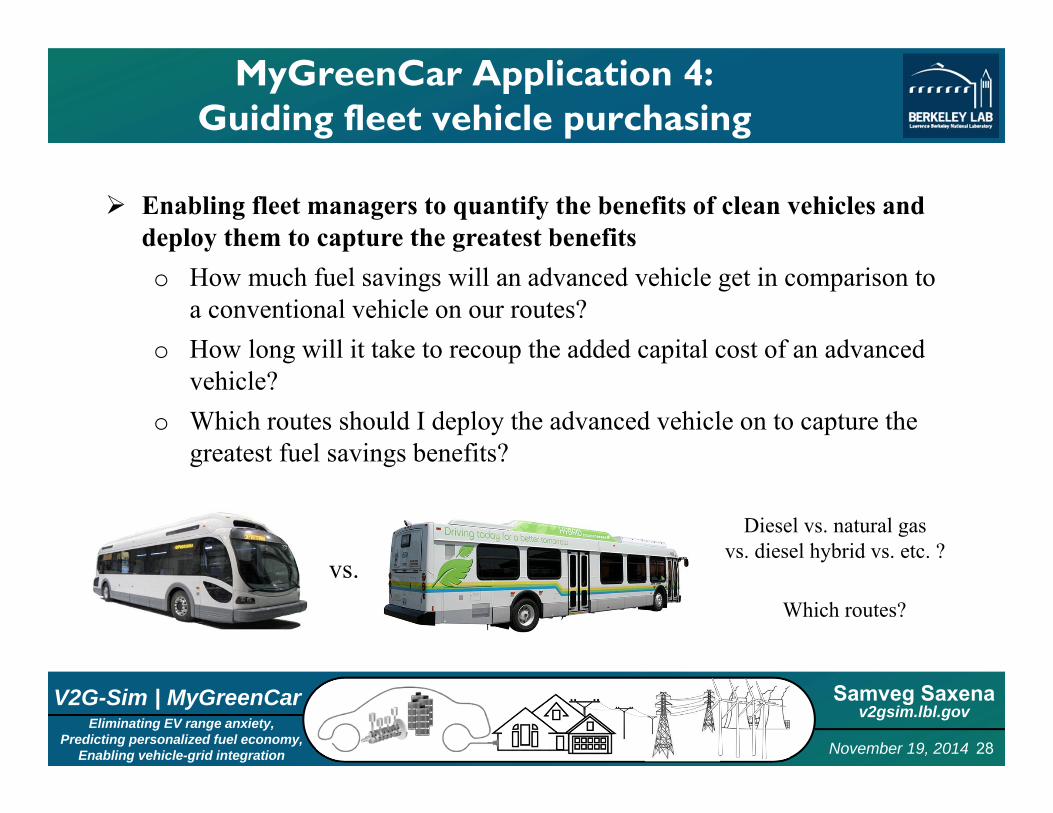
MyGreenCar Application 4:Guiding fleet vehicle purchasing
Enabling fleet managers to quantify the benefits of clean vehicles and deploy them to capture the greatest benefitso How much fuel savings will an advanced vehicle get in comparison to
a conventional vehicle on our routes?o How long will it take to recoup the added capital cost of an advanced
vehicle?o Which routes should I deploy the advanced vehicle on to capture the
greatest fuel savings benefits?
vs.
Diesel vs. natural gasvs. diesel hybrid vs. etc. ?
Which routes?
Samveg Saxenav2gsim.lbl.gov
November 19, 2014 29Eliminating EV range anxiety,
Predicting personalized fuel economy,Enabling vehicle-grid integration
V2G-Sim | MyGreenCar
More applications of MyGreenCar…
Schedule a test drive within the MyGreenCar App
Enable drivers to understand economic benefits of clean vehicles Fuel savings, incentives, time-of-use rates for charging, etc.
Research dataset – more detail & samples than any other travel survey
Spatially forecasting PEV deployment for grid infrastructure planning
Enabling real-time data collection to enable vehicle-grid integration MyGreenCar as interface to an aggregator – specify planned travel activity PEV owners + MyGreenCar + V2G-Sim forecasting + aggregation server = grid services
Utilities: a tangible tool for outreach and accelerating PEV adoption
And more…
Samveg Saxenav2gsim.lbl.gov
November 19, 2014 30Eliminating EV range anxiety,
Predicting personalized fuel economy,Enabling vehicle-grid integration
V2G-Sim | MyGreenCar
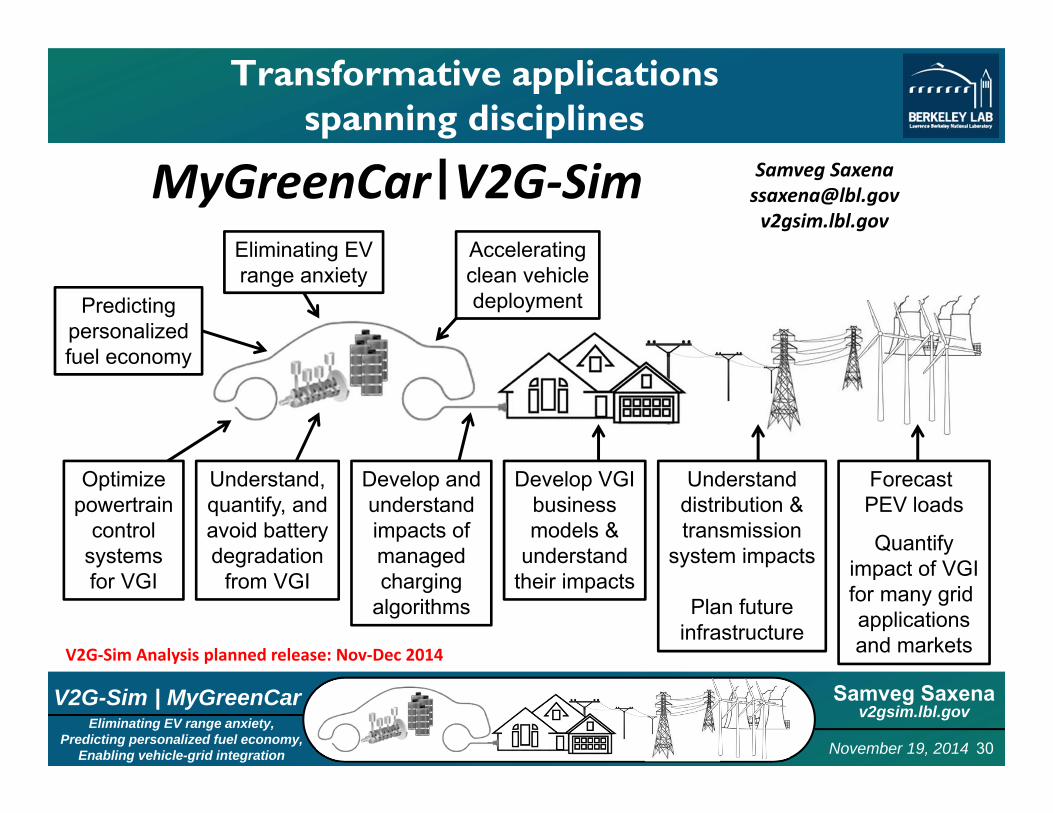
Transformative applicationsspanning disciplines
MyGreenCar V2G‐Sim Samveg [email protected]
Understand,quantify, andavoid batterydegradation
from VGI
Optimizepowertrain
controlsystemsfor VGI
Develop andunderstandimpacts ofmanagedcharging
algorithms
Understanddistribution &transmission
system impacts
Plan futureinfrastructure
Develop VGIbusinessmodels &
understandtheir impacts
Forecast PEV loads
Quantifyimpact of VGIfor many grid applicationsand markets
Acceleratingclean vehicledeployment
Eliminating EVrange anxiety
Predictingpersonalizedfuel economy
V2G‐Sim Analysis planned release: Nov‐Dec 2014