Embed Size (px)
Citation preview

Eligible Women and Participation in the
Women’s Health Network
Ellen M. Kramer ScD RDApril 7, 2005

• Women who are WHN eligible
• Women who participate in WHN
• Surveillance data
CDC estimate of WHN eligible women from 1999 to 2001
Ages 40 to 64: 34,102
Ages 50 to 64: 13,260

Percent of WHN Eligible Women in MassachusettsScreened for Cervical cancer
1999-2001
41.8
52.8
19.515.3
0
10
20
30
40
50
60
MA US
Per
cent 40-64
50-64
Source: Continuing Population Survey &CDC, WHN program data
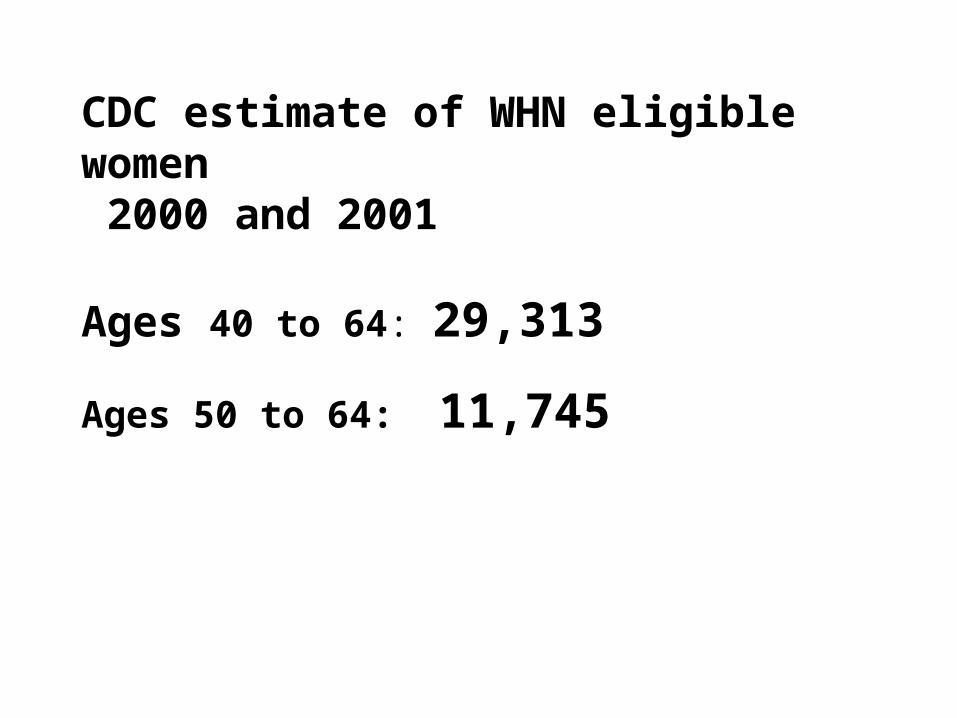
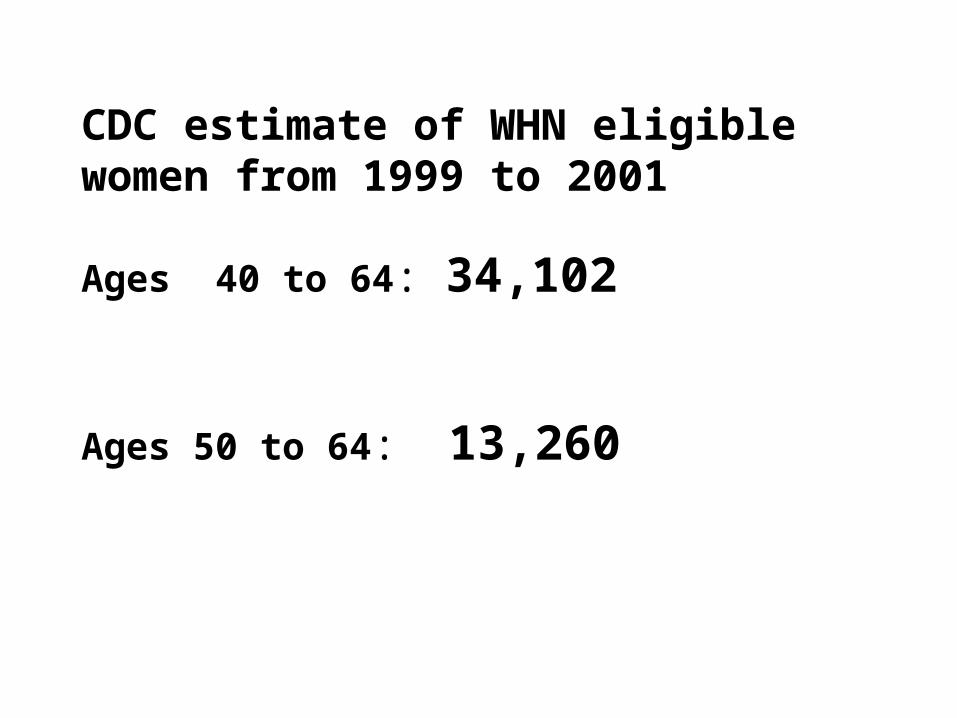
CDC estimate of WHN eligible women 2000 and 2001
Ages 40 to 64: 29,313
Ages 50 to 64: 11,745

Percent of WHN Eligible Women in MassachusettsScreened for Breast Cancer
2000-2001
30.9
67.5 67.5
11.6
67
20.1
0
10
20
30
40
50
60
70
80
CDC PAID MA Total US
Per
cent 40-64
50-64
Source: Continuing Population Survey &CDC, WHN program data

Division of Health Care Finance and PolicyWHN Eligible Women Ages 40 to 64:
33,000 in 2002
66,000 in 2004.
CDC estimates34,102 during 1999 to 2001
29,313 during 2000 and 2001

Uninsured, Low Income Massachusetts Women 40 to 64 Years
By RegionDHCFP 2002 and 2004
0
10000
20000
30000
40000
50000
60000
70000
Wes
tern
Centr
al
North
east
Metr
oBos
South
east
Total
unin
sure
d
Num
ber
20022004
Source: DHCFP Survey 2002 and 2004
Note: Totals were 33890 in 2002 and 66316 in 2004

Number of participants Women’s Health Network
1993 to 2004
0
2,000
4,000
6,000
8,000
10,000
12,000
14,000
16,000 199319941995199619971998199920002001200220032004
Source: WHN Program Data
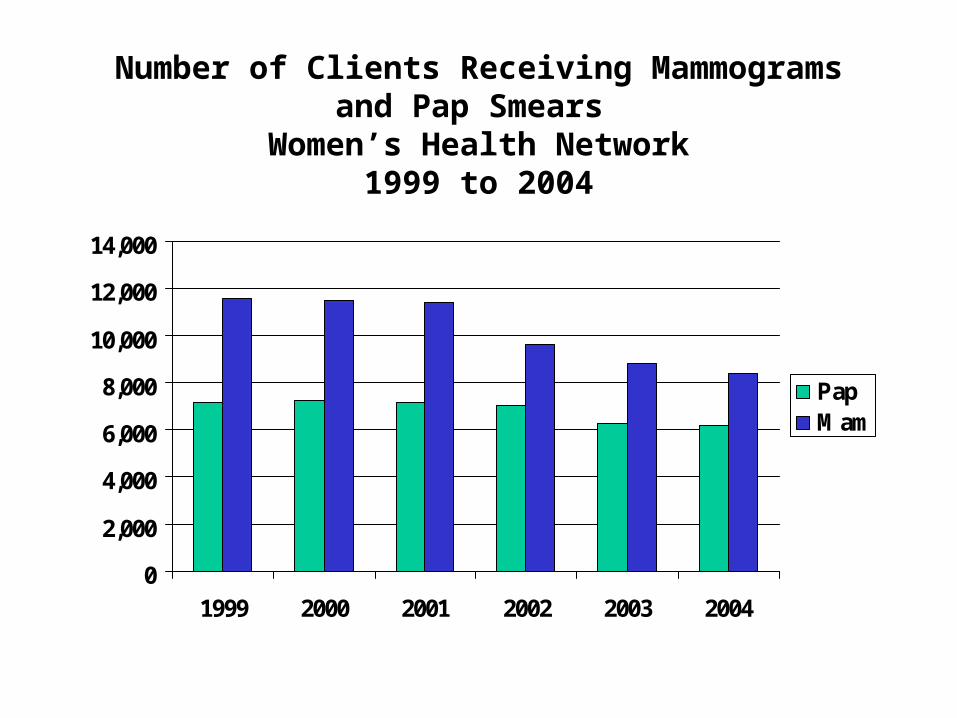
Number of Clients Receiving Mammograms and Pap Smears
Women’s Health Network1999 to 2004
0
2,000
4,000
6,000
8,000
10,000
12,000
14,000
1999 2000 2001 2002 2003 2004
PapMam

Client Language Women’s Health Network
2004
55.7
21.7
12.7
1.9 0.5
7.5
0
10
20
30
40
50
60
Per
cent
EnglishSpanishPortugueseHaitianChineseOther/Unknown
Source: WHN Program Data

Trends in Client Language: Portuguese Women’s Health Network
1999 to 2004
5.27.9
10.111.5 11.8 12.7
0
2
4
6
8
10
12
14
1999 2000 2001 2002 2003 2004
Per
cent
Source: WHN Program Data
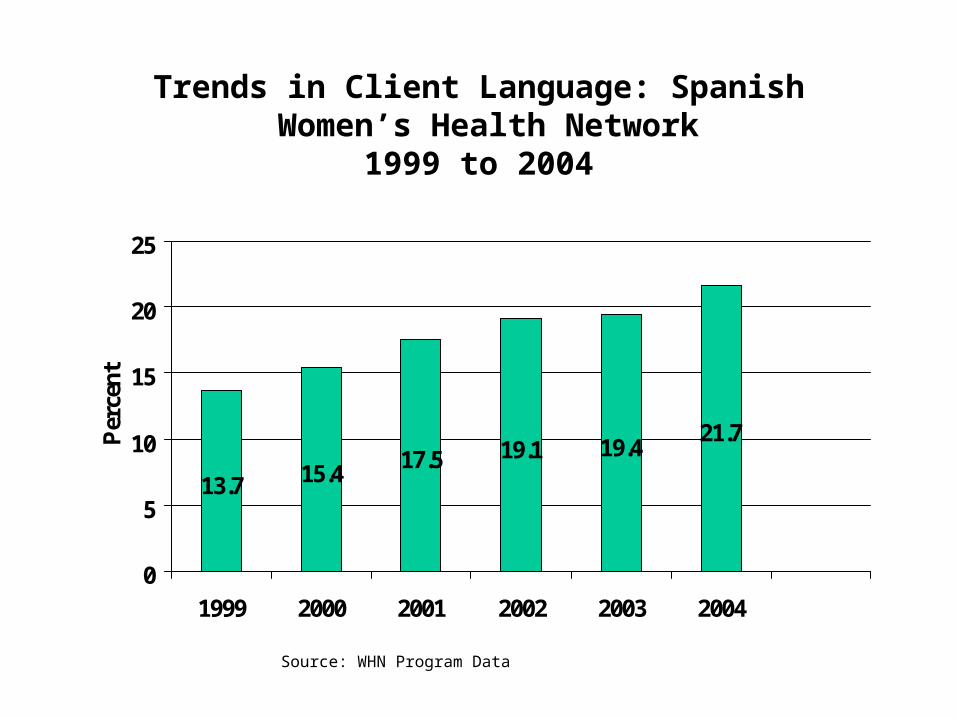
Trends in Client Language: Spanish Women’s Health Network
1999 to 2004
13.7 15.417.5 19.1 19.4
21.7
0
5
10
15
20
25
1999 2000 2001 2002 2003 2004
Per
cent
Source: WHN Program Data

Trends in Client Language: EnglishWomen’s Health Network
1999-2004
68 64.1 59 56.8 55.1 55.7
0
10
20
30
40
50
60
70
80
1999 2000 2001 2002 2003 2004
Per
cent
Source: WHN Program Data

Client Race Women’s Health Network 2004
2.1
31.5
1.7
55.9
8.8
0
10
20
30
40
50
60
White Non-Hispanic
Black Non-Hispanic
Asian Non-Hispanic
Hispanic Other
Per
cent
Source: WHN Program Data
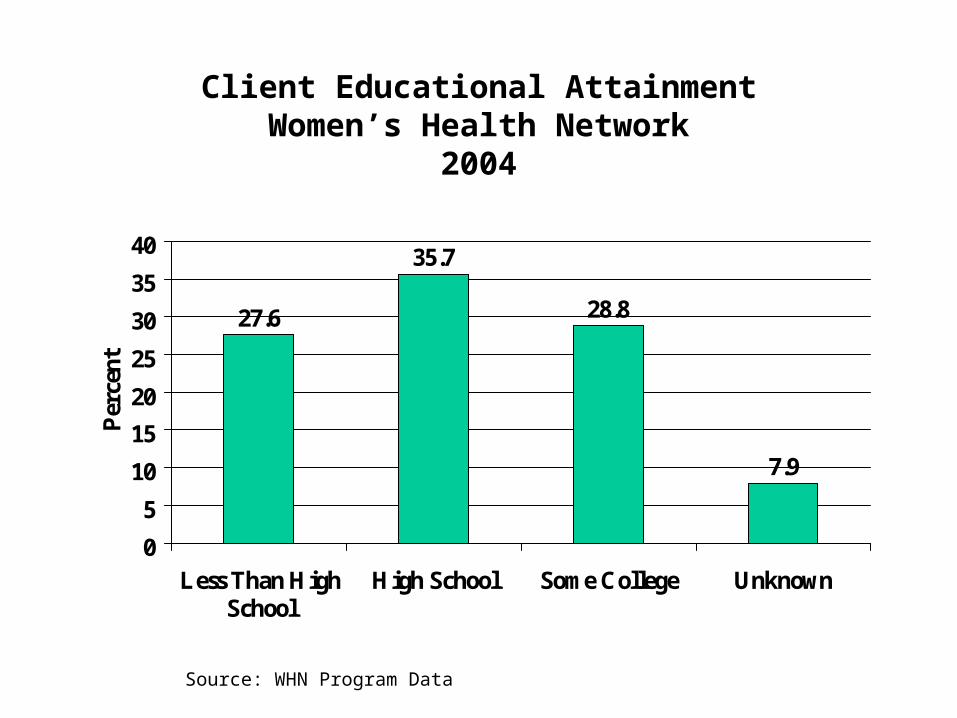
Client Educational AttainmentWomen’s Health Network
2004
27.6
35.7
28.8
7.9
0
5
10
15
20
25
30
35
40
Less Than HighSchool
High School Some College Unknown
Per
cent
Source: WHN Program Data

Client Age Women’s Health Network
2004
14
4043
3
05
10152025
3035404550
under 40 40-49 50-64 65+
Per
cent
Source: WHN Program Data
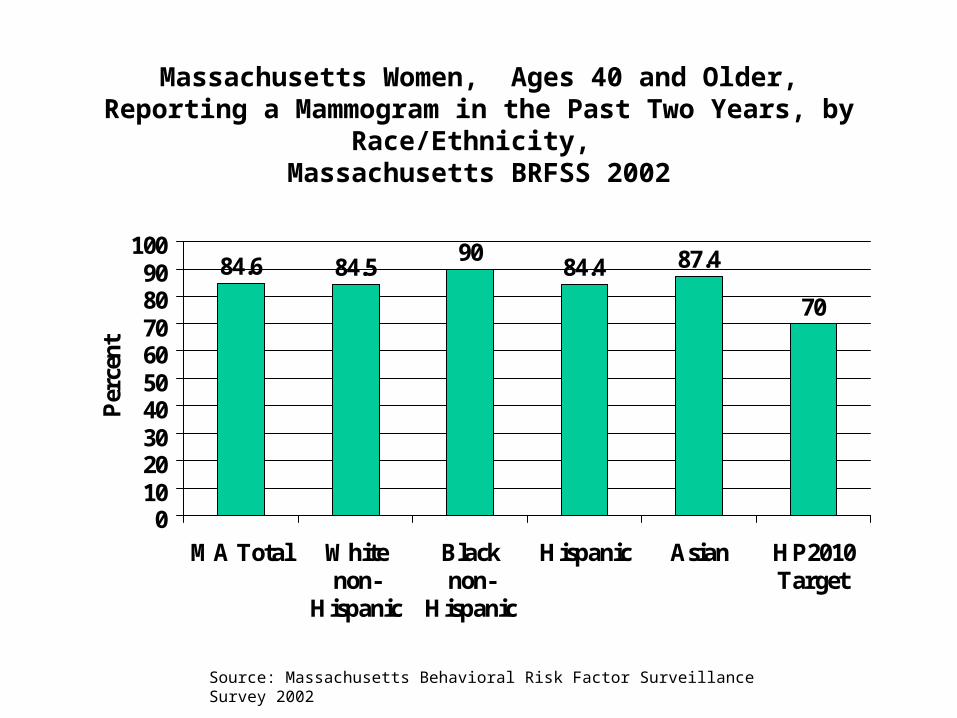
Massachusetts Women, Ages 40 and Older, Reporting a Mammogram in the Past Two Years, by Race/Ethnicity,
Massachusetts BRFSS 2002
84.6 84.590
84.4 87.4
70
0102030405060708090
100
MA Total Whitenon-
Hispanic
Blacknon-
Hispanic
Hispanic Asian HP2010Target
Per
cent
Source: Massachusetts Behavioral Risk Factor Surveillance Survey 2002

Trend in the Percentage of Women Age 40+ in Massachusetts Reporting a Mammogram in Past 2 Years, By Insurance Status
Massachusetts BRFSS 1992 to 2003
0102030405060708090
100
1992-1993
1994-1995
1996-1997
1998-1999
2000-2001*
2002-2003
Per
cent insured
uninsured
* 2000 data onlySource: Massachusetts Behavioral Risk Factor Surveillance Survey
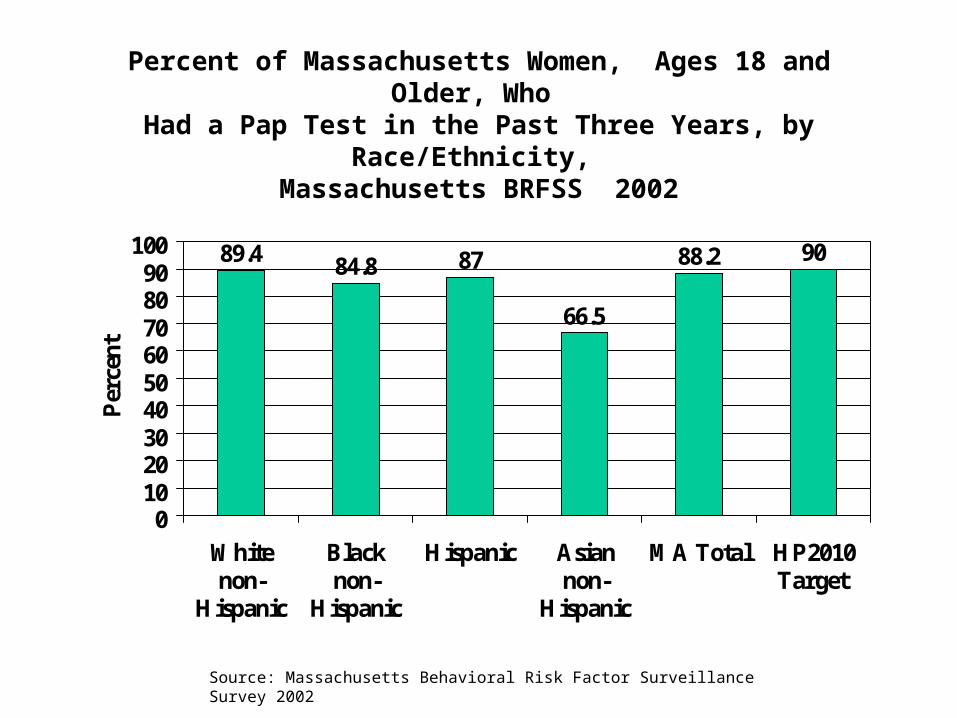
Percent of Massachusetts Women, Ages 18 and Older, Who Had a Pap Test in the Past Three Years, by Race/Ethnicity,
Massachusetts BRFSS 2002
89.4 84.8 87
66.5
88.2 90
0102030405060708090
100
Whitenon-
Hispanic
Blacknon-
Hispanic
Hispanic Asiannon-
Hispanic
MA Total HP2010Target
Per
cent
Source: Massachusetts Behavioral Risk Factor Surveillance Survey 2002
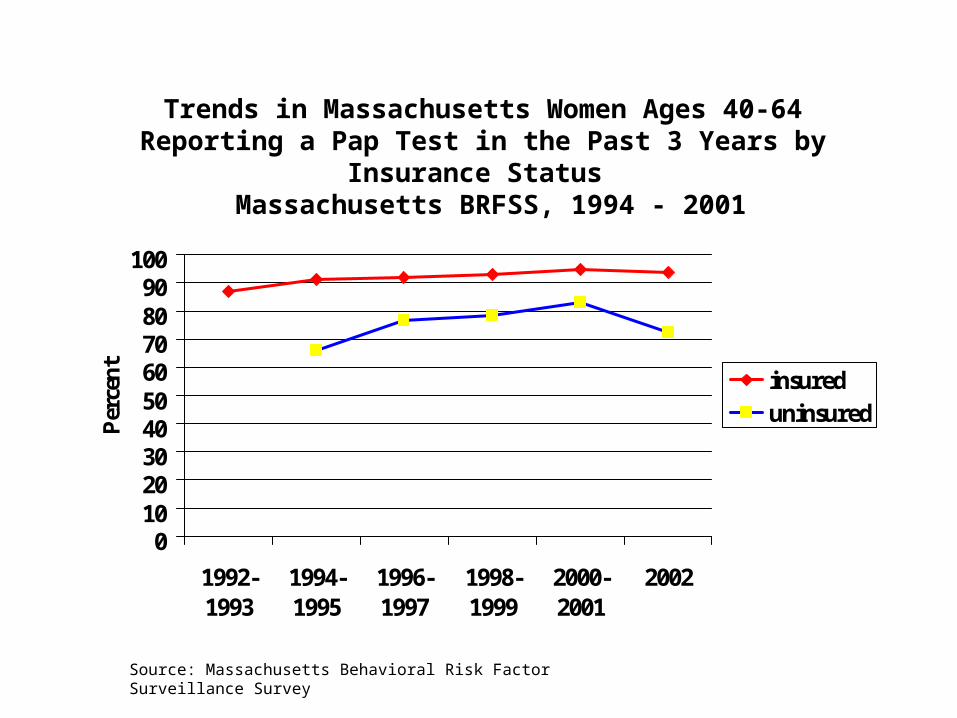
Trends in Massachusetts Women Ages 40-64 Reporting a Pap Test in the Past 3 Years by Insurance Status
Massachusetts BRFSS, 1994 - 2001
0102030405060708090
100
1992-1993
1994-1995
1996-1997
1998-1999
2000-2001
2002
Per
cen
t
insureduninsured
Source: Massachusetts Behavioral Risk Factor Surveillance Survey