Embed Size (px)
Citation preview

1
Elie Bellevrat* , Alban Kitous* , Bertrand Château*
* ENERDATA – Grenoble (France)
The role of Hydrogen in Long-Term Energy System: An Updated Quantitative Analysis with the POLES Model
IEW 2009IEW 2009Parallel Session 8 : Technology Learning & Diffusion
Venice - 19 June 2009

IEW 2009 – Venice, 19 June 2009
ENERDATA expertise in the Global Energy & Carbon Economy
2
Information
Services
Forecasts
& Model
Design
Policy,
Economic &
Financial
Analysis
Business
Consulting
> ENERDATA is a private independent company , incorporated in 1991
> Consulting and information services company specialized in the energy and environment sectors.
> Experienced engineers, economists, statisticians and analysts
> In-house databases, models and methodologies

IEW 2009 – Venice, 19 June 2009
OUTLINE
1. Updated hydrogen scenarios using POLES model2. Diffusion process of hydrogen in the transport syst em3. Oil supply constraint scenarios :
The potential role of hydrogen on international oil markets4. Climate policy scenarios :
The potential role of hydrogen on mitigation strate gies
3

IEW 2009 – Venice, 19 June 2009
Outline
1. Updated hydrogen scenarios using POLES model
4

IEW 2009 – Venice, 19 June 2009
Main features of POLES model
> Partial-equilibrium world model of the energy sector– Recursive (year-by-year) simulation of energy demand and supply with
endogenous international energy prices (Kitous et al, 2009)– Hierarchical structure of interconnected sub-models at the international,
regional and national level (47 regions and 15 demand sectors)– Allows for energy and climate policies evaluation
> Substantial technological description for power and H2 production, including endogenous technological learning (TFLC)
> Increasing technological detail in the demand side : road transport , buildings, industry
> Mostly mid/long-term & policy-oriented studies :
– National and international institutions– R&D and Strategy Department of key corporate actors (energy,
industry)
5

IEW 2009 – Venice, 19 June 2009
Technological development
A « multi-issues » analytical model
National / sub-regional issues (47 countries)
National / sub-regional issues (47 countries)
Transformation / secondary fuels
Transformation / secondary fuels
Final demand (energy & materials)
Final demand (energy & materials)
International issues:
energy supply (71 countries)
6
(t)
(t)
International prices (t+1)
GHG ABATEMENT POLICIES
> POLES : Prospective Outlook on Long-term Energy Systems

IEW 2009 – Venice, 19 June 2009
A technological outlook of hydrogen in transport : the PROTEC-H2 project
> PROTEC-H2 is a project funded by the French National Research Agency (ANR) in the framework of the 2005 Edition of its Hydrogen Program (PAN-H) ; coordinated by Enerdata
> Many French industrial and institutional partners are involved: CNRS (LEPII and CIRED), EDF, CEA, ADEME, IFP and BRGM, to share their expert views on key hydrogen technologies
> Twofold objective:– Organize the techno-economic information on hydrogen chains
for transport (hydrogen technologies from production to final use in vehicle) into an homogenous, rigorous and shareable database
– Insert an original economic and technological outlook of hydrogen in transport (and its competitors) through H2 deployment scenarios quantified with the POLES model
7
IEW 2009 – Venice, 19 June 2009
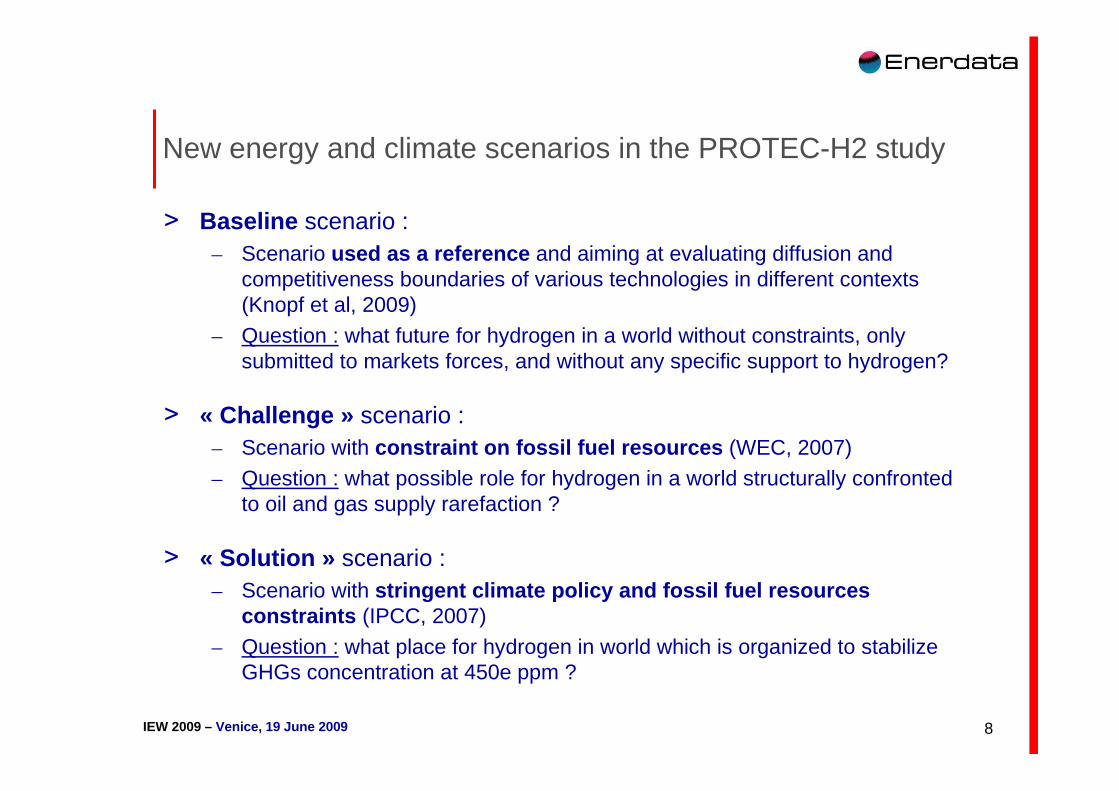
> Baseline scenario : – Scenario used as a reference and aiming at evaluating diffusion and
competitiveness boundaries of various technologies in different contexts (Knopf et al, 2009)
– Question : what future for hydrogen in a world without constraints, only submitted to markets forces, and without any specific support to hydrogen?
> « Challenge » scenario : – Scenario with constraint on fossil fuel resources (WEC, 2007)– Question : what possible role for hydrogen in a world structurally confronted
to oil and gas supply rarefaction ?
> « Solution » scenario : – Scenario with stringent climate policy and fossil fuel resources
constraints (IPCC, 2007)
– Question : what place for hydrogen in world which is organized to stabilize GHGs concentration at 450e ppm ?
New energy and climate scenarios in the PROTEC-H2 study
8

IEW 2009 – Venice, 19 June 2009
> 3 variants for the « Challenge » and « Solution » scenarios– « H2 » and « Ele » : technology breakthrough on hydrogen or electricity
demand technologies in transport, supposing fast and substantial progress in some technology clusters due to network effects (Criqui and Mima, 2008)
– « H2+ » : same as “H2” + fiscal incentives and specific R&D policies devoted to the emergence of hydrogen as a new energy carrier in transport
> Summary of the scenarios and variants :
Hydrogen and electricity variants in transport
Baseline
scenario
"Challenge"
scenario
"Solution"
scenario
Base X X X
"H2" variant X X
"H2 +" variant X X
"Ele" variant X X
9
* Oil supply
constraint
** Oil supply
constraint
+ Climate policy
* **
IEW 2009 – Venice, 19 June 2009
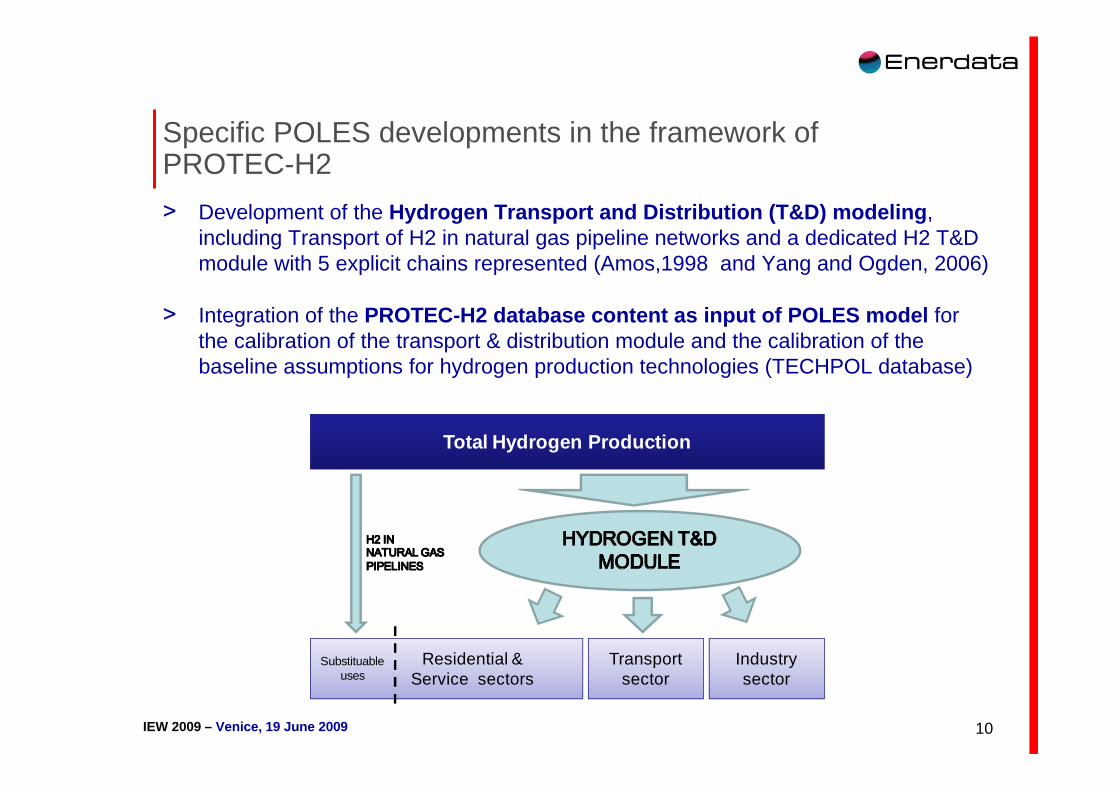
Specific POLES developments in the framework of PROTEC-H2
> Development of the Hydrogen Transport and Distribution (T&D) modeling , including Transport of H2 in natural gas pipeline networks and a dedicated H2 T&D module with 5 explicit chains represented (Amos,1998 and Yang and Ogden, 2006)
> Integration of the PROTEC-H2 database content as input of POLES model for the calibration of the transport & distribution module and the calibration of the baseline assumptions for hydrogen production technologies (TECHPOL database)
10
Total Hydrogen Production
Residential & Service sectors
Transportsector
Industrysector
Substituableuses
IEW 2009 – Venice, 19 June 2009
Outline
2. Diffusion process of hydrogen in the transport system
11
IEW 2009 – Venice, 19 June 2009
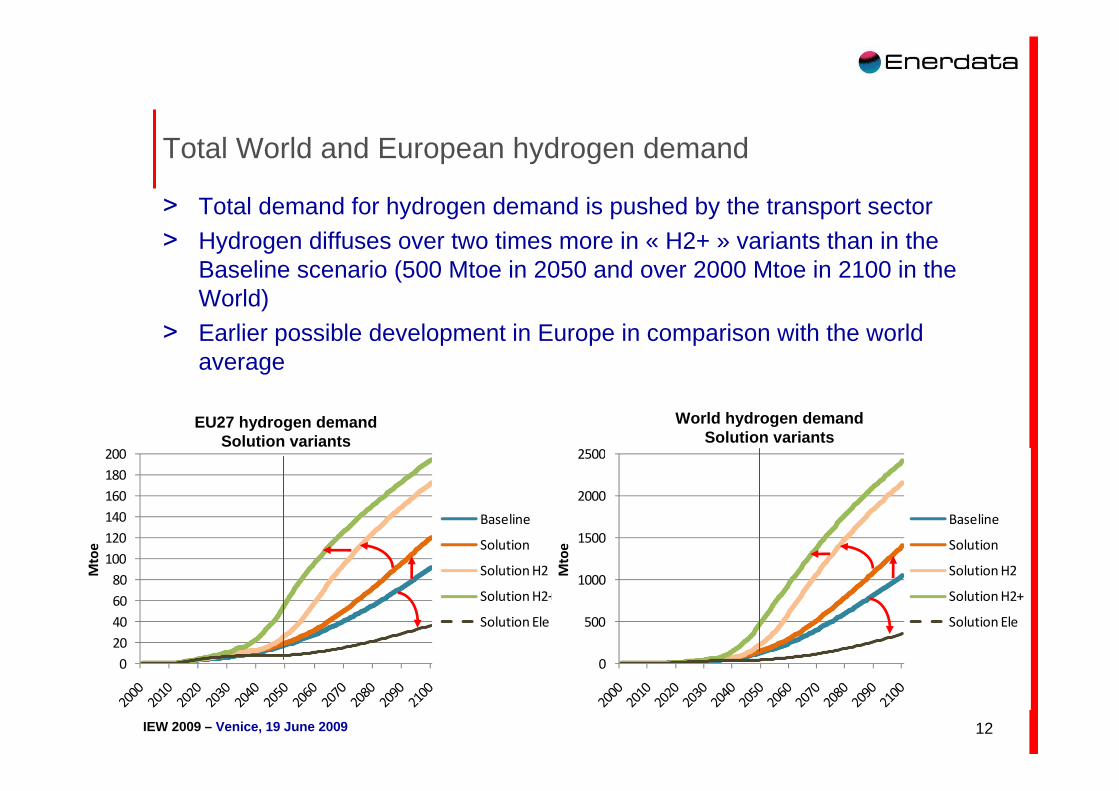
Total World and European hydrogen demand
> Total demand for hydrogen demand is pushed by the transport sector> Hydrogen diffuses over two times more in « H2+ » variants than in the
Baseline scenario (500 Mtoe in 2050 and over 2000 Mtoe in 2100 in the World)
> Earlier possible development in Europe in comparison with the world average
12
World hydrogen demandSolution variants
0
20
40
60
80
100
120
140
160
180
200
Mto
e
Baseline
0
20
40
60
80
100
120
140
160
180
200
Mto
e
Baseline
Solution
0
20
40
60
80
100
120
140
160
180
200
Mto
e
Baseline
Solution
Solution H2
0
20
40
60
80
100
120
140
160
180
200
Mto
e
Baseline
Solution
Solution H2
Solution H2+
0
20
40
60
80
100
120
140
160
180
200
Mto
e
Baseline
Solution
Solution H2
Solution H2+
Solution Ele
EU27 hydrogen demandSolution variants
0
500
1000
1500
2000
2500
Mto
eBaseline
0
500
1000
1500
2000
2500
Mto
e
Baseline
Solution
0
500
1000
1500
2000
2500
Mto
e
Baseline
Solution
Solution H2
0
500
1000
1500
2000
2500
Mto
e
Baseline
Solution
Solution H2
Solution H2+
0
500
1000
1500
2000
2500
Mto
e
Baseline
Solution
Solution H2
Solution H2+
Solution Ele

IEW 2009 – Venice, 19 June 2009
Main drivers for increasing hydrogen use in transport
> Main factors driving the emergence of hydrogen-energy in road transport :– In the medium term : R&D and Fiscal policies– In the very long-term : Network effects (incl. other optimistic assumptions)
> Climate policies do not favor hydrogen in the medium term> Constraints on fossil fuel resources have a larger impact on hydrogen
development over time
13
Drivers for hydrogen-energy development in the Solu tion “H2+” scenarios (in comparison with Baseline)
6%
24%
70%
2050
Fossil fuel constraint
Climate policy constraint
Network effects
Fiscal and R&D policies
19%
7%
55%
19%
2100
Fossil fuel
constraint
Climate policy
constraint
Network
effects
Fiscal and R&D
policies

IEW 2009 – Venice, 19 June 2009
World demand for hydrogen in 2050 – comparison with other studies
> In 2050, world hydrogen demand in PROTEC-H2 scenarios are in line with the AIE-MAP scenarios even if less contrasted (around 400 Mtep)
> In 2100, PROTEC-H2 scenarios stand in the lower range of the literature (1000 Mtoe to 7000 Mtoe)
14
0
200
400
600
800
1000
1200
Protec-H2
Baseline
Protec-H2
Solution Ele
Protec-H2
Solution H2
Protec-H2
Solution H2+
AIE - BASE AIE - MAP AIE - MAP
(Low)
AIE - MAP
(High)
WETO-H2 -
Ref. case
WETO-H2 -
H2i case
Mto
e
World hydrogen-energy demand by 2050

IEW 2009 – Venice, 19 June 2009
Diffusion of hydrogen vehicles – Comparison with HyWays
> Solution «H2+», the most optimistic PROTEC-H2 scenario for hydrogen, is close to the most pessimistic HyWays scenario for light hydrogen vehicles in Europe (ie. around 40% of vehicle stocks by 2050)
0%
10%
20%
30%
40%
50%
60%
70%
2020 2030 2050
Protec-H2 Baseline
Protec-H2 Solution Ele
Protec-H2 Solution H2
Protec-H2 Solution H2+
HyWays (Optimiste)
HyWays (Pessimiste)
HLG, 2003
Market share of hydrogen light vehicles in Europe
15

IEW 2009 – Venice, 19 June 2009
Diffusion of hydrogen vehicles in 2050 – Comparison with other studies
> PROTEC-H2 is in the lower range given by the literature , but this is not an official road-map or a partisan study
16
0%
10%
20%
30%
40%
50%
60%
70%
80%
Protec-H2
Baseline
Protec-H2
Solution
H2
Protec-H2
Solution
H2+
AIE - MAP AIE - MAP
(haut)
ADEME H2
(bas)
ADEME H2
(haut)
Barreto et
al. (2003) -
IPCC SRES
B1-H2*
Azar et al.
(2003) -
Low FC
cost
* In the total road transport
Market share of hydrogen light vehicles (World, 205 0)

IEW 2009 – Venice, 19 June 2009
Diffusion of alternative vehicles in the PROTEC-H2 scenarios
> Alternative vehicles already diffuse in the Baseline scenario => reflects current tendency with the emergence of hybrid/electric cars ?
> Diffusion of hydrogen vehicles is delayed by 10 to 20 years in the « H2+ » variant in comparison with electric vehicles in the « Ele » variants
17
2000 2020 2030 2040 2050 2060 2070 2080 2090 2100
Total alternative vehicles (Baseline) 0% 2% 11% 25% 38% 47% 53% 58% 62% 67%
of which Hybrid vehicles 0% 1% 7% 15% 22% 27% 29% 30% 30% 30%
of which Electric vehicles 0% 1% 3% 8% 12% 14% 15% 15% 16% 16%
of which Thermal H2 vehicles 0% 0% 1% 2% 4% 5% 6% 8% 9% 11%
of which Fuel Cell H2 vehicles 0% 0% 0% 0% 0% 1% 3% 5% 7% 10%
Total electric vehicles (Solution Ele) 0% 3% 40% 75% 89% 94% 96% 97% 98% 98%
of which Electric vehicles 0% 1% 16% 34% 47% 55% 61% 66% 71% 74%
of which Hybrid vehicles 0% 2% 25% 41% 42% 39% 35% 31% 27% 24%
Total hydrogen vehicles (Solution H2+) 0% 0% 2% 12% 41% 60% 71% 77% 82% 86%
of which Thermal H2 vehicles 0% 0% 2% 3% 3% 3% 3% 3% 3% 3%
of which Fuel Cell H2 vehicles 0% 0% 0% 9% 38% 56% 68% 74% 79% 83%
Market share of alternative light vehicles (World)

IEW 2009 – Venice, 19 June 2009
Energy consumption in road transport : Baseline scenario
> New energy carriers do appear from 2030
> Electricity and hydrogen consumption remain under which of conventional fuels in the very long-term
> Total consumption peaks at the very end of the period at 3400 Mtoe (in Europe it is peaking by 2020, slightly above 300 Mtoe)
18
0
500
1000
1500
2000
2500
3000
3500
4000
Mto
e
Hydrogen
Electricity
Biofuel
Oil
0
50
100
150
200
250
300
350
Mto
e
Hydrogen
Electricity
Biofuel
Oil
World road transport energy demand
European road transport energy demand

IEW 2009 – Venice, 19 June 2009
0
500
1000
1500
2000
2500
3000
3500
4000
Mto
e
Hydrogen
Electricity
Biofuel
Oil
Baseline
0
500
1000
1500
2000
2500
3000
3500
4000
Mto
e
Hydrogen
Electricity
Biofuel
Oil
Baseline
Energy consumption in road transport : Solution « H2+ » and Solution « Ele » variants> Solution « H2 »
– Lock-in of hydrogen energy carrier in road transport from 2040 (with residual electricity in the fuel mix)
– Improved tank-to-weel efficiency with hydrogen and fuel price effect (1000 Mtoe less than the Baseline by 2100)
> Solution « Ele »– Same kind of development than hydrogen but earlier for electricity (from 2025)
– Better global efficiency than with hydrogen (500 Mtoe less than « H2+ » by 2100)
19
World road transport energy demand – Solution “Ele”
World road transport energy demand – Solution “H2+”

IEW 2009 – Venice, 19 June 2009
Outline
3. Oil supply constraint scenarios :The potential role of hydrogen on international oil markets
20

IEW 2009 – Venice, 19 June 2009
Oil supply constraints in the Challenge and Solution scenarios
> Oil production capacity in Gulf countries limited to 23 Mbl/d :
=> short/medium-term impact on oil markets> Long-term recoverable oil resources halved compared to Baseline:
in 2000: 2000 Gbl against 4000 Gbl* (assumption);
in 2100: 400 Gbl against 1400 Gbl (result from POLES)
=> long-term impact on oil markets* corresponds to long term URRs including EOR
21
0
5
10
15
20
25
30
35
40
45
Mb
l/d
Baseline
Solution
Solution H2
Solution H2+
Solution Ele
Oil production capacity in Gulf Persian countries in the Solution variants :

IEW 2009 – Venice, 19 June 2009
0
50
100
150
200
250
300
350
400
450
500
$(0
5)/
bl
Baseline
0
50
100
150
200
250
300
350
400
450
500
$(0
5)/
bl Baseline
Solution
0
50
100
150
200
250
300
350
400
450
500
$(0
5)/
bl
Baseline
Solution
Solution H2
0
50
100
150
200
250
300
350
400
450
500
$(0
5)/
bl
Baseline
Solution
Solution H2
Solution H2+
0
50
100
150
200
250
300
350
400
450
500
$(0
5)/
bl
Baseline
0
50
100
150
200
250
300
350
400
450
500
$(0
5)/
bl Baseline
Challenge
0
50
100
150
200
250
300
350
400
450
500
$(0
5)/
bl
Baseline
Challenge
Challenge H2
International oil price in the PROTEC-H2 scenarios
> In the short term (< 2020): the equilibrium price for oil in Challenge and Solution variants is 20$ over the Baseline due to oil supply constraint
> In the medium term (2020-2035): high volatility of price due to oil supply constraint in Challenge but not in Solution thanks to the carbon constraint ; still no impact of hydrogen
> In the longer term (>2035): massive development of hydrogen allows limiting the dramatic oil price increase in Challenge ; but only the carbon constraint (Solution) allow stabilizing oil price and limits its volatility
22
0
50
100
150
200
250
300
350
400
450
500
$(0
5)/
bl
Baseline
Challenge
Challenge H2
Challenge H2+
International oil price – « Challenge » variants Interna tional oil price – « Solution » variants

IEW 2009 – Venice, 19 June 2009
The role of hydrogen and electricity on oil markets
> Hydrogen clearly pacifies oil markets and allow containing price volatility and increasing trends, overall in the long-term
> However, when comparing to electricity variants, the impact of hydrogen is delayed by 10 to 20 years
> After 2050, the hydrogen role on oil market is more important and could even be larger than the electricity
International oil price – « Challenge » variants Interna tional oil price – « Solution » variants
23
0
20
40
60
80
100
120
140
160
180
$(0
5)/
bl
Baseline
Challenge
IEA (WEO,2008)
IEA (WEO,2007)
0
20
40
60
80
100
120
140
160
180
$(0
5)/
bl
Baseline
Challenge
Challenge H2+
IEA (WEO,2008)
IEA (WEO,2007)
0
20
40
60
80
100
120
140
160
180
$(0
5)/
bl
Baseline
Challenge
Challenge H2+
Challenge Ele
IEA (WEO,2008)
IEA (WEO,2007)
0
20
40
60
80
100
120
140
160
180
$(0
5)/
bl
Baseline
Solution
IEA (WEO,2008)
IEA (WEO,2007)
0
20
40
60
80
100
120
140
160
180
$(0
5)/
bl
Baseline
Solution
Solution H2+
IEA (WEO,2008)
IEA (WEO,2007)
0
20
40
60
80
100
120
140
160
180
$(0
5)/
bl
Baseline
Solution
Solution H2+
Solution Ele
IEA (WEO,2008)
IEA (WEO,2007)

IEW 2009 – Venice, 19 June 2009
Outline
4. Climate policy scenarios :The potential role of hydrogen on mitigation strategies
24

IEW 2009 – Venice, 19 June 2009
World GHG emissions
> Solution scenario aims at stabilizing concentration at 450 ppm CO2e ; only the carbon constraint allow reducing dramatica lly GHGs emissions
> Without carbon constraint, some transport fuel substitution effect , allows reducing slightly GHG emissions in the Challenge « H2 »variants
25
0
10
20
30
40
50
60
70
80
90
GtC
O2e
Baseline
Challenge
Challenge H2
Challenge H2+
Challenge Ele
0
10
20
30
40
50
60
70
80
90
GtC
O2e
Baseline
Solution
Solution H2
Solution H2+
Solution Ele
World GHG emissions path« Challenge » variants
World GHG emissions path« Solution » variants
IEW 2009 – Venice, 19 June 2009
Carbon constraint in the « Solution » variants
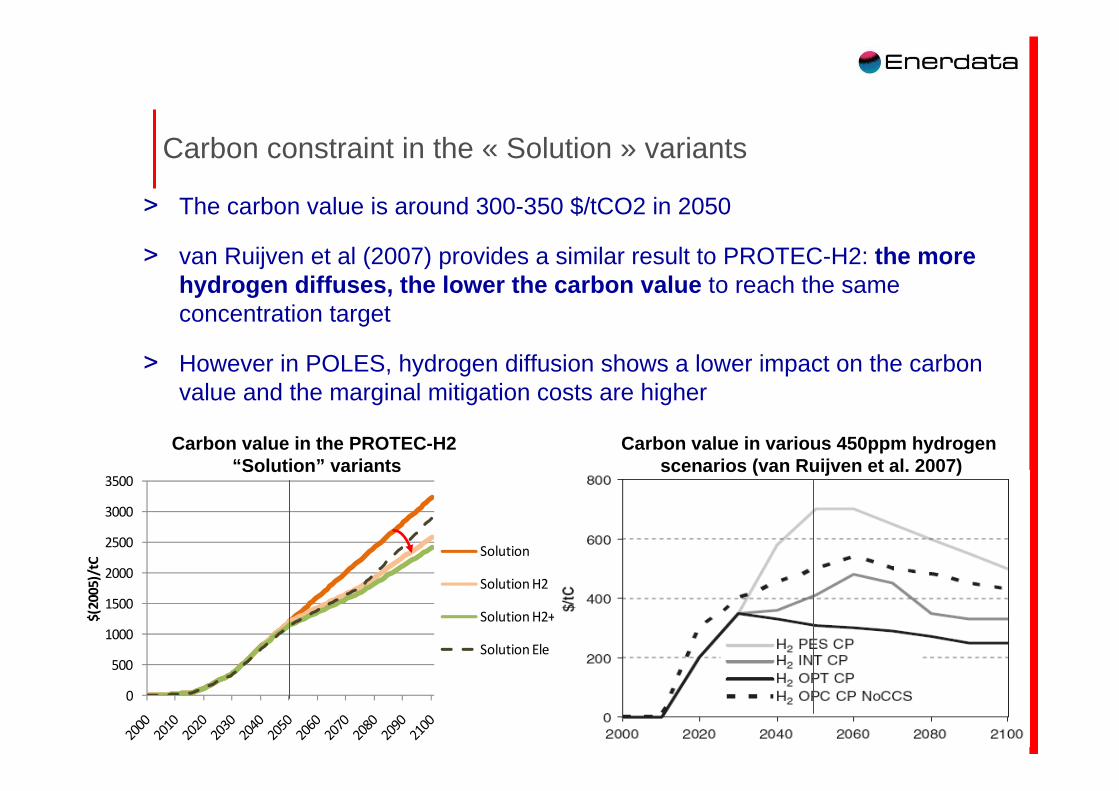
> The carbon value is around 300-350 $/tCO2 in 2050
> van Ruijven et al (2007) provides a similar result to PROTEC-H2: the more hydrogen diffuses, the lower the carbon value to reach the same concentration target
> However in POLES, hydrogen diffusion shows a lower impact on the carbon value and the marginal mitigation costs are higher
26
0
500
1000
1500
2000
2500
3000
3500
$(2
00
5)/
tC
Solution
Solution H2
Solution H2+
Solution Ele
Carbon value in various 450ppm hydrogen scenarios (van Ruijven et al. 2007)
Carbon value in the PROTEC-H2 “Solution” variants

IEW 2009 – Venice, 19 June 2009
Global mitigation cost in the « Solution » variants
> The global cost in the energy sector to reach the long-term concentration target illustrates the possible advantage of hydrogen on electricity in the very long-term
> This reveals it could be more efficient to build “greenfield” hydrogen capacities than transforming existing patterns which are beard by historical investment decisions
27
0,0%
0,5%
1,0%
1,5%
2,0%
2,5%
Solution
Solution H2
Solution H2+
Solution Ele
NB : global mitigation cost is calculated by integrating the marginal abatement cost curves
Global mitigation cost (in % of the world GDP)
IEW 2009 – Venice, 19 June 2009
0
100
200
300
400
500
600
700
800
900
1000
MtC
O2
Baseline
Challenge
Challenge H2
Challenge H2+
Challenge Ele
0
100
200
300
400
500
600
700
800
900
1000
MtC
O2
Baseline
Solution
Solution H2
Solution H2+
Solution Ele
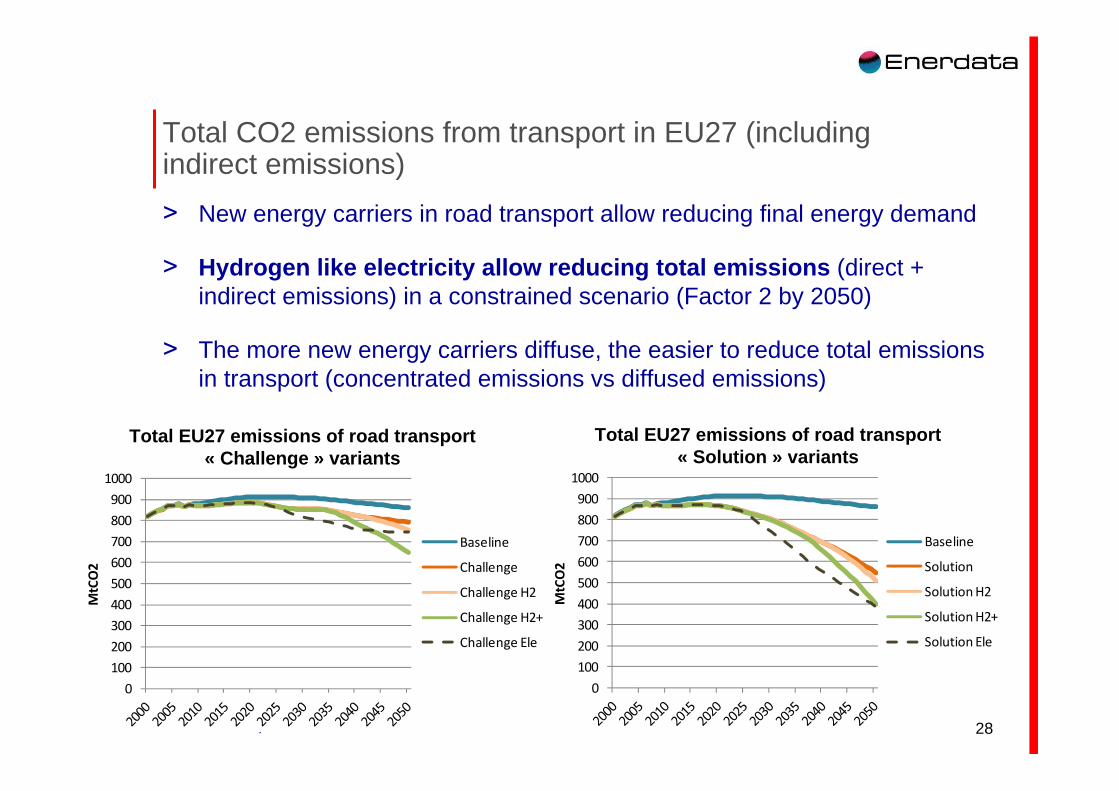
Total CO2 emissions from transport in EU27 (including indirect emissions)
> New energy carriers in road transport allow reducing final energy demand
> Hydrogen like electricity allow reducing total emis sions (direct + indirect emissions) in a constrained scenario (Factor 2 by 2050)
> The more new energy carriers diffuse, the easier to reduce total emissions in transport (concentrated emissions vs diffused emissions)
Total EU27 emissions of road transport« Challenge » variants
28
Total EU27 emissions of road transport« Solution » variants

IEW 2009 – Venice, 19 June 2009
0%
20%
40%
60%
80%
100%
HyWays, 10MS
Stakeholders
vision
Protec-
H2, EU27
Challenge H2+
Protec-
H2, EU27
Solution H2+
Solar HT
Biomass
Wind
Electricity grid
Nuclear
Natural gas
Coal
Co-products
0%
20%
40%
60%
80%
100%
HyWays, 10MS
Least-cost
solution
HyWays, 10MS
Failure of CCS
HyWays, 10MS
Climate Policy
Protec-
H2, EU27
Challenge H2+
Protec-
H2, EU27
Solution H2+
Solar HT
Biomass
Wind
Nuclear
Coal / Gas
Others
NB : all HyWays scenarios assumes 35% emissions reduction over the 1990-2050 period, which is an intermediate objective to the Challenge et Solution scenarios; only the HyWays Climate Policy scenario considers 80% emission reduction on the 1990-2050 period (close to Solution)
Hydrogen production mix in 2050 – Comparison with HyWays
> PROTEC-H2 scenarios are close to the HyWays « Stakeholders vision »
> MARKAL’s response to the carbon constraint is a massive development of hydrogen based on wind energy
29

IEW 2009 – Venice, 19 June 2009
Hydrogen production mix in 2050 – Comparison with Barreto et al. (2003)
> In Barreto et al. (2003), hydrogen based on natural gas and biomass (+solar) contributes emission mitigation in transport
> For POLES, dedicated HT nuclear (electrolysis and thermo-chemical cycles) and biomass gasification are the preferred technologies for hydrogen production in a climate policy scenario
30
0%
20%
40%
60%
80%
100%
Barreto et al.
(2003)
Scénario B1-H2
Protec-H2
Challenge H2+
Protec-H2
Solution H2+
Coal gasification
Oil Partial Oxidation
Gas steam reforming
Biomass gasification
Electrolysis alk.
Nuclear HTR
Other renewables
0%
20%
40%
60%
80%
100%
Barreto et al.
(2003)
Scénario B1-H2
Protec-H2
Challenge H2+
Protec-H2
Solution H2+
Coal gasification
Oil Partial Oxidation
Gas steam reforming
Biomass gasification
Electrolysis alk.
Nuclear HTR
Other renewables
NB : The IIASA SRES-B1 Scenario is environment-friendly with high technological growth content and contained demography
2050 2100
IEW 2009 – Venice, 19 June 2009
Outline
Conclusion
31

IEW 2009 – Venice, 19 June 2009
The potential role of hydrogen in long-term energy system
The study showed a potential role of hydrogen in the long-term energy system, which can be twofold:
Role on oil markets :Hydrogen could potentially stabilize international markets in the very long-term, both in terms of volatility and increasing trend ; howeverin the short term electricity could have a larger impact on oil price
Role in global emissions mitigation :• Without climate policy, hydrogen do not participate to the
resolution of the climate change issue• However hydrogen could help reducing global mitigation costs
in a constrained world, and could even be more efficient than electricity in the long-term
IEW 2009 – Venice, 19 June 2009
Long-term hydrogen diffusion in road transport
> The prospective analysis allowed stressing numerous barriers to massive diffusion of hydrogen in transport , which may stand in:– Demand technologies cost and performance (Fuel Cells) – Infrastructure development (storage and T&D chains)
– Availability of primary materials (like platinum in FC)– Other social barriers
> In a larger perspective, electricity and hydrogen are possibly complementary in transport , for instance through integration in electric vehicles of H2 Fuel-Cells, used as range-extenders
> Demand-side system innovations , which can be organizational or institutional, could also favor new energy carriers in transport, e.g. through the large scale emergence of new “light urban” vehicles (downsizing of the demand)

IEW 2009 – Venice, 19 June 2009
Selection of recent research projects and studies
> PACT (2008-2011). PAthways for Carbon Transition. EC – 7th FP. http://www.pact-carbon-transition.org .
> ADAM (2006-2009). ADaptation And Mitigation. EC - 6th FP. http://www.adamproject.eu . (Final report published in May 2009).
> WEC (2006-2007). World energy forecasts scenarios by world region. Report for the World Energy Council. http://www.worldenergy.org/publications/energy_policy_scenarios_to_2050/default.asp .
> PROTEC-H2 (2005-2008). PROspective TEChnological and Economic Outlook of Hydrogen-energy. French ANR project. PAN-H program - Edition 2005.
> IDDRI-EpE (2004-2008). Scenarios under carbon constraint : What's at stake for heavy industries? Report for IDDRI-EpE. http://www.iddri.org/Publications/Rapports-and-briefing-papers/Scenarios-for-transition-towards-a-low-carbon-world-in-2050-What%27s-at-stake-for-heavy-industries
> WETO-H2 (2004-2005). World Energy Technology Outlook to 2050, for EC - DG-RTD, http://ec.europa.eu/research/fp6/ssp/weto_h2_en.htm (published in 2007).
34