Embed Size (px)
Citation preview

Elias Jabbour, MDUniversity of Texas – M. D. AndersonCancer Center
CML and Imatinib Resistance: Which TKI and When?

CML and Imatinib Resistance: Which TKI and When?
Marcos de Lima, MD
Stem Cell Transplantation ProgramCase Western Reserve University
University Hospitals Seidman Cancer CenterCleveland - OH

Results with Imatinib in Early CP CML – The IRIS Trial at 8-Years
• 304 (55%) patients on imatinib on study• Projected results at 8 years:
–CCyR 83%• 82 (18%) lost CCyR, 15 (3%) progressed to
AP/BP
–Event-free survival 81%–Transformation-free survival 92%
• If MMR at 12 mo: 100%
–Survival 85% (93% CML-related)• Annual rate of transformation: 1.5%, 2.8%,
1.8%, 0.9%, 0.5%, 0%, 0%, & 0.4%
Deininger et al; Blood 2009; 114: Abst# 1126
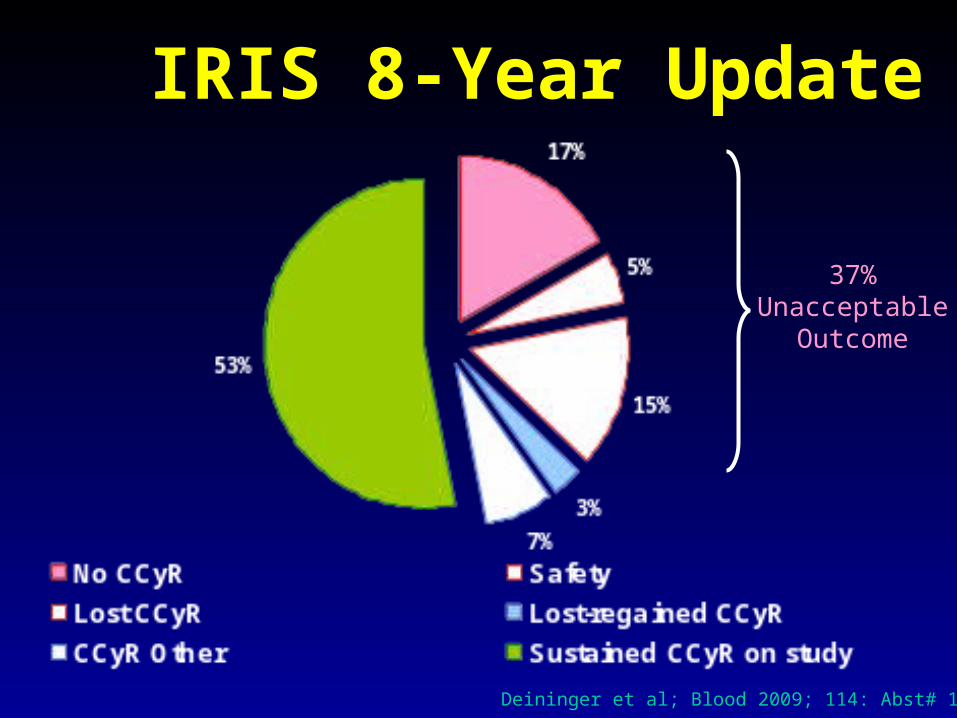
IRIS 8-Year Update
37%Unacceptable
Outcome
Deininger et al; Blood 2009; 114: Abst# 1126
5
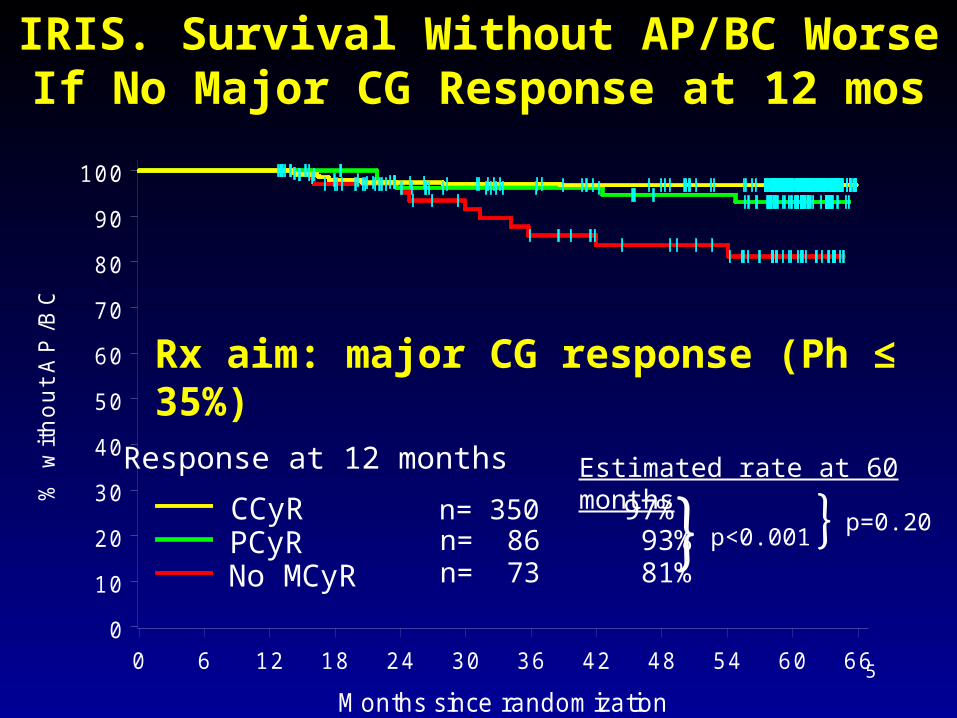
IRIS. Survival Without AP/BC Worse If No Major CG Response at 12 mos
Estimated rate at 60 months
n= 86 93%n= 73 81%
n= 350 97% p<0.001 p=0.20CCyRPCyRNo MCyR
Response at 12 months
% w
ithou
t AP
/BC
0
10
20
30
40
50
60
70
80
90
100
Months since randomization0 6 12 18 24 30 36 42 48 54 60 66
Rx aim: major CG response (Ph ≤ 35%)

Criteria for Failure and Suboptimal Response to Imatinib
Time (mo)
Response
Failure Suboptimal Optimal
3 No CHR No CG Response < 65% Ph+
6 No CHR>95% Ph+ ≥35% Ph+ ≤35% Ph+
12 ≥35% Ph+ 1-35% Ph+ 0% Ph+
18 ≥5% Ph+ No MMR MMR
Any
Loss of CHRLoss of CCgR
MutationCE
Loss of MMRMutation
Stable or improving
MMR
Baccarani. JCO 2009; 27: 6041-51
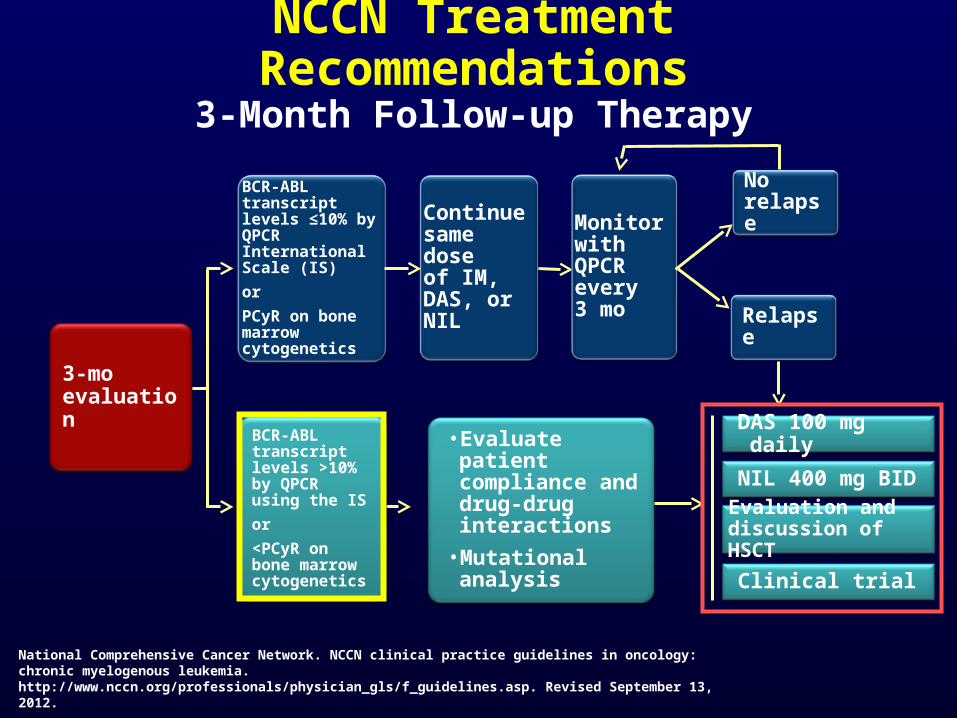
NCCN Treatment Recommendations3-Month Follow-up Therapy
BCR-ABL transcript levels ≤10% by QPCR International Scale (IS)
or
PCyR on bone marrow cytogenetics
BCR-ABL transcript levels >10% by QPCR using the IS
or
<PCyR on bone marrow cytogenetics
Continue same dose
of IM, DAS, or NIL
• Evaluate patient compliance and drug-drug interactions
• Mutational analysis
Monitor with QPCR every 3 mo
DAS 100 mg daily
NIL 400 mg BID
Evaluation and discussion of HSCT
Clinical trial
3-moevaluation
National Comprehensive Cancer Network. NCCN clinical practice guidelines in oncology: chronic myelogenous leukemia. http://www.nccn.org/professionals/physician_gls/f_guidelines.asp. Revised September 13, 2012.
No relapse
Relapse

Adherence Is the Most Important Factor Contributing to Molecular Responses
Marin D et al. J Clin Oncol. 2010;28(14):2381-2388.
Adherence monitored over a period of 3 months using a microelectronic monitoring device in the imatinib bottle cap. Patients were not aware of the device.
0.1
12
Time Since Start of Imatinib Therapy (months)
1.0
0.9
0.8
0.7
0.6
0.5
0.4
0.3
0.2
0 6 18 24 30 36 42 48 54 60 66 72
Pro
bab
ility
of
MM
RAdherence >90% (n = 64) Adherence ≤90% (n = 23)
P<0.001

EFS by Response to IM at 6 and 12 Mos
0 12 24 36 48 60 72
Months
0.0
0.1
0.2
0.3
0.4
0.5
0.6
0.7
0.8
0.9
1.0
Failure Suboptimal Optimal
p<0.0001
No.9
10240
Events (%)6 (67)5 (50)14 (6)
0 12 24 36 48 60 72
Months
0.0
0.1
0.2
0.3
0.4
0.5
0.6
0.7
0.8
0.9
1.0
Failure Suboptimal
Optimal
p<0.0001
No.1419
213
Evaluable (%)8 (57)3 (16)8 (4)
6 month response 12 month response
•281 pts; imatinib frontline (400mg in 73, 800mg in 208)•Suboptimal response at 6-12 months: 12-17% with
400mg, 1-4% with 800mg (p=0.002)
Alvarado. Cancer. 2009;115:3709-18.
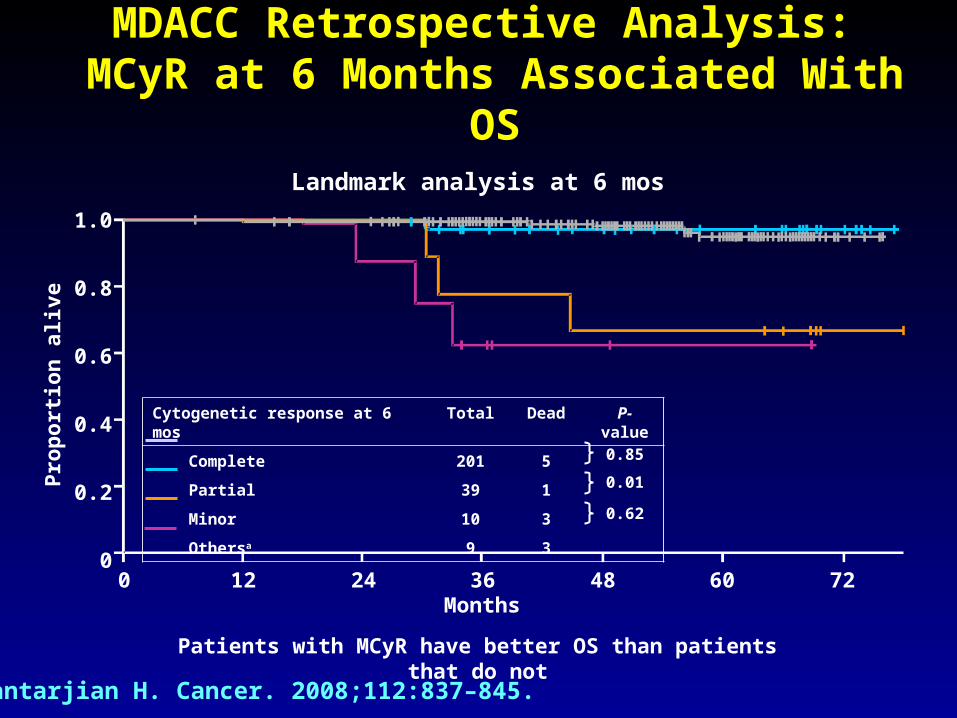
MDACC Retrospective Analysis: MCyR at 6 Months Associated With OS
Patients with MCyR have better OS than patients that do not
Landmark analysis at 6 mos
0 12 24 36 48 60 72
Cytogenetic response at 6 mos Total Dead P-value
Complete 201 5
Partial 39 1
Minor 10 3
Othersa 9 3
0.85
0.01
0.62
1.0
0.8
0.6
0.4
0.2
0
Pro
po
rtio
n a
live
Months
Kantarjian H. Cancer. 2008;112:837–845.

MDACC Retrospective Analysis: CCyR at 12 Months Associated With PFS
Patients with CCyR have better PFS than patients that do not. Similar results were observed in patients achieving CCyR at 18 and 24 mos.
Landmark analysis at 12 mos
Pro
po
rtio
n P
FS
1.0
0.8
0.6
0.4
0.2
00 12 24 36 48 60 72
Months
Cytogenetic response at 12 mos Total Failure P-value
Complete 214 7
Partial 19 3
Minor 5 2
Others 8 5
0.02
0.2
0.22
Kantarjian H. Cancer. 2008;112:837–845.

EFS and Survival by 12-month Response-CCyR with vs without MMR with TKI Frontline Rx
Jabbour E et al. Blood. 2011.

Outcome by 12-Month Response in CML CP
• 848 pts randomized to IM 400mg, IM 800mg, or IM 400 + IFN
• Median FU: 40 months
12-month BCR-ABL/ABL (IS)
NPercentage
PFS OS
<0.1% 341 99 990.1-1% 240 97 98>1% 267 94 93
P value 0.0023 0.0011
• Outcome independent of treatment armHehlman et al. JCO 2011;29:1634-42
CCyR

Pro
bab
ility
of
su
rviv
al
Time from onset of imatinib therapy (years)
BCR-ABL/ABL<9.8% OS= 93.3%
BCR-ABL/ABL>9.8% OS= 54%
p<0.0001
Survival After Imatinib Therapy by Molecular Response Achieved at 3 Months
Marin et al, JCO 2011; [Epub ahead of print]
• Optimal PCR value determined by Receiver operating characteristic (ROC) curve

CML IV: Long-Term Impact of Response at 3 Months
•1223 pts randomized to imatinib 400, imatinib + IFN, imatinib + ara-C, imatinib 800
•3 month analysis: PCR in 692 pts, cytogenetics in 460
•3 mo transcript levels predictive of achievement of CCyR and MMR
% 5-year outcome
Cytogenetics (% Ph+)
Molecular [BCR-ABL/ABL (IS)]
≤35% >35% ≤10% >10%
PFS 94 87 93 87
OS 95 87 95 87
Hanfstein et al. ASH 2011; Abstract #783

OS by Response to TKI at 3 Months at MDACC
Naqvi et al. ASH 2011; Abstract #3784

EFS by Response to TKI at 3 Months at MDACC
Naqvi et al. ASH 2011; Abstract #3784
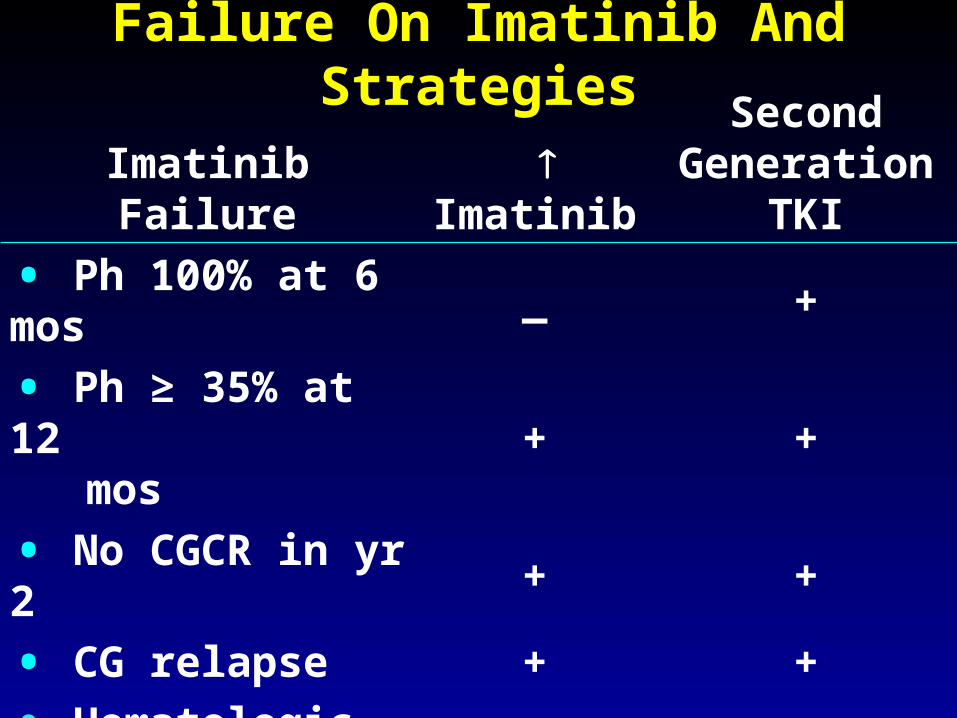
Failure On Imatinib And Strategies
Imatinib Failure Imatinib
Second Generation
TKI
• Ph 100% at 6 mos _ +
• Ph ≥ 35% at 12 mos
+ +
• No CGCR in yr 2 + +
• CG relapse + +
• Hematologic relapse
_+

Imatinib Dose Escalations
% 2-yr
Resistance1,2 No. % CG CR TFS OS
Cytogenetic 63 52 80 90
Hematologic 21 5 51 67
• Similar results from IRIS 3
1Kantarjian Blood 101:473, 2003 2Jabbour Blood 113:2154, 2008 3Kantarjian Cancer 115:551, 2008

2nd Generation TKI in CMLParameter Dasatinib Nilotinib Bosutinib
Potency (fold vs IM) 325 30 20-50
Target Src & Abl Abl Src & ABL
BCR-ABL binding Active + Inactive Inactive Intermediate
Resistant mutations T315I T315I T315I
Mutations with intermediate sensitivity
E255K/V, V299L, F317L
E255K/V, Y253F/H, Q252H, F359V
E255V/K,V299L, F317L
Standard dose (CP) 100mg QD 400mg BID 500mg QD
Grade 3-4 neutropenia & thrombocytopenia
33% / 22% 31% / 33% 12% / 21%
Other notable toxicitiesPleural effusion,
bleedingBilirubin, lipase
elevationDiarrhea, rash
C-kit inhibition (vs imatinib)
Increased Similar None
PDGFR inhibition (vs imatinib)
Increased Similar None
Clinical activity Highly active Highly active Highly active
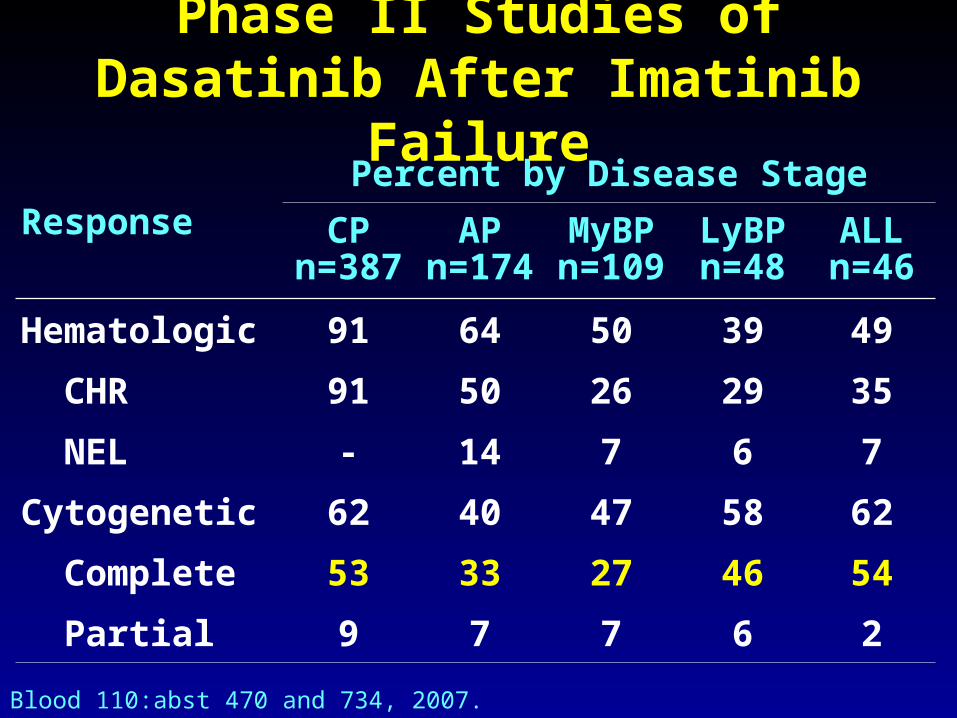
Phase II Studies of Dasatinib After Imatinib Failure
ResponsePercent by Disease Stage
CPn=387
APn=174
MyBPn=109
LyBPn=48
ALLn=46
Hematologic 91 64 50 39 49
CHR 91 50 26 29 35
NEL - 14 7 6 7
Cytogenetic 62 40 47 58 62
Complete 53 33 27 46 54
Partial 9 7 7 6 2
Blood 110:abst 470 and 734, 2007.

Baccarani. Blood 112:abst 450, 2008
Optimal Dose and Schedule of Dasatinib IN CML CP after Imatinib Failure
% Parameter
100mgQD
N=166
50mgBID
N=166
140mgQD
N=163
70mgBID
N=167MCyR 63 61 63 61
CGCR 50 50 50 54
24-months PFS 80 76 75 76
Neutropenia, G3-4 35 47 44 45
Thrombocytopenia, G3-4 23 36 41 38
Pleural effusion, G3-4 2 4 5 5
Interruption 58 66 69 71
Reduction 33 45 54 57
Shah. Blood 112:abst 3225, 2008

Phase II Studies of Nilotinib After Imatinib Failure
Response
Percentage
CPn =321
APn =137
MyBPn =106
LyBPn =30
•HR 77 54 24 20
CHR 76 26 12 13
•Cytogenetic
Major 59 31 38 50
Complete 44 19 28 33
Blood 112:abst 3229, 3238, 2008.

Nilotinib in Chronic Phase CML Post Imatinib Failure
• 321 pts; nilotinib 400 mg BID; median FU 19 mos; median nilotinib 788 mg/D; median days off 20
• Outcome Percent
- CGCR 46
- MMR 28 (56% of CGCR)
- 24-mos PFS 64
- 24-mos OS 87
Kantarjian. Blood 114:abst 1129; 2009

Nilotinib in CML Chronic Phase. Survival and PFS
0
10
20
30
40
50
60
70
80
90
100
0 3 6 9 12 15 18 21 24 27 30 33
Time in mos
84%
73%64%
95% 91% 88%
Kantarjian. Blood 112:abst 3238, 2008
% P
rogr
essi
on-f
ree
surv
ival

Bosutinib in CML-CP post imatinib failure
• 288 pts Rx with bosutinib 500 mg/D: Imatinib resistant 200; intolerant 88
• Parameter Percent -CHR 86
-MCyR 53 -CCyR 41 -MMR if CCyR 64 -2-yr PFS 79 2-yr OS 92
• Side effects: diarrhea 9%, rash 9%
Cortes. Blood 118: 4567;2012

Response to Bosutinib 3rd Line Therapy• Dual Src & Abl inhibitor, no effect over c-kit or
PDGFR• 118 pts who failed imatinib (600mg) & dasatinib
or nilotinib
Response, %
IM + D resistant(n = 37)
IM + D intolerant(n = 50)
IM + NI resistant(n = 27)
CHR 50 80 77MCyR 31 30 32
CCyR 14 28 27PCyR 17 2 8
MMR 3 35 112-yr PFS 22 61 502-yr OS 66 85 100IM, imatinib; D, dasatinib; NI, nilotinib.
Khoury. Blood 119:3403;2012

2nd Generation TKI in CML CP Post-Imatinib Resistance
ResponsePercentage
Dasatinib Nilotinib Bosutinib
FU (mo) >24 >24 24*
CHR 89 77 86
MCyR 59 56 54
CCyR 44 41 41
24 mo PFS** 80% 64% 79%
24 mo OS** 91% 87% 92%* Median** All patients
Shah et al. Haematologica 2010; 95: 232-40Kantarjian et al. Blood 2011; 117: 1141-45
Cortes et al. Blood 2011; 118; 4567-76

2nd-Generation TKI in CML CP Post- Imatinib Failure
Toxicity Dasatinib Nilotinib Bosutinib
Pleural effusion ++ - -
Liver + + +
Transaminases + + ++
Bilirubin - ++ -
Rash + + ++
Diarrhea - - ++Lipase - (+) ++ -
Glucose - ++ -
Hypophosphatemia ++ ++ +
Bleeding + - -
QTc ++ ++ -

2nd-Generation TKI in CML CP Post- Imatinib Failure
Toxicity Dasatinib Nilotinib Bosutinib
Anemia 13 11 13
Neutropenia 35 31 18
Thrombocytopenia 23 30 24
Shah et al. Haematologica 2010; 95: 232-40Kantarjian et al. Blood 2011; 117: 1141-45
Cortes et al. Blood 2011; 118; 4567-76

Better Outcome on Dasatinib with Earlier Intervention
• Patients on dasatinib studies analyzed by failure status on imatinib: loss of MCyR vs loss of CHR
• Status at IM Failure No.Percentage
CCyR MMR
Loss of MCyR 151 72 60
Loss of CHR & MCyR 33 42 29
Loss of CHR (never MCyR) 109 26 26
Quintás-Cardama. Cancer 115: 2912-21, 2009

Dasatinib Early InterventionEFS & OS
Quintás-Cardama. Cancer 115: 2912-21, 2009
Event-Free Survival Overall Survival
Time to intervene: Loss of MCyR

Prognosis with 2nd TKIs. Survival•Adverse factors: PS ≥1 and lack of CyR to imatinib
Jabbour. Blood 117: 1822-7, 2011

No MCyR (27)
MCyR (59)
0
0.2
0.4
0.6
0.8
1
0 12 24 36Months on second TKI
PF
S (
%)
PFS and Response to 2nd TKI
Response @ 12 mo
% AP/BP/Death/CHR loss Next Year
MCyR 3%
No MCyR 17%
• 113 CML CP pts receiving nilotinib (n=43) or dasatinib (n=70) after imatinib failure
Tam. Blood 112: 516-8, 2008
p = 0.003

Optimal Response to 2nd TKIs. Survival
3-year survival (%)
Parameter Event-free Overall
CCyR by 3 months Yes 74 98
No 43 79
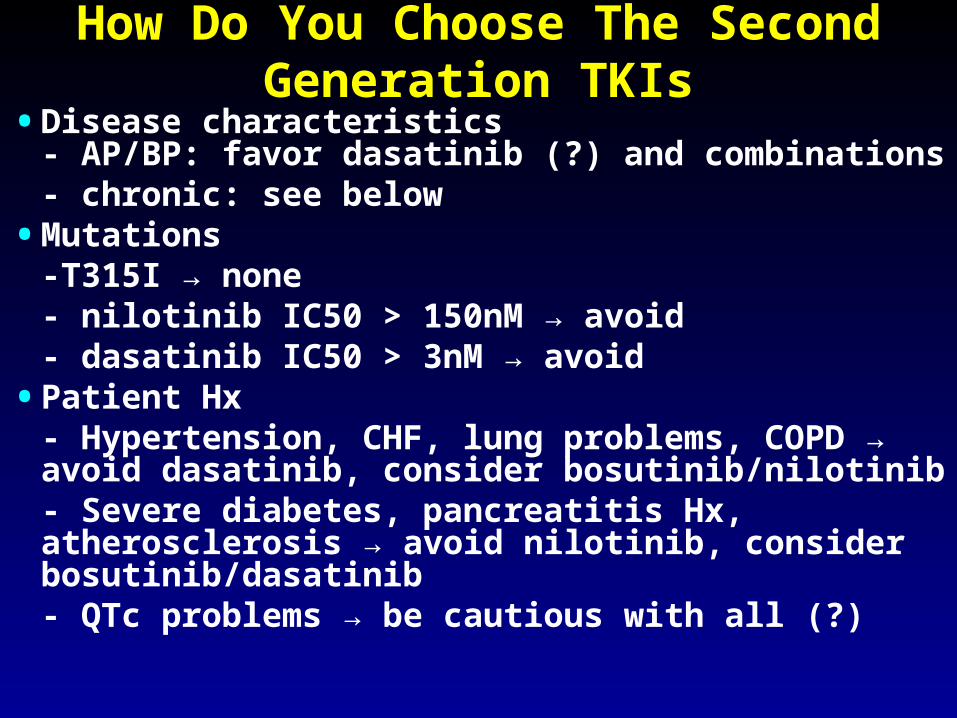
How Do You Choose The Second Generation TKIs
• Disease characteristics- AP/BP: favor dasatinib (?) and combinations- chronic: see below
• Mutations-T315I → none- nilotinib IC50 > 150nM → avoid- dasatinib IC50 > 3nM → avoid
• Patient Hx- Hypertension, CHF, lung problems, COPD → avoid dasatinib, consider bosutinib/nilotinib- Severe diabetes, pancreatitis Hx, atherosclerosis → avoid nilotinib, consider bosutinib/dasatinib - QTc problems → be cautious with all (?)

Ponatinib Phase 2 Study - PACE Response Characteristics CP-CML
• 93% failed ≥2 TKI, 58% failed ≥3 TKIResponse Rate, n (%) N=267Any Cytogenetic Response 180 (67)
MCyR 149 (56) CCyR 124 (46)MMR 91 (34) MR4.5 39 (15)BCR-ABL ≤10% at 3 months, n/N(%) 142/240 (59) 1 prior approved TKI 14/16 (88)Median Time to Response*, months [range]
MCyR 2.8 [1.6 – 11.3]
MMR 5.5 [1.8 – 19.2]
• 91% MCyR sustained at 12 months (K-M)Cortes J, et al. Blood. 2012;120: Abstract 163.

Ponatinib Phase 2 Study - PACE Response by Baseline Mutation CP-CML
Baseline Mutations in at Least 2 Patients (Excluding T315I)
P-Loop Non P-Loop
Nu
mb
er o
f P
atie
nts
MCyR
CP-CMLN=267n/N (%)
R/I, no mutation 66/136 (49)
R/I, any non-T315I mutation
38/67 (57)
T315I mutation 45/64 (70)
Cortes J, et al. Blood. 2012;120: Abstract 163.

Ponatinib Phase 2 Study - PACE Response in Advanced Phase
n (%)
AP-CML N=83
BP-CML N=62Ph+ ALL
N=32Myeloid N=52
Lymphoid N=10
MaHR* 47 (57) 15 (29) 4 (40) 13 (41)
Any CyR** 46 (55) 19 (37) 5 (50) 15 (47)
MCyR 32 (39) 10 (19) 4 (40) 15 (47)
CCyR 20 (24) 8 (15) 3 (30) 12 (38)
MMR# 13 (16) N/A N/A N/A
*MaHR = primary endpoint; 14 AP-CML patients with baseline MaHR and 1 AP-CML patient with no baseline MaHR assessment counted as non-responders **CCyR + PCyR + minor CyR + minimal CyR#MMR was assessed on the International Scale using peripheral blood; Patients missing a valid baseline MMR assessment , or who met the criteria for MMR at baseline, were counted as non-responders
Kantarjian HM, et al. Blood. 2012;120: Abstract 915.

Omacetaxine for CML CP After Failure to ≥2 TKI
• 122 pts with CML CP (n=81) or AP (n=41) with ≥2 prior TKI
• Omacetaxine 1.25 mg/m2 BID x14d, then x7d
Response, % CPN=81
APN=41
Primary endpoint MCyR 20% MaHR 27%CCyR 10% CHR 24%
Median duration, mo 17.7 9Median PFS, mo 9.6 4.7Median OS, mo 33.9 16• 11 pts (9 CP, 2 AP) ongoing response• Median 35 cycles over median 39 months• Median response duration: 14 mo CP, 24 mo AP
Kantarjian HM, et al. Blood. 2012;120: Abstract 2767.

Allo SCT. Second or Third Salvage?• Imatinib failure in AP, BP: use new TKI as bridge to MRD, then
alloSCT ASAP
• T315I mutation in any CML phase: use AP 24534, other T315I inhibitors, HHT, HU, others as bridge to MRD, then allo SCT ASAP
• Imatinib failure in CP:
– if IC50 , clonal evolution, or no major CG in 12 mos allo SCT (risk should also be reasonable: young, good match)
– If not TKI until failure
• Age 70 yrs or if poor match: may decide to forgo curative allo SCT option for several years of CML control;
• Young patient (?)
• Financial considerations
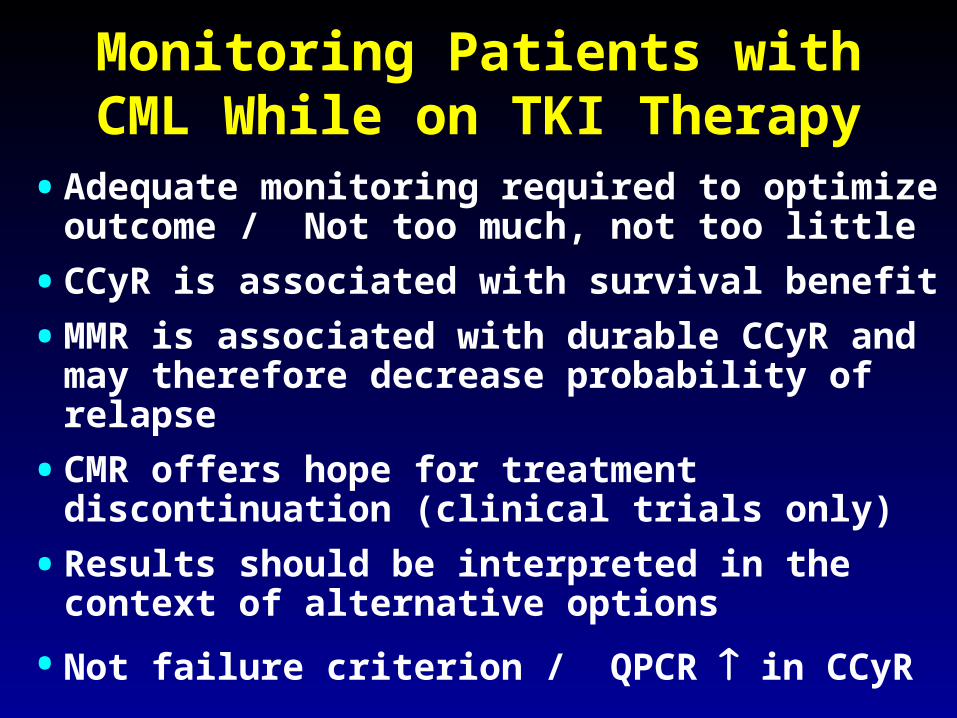
Monitoring Patients with CML While on TKI Therapy
• Adequate monitoring required to optimize outcome / Not too much, not too little
• CCyR is associated with survival benefit
• MMR is associated with durable CCyR and may therefore decrease probability of relapse
• CMR offers hope for treatment discontinuation (clinical trials only)
• Results should be interpreted in the context of alternative options
• Not failure criterion / QPCR in CCyR

CML in 2013• Imatinib,nilotinib,dasatinib are standard
frontline Rx (except p190 CML)• Dose optimization and adequate
monitoring• Sub-optimal response dose imatinib (400mg → 800mg)– New TKI
• Failure– Dasatinib, nilotinib, bosutinib– Allogeneic SCT
• T315I: ponatinib, omacetaxine