Embed Size (px)
Citation preview

ELFA Best Practices Roundtable
Industry Update
Bill Phelan – President
Tom Ware – Senior Vice President
April 4, 2017
Sponsored by:1
National
Activity
2
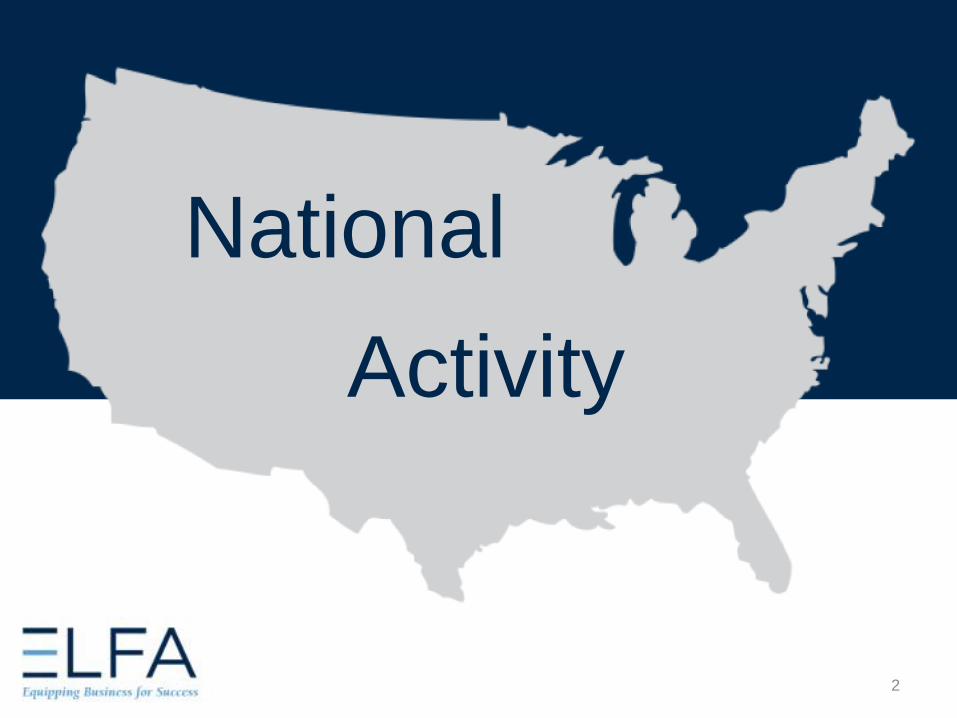
Lending Activity – National
Flat Trend
3
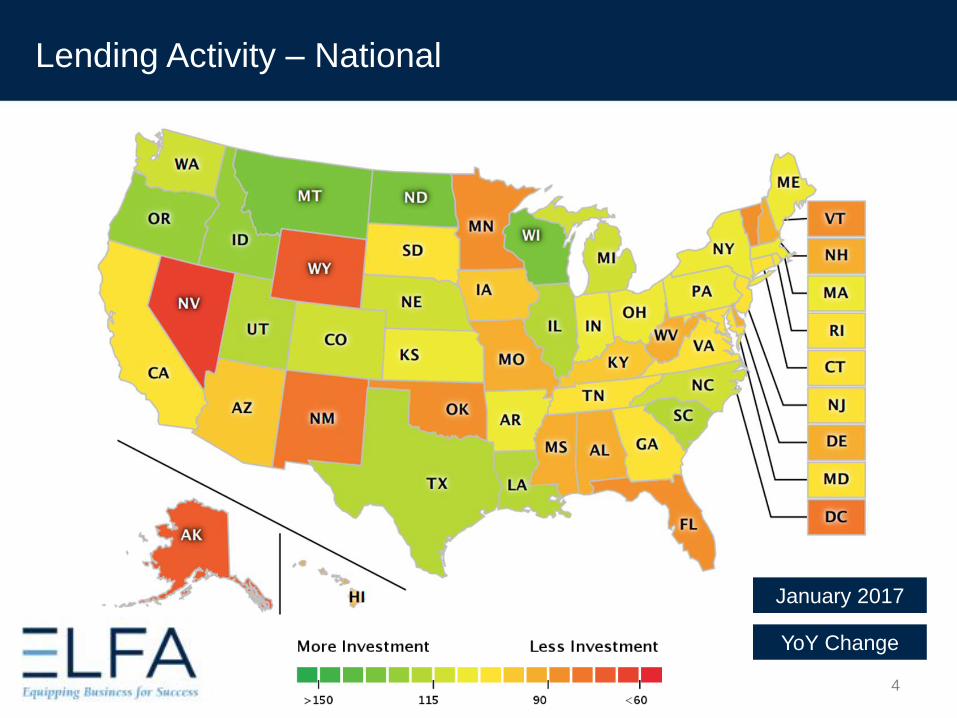
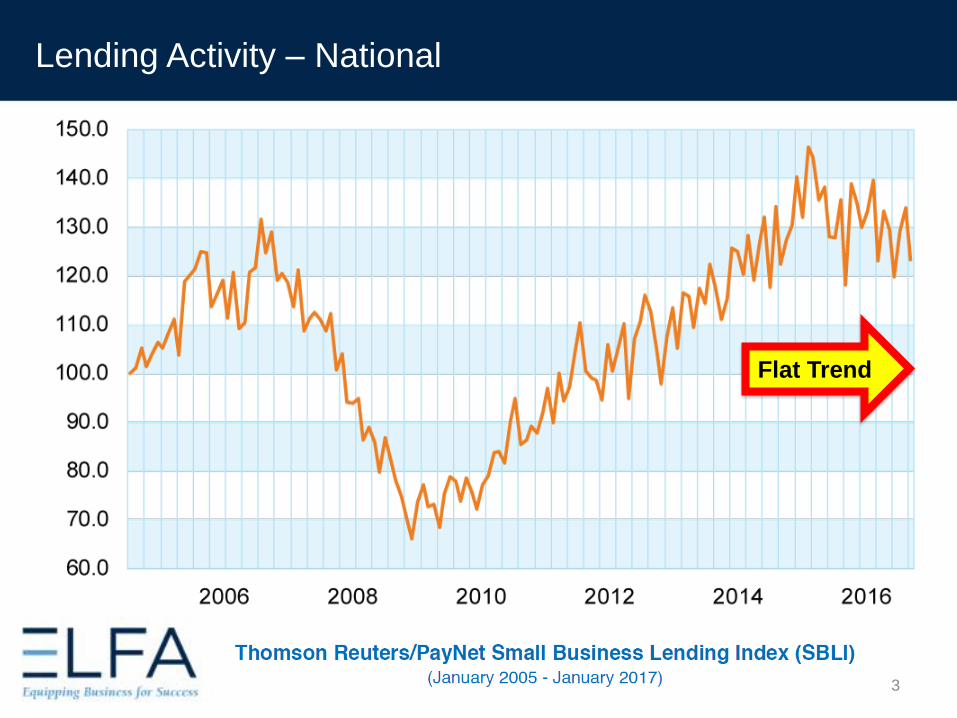
January 2017
YoY Change
Lending Activity – National
4
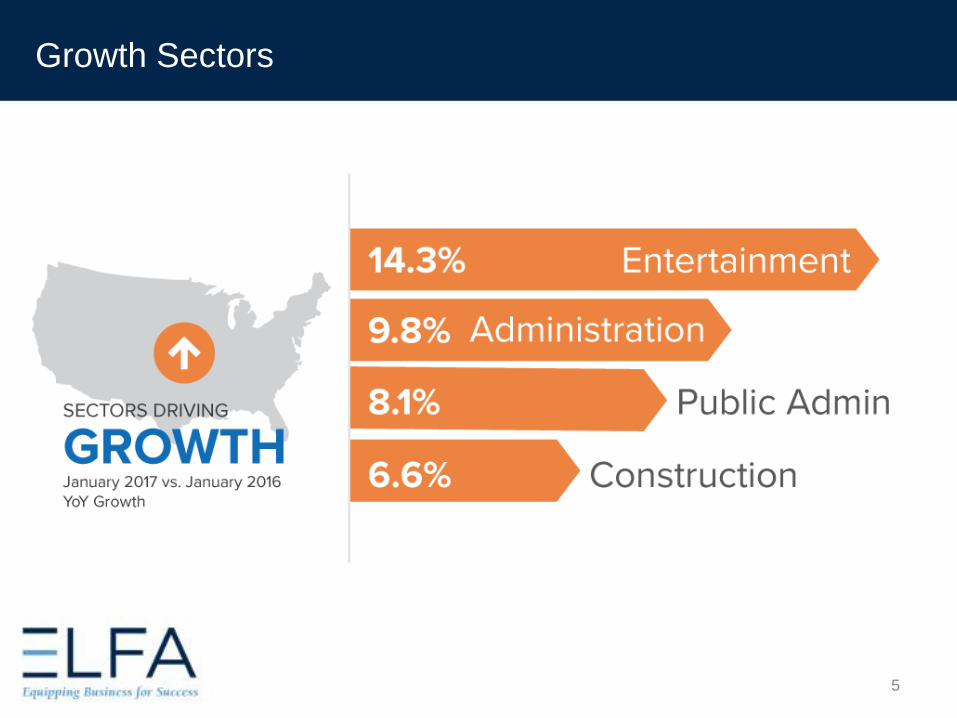
Growth Sectors
5
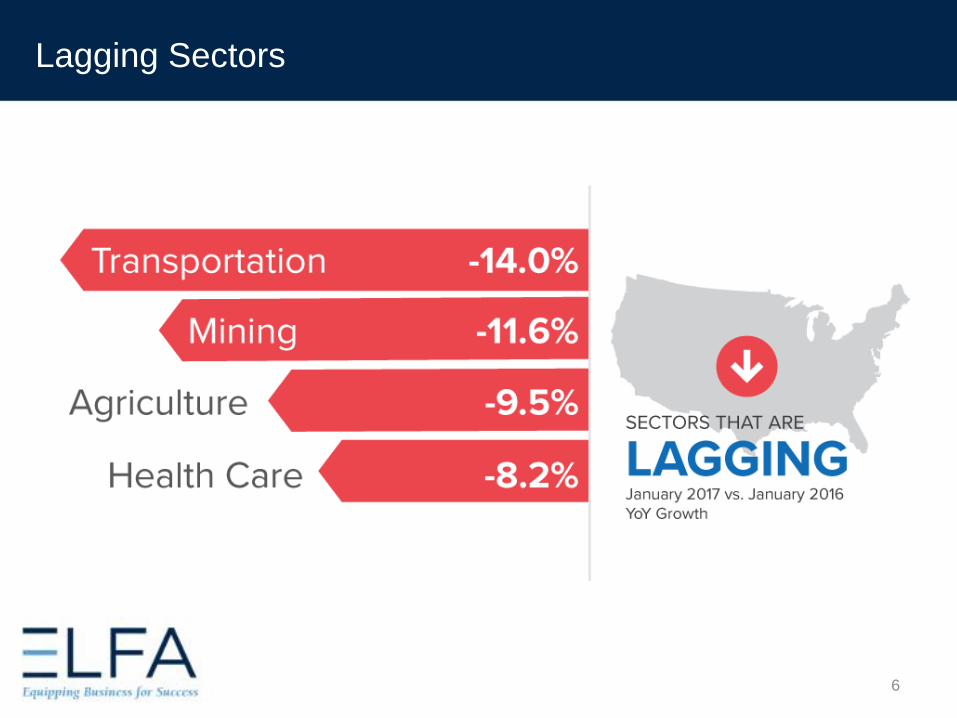
Lagging Sectors
6
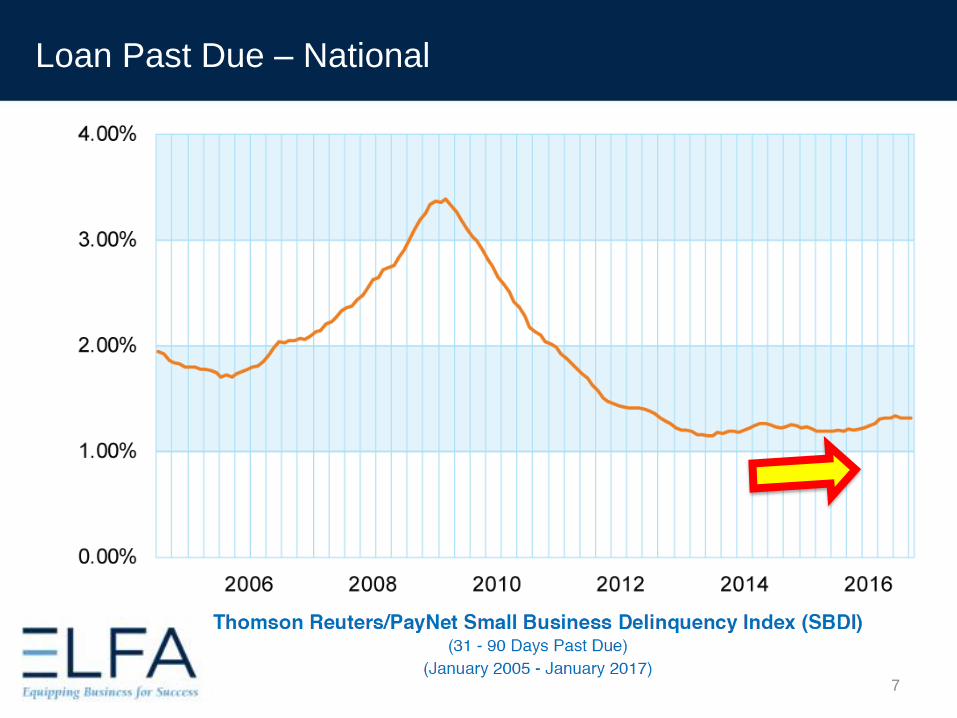
Loan Past Due – National
7
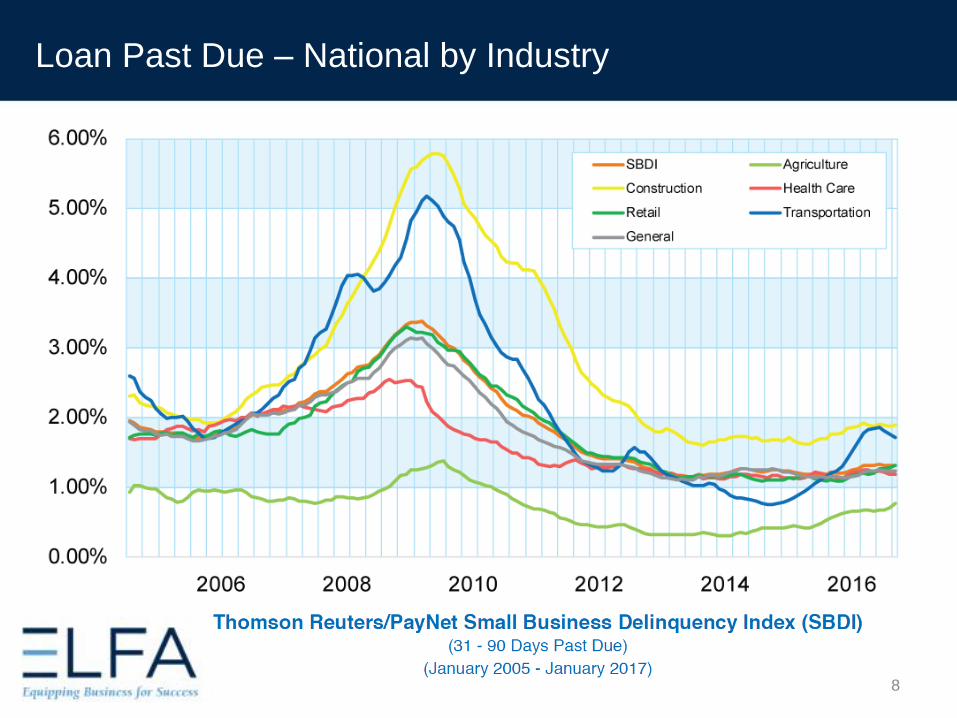
Loan Past Due – National by Industry
8
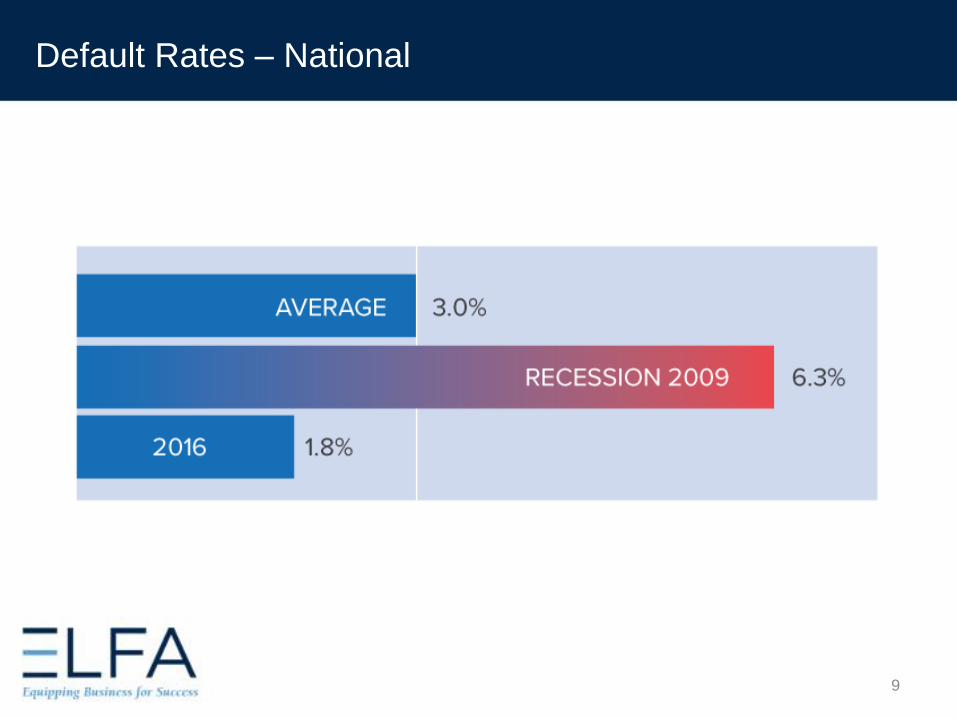
Default Rates – National
9
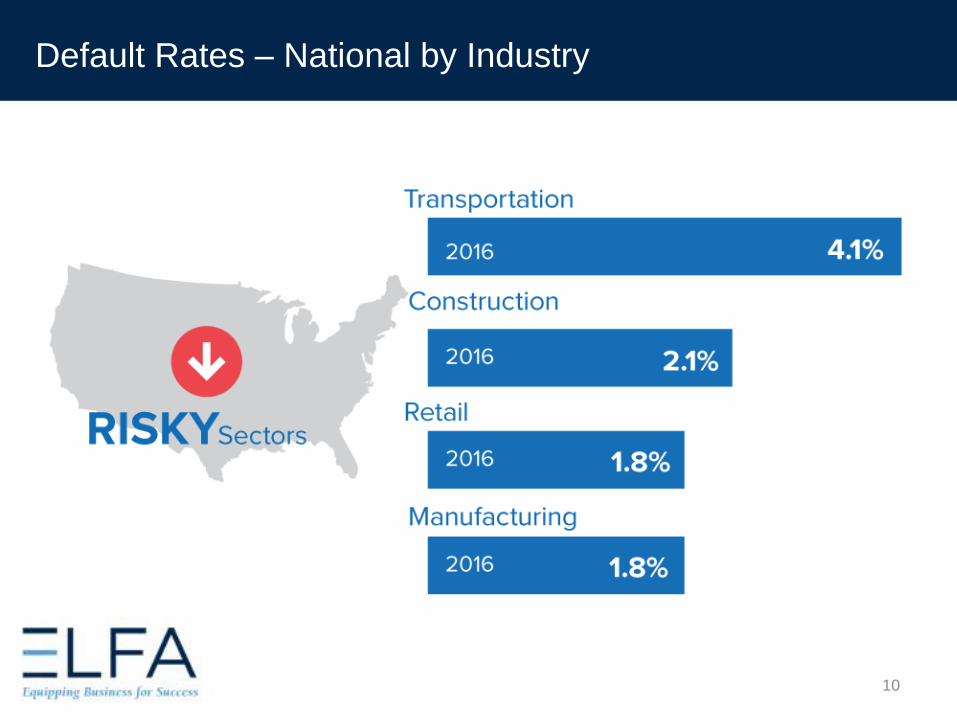
Default Rates – National by Industry
10
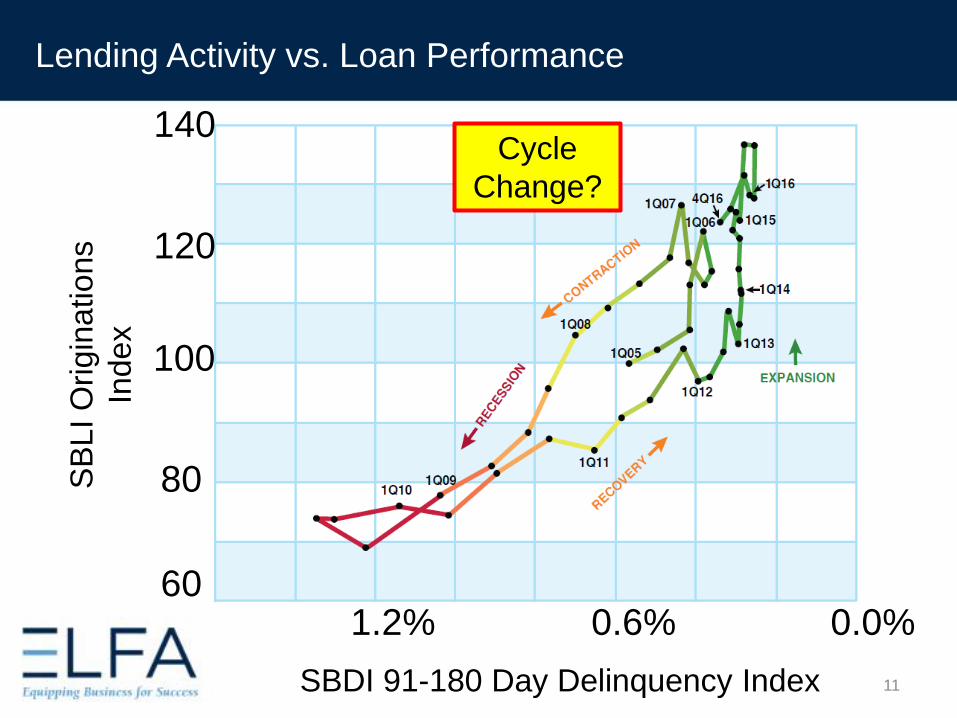
Lending Activity vs. Loan Performance
1.2% 0.6% 0.0%
SBDI 91-180 Day Delinquency Index
120
100
80SB
LI
Ori
gin
ations
Index
60
Cycle
Change?
140
11

Portfolio
Performance
12
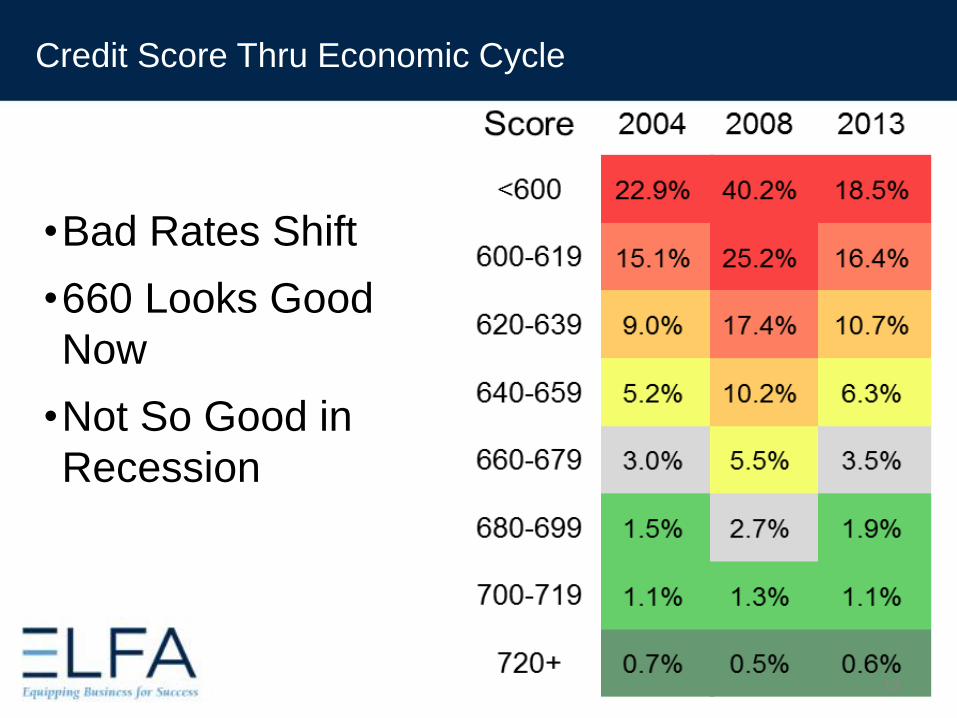
Credit Score Thru Economic Cycle
•Bad Rates Shift
•660 Looks Good
Now
•Not So Good in
Recession
13
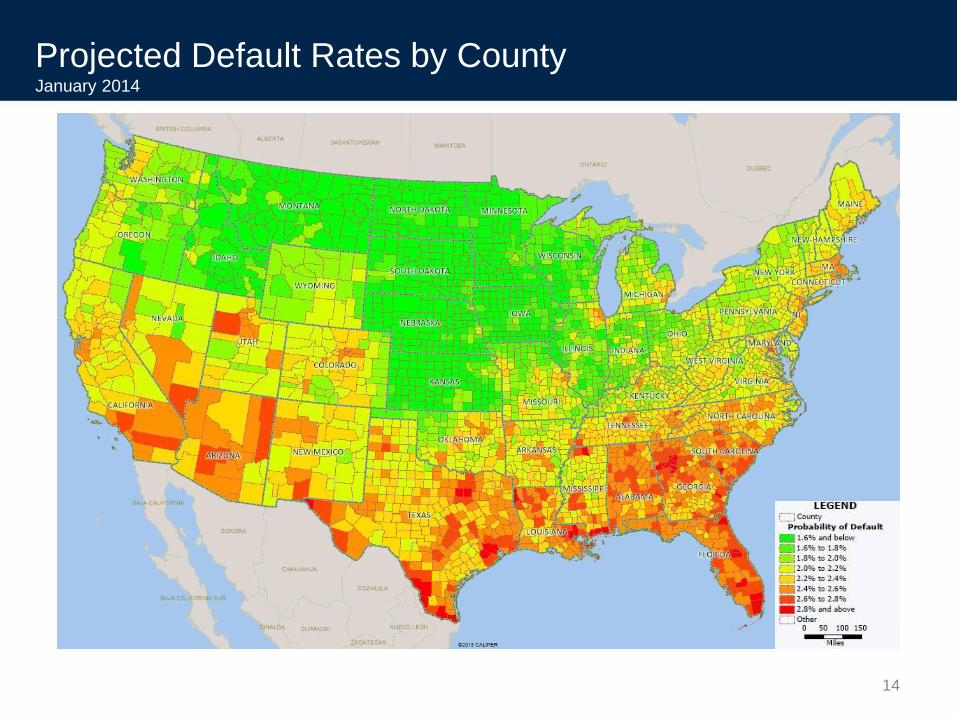
Projected Default Rates by CountyJanuary 2014
14
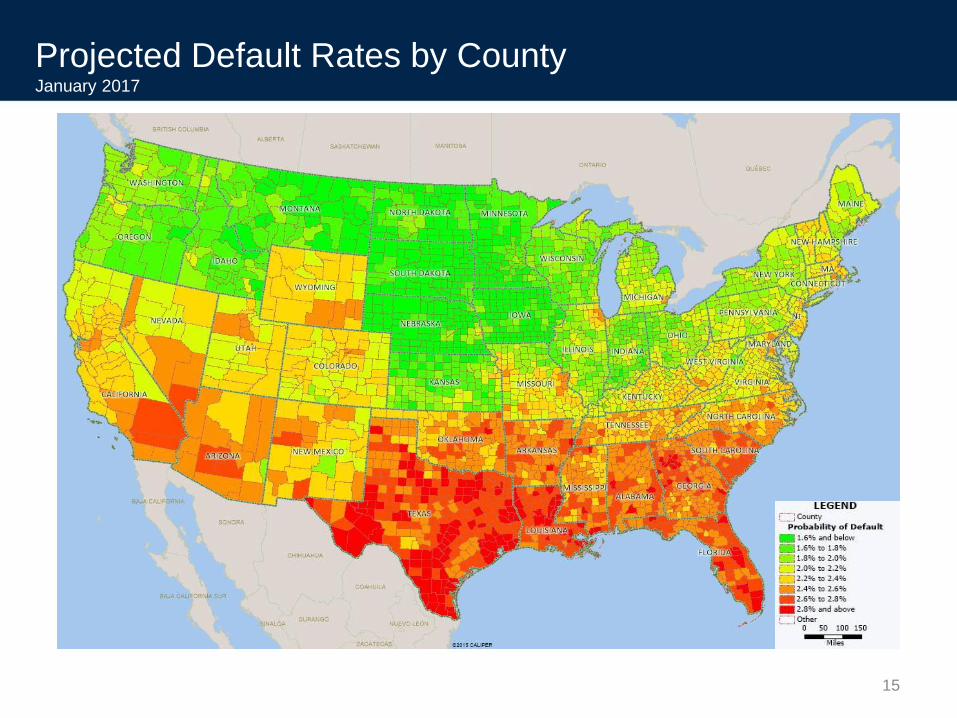
Projected Default Rates by CountyJanuary 2017
15

Changing
Regulation
16
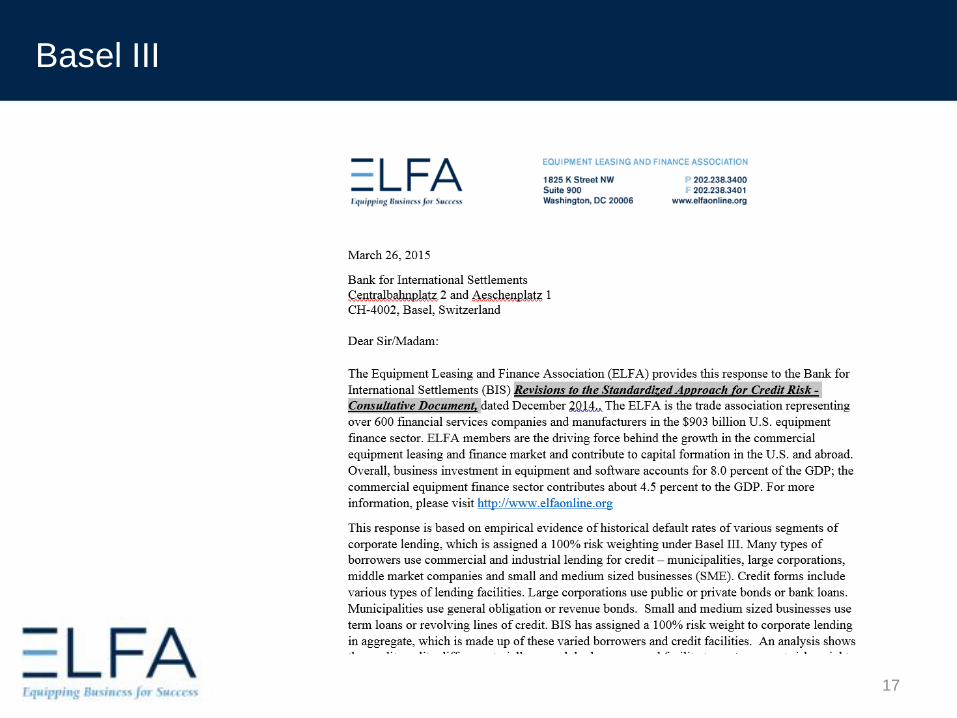
Basel III
17
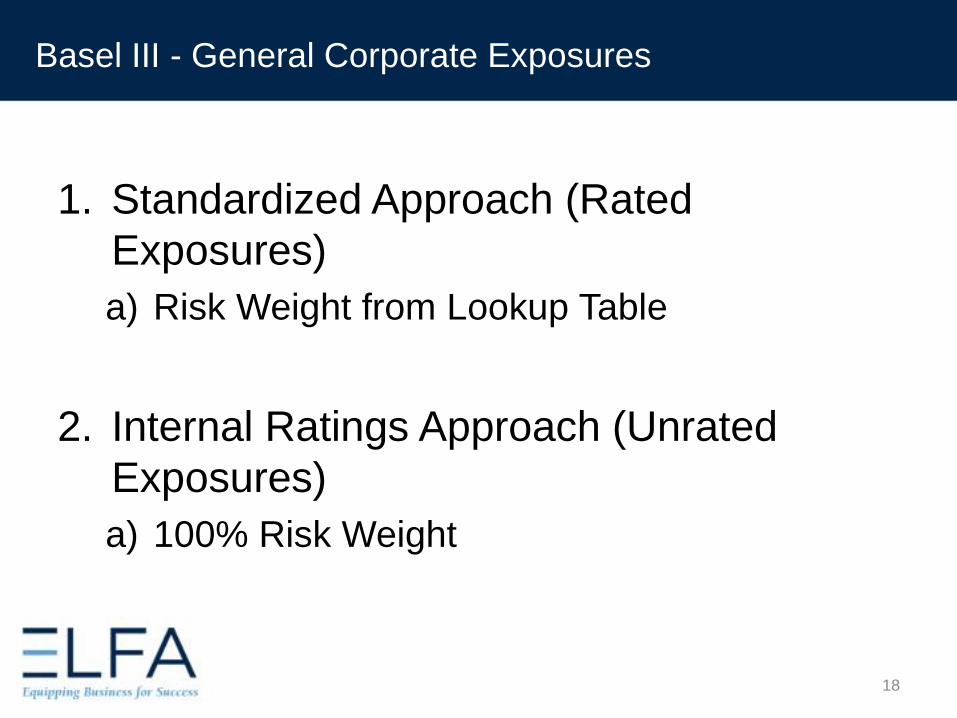
1. Standardized Approach (Rated
Exposures)
a) Risk Weight from Lookup Table
2. Internal Ratings Approach (Unrated
Exposures)
a) 100% Risk Weight
18
Basel III - General Corporate Exposures
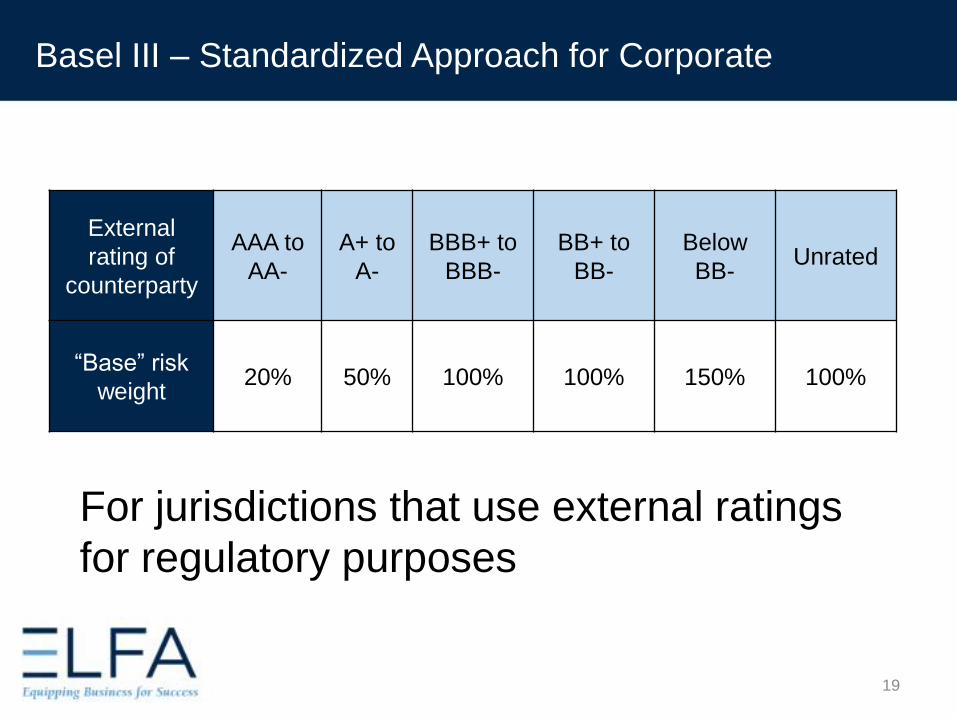
For jurisdictions that use external ratings
for regulatory purposes
19
External
rating of
counterparty
AAA to
AA-
A+ to
A-
BBB+ to
BBB-
BB+ to
BB-
Below
BB-Unrated
“Base” risk
weight20% 50% 100% 100% 150% 100%
Basel III – Standardized Approach for Corporate
Basel III – Small Medium Enterprises (SME’s)
• For Unrated Corporate SME’s
• 85% Risk Weight
• SME defined as sales <€50 million
20
• New FASB regulations• “Current and Expected Credit Loss” (CECL) will require
accounting for expected lifetime Losses
• PayNet now building models to predict lifetime Losses
(not just Defaults)
• Which requires:• Loss Given Default (LGD)
• Exposure at Default (EAD)
• Probability of Default (PD) – beyond two years
21
Expected Loss: Loss Given Default & Exposure at Default
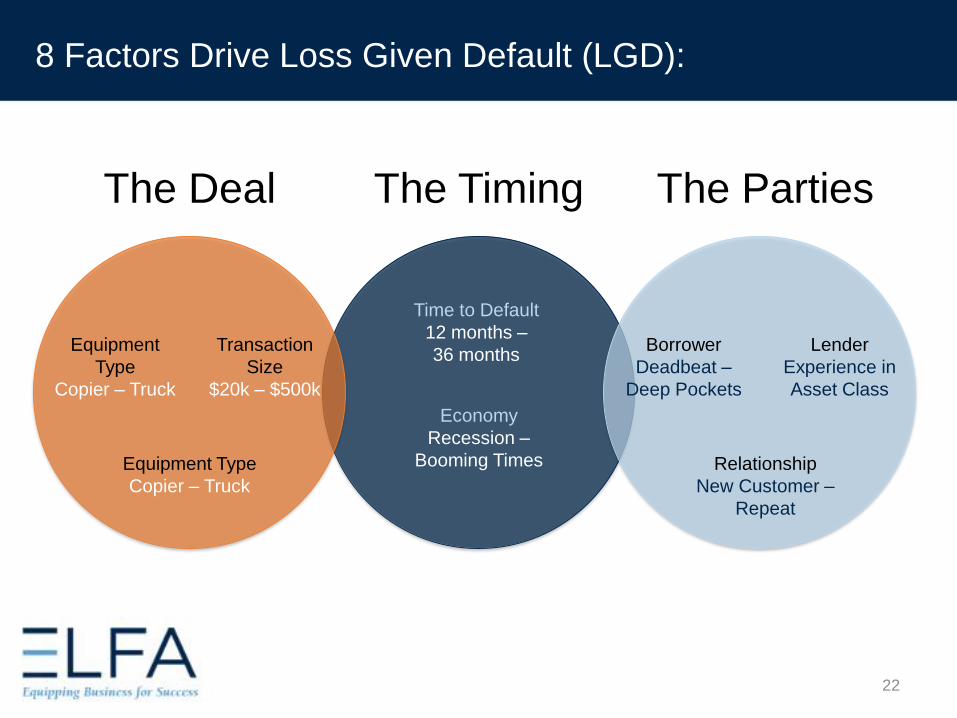
8 Factors Drive Loss Given Default (LGD):
22
The Deal The Timing The Parties
Equipment
Type
Copier – Truck
Equipment Type
Copier – Truck
Transaction
Size
$20k – $500k
Time to Default
12 months –
36 months
Economy
Recession –
Booming Times
Borrower
Deadbeat –
Deep Pockets
Relationship
New Customer –
Repeat
Lender
Experience in
Asset Class
Competitive
Environment
23
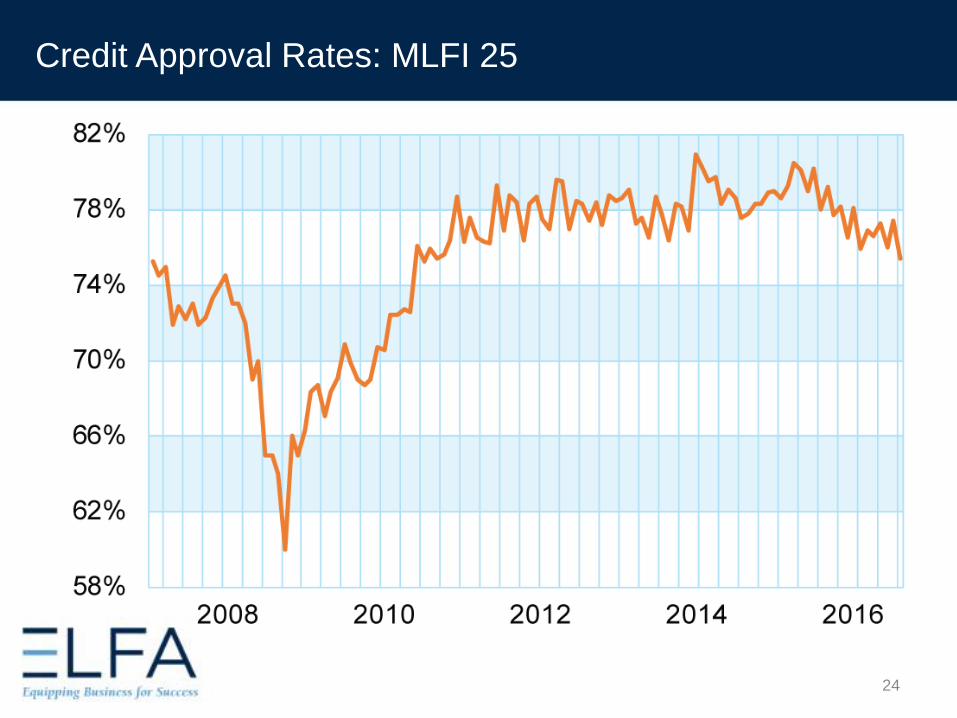
Credit Approval Rates: MLFI 25
24
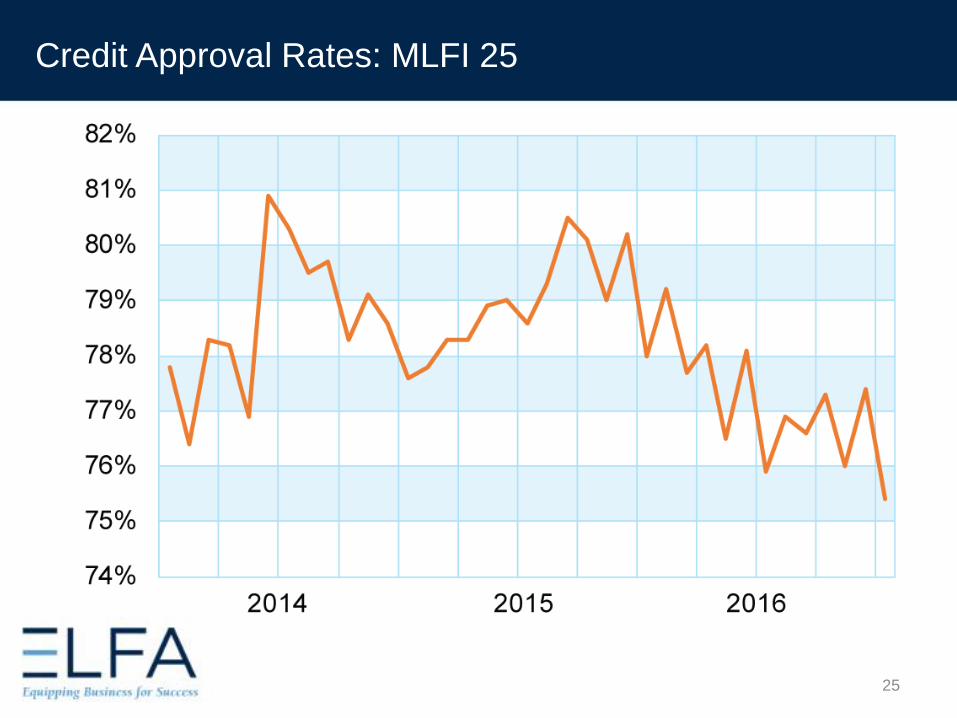
Credit Approval Rates: MLFI 25
25
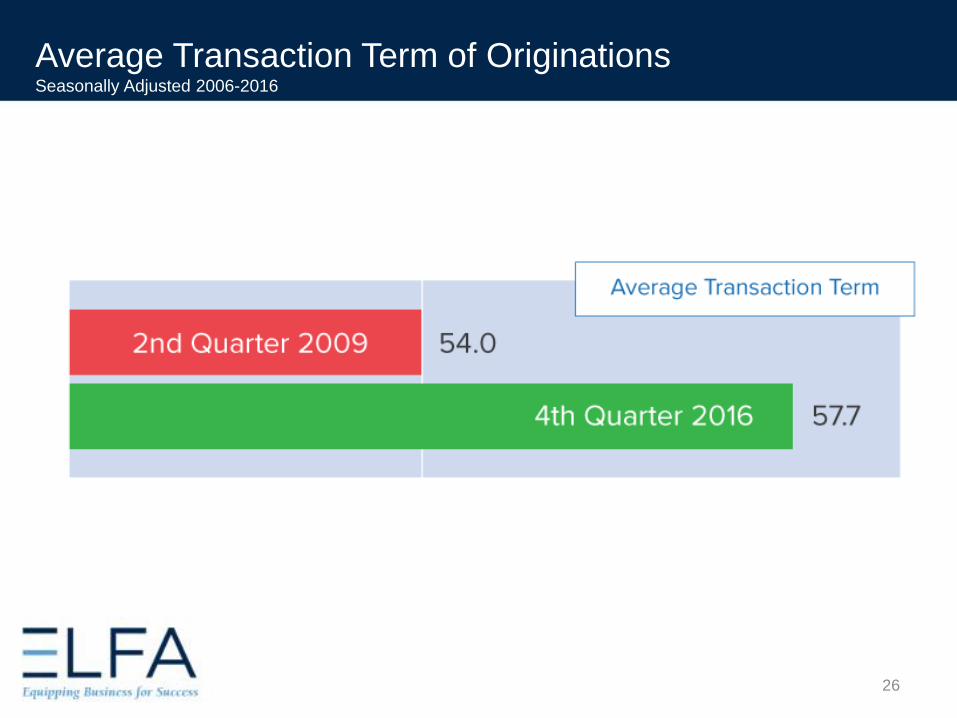
Average Transaction Term of OriginationsSeasonally Adjusted 2006-2016
26
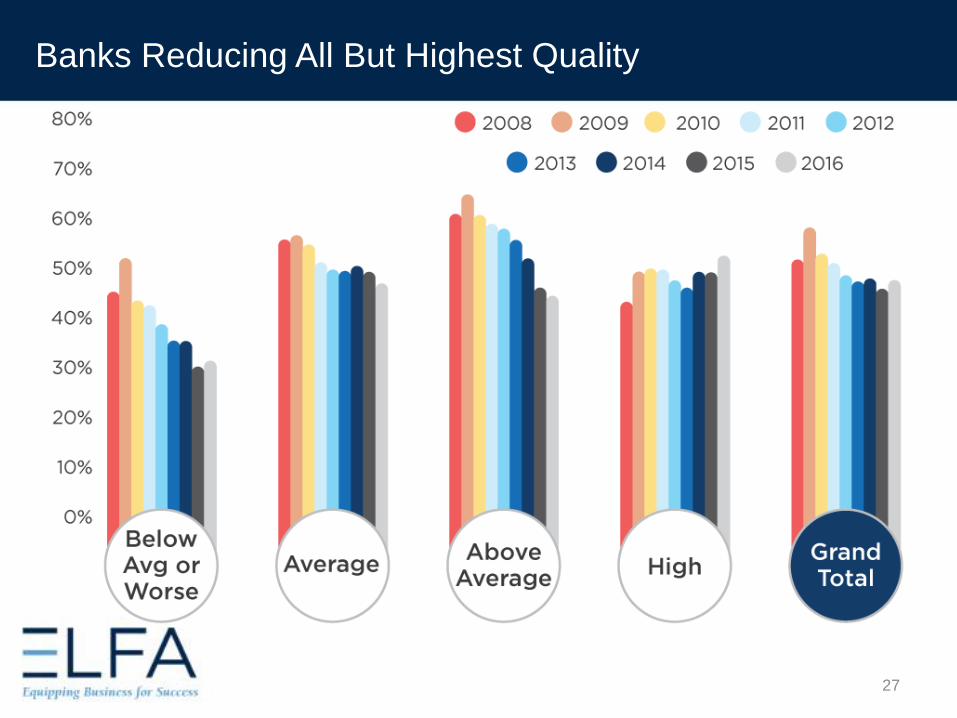
Banks Reducing All But Highest Quality
27
28
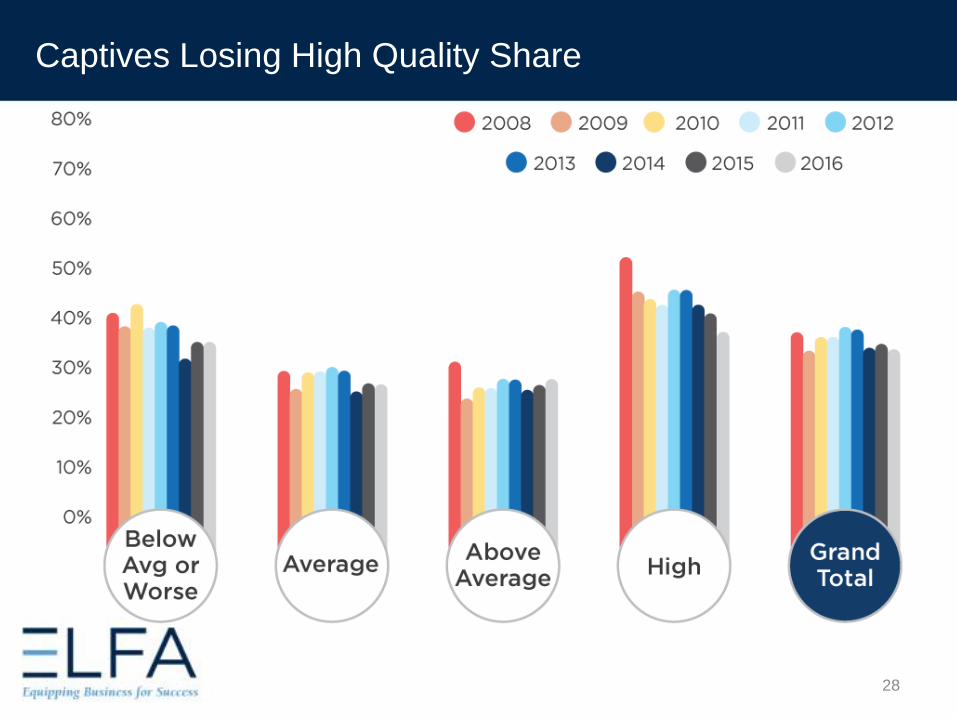
Captives Losing High Quality Share
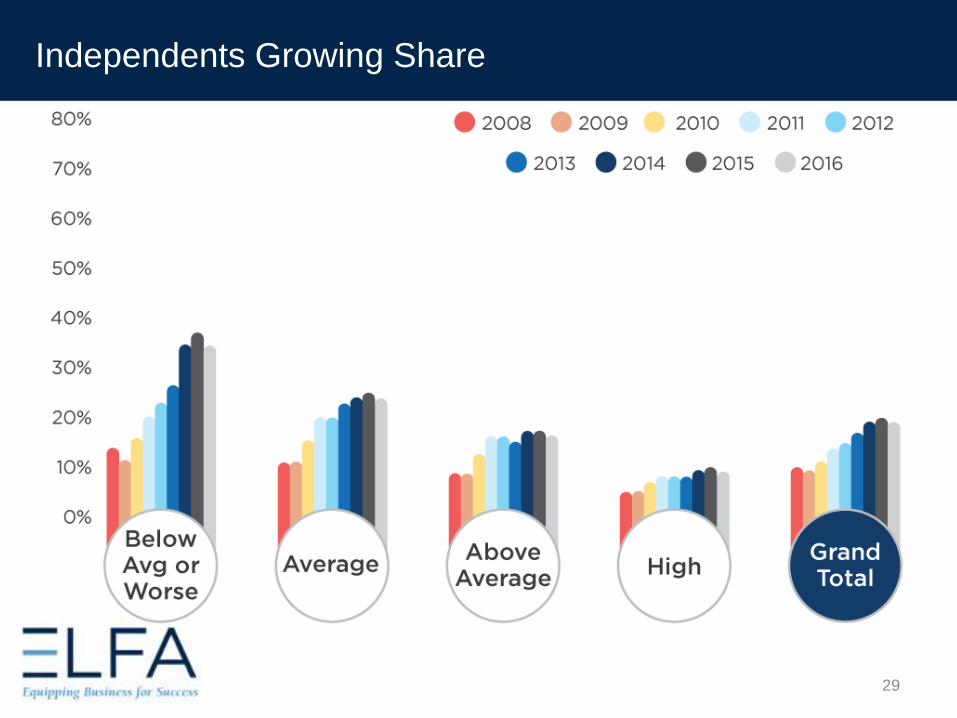
Independents Growing Share
29
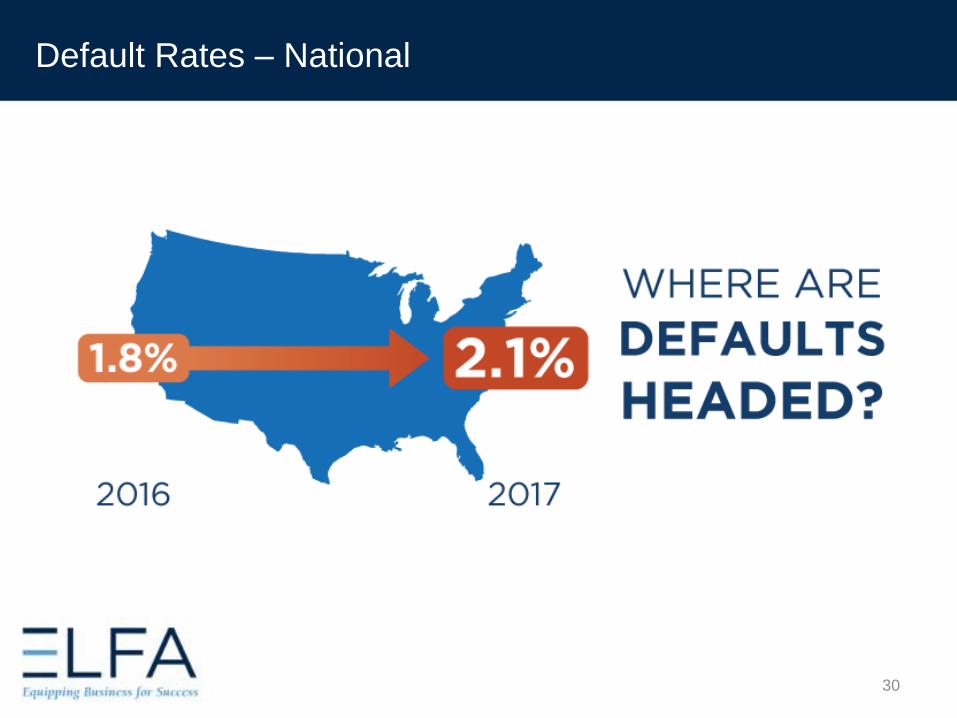
Default Rates – National
30
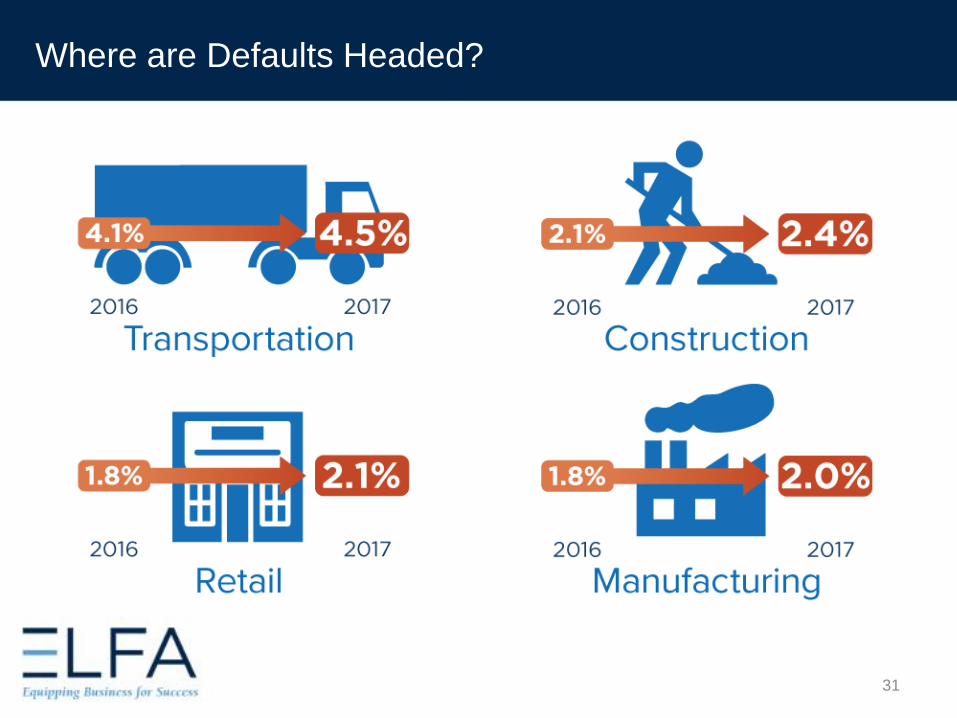
Where are Defaults Headed?
31
Thank
www.SBInsights.net
You
William Phelan ● Tom Ware
32