Embed Size (px)
Citation preview
ENDANGERED SPECIES RESEARCHEndang Species Res
Vol. 29: 117–130, 2015doi: 10.3354/esr00707
Published online December 10
INTRODUCTION
Pine rockland is an endangered community cur-rently restricted to small areas of southern peninsularFlorida and islands in the lower Florida Keys. In thelower Keys, rockland savannas are characterized bya rich assemblage of herbaceous flora with many nar-rowly endemic taxa scattered along the understoryand a single-species canopy of Pinus elliottii var.
densa (Sah et al. 2004). P. elliottii var. densa is thefoundation species of pine rocklands because it con-tributes extensively as a primary producer and playsan important role in structuring the community. Akey characteristic of P. elliottii var. densa within thecommunity is that it provides fuel (e.g. needles)which frequently facilitates the spread of fire acrossthe landscape. In the absence of fire, savanna-likepine rocklands succeed to closed-canopy tropical
© The authors 2015. Open Access under Creative Commons byAttribution Licence. Use, distribution and reproduction are un -restricted. Authors and original publication must be credited.
Publisher: Inter-Research · www.int-res.com
*Corresponding author: [email protected]
Elevation promotes long-term survival of Pinus elliottii var. densa, a foundation species of the endangered pine rockland ecosystem
in the Florida Keys
Grant L. Harley1,*, Justin T. Maxwell2, George T. Raber1
1Department of Geography and Geology, The University of Southern Mississippi, 118 College Drive, Box #5051, Hattiesburg, MS 39406, USA
2Department of Geography, Indiana University, 701 E. Kirkwood Avenue, 120 Student Building, Bloomington, IN 47405, USA
ABSTRACT: The pine rockland community in southern Florida, which supports numerous state-and federally listed flora and fauna species, is considered endangered. Without its foundation spe-cies, Pinus elliottii var. densa, habitat and species diversity are lost to tropical hardwood ham-mock. Here, we investigate the landscape factors that contribute to the long-term persistence ofpine rocklands on the 2 islands that contain the largest remaining habitat in the Florida Keys: BigPine Key and No Name Key. Plot-level biophysical data and island-scale remotely sensed vegeta-tion data were collected from pine rockland savannas and examined with multi-dimensionalanalysis. On both islands, vegetation plots located at higher elevations contain the greatest basalarea and the oldest and largest-diameter trees. In contrast, the lowest-elevation plots contain morestanding dead trees and downed logs. Change-detection analysis of the normalized differencevegetation index between 2001 and 2011 supports the notion that habitat areas at lower elevationsexperience more vegetation change compared to those at higher elevations during the time period(p < 0.05). Trees rooted at higher elevations frequently exceeded 200 yr in age, which is uncom-mon in this highly disturbed sub-tropical region. Although elevation range on the 2 islands wasonly ca. 0 to 3 m, these results demonstrate that higher elevations can act as a refuge for the salt-intolerant P. elliottii var. densa during storm surge events, which promotes long-term develop-ment of old-growth savanna structure and aids the long-term persistence of pine rocklands in theFlorida Keys.
KEY WORDS: Microtopography · Disturbance ecology · Forest structure · Tropical cyclone ·Storm surge · Pine savanna
OPENPEN ACCESSCCESS
Endang Species Res 29: 117–130, 2015118
hammock, and with this succession many endan-gered flora and fauna species are also lost. Fire andavailable fresh groundwater via a freshwater lens arethe 2 primary determinants of whether an upland sitein the Keys will be dominated by pines or broadleafspecies (Ross et al. 1992, 1994).
Disturbances, those initiated naturally or by hu -mans, impart change in many ecosystems by impact-ing community dynamics or the composition, struc-ture, and successional trajectories of forest systemsthrough time. Topography is one of the most impor-tant predictors of vegetation composition within agiven region (Danz et al. 2011), especially within bot-tomland or coastal ecosystems prone to periodicflooding. The frequency and intensity of disturbanceregimes can have varying affects on communities withregard to fine-scale elevation variance and local-scale topographic conditions (Foster 1988, Hylander2005, Åström et al. 2007). Certain topographic fea-tures, such as boulders, can act as a refugium to pro-mote increased survival rates of species impacted byfloods (Matthaei et al. 2000), fire (Kiss & Magnin2003), and clear-cut logging (Schmalholz & Hylander2011). Previous studies have already demonstratedthe adverse effects of sea level rise and tropicalcyclone (TC) disturbance on individual species aswell as vegetation communities on the low-reliefislands of the Florida Keys. Ross et al. (1994, 2009)found sea level rise-induced vegetation shifts from amesophytic pine rockland to a halophytic communityon Sugarloaf Key, Florida. Maschinski et al. (2011)noted that in creased groundwater salinity levelscaused a rapid decline in the population of federallyendangered Pilosocereus robinii (Key tree cactus). Arecent report by the US Fish and Wildlife Service(USFWS) highlighted the failure to identify anyAnaea troglodyta floridalis (Florida leaf wing butter-fly) individuals following devastating impacts fromHurricane Wilma in 2005 (USFWS 2009).
Less understood, however, is how disturbanceinteracts with fine-scale elevation change to impactthe structure of ecosystems at decadal to centennialtime scales. In the Florida Keys, Ross et al. (1994)found that topographic position was related towidespread patterns of pine mortality resultingfrom sea level rise and subsequent salinization ofthe groundwater and soil. Such studies facilitatebetter understandings of the capacity for a commu-nity to recover from a disturbance, such as a TC. Inthis study, we test the potential linkage betweenfine-scale elevation variance and vegetation struc-ture with regard to impacts from TCs over the pastseveral centuries.
The primary large-scale meteorological disturbanceagent in coastal ecosystems of the southeastern USAis TCs (Platt et al. 2000). The physical impacts associ-ated with TC landfalls include wind damage, coastalflooding and erosion, and storm surge-induced saltdeposition. Although the role of TCs as a natural dis-turbance agent is well documented in the southeast-ern USA (e.g. Pimm et al. 1994, Platt et al. 2000,Batista & Platt 2003, Lugo 2008), the effects of sealevel rise on coastal plant communities is becoming aprimary concern for agencies charged with restoringand conserving coastal environments (Hopkinson etal. 2008, Ross et al. 2009, Maschinski et al. 2011). Inthe Florida Keys, both fire and elevation might dictatethe ability of plants to recover following wind damageand storm surge. In 1965, storm surge associated withHurricane Betsy measured 2.74 m in North Key Largo(Needham & Keim 2012). In 1995, 30 yr followingHurricane Betsy, elevation did not explain the abun-dance of P. elliottii var. densa or of Chamaesyce lin-eata, a rare endemic herbaceous plant, but explainedsignificant variations in abundance of the endemicC. deltoidea (S. Saha et al. 2011). In 2005, HurricaneWilma caused a 6.43 m surge on Vaca Key (Needham& Keim 2012), which neighbors Big Pine Key (BPK).Three years after Hurricane Wilma, in 2008, elevationand abundance were strongly and positively corre-lated for all 3 aforementioned species. Further, treemortality rate from the Hurricane Wilma storm surgewas highest in the larger sizes classes of P. elliottii var.densa, the foundation species of pine rocklands (Sahet al. 2010). The effects of storm surge from HurricaneWilma were exacerbated by topography and infra-structure (e.g. road berms, spoil) that caused water tocollect and remain at the surface for an extendedtime, likely contributing to widespread mortality ofsalt-intolerant species.
Since 1851 CE, 53 TCs (categories 1 to 5) and 71tropical storms tracked within 200 km of the FloridaKeys (centered at 24.6909° N, 81.3699° W; hurricanedatabase HURDAT, www.nhc.noaa.gov; Fig. 1). Thelargest island in the lower Florida Keys is BPK, whichcurrently contains the most contiguous area of pinerockland habitat. Because BPK is situated geographi-cally along the Florida Straits between the Gulf ofMexico and the Atlantic Ocean, the island has a longhistory of repeated storm surge inundation. Since1880, at least 3 storm surge events on BPK that ex-ceeded 4 m were recorded and included in the stormsurge database SURGEDAT (http://surge. srcc. lsu.edu/ data. html; Needham & Keim 2012). Given thatlarge areas of pine rockland habitat on BPK werecompletely inundated with storm surge on multiple

Harley et al.: Pine rockland structure and elevation
occasions in the recent past, one would expect to finda vegetation structure that showed evidence of a pri-mary succession event across the entire island (i.e.even-aged pine savannas). Yet, the structure of thepine rockland savannas in the Florida Keys resemblesthat of old coastal plain P. palustris savannas in thesoutheastern USA (Platt et al. 1988, Platt & Rathbun1993, Palik & Pederson 1996) — a mosaic of even-aged habitat patches within an uneven-aged, com-plex savanna, with some P. elliottii var. densa individ-uals exceeding 225 yr in age (Harley et al. 2013).
Long-term perspectives of coastal ecosystem re -siliency would aid restoration and conservationefforts aimed at preserving the endangered pinerockland community and associated species. Restor-ing and conserving pine rocklands is challenging,given the frequent fire regime that must be main-tained (Bergh & Wisby 1996, Harley et al. 2013),widespread land use change and habitat fragmenta-tion, the influence of repeated TCs, and impendingsea level rise caused by climate change (Ross et al.2009). At the forefront of conservation efforts is theFlorida Keys region, where rockland habitat exists ata maximum of ca. 3 m above sea level. Within the
restoration ecology paradigm, several central issuesexist that influence restoration or conservationoptions for a community. In the face of disturbance,Maschinski et al. (2011) outlined the issues of popu-lation demography, dispersal mechanisms, suitablehabitat, and policy, which all influence the optionsfor restoration/conservation faced by natural re sour -ce managers. Spatial and temporal vegetation datacould be used to identify core conservation areaswith respect to environmental controls, particularlywithin low-relief ecosystems in coastal locations.
In this study, we use data from primary and sec-ondary sources to test the hypothesis that island loca-tions with higher elevation promote the long-termpersistence of pine rockland habitat in the FloridaKeys. To test this hypothesis, we use ground-basedbiophysical vegetation structure data and explicitages of canopy-dominant P. elliottii var. densa indi-viduals at study sites on 2 adjacent islands: BPK andNo Name Key (NNK). Further, we incorporate a 10 yrchange-detection analysis of the normalized differ-ence vegetation index (NDVI) regarding elevationzones at BPK and NNK. The distance of plot locationfrom the coast could have an effect on vegetation
119
Fig. 1. Historical tropical cyclones that tracked within 200 km (red circle) of Big Pine Key (red dot) and No Name Key, Florida,during the period 1850−2014. Calculation of 200 km buffer zone centered on Big Pine Key at 24.6909° N, 81.3699° W. Hurri-
cane tracks from the hurricane database HURDAT, accessed at www.nhc.noaa.gov
Endang Species Res 29: 117–130, 2015
structure and tree survival from TC-induced disturbance. Thus, we investi-gated the impact that distance from thecoast might have on habitat structureand in promoting increased survivalrates of P. elliottii var. densa followingTC events. Similar to plot elevation, weincluded a distance from coast term as adependent variable.
MATERIALS AND METHODS
Study area
The islands of BPK (24.70° N,81.37° W) and NNK (24.69° N, 81.32° W)contain the largest areas of pine rock-land habitat in the Florida Keys. Pinerocklands provide an important habitatfor several federally and state-listedendangered fauna such as the Key deerOdocoileus virginianus clavium, thelower Keys marsh rabbit Sylvilaguspalustris hefneri, Kirtland’s warblerDendroica kirtlandii, and the Floridaleafwing butterfly Anaea troglodytafloridalis (Snyder et al. 1990). Predomi-nant palm and shrub species includesaw palmetto Serenoa repens, silverpalm Cocco thrinax argentata, brittlethatch palm Thrinax morrisii, wax myr-tle Myrica cerifera, myrsine Rapaneapunctata, and poisonwood Meto piumtoxiferum, and common herbaceousspecies include bluestems Andropogenspp., lopsided Indiangrass Sorghastrumsecundum, pineland croton Croton lin-earis, and partridge pea Chamaecristafasciculata (Ross et al. 1992).
Vegetation dynamics
We randomly established 20 circular plots (area =0.04 ha) each at the BPK and NNK sites to documentthe biophysical vegetation structure (Fig. 2). On bothBPK and NNK, we selected 75 ha tracts of pine rock-land habitat in which to install vegetation plots. Plotcenter locations were taken via GPS for subsequentassignment of plot elevation. In each plot, we re -corded diameter at breast height (dbh; ca. 1.4 mabove the surface) for all stems ≥5 cm dbh to quantify
stand size structure. We collected increment coresfrom all living Pinus elliottii var. densa individuals ata height of 30 cm above the ground surface to evalu-ate establishment date and tree age. Increment coreswere taken with a 5.15 mm diameter Haglöf incre-ment borer, with 2 radii extracted from each tree. Ineach plot, we also recorded the frequency and dbhfor all snags and logs to quantify the abundance andsize of coarse woody debris.
Tree cores were prepared using standard tech-niques (Stokes & Smiley 1968), and tree age was as-
120
BPK 350
300
250
200
150
100
50
0
600
400
200
0
Fre
que
ncy
–1.0 –0.5 0 0.5 1.0 1.5 2.0 2.5 –1.0 –0.5 0 0.5 1.0 1.5 2.0 2.5
NNK
BPK
NNK
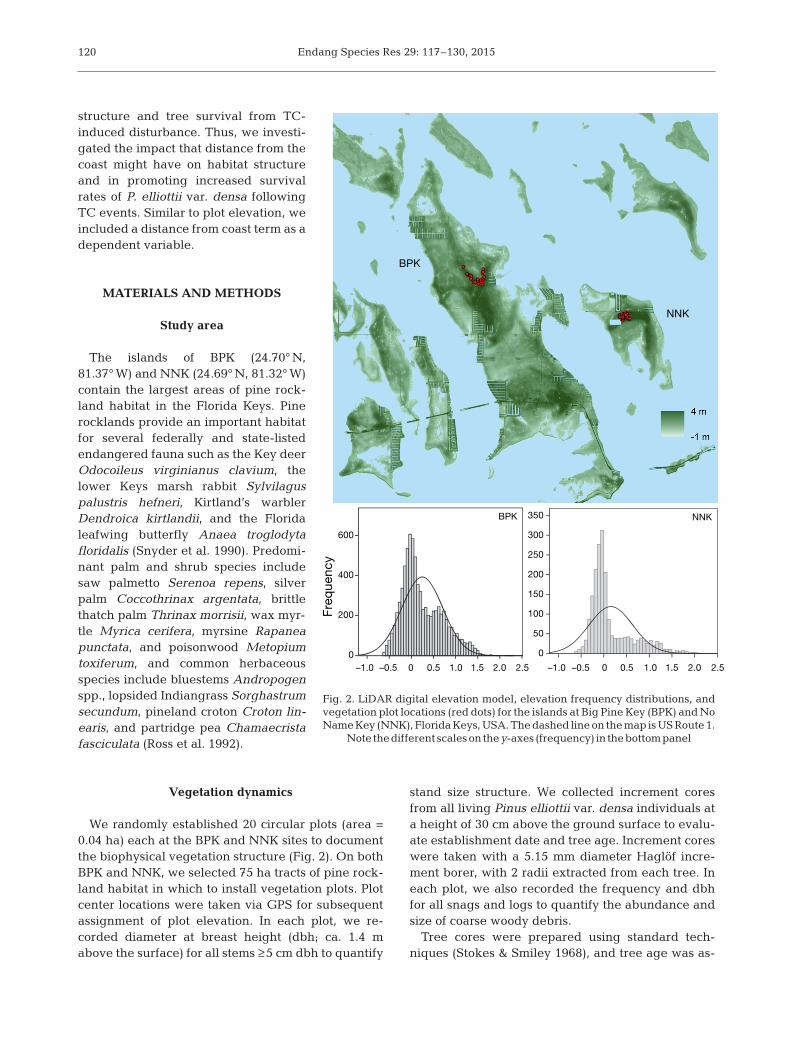
Fig. 2. LiDAR digital elevation model, elevation frequency distributions, andvegetation plot locations (red dots) for the islands at Big Pine Key (BPK) and NoName Key (NNK), Florida Keys, USA. The dashed line on the map is US Route 1.
Note thedifferent scaleson they-axes (frequency) in thebottompanel

Harley et al.: Pine rockland structure and elevation
signed based on the innermost growth ring for coresthat contained the pith. We applied an age correctionto cores that missed the pith based on the curvatureof the innermost rings with pith estimators that repre-sented different growth rates (Applequist 1958). Foreach plot, we also tallied P. elliottii var. densa abun-dance and calculated quadratic mean diameter (QMD)from dbh measurements. We in cluded QMD becausethis metric assigns greater weight to larger trees and,thus, could provide a more accurate depiction of old-growth structure (Curtis & Marshall 2000).
Elevation and spatial analysis
Remotely sensed LiDAR-derived elevation data,flown in 2007, were obtained from the Nature Con-servancy (www.nature.org), and each plot center andold-growth individuals were assigned an elevationbased on GPS location. The horizontal error of the Li-DAR data was 2.5 m. Thus, if 2 randomly establishedplots were within the 2.5 m associated error, anotherplot center point was selected at random. We usedPearson correlation analysis to assess the relationshipbetween independent variables (elevation and dis-tance to coast) and mean values of dependent vari-ables collected at plot level (age, number of snagsand logs, dbh of snags and logs, basal area, QMD,and stem abundance). Based on initial correlationsbetween dependent and independent variables, weused multivariate analysis to identify the main sourcesof variance in the datasets. Principal component ana -lysis (PCA) and associated biplot graphical represen-tation were used to assess the structural homo geneitywith relation to elevation and distance to coast withinthe 40 plots at BPK and NNK. PCA also helped re -duce problems associated with multicollinearity be -tween dependent variables. For example, tree ageand size are strongly correlated. On the biplot repre-sentations for BPK and NNK, the vegetation structurepara meters were positioned relative to axes for prin-cipal components 1 and 2 (PC1 and PC2) and repre-sented by vectors. Structural vectors were plottedwith the site vegetation plots. Finally, plots were sep-arated into low, middle, and high elevation groups,and mean parameters were compared using 1-wayANOVA and Tukey-Kramer post hoc tests to betterunderstand the influence of elevation on P. elliottiivar. densa and pine rockland structure. Because plotswere randomly established irrespective of elevation,the plot-assigned elevation range at each site varied.Thus, plots were placed into 1 of 3 groups defined byelevation range at BPK and NNK.
Maximum tree age
Failure to capture the oldest trees at each site waspossible given that plots were established randomly.Thus, we used a targeted sampling design to selectthe oldest individuals based on visual characteristics(cf. Pederson 2010) that did not fall within a plot. Treecores were extracted following aforementioned meth-ods and crossdated visually and statistically. Theexact location of each tree was acquired using a GPSand compared to the elevation dataset.
Remote sensing
Established remote sensing (RS) techniques wereused to investigate the vegetation changes withinBPK and NNK during the period 2001 to 2011 in ele-vation zones. We were particularly interested inobserving if differences in vegetation over this timeperiod were influenced by the small degree of eleva-tion change that exists within the study area. Likemany elements of the environment, vegetation hascertain reflective characteristics that can be observedin RS data. Healthy vegetation absorbs much of theincident energy for use in photosynthesis, particu-larly those portions of the spectrum humans detect asblue and red, making plants appear green. Addition-ally, healthy plants reflect much of the energy in thenear-infrared (NIR) portion of the spectrum to avoidoverheating. Thus, the ratio of reflected NIR energyto red energy in healthy plants is high. Unhealthy orsparse vegetation will exhibit a similar pattern butwith varying degrees of strength that correlate to thepresence of healthy vegetation within a given area. Avegetation index is an indicator derived from RS datathat describes the relative density and health of veg-etation for each picture element (pixel) in a satelliteimage. One of the primary vegetation indexes usedfor this purpose is the NDVI:
NDVI = (NIR − Red) / (NIR + Red) (1)
Previous studies have taken advantage of indicessuch as these to map vegetation variables such ashealth, intensity, biomass, and fraction of absorbedphotosynthetically active radiation using RS databecause these indices are found to correlate wellwith these observable vegetation characteristics.Since we performed this study post hoc, we were notable to collect in situ vegetation data; rather, werelied on previous studies indicating that NDVI ishighly correlated with many vegetation parameters.Thus, we use the change in NDVI values to investi-
121

Endang Species Res 29: 117–130, 2015
gate the relative amount of vegetation change occur-ring at various elevation zones over the time period.
We acquired 2 images of the study area from theGlobal Land Cover Facility (www. landcover. org).The first image was acquired on 13 November 2001by the Enhanced Thematic Mapper Plus sensor on -board Landsat 7. The second was acquired ca. 10 yrlater, on 10 No vember 2011, but because of issueswith the scan line corrector that occurred in 2003onboard Landsat 7, the image we selected was actu-ally acquired by the older Thematic Mapper sensoronboard Landsat 5 (Fig. 3). For the portions of thespectrum of concern in this study (red and NIR), thespectral range of both sensors is nearly identical. Theimages were ortho rectified and projected into theUniversal Transverse Mercator coordinate system(Zone 17 North). Images were then normalized radio-metrically using empirical line calibration with darkand bright locations, with the older image serving asreference, and NDVI values were calculated for theentire dataset. To provide further correction betweenthe 2 images, we then minimum−maximum stretchedthe NDVI values in each dataset to a range between0 and 1. We then identified the absolute differencebetween the NDVI values for the 2 yr (2011 and2001). The result was a dataset with numbers repre-senting the magnitude of vegetation change for eachpixel in the image.
To reduce error in the dataset (i.e. lawns, urbanlandscapes), we created a mask of areas to excludefrom our study. Data from the 2011 National LandCover Dataset, which were also derived from the2011 Landsat image used in this study, wereacquired; as a result, spatial resolution was identical
(30 × 30 m), and all areas labeled as a developed cat-egory were excluded. Additionally, we removedother small areas that, based on observation, werealso affected by changes that were anthropomorphicin nature. Finally, to further account for minor vari-ability between the 2 images, we masked out allchanges that were less than 2 SD from the mean, thusleaving only larger changes for consideration.
To summarize the amount of observed vegetationchange at various elevation zones on BPK and NNK,the dataset was projected to match the NDVI differencedata and then binned into 3 elevation groups based onelevation distribution on each island (Fig. 2). Descrip-tive statistics were calculated, including the mean ab-solute change in NDVI between the 2 time periods foreach of the elevation zones, and an ANOVA was per-formed to test if the differences in NDVI were signifi-cantly different between elevation zones.
RESULTS
Vegetation structure
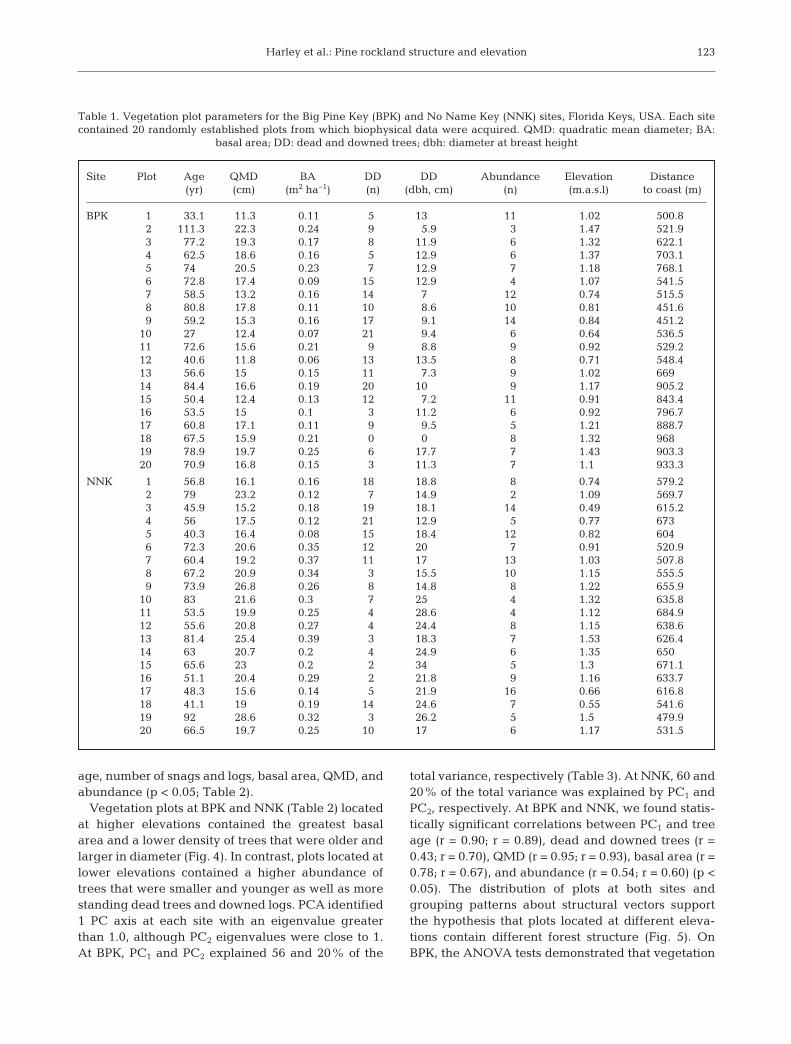
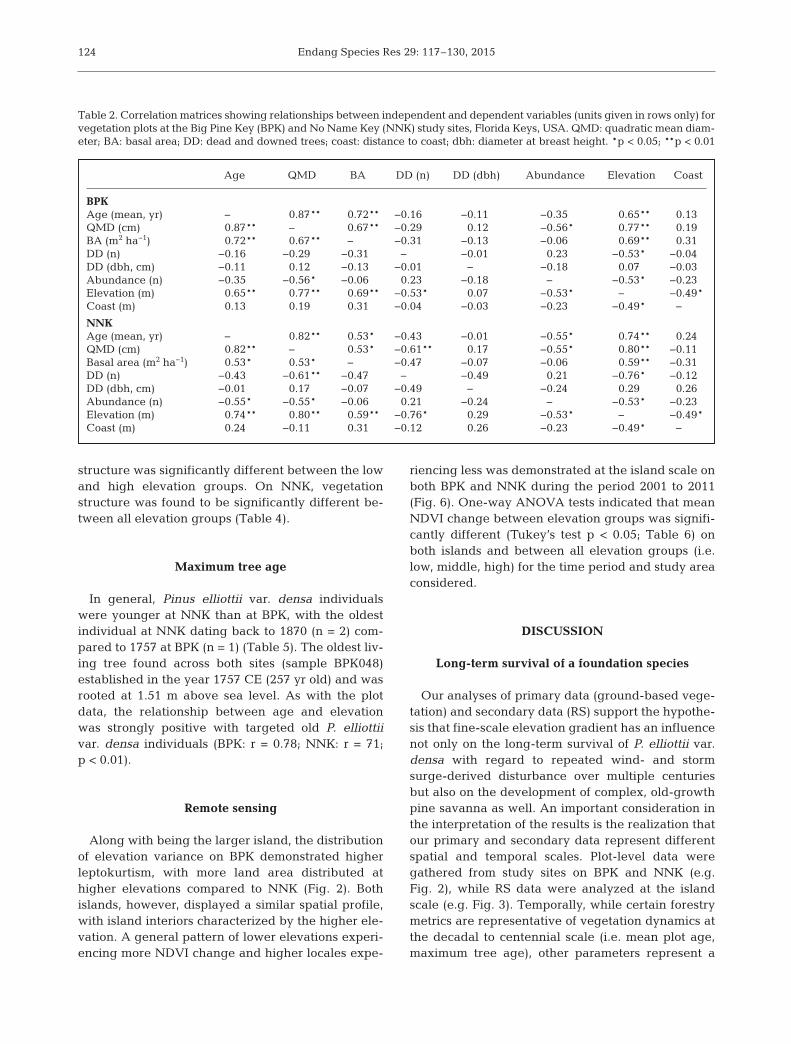
The elevation range at the BPK and NNK sitesbased on plot-level data was 0.55 to 1.26 m and 0.43to 1.31 m, respectively. Distance of plots to the coastranged from 500 to 968 m at BPK and from 480 to685 m at NNK (Table 1). Pearson correlation analysesrevealed no significant relationships between dis-tance of plot locations to the coast and plot-level veg-etation data collected at both sites (p > 0.01; Table 2).At BPK and NNK, however, a significant relationshipwas found between mean plot elevation and mean
122
Fig. 3. False color representations of Landsat images acquired for Big Pine Key and No Name Key in (a) 2001 and (b) 2011. Near-infrared response is shown as red in the images (spectral bands 4 [red], 3 [green], and 2 [blue]); thin white line: US Route 1
Harley et al.: Pine rockland structure and elevation
age, number of snags and logs, basal area, QMD, andabundance (p < 0.05; Table 2).
Vegetation plots at BPK and NNK (Table 2) locatedat higher elevations contained the greatest basalarea and a lower density of trees that were older andlarger in diameter (Fig. 4). In contrast, plots located atlower elevations contained a higher abundance oftrees that were smaller and younger as well as morestanding dead trees and downed logs. PCA identified1 PC axis at each site with an eigenvalue greaterthan 1.0, although PC2 eigenvalues were close to 1.At BPK, PC1 and PC2 explained 56 and 20% of the
total variance, respectively (Table 3). At NNK, 60 and20% of the total variance was explained by PC1 andPC2, respectively. At BPK and NNK, we found statis-tically significant correlations between PC1 and treeage (r = 0.90; r = 0.89), dead and downed trees (r =0.43; r = 0.70), QMD (r = 0.95; r = 0.93), basal area (r =0.78; r = 0.67), and abundance (r = 0.54; r = 0.60) (p <0.05). The distribution of plots at both sites andgrouping patterns about structural vectors supportthe hypothesis that plots located at different eleva-tions contain different forest structure (Fig. 5). OnBPK, the ANOVA tests demonstrated that vegetation
123
Site Plot Age QMD BA DD DD Abundance Elevation Distance(yr) (cm) (m2 ha−1) (n) (dbh, cm) (n) (m.a.s.l) to coast (m)
BPK 1 33.1 11.3 0.11 5 13 11 1.02 500.82 111.3 22.3 0.24 9 5.9 3 1.47 521.93 77.2 19.3 0.17 8 11.9 6 1.32 622.14 62.5 18.6 0.16 5 12.9 6 1.37 703.15 74 20.5 0.23 7 12.9 7 1.18 768.16 72.8 17.4 0.09 15 12.9 4 1.07 541.57 58.5 13.2 0.16 14 7 12 0.74 515.58 80.8 17.8 0.11 10 8.6 10 0.81 451.69 59.2 15.3 0.16 17 9.1 14 0.84 451.2
10 27 12.4 0.07 21 9.4 6 0.64 536.511 72.6 15.6 0.21 9 8.8 9 0.92 529.212 40.6 11.8 0.06 13 13.5 8 0.71 548.413 56.6 15 0.15 11 7.3 9 1.02 66914 84.4 16.6 0.19 20 10 9 1.17 905.215 50.4 12.4 0.13 12 7.2 11 0.91 843.416 53.5 15 0.1 3 11.2 6 0.92 796.717 60.8 17.1 0.11 9 9.5 5 1.21 888.718 67.5 15.9 0.21 0 0 8 1.32 96819 78.9 19.7 0.25 6 17.7 7 1.43 903.320 70.9 16.8 0.15 3 11.3 7 1.1 933.3
NNK 1 56.8 16.1 0.16 18 18.8 8 0.74 579.22 79 23.2 0.12 7 14.9 2 1.09 569.73 45.9 15.2 0.18 19 18.1 14 0.49 615.24 56 17.5 0.12 21 12.9 5 0.77 6735 40.3 16.4 0.08 15 18.4 12 0.82 6046 72.3 20.6 0.35 12 20 7 0.91 520.97 60.4 19.2 0.37 11 17 13 1.03 507.88 67.2 20.9 0.34 3 15.5 10 1.15 555.59 73.9 26.8 0.26 8 14.8 8 1.22 655.9
10 83 21.6 0.3 7 25 4 1.32 635.811 53.5 19.9 0.25 4 28.6 4 1.12 684.912 55.6 20.8 0.27 4 24.4 8 1.15 638.613 81.4 25.4 0.39 3 18.3 7 1.53 626.414 63 20.7 0.2 4 24.9 6 1.35 65015 65.6 23 0.2 2 34 5 1.3 671.116 51.1 20.4 0.29 2 21.8 9 1.16 633.717 48.3 15.6 0.14 5 21.9 16 0.66 616.818 41.1 19 0.19 14 24.6 7 0.55 541.619 92 28.6 0.32 3 26.2 5 1.5 479.920 66.5 19.7 0.25 10 17 6 1.17 531.5
Table 1. Vegetation plot parameters for the Big Pine Key (BPK) and No Name Key (NNK) sites, Florida Keys, USA. Each sitecontained 20 randomly established plots from which biophysical data were acquired. QMD: quadratic mean diameter; BA:
basal area; DD: dead and downed trees; dbh: diameter at breast height
Endang Species Res 29: 117–130, 2015
structure was significantly different between the lowand high elevation groups. On NNK, vegetationstructure was found to be significantly different be -tween all elevation groups (Table 4).
Maximum tree age
In general, Pinus elliottii var. densa individualswere younger at NNK than at BPK, with the oldestindividual at NNK dating back to 1870 (n = 2) com-pared to 1757 at BPK (n = 1) (Table 5). The oldest liv-ing tree found across both sites (sample BPK048)established in the year 1757 CE (257 yr old) and wasrooted at 1.51 m above sea level. As with the plotdata, the relationship between age and elevationwas strongly positive with targeted old P. elliottiivar. densa individuals (BPK: r = 0.78; NNK: r = 71;p < 0.01).
Remote sensing
Along with being the larger island, the distributionof elevation variance on BPK demonstrated higherleptokurtism, with more land area distributed athigher elevations compared to NNK (Fig. 2). Bothislands, however, displayed a similar spatial profile,with island interiors characterized by the higher ele-vation. A general pattern of lower elevations experi-encing more NDVI change and higher locales expe-
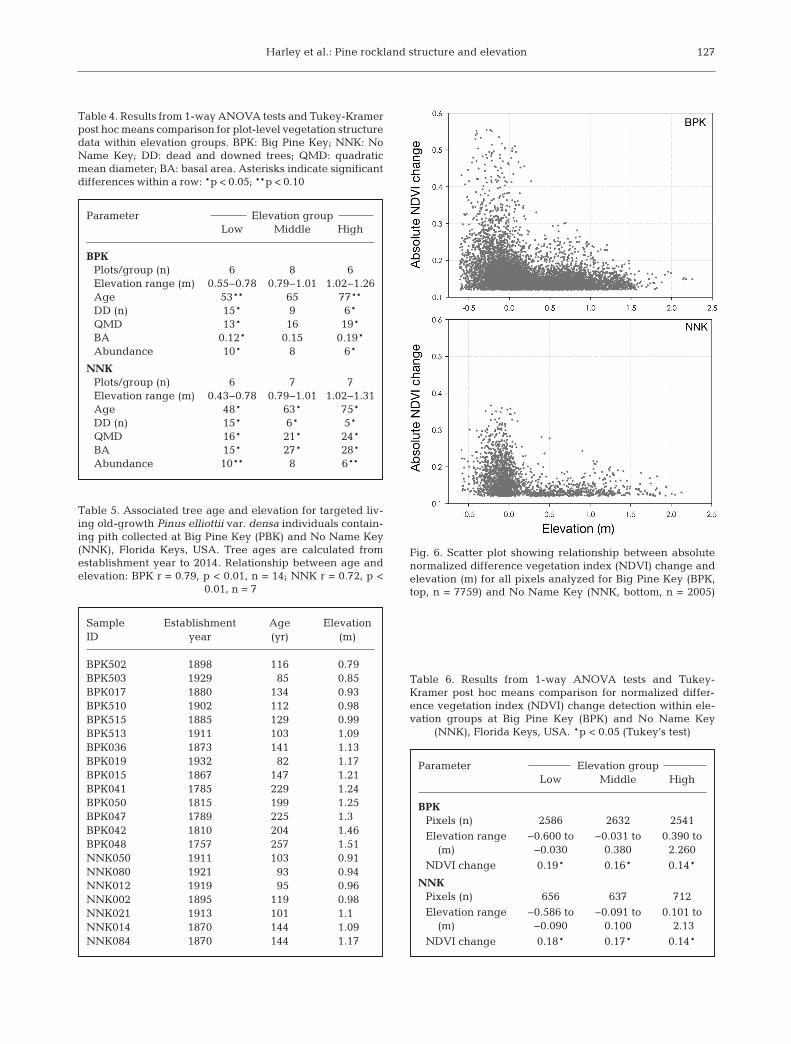
riencing less was demonstrated at the island scale onboth BPK and NNK during the period 2001 to 2011(Fig. 6). One-way ANOVA tests indicated that meanNDVI change between elevation groups was signifi-cantly different (Tukey’s test p < 0.05; Table 6) onboth islands and between all elevation groups (i.e.low, middle, high) for the time period and study areaconsidered.
DISCUSSION
Long-term survival of a foundation species
Our analyses of primary data (ground-based vege-tation) and secondary data (RS) support the hypothe-sis that fine-scale elevation gradient has an influencenot only on the long-term survival of P. elliottii var.densa with regard to repeated wind- and stormsurge-derived disturbance over multiple centuriesbut also on the development of complex, old-growthpine savanna as well. An important consideration inthe interpretation of the results is the realization thatour primary and secondary data represent differentspatial and temporal scales. Plot-level data weregathered from study sites on BPK and NNK (e.g.Fig. 2), while RS data were analyzed at the islandscale (e.g. Fig. 3). Temporally, while certain forestrymetrics are representative of vegetation dynamics atthe decadal to centennial scale (i.e. mean plot age,maximum tree age), other parameters represent a
124
Age QMD BA DD (n) DD (dbh) Abundance Elevation Coast
BPKAge (mean, yr) − 0.87** 0.72** −0.16 −0.11 −0.35 0.65** 0.13QMD (cm) 0.87** − 0.67** −0.29 0.12 −0.56* 0.77** 0.19BA (m2 ha−1) 0.72** 0.67** − −0.31 −0.13 −0.06 0.69** 0.31DD (n) −0.16 −0.29 −0.31 − −0.01 0.23 −0.53* −0.04DD (dbh, cm) −0.11 0.12 −0.13 −0.01 − −0.18 0.07 −0.03Abundance (n) −0.35 −0.56* −0.06 0.23 −0.18 − −0.53* −0.23Elevation (m) 0.65** 0.77** 0.69** −0.53* 0.07 −0.53* − −0.49*Coast (m) 0.13 0.19 0.31 −0.04 −0.03 −0.23 −0.49* −
NNKAge (mean, yr) − 0.82** 0.53* −0.43 −0.01 −0.55* 0.74** 0.24QMD (cm) 0.82** − 0.53* −0.61** 0.17 −0.55* 0.80** −0.11Basal area (m2 ha−1) 0.53* 0.53* − −0.47 −0.07 −0.06 0.59** −0.31DD (n) −0.43 −0.61** −0.47 − −0.49 0.21 −0.76* −0.12DD (dbh, cm) −0.01 0.17 −0.07 −0.49 − −0.24 0.29 0.26Abundance (n) −0.55* −0.55* −0.06 0.21 −0.24 − −0.53* −0.23Elevation (m) 0.74** 0.80** 0.59** −0.76* 0.29 −0.53* − −0.49*Coast (m) 0.24 −0.11 0.31 −0.12 0.26 −0.23 −0.49* −
Table 2. Correlation matrices showing relationships between independent and dependent variables (units given in rows only) forvegetation plots at the Big Pine Key (BPK) and No Name Key (NNK) study sites, Florida Keys, USA. QMD: quadratic mean diam-eter; BA: basal area; DD: dead and downed trees; coast: distance to coast; dbh: diameter at breast height. *p < 0.05; **p < 0.01

Harley et al.: Pine rockland structure and elevation
snapshot of structural conditions (i.e. QMD, basalarea, dead and downed trees, abundance). Despitescalar differences between the primary and second-ary sources, both suggest a similar influence of eleva-tion on vegetation, and results are thus interpreted inthe same way. Thus, we use the RS analyses as sup-porting evidence that strengthens the vegetation−elevation results gleaned from plot-level data.
The mechanisms responsible for permitting thelong-term survival of P. elliottii var. densa in a high-disturbance environment are likely a combination ofadaptive tree architecture (e.g. Everham & Brokaw1996, Platt et al. 2000) and associated protection fromstorm surge for trees rooted at higher elevations.Although not measured, visual comparisons betweenP. elliottii var. densa trees on mainland Florida and
125
Fig. 4. Linear regression charts for the Big Pine Key (black) and No Name Key (grey) sites, Florida Keys, showing relationshipsbetween elevation (m) and (a) mean plot tree age, (b) mean plot quadratic mean diameter (cm), (c) total number of dead anddowned material (n), (d) mean plot basal area (m2 ha−1), (e) total plot tree abundance (n), and (f) Euclidean distance of each
plot to the coastline

Endang Species Res 29: 117–130, 2015
the Florida Keys indicate a markeddifference in stature of individualson the Florida mainland. The archi-tecture of P. elliottii var. densa inthe Florida Keys contains featuresthat likely contribute to survivalagainst wind disturbance, such asshorter stems with flatter and broadercrowns. Because soils are thin to non-existent, root systems are laterallyspreading and anchored in the surfi-cial Miami limestone, which mightalso provide additional resistanceagainst strong winds. Canopy archi-tecture, however, does not protectagainst storm surge. Elevation is thusimportant for creating mosaics of var-ied vegetation structure over the landsurface related to storm surge eventsover the past several hundred years.
Hurricane Wilma is the most recentTC to produce a major impact on BPKand NNK. The storm created 2 sepa-rate surges on 23−24 October 2005,with a maximum surge of 2 m (FEMA2006). Of all plots (n = 40), trees (n =335), and associated elevations in -cluded in this study, the oldest tree(257 yr) was found at the highest ele-vation at just over 1.5 m, which sug-gests that this tree and both BPK andNNK sites were inundated with salt-water during the Hurricane Wilmasurge. Following the storm, the sur-vival of plants was controlled by ele-vation and drainage patterns (Sah etal. 2010) in that storm surge, andassociated salt deposits remained onthe surface and failed to movethrough the system due to historicdrought (Ross et al. 2009). On BPK,survival of P. elliottii var. densa roo -ted above 1 m was ≥75%, whereas<20% survived at lower elevations(Sah et al. 2010), which strongly supports our findings. A similar mor-tality-driven TC−drought interactionwas also found in coastal northernFlorida (DeSantis et al. 2007). Al -though storm surge from HurricaneWilma and numerous storms over thepast ca. 250 yr have inundated BPKand NNK, the long-term persistence
126
PCA parameter Correlation with variablesEigen- Variance Age DD QMD BA Abundancevalue (%) (yr) (n) (cm) (m2 ha–1) (n)
BPKPC1 2.81 56 0.90** −0.43** 0.95** 0.78** −0.54**PC2 0.99 20 0.21 0.27 −0.05 0.51** 0.78**PC3 0.9 18 − − − − −
NNKPC1 2.98 60 0.89** −0.70** 0.93** 0.67** −0.60**PC2 0.96 20 −0.15 −0.36 −0.07 0.57** 0.73**PC3 0.57 11 − − − − −
Table 3. Parameters of principal component analysis (PCA) and Pearson corre-lations between PC axes and dependent variables. DD: dead and downedtrees; QMD: quadratic mean diameter; BA: basal area; BPK: Big Pine Key;
NNK: No Name Key; −: no data. **p < 0.01
Fig. 5. Principal component analysis biplots for Big Pine Key (BPK, top) andNo Name Key (NNK, bottom), in which vectors represent vegetation parame-ters and circles represent vegetation plots (i.e. P1 is plot #1), with associatedgroups in low (open), middle (gray), and high (black) elevation classes. BA:basal area; D&D = dead and downed trees; QMD: quadratic mean diameter
Harley et al.: Pine rockland structure and elevation 127
Parameter Elevation groupLow Middle High
BPKPlots/group (n) 6 8 6Elevation range (m) 0.55−0.78 0.79−1.01 1.02−1.26Age 53** 65 77**DD (n) 15* 9 6*QMD 13* 16 19*BA 0.12* 0.15 0.19*Abundance 10* 8 6*
NNKPlots/group (n) 6 7 7Elevation range (m) 0.43−0.78 0.79−1.01 1.02−1.31Age 48* 63* 75*DD (n) 15* 6* 5*QMD 16* 21* 24*BA 15* 27* 28*Abundance 10** 8 6**
Table 4. Results from 1-way ANOVA tests and Tukey-Kramerpost hoc means comparison for plot-level vegetation structuredata within elevation groups. BPK: Big Pine Key; NNK: NoName Key; DD: dead and downed trees; QMD: quadraticmean diameter; BA: basal area. Asterisks indicate significantdifferences within a row: *p < 0.05; **p < 0.10
Sample Establishment Age ElevationID year (yr) (m)
BPK502 1898 116 0.79BPK503 1929 85 0.85BPK017 1880 134 0.93BPK510 1902 112 0.98BPK515 1885 129 0.99BPK513 1911 103 1.09BPK036 1873 141 1.13BPK019 1932 82 1.17BPK015 1867 147 1.21BPK041 1785 229 1.24BPK050 1815 199 1.25BPK047 1789 225 1.3BPK042 1810 204 1.46BPK048 1757 257 1.51NNK050 1911 103 0.91NNK080 1921 93 0.94NNK012 1919 95 0.96NNK002 1895 119 0.98NNK021 1913 101 1.1NNK014 1870 144 1.09NNK084 1870 144 1.17
Table 5. Associated tree age and elevation for targeted liv-ing old-growth Pinus elliottii var. densa individuals contain-ing pith collected at Big Pine Key (PBK) and No Name Key(NNK), Florida Keys, USA. Tree ages are calculated fromestablishment year to 2014. Relationship between age andelevation: BPK r = 0.79, p < 0.01, n = 14; NNK r = 0.72, p <
0.01, n = 7
Fig. 6. Scatter plot showing relationship between absolutenormalized difference vegetation index (NDVI) change andelevation (m) for all pixels analyzed for Big Pine Key (BPK,top, n = 7759) and No Name Key (NNK, bottom, n = 2005)
Parameter Elevation groupLow Middle High
BPKPixels (n) 2586 2632 2541
Elevation range −0.600 to −0.031 to 0.390 to (m) −0.030 0.380 2.260
NDVI change 0.19* 0.16* 0.14*
NNKPixels (n) 656 637 712
Elevation range −0.586 to −0.091 to 0.101 to(m) −0.090 0.100 2.13
NDVI change 0.18* 0.17* 0.14*
Table 6. Results from 1-way ANOVA tests and Tukey-Kramer post hoc means comparison for normalized differ-ence vegetation index (NDVI) change detection within ele-vation groups at Big Pine Key (BPK) and No Name Key
(NNK), Florida Keys, USA. *p < 0.05 (Tukey’s test)

Endang Species Res 29: 117–130, 2015
of P. elliottii var. densa individuals and developmentof old-growth pine rocklands is possible at higherelevations.
Vegetation structure and elevation
Vegetation structure across the 40 plots at both theBPK and NNK sites revealed a common pattern ofstructure relative to elevation that exists in pine rock-land communities, and this pattern was further bol-stered with finding less NDVI change at higher ele-vations during the period 2001 to 2011. An importantconsideration in the interpretation of vegetationstructure results is that elevation is one of severaldrivers of vegetation patterns within Florida Keyspine rocklands. Irrespective of natural and anthro-pogenic disturbance, complex interactions and indi-rect effects among elevation (Ross et al. 1992, 1994,2009, Maschinski et al. 2011, S. Saha et al. 2011), fire(Sah et al. 2010), and groundwater salinity (Ross et al.1992) drive vegetation patterns in rockland commu-nities. Thus, elevation alone is not the sole influenceon vegetation structure. We are not the first toacknowledge the influence of elevation on pine rock-land vegetation patterns. Ross et al. (1992) noted theconnection between elevation gradient within indi-vidual islands, with the majority of pines located onupland site locations. Maschinski et al. (2011) furtherexpanded this notion and highlighted conservationstrategies for rare and endemic species within pinerocklands, as well as the entire community, withregard to elevation and sea level rise. Here, we buildon these and other previous studies and provide theability to identify core conservation areas using spa-tial vegetation structure and tree age data, particu-larly if conservation decisions are made to conduct insitu improvement of ecosystem resiliency (Maschin-ski et al. 2011).
The maximum P. elliottii var. densa age data pro-vided a new perspective of the long-term age po -tential for the species (Brown 1996) as well as an age−elevation relationship that mirrored the plot-levelvegetation data. The BPK plot containing the oldestmean age (111.3 yr) was located at the highest eleva-tion of all plots (1.47 m) included in the study, and thiswas the general pattern at NNK as well. Likewise, theoldest targeted tree we found on both islands wasrooted within the BPK site at an elevation of 1.51 m.The spatial representation of the plot scores on PC1—which explained a large amount of variance at bothsites and produced the only eigenvalue greater than1 — indicates the influence that fine-scale elevation
variation has on pine rockland savanna structure. Allelevation groups at NNK were significantly different(p < 0.05) in tree age, size, basal area, abundance, andthe amount of remnant material. At BPK, however,only the lowest and highest elevation groups weresignificantly different. This finding could be anartifact of the wider range of elevation between plotsinstalled at NNK compared to BPK. At NNK, elevationrange between plots was 0.88 m (0.43 to 1.31 m),whereas the range at BPK was 0.71 m (0.55 to 1.26 m).Compared to lower habitat areas, higher elevationshad marked structural differences and are comprisedof larger, older, and fewer trees. Yet, despite the intra-specific elevation range between sites, such small dif-ferences in topographic relief demonstrate the subtlebut strong influence that fine-scale elevation changehas on driving vegetation patterns across islands inthe Florida Keys, particularly in a region with a highlyfrequent natural disturbance regime dominated byTCs.
The influence of TC-derived wind damage on veg-etation patterns is well documented (e.g. Foster &Boose 1992, Boose et al. 1994, Foster & Motzkin 1998,Platt et al. 2000, Bellingham et al. 2005, Tsujino et al.2006). In pine savannas of the southern Florida main-land, Platt et al. (2000) reported P. elliottii var. densato be resistant to the damaging winds during Hurri-cane Andrew (1992), and mortality was lower in old-growth stands (16.9% ± 3.1, mean ± SE) compared tosecond-growth stands. However, the importance offine-scale elevation gradient on vegetation patternswith regard to TC-induced storm surge is less docu-mented.
The demonstrated resistance of P. elliottii var.densa to wind damage (e.g. Platt et al. 2000) and thelinkage between old-growth vegetation structureand fine-scale elevation variation indicates that TC-induced storm surge, rather than wind, is the primarydisturbance agent in pine savannas of the FloridaKeys (e.g. Craighead & Gilbert 1962, Gardner et al.1992, Ross et al. 2009). Thus, similarities exist be -tween the role that elevation plays in the FloridaKeys pine savannas and riparian zone bottomlandforests. The role of microtopography in ecosystemdevelopment and function in bottomland regions hasbeen widely demonstrated. Microtopographic varia-tion, for example in the form of ridges, sloughs, flats,and hummocks, control local hydrologic conditionsand soils, which influences the establishment andsurvival of plant species (Hodges 1997, Grell et al.2005, Simmons et al. 2012).
As an underlying mechanism for controlling vege-tation structure in the Florida Keys, the importance of
128
Harley et al.: Pine rockland structure and elevation
fine-scale elevation variance was also demonstratedin an old-growth bottomland hardwood-P. taeda for-est in Arkansas. Grell et al. (2005) analyzed a widerange of forest metrics and environmental physio -gnomies grouped in 0.50 m elevation classes along a1.5 m gradient and concluded that vegetation struc-ture was primarily controlled by subtle elevationvariations. At BPK, high, middle, and low elevationclasses covered group ranges of 0.22, 0.23, and0.24 m over an elevation gradient of 0.71 m, andgroups at NNK covered ranges of 0.35, 0.22, and0.29 m over a 0.88 m gradient. Compared to the ele-vation groups and gradient used by Grell et al.(2005), vegetation structure of pine rocklands in theFlorida Keys is controlled by elevation differencesthat vary at a similar but finer scale.
We demonstrate the importance of elevation gradi-ent on controlling pine rockland vegetation structurewithin the 2 largest remaining habitat areas in theFlorida Keys, BPK and NNK. Combined disturbancesof habitat fragmentation, fire (Bergh & Wisby 1996,Sah et al. 2010, Harley et al. 2013), sea level rise(Ross et al. 1994, 2009, A. K. Saha et al. 2011), andTCs (Platt et al. 2002, Ross et al. 2009, Sah et al. 2010,S. Saha et al. 2011) have limited the geographic dis-tribution of the endangered pine rockland ecosystemin the Florida Keys. Despite existing in such a high-frequency disturbance re gime with multiple agents,the long-term persistence of the foundation species P.elliottii var. densa de pends on elevation variationsthat exist at a sub-meter scale. We provide betterunderstanding of pine rockland demography withrespect to elevation controls that can be used to aid insitu conservation efforts in the Florida Keys. Despiteour limited geographic scope, the influence of NorthAtlantic TCs on ecosystems along the Gulf andAtlantic coasts is severe and widespread. Thus, thestrong ele vation− vegetation structure relationshipsshown on these 2 islands might operate along similargradients and scales in other related environments,such as other low-relief carbonate islands in the Car-ibbean region or transgressive barrier island systemsalong the Gulf and Atlantic coasts of the USA.
Acknowledgements. Support was provided by the NationalScience Foundation under Grant Nos. 1002479 and 0538420and by the US Fish and Wildlife Service. We thank AnneMorkill and Chad Anderson for access to the National KeyDeer Refuge, and Henri Grissino-Mayer, Sally Horn, JohnSakulich, Rebecca Stratton, Kody Honeyman, Niki Garland,Ann McGhee, and Alex Pilote for field assistance. We thank2 anonymous reviewers for giving their time and energy tooffer comments and suggestions that improved earlier draftsof this manuscript.
LITERATURE CITED
Applequist MB (1958) A simple pith locator for use with off-centre increment cores. J For 56: 141
Åström M, Dynesius M, Hylander K, Nilsson C (2007) Slopeaspect modifies community responses to clear-cutting inboreal forests. Ecology 88: 749−758
Batista WB, Platt WJ (2003) Tree population responses tohurricane disturbance: syndromes in a south-easternUSA old-growth forest. J Ecol 91: 197−212
Bellingham PJ, Tanner EV, Healey JR (2005) Hurricane dis-turbance accelerates invasion by the alien tree Pittospo-rum undulatum in Jamaican montane rain forests. J VegSci 16: 675−684
Bergh C, Wisby J (1996) Fire history of lower Keys pinerocklands. Nature Conservancy, Florida Keys Initiative,Key West, FL
Boose ER, Foster DR, Fluet M (1994) Hurricane impacts totropical and temperate forest landscapes. Ecol Monogr64: 369−400
Brown PM (1996) OLDLIST: a database of maximum treeages. In: Dean JS, Meko DM, Swetnam TW (eds) Treerings, environment and humanity: Proceedings of theInternational Conference, Tucson, Arizona, 17-21 May,1994. Radiocarbon Tuscon, AZ, p 727−731
Craighead FC, Gilbert VC (1962) The effects of HurricaneDonna on the vegetation of southern Florida. Q J FlaAcad Sci 25: 1−28
Curtis RO, Marshall DD (2000) Why quadratic mean diame-ter? West J Appl For 15: 137−139
Danz NP, Reich PB, Frelich LE, Niemi GJ (2011) Vegetationcontrols vary across space and spatial scale in a historicgrassland−forest biome boundary. Ecography 34: 402−414
DeSantis LR, Bhotika S, Williams K, Putz FE (2007) Sea levelrise and drought interactions accelerate forest decline onthe Gulf Coast of Florida USA. Glob Change Biol 13: 2349−2360
Everham EM III, Brokaw NVL (1996) Forest damage andrecovery from catastrophic wind. Bot Rev 62: 113−185
FEMA (Federal Emergency Management Agency) (2006)Final coastal high water mark collection for HurricaneWilma in Florida. Hazard Mitigation Technical Assis-tance Program, FEMA-1609-DR-FL, Task Order 460.URS Group, Gaithersburg, MD
Foster DR (1988) Species and stand response to catastrophicwind in central New England, USA. J Ecol 76: 135−151
Foster DR, Boose ER (1992) Patterns of forest damage result-ing from catastrophic wind in central New England,USA. J Ecol 80: 79−98
Foster DR, Motzkin G (1998) Ecology and conservation inthe cultural landscape of New England: lessons fromnature’s history. Northeast Nat 5: 111−126
Gardner LR, Michener WK, Williams TM, Blood ER and others (1992) Disturbance effects of Hurricane Hugo on apristine coastal landscape: North Inlet, South Carolina,USA. Neth J Sea Res 30: 249−263
Grell AG, Shelton MG, Heitzman E (2005) Changes in plantspecies composition along an elevation gradient in anold-growth bottomland hardwood-Pinus taeda forest insouthern Arkansas. J Torrey Bot Soc 132: 72−89
Harley GL, Grissino-Mayer HD, Horn SP (2013) Fire historyand forest structure of an endangered subtropical eco-system in the Florida Keys USA. Int J Wildland Fire 22: 394−404
129

Endang Species Res 29: 117–130, 2015130
Hodges JD (1997) Development and ecology of bottomlandhardwood sites. For Ecol Manage 90: 117−125
Hopkinson CS, Lugo AE, Alber M, Covich AP, Van Bloem SJ(2008) Forecasting effects of sea-level rise and wind-storms on coastal and inland ecosystems. Front Ecol Environ 6: 255−263
Hylander K (2005) Aspect modifies the magnitude of edgeeffects on bryophyte growth in boreal forests. J Appl Ecol42: 518−525
Kiss L, Magnin F (2003) The impact of fire on some Mediter-ranean land snail communities and patterns of post-firerecolonization. J Molluscan Stud 69: 43−53
Lugo AE (2008) Visible and invisible effects of hurricanes onforest ecosystems: an international review. Austral Ecol33: 368−398
Maschinski J, Ross MS, Liu H, O’Brien J, von Wettberg EJ,Haskins KE (2011) Sinking ships: conservation optionsfor endemic taxa threatened by sea level rise. ClimChange 107: 147−167
Matthaei CD, Arbuckle CJ, Townsend CR (2000) Stable sur-face stones as refugia for invertebrates during distur-bance in a New Zealand stream. J N Am Benthol Soc 19: 82−93
Needham HF, Keim BD (2012) A storm surge database forthe US Gulf Coast. Int J Climatol 32: 2108−2123
Palik BJ, Pederson N (1996) Overstory mortality and canopydisturbances in longleaf pine ecosystems. Can J Res 26: 2035−2047
Pederson N (2010) External characteristics of old trees in theeastern deciduous forest. Nat Areas J 30: 396−407
Pimm SL, Davis GE, Loope L, Roman CT, Smith TJ III, TilmantJT (1994) Hurricane Andrew. BioScience 44: 224−229
Platt WJ, Rathbun SL (1993) Dynamics of an old-growthlong leaf pine population. Proc Tall Timbers Fire EcolConf 18: 275−297
Platt WJ, Evans GW, Davis MM (1988) Effects of fire seasonon flowering of forbs and shrubs in longleaf pine forests.Oecologia 76: 353−363
Platt WJ, Doren RF, Armentano TV (2000) Effects of Hurri-cane Andrew on stands of slash pine Pinus elliottii var.densa in the everglades region of south Florida (USA).Plant Ecol 146: 43−60
Platt WJ, Beckage B, Doren RF, Slater HH (2002) Interac-tions of large-scale disturbances: prior fire regimes andhurricane mortality of savanna pines. Ecology 83: 1566−1572
Ross MS, O’Brien JJ, Flynn LJ (1992) Ecological site classifi-cation of Florida Keys terrestrial habitats. Biotropica 24:488–502
Ross MS, Obrien JJ, Sternberg LDL (1994) Sea-level rise andthe reduction in pine forests in the Florida Keys. EcolAppl 4:144–156
Ross MS, O’Brien JJ, Ford RG, Zhang K, Morkill A (2009)Disturbance and the rising tide: the challenge of bio -diversity management on low-island ecosystems. FrontEcol Environ 7: 471−478
Sah JP, Ross MS, Koptur S, Snyder JR (2004) Estimatingaboveground biomass of broadleaved woody plants inthe understory of Florida Keys pine forests. For EcolManage 203: 319−329
Sah JP, Ross MS, Snyder JR, Ogurcak DE (2010) Tree mor-tality following prescribed fire and a storm surge event inslash pine Pinus elliottii var. densa forests in the FloridaKeys, USA. Int J For Res 2010: 204795
Saha AK, Saha S, Sadle J, Jiang J and others (2011) Sea levelrise and South Florida coastal forests. Clim Change 107: 81−108
Saha S, Bradley K, Ross MS, Hughes P, Wilmers T, Ruiz PL,Bergh C (2011) Hurricane effects on subtropical pinerocklands of the Florida Keys. Clim Change 107: 169−184
Schmalholz M, Hylander K (2011) Microtopography createssmall scale refugia for boreal forest floor bryophytes dur-ing clear-cut logging. Ecography 34: 637−648
Simmons ME, Wu XB, Whisenant SG (2012) Responses ofpioneer and later successional plant assemblages to cre-ated microtopographic variation and soil treatments inriparian forest restoration. Restor Ecol 20: 369−377
Snyder JR, Herndon A, Robertson WB (1990) South Floridarockland. In: Myers RL, Ewel JJ (eds) Ecosystems ofFlorida. University Press of Florida, Gainesville, FL,p 230−277
Stokes MA, Smiley TL (1968) An introduction to tree-ringdating. University of Arizona Press, Tucson, AZ
Tsujino R, Takafumi H, Agetsuma N, Yumoto T (2006) Vari-ation in tree growth, mortality and recruitment amongtopographic positions in a warm temperate forest. J VegSci 17(3):281-290
USFWS (US Fish and Wildlife Service) (2009) U.S. fish andwildlife service species assessment and listing priorityassignment form date of annual review:May 16, 2009conducted by: Paula Halupa. South Florida EcologicalServices Office, FL
Editorial responsibility: Hans Juergen Boehmer, Bonn, Germany
Submitted: May 13, 2015; Accepted: October 9, 2015Proofs received from author(s): December 2, 2015


![A Flexible Hybrid Model of Life Cycle Carbon Balance for ...carboncenter.ifas.ufl.edu/models/integrated_model...Franco) [13] or slash pine (Pinus elliottii Engelm. var. elliottii)](https://img.pdfslide.us/doc/110x75/6074fb07d893f122622c9e06/a-flexible-hybrid-model-of-life-cycle-carbon-balance-for-franco-13-or.jpg)