Embed Size (px)
Citation preview

s
EElleettrroobbrráásSS
r
MMaarrkkeettlleetttteereepptteemmbbeerr // 22000011
INDEX
I CONSOLIDATED BALANCE SHEET – IN R$
Assets 1Liabilities 2Operating Revues 3
II STATEMENT INVESTIMENTS 4
III CAPITAL STRUCTURE 5
IV TWELVE MONTH BALANCE SHEET - SUMMARY
Assets 6Liabilities 7Operating Revues 8
V TWELVE MONTH RATIOS - SUMMARY 9
VI STOCK MARKET 10
VII ADR’S MARKET 11
VIII INSTITUCIONAL INFORMATION 12
IX BALANCE SHEET – IN US$
Assets 13Liabilities 14Operating Revues 15
DF/DFRAv. Presidente Vargas, 409 - 9º andarCEP 20071-003 - Rio de Janeiro - RJTel.: (21) 2514-6331 / 2514-6333Fax.: (21) 2242-2694E-mail: [email protected]
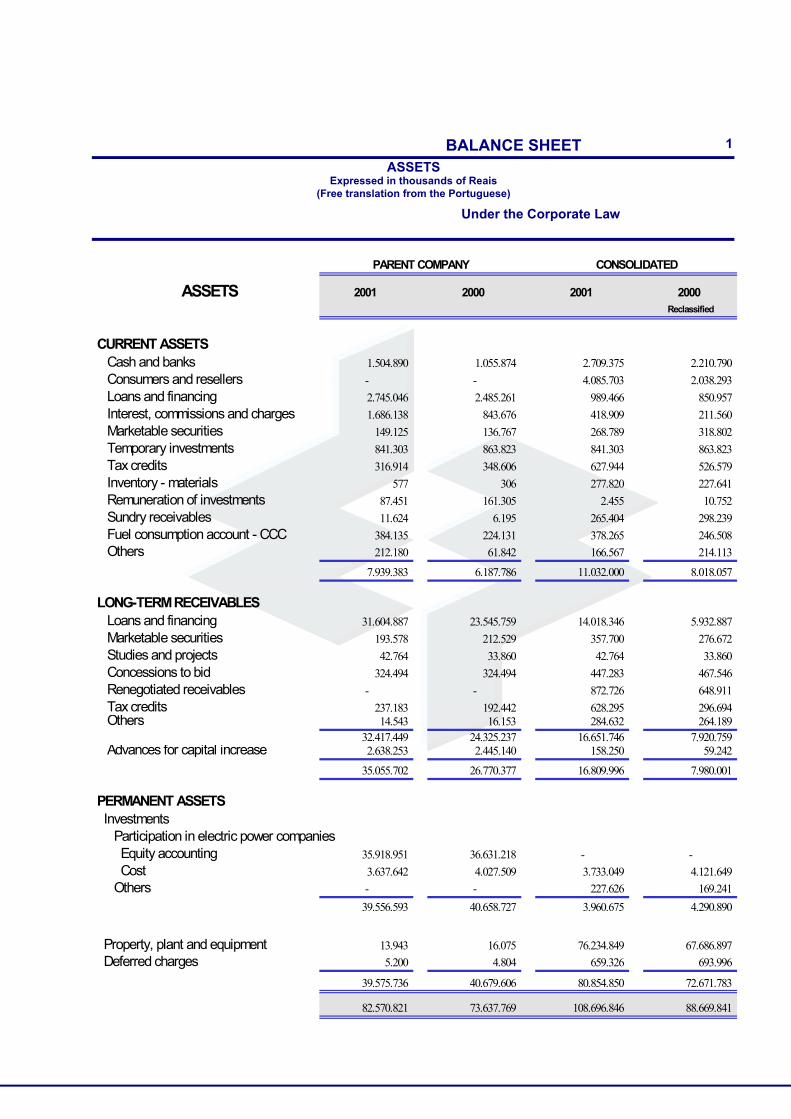
BALANCE SHEET 1
ASSETSExpressed in thousands of Reais
(Free translation from the Portuguese)
Under the Corporate Law
PARENT COMPANY CONSOLIDATED
ASSETS 2001 2000 2001 2000Reclassified
CURRENT ASSETS Cash and banks 1.504.890 1.055.874 2.709.375 2.210.790
Consumers and resellers - - 4.085.703 2.038.293
Loans and financing 2.745.046 2.485.261 989.466 850.957
Interest, commissions and charges 1.686.138 843.676 418.909 211.560
Marketable securities 149.125 136.767 268.789 318.802
Temporary investments 841.303 863.823 841.303 863.823
Tax credits 316.914 348.606 627.944 526.579
Inventory - materials 577 306 277.820 227.641
Remuneration of investments 87.451 161.305 2.455 10.752
Sundry receivables 11.624 6.195 265.404 298.239
Fuel consumption account - CCC 384.135 224.131 378.265 246.508
Others 212.180 61.842 166.567 214.113
7.939.383 6.187.786 11.032.000 8.018.057
LONG-TERM RECEIVABLES Loans and financing 31.604.887 23.545.759 14.018.346 5.932.887
Marketable securities 193.578 212.529 357.700 276.672
Studies and projects 42.764 33.860 42.764 33.860
Concessions to bid 324.494 324.494 447.283 467.546
Renegotiated receivables - - 872.726 648.911
Tax credits 237.183 192.442 628.295 296.694 Others 14.543 16.153 284.632 264.189
32.417.449 24.325.237 16.651.746 7.920.759 Advances for capital increase 2.638.253 2.445.140 158.250 59.242
35.055.702 26.770.377 16.809.996 7.980.001
PERMANENT ASSETS Investments Participation in electric power companies Equity accounting 35.918.951 36.631.218 - -
Cost 3.637.642 4.027.509 3.733.049 4.121.649
Others - - 227.626 169.241
39.556.593 40.658.727 3.960.675 4.290.890
Property, plant and equipment 13.943 16.075 76.234.849 67.686.897
Deferred charges 5.200 4.804 659.326 693.996
39.575.736 40.679.606 80.854.850 72.671.783
82.570.821 73.637.769 108.696.846 88.669.841
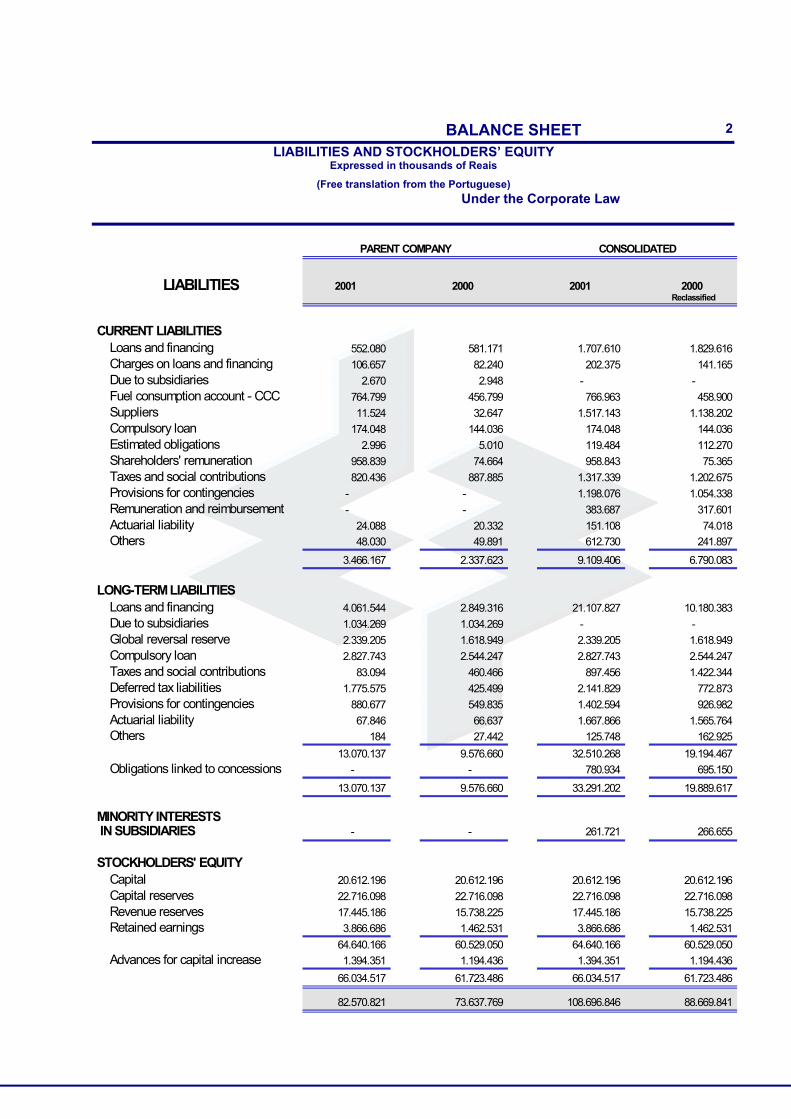
BALANCE SHEET 2
LIABILITIES AND STOCKHOLDERS’ EQUITYExpressed in thousands of Reais
(Free translation from the Portuguese)
Under the Corporate Law
PARENT COMPANY CONSOLIDATED
LIABILITIES 2001 2000 2001 2000Reclassified
CURRENT LIABILITIES Loans and financing 552.080 581.171 1.707.610 1.829.616
Charges on loans and financing 106.657 82.240 202.375 141.165
Due to subsidiaries 2.670 2.948 - -
Fuel consumption account - CCC 764.799 456.799 766.963 458.900
Suppliers 11.524 32.647 1.517.143 1.138.202
Compulsory loan 174.048 144.036 174.048 144.036
Estimated obligations 2.996 5.010 119.484 112.270
Shareholders' remuneration 958.839 74.664 958.843 75.365
Taxes and social contributions 820.436 887.885 1.317.339 1.202.675
Provisions for contingencies - - 1.198.076 1.054.338
Remuneration and reimbursement - - 383.687 317.601
Actuarial liability 24.088 20.332 151.108 74.018
Others 48.030 49.891 612.730 241.897
3.466.167 2.337.623 9.109.406 6.790.083
LONG-TERM LIABILITIES Loans and financing 4.061.544 2.849.316 21.107.827 10.180.383
Due to subsidiaries 1.034.269 1.034.269 - -
Global reversal reserve 2.339.205 1.618.949 2.339.205 1.618.949
Compulsory loan 2.827.743 2.544.247 2.827.743 2.544.247
Taxes and social contributions 83.094 460.466 897.456 1.422.344
Deferred tax liabilities 1.775.575 425.499 2.141.829 772.873
Provisions for contingencies 880.677 549.835 1.402.594 926.982
Actuarial liability 67.846 66.637 1.667.866 1.565.764
Others 184 27.442 125.748 162.925
13.070.137 9.576.660 32.510.268 19.194.467
Obligations linked to concessions - - 780.934 695.150
13.070.137 9.576.660 33.291.202 19.889.617
MINORITY INTERESTS IN SUBSIDIARIES - - 261.721 266.655
STOCKHOLDERS' EQUITY Capital 20.612.196 20.612.196 20.612.196 20.612.196
Capital reserves 22.716.098 22.716.098 22.716.098 22.716.098
Revenue reserves 17.445.186 15.738.225 17.445.186 15.738.225
Retained earnings 3.866.686 1.462.531 3.866.686 1.462.531
64.640.166 60.529.050 64.640.166 60.529.050
Advances for capital increase 1.394.351 1.194.436 1.394.351 1.194.436
66.034.517 61.723.486 66.034.517 61.723.486
82.570.821 73.637.769 108.696.846 88.669.841
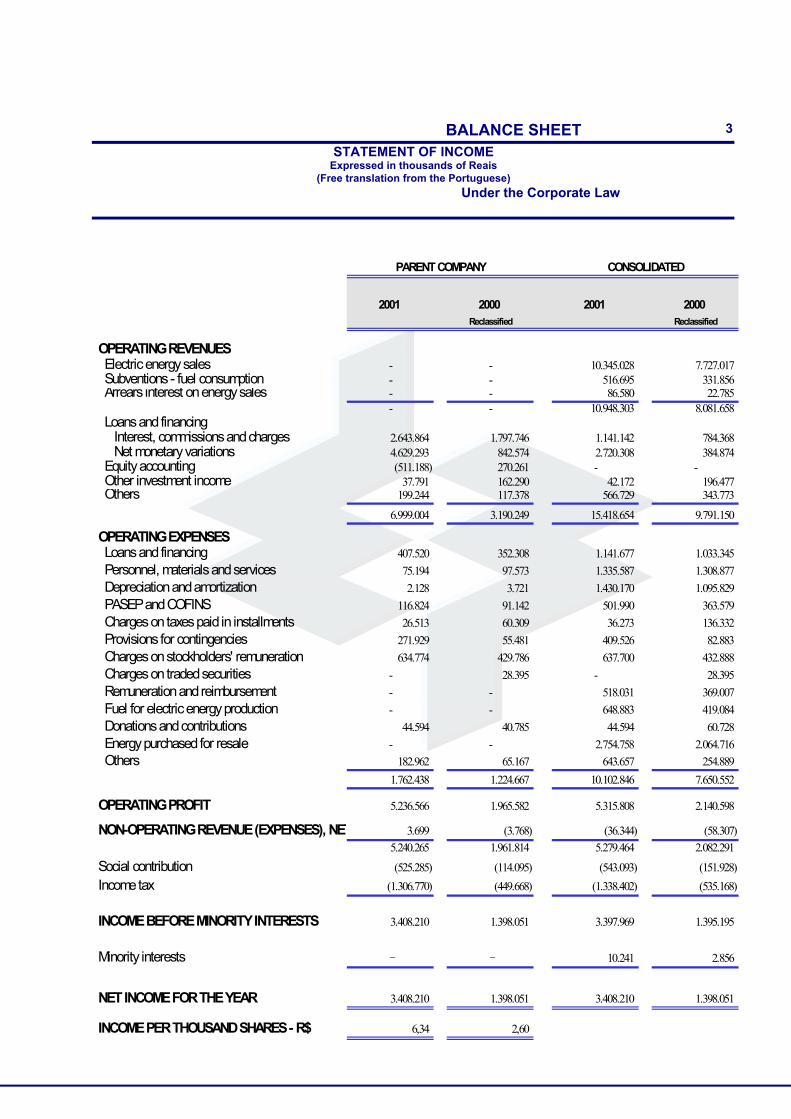
BALANCE SHEET 3
STATEMENT OF INCOMEExpressed in thousands of Reais
(Free translation from the Portuguese)
Under the Corporate Law
PARENT COMPANY CONSOLIDATED
2001 2000 2001 2000Reclassified Reclassified
OPERATING REVENUES Electric energy sales - - 10.345.028 7.727.017 Subventions - fuel consumption - - 516.695 331.856 Arrears interest on energy sales - - 86.580 22.785
- - 10.948.303 8.081.658 Loans and financing Interest, commissions and charges 2.643.864 1.797.746 1.141.142 784.368 Net monetary variations 4.629.293 842.574 2.720.308 384.874 Equity accounting (511.188) 270.261 - - Other investment income 37.791 162.290 42.172 196.477 Others 199.244 117.378 566.729 343.773
6.999.004 3.190.249 15.418.654 9.791.150
OPERATING EXPENSES Loans and financing 407.520 352.308 1.141.677 1.033.345
Personnel, materials and services 75.194 97.573 1.335.587 1.308.877
Depreciation and amortization 2.128 3.721 1.430.170 1.095.829
PASEP and COFINS 116.824 91.142 501.990 363.579
Charges on taxes paid in installments 26.513 60.309 36.273 136.332
Provisions for contingencies 271.929 55.481 409.526 82.883
Charges on stockholders' remuneration 634.774 429.786 637.700 432.888
Charges on traded securities - 28.395 - 28.395
Remuneration and reimbursement - - 518.031 369.007
Fuel for electric energy production - - 648.883 419.084
Donations and contributions 44.594 40.785 44.594 60.728
Energy purchased for resale - - 2.754.758 2.064.716
Others 182.962 65.167 643.657 254.889
1.762.438 1.224.667 10.102.846 7.650.552
OPERATING PROFIT 5.236.566 1.965.582 5.315.808 2.140.598
NON-OPERATING REVENUE (EXPENSES), NET 3.699 (3.768) (36.344) (58.307)
5.240.265 1.961.814 5.279.464 2.082.291
Social contribution (525.285) (114.095) (543.093) (151.928)
Income tax (1.306.770) (449.668) (1.338.402) (535.168)
INCOME BEFORE MINORITY INTERESTS 3.408.210 1.398.051 3.397.969 1.395.195
Minority interests - - 10.241 2.856
NET INCOME FOR THE YEAR 3.408.210 1.398.051 3.408.210 1.398.051
INCOME PER THOUSAND SHARES - R$ 6,34 2,60
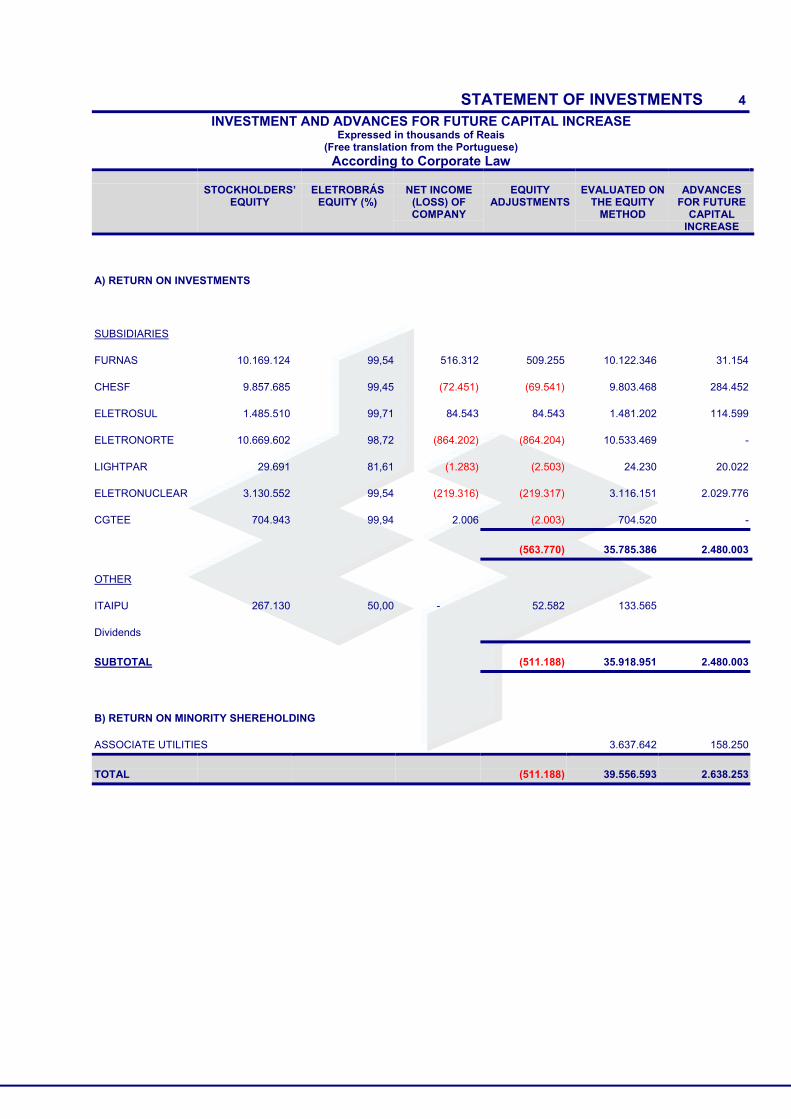
STATEMENT OF INVESTMENTS 4INVESTMENT AND ADVANCES FOR FUTURE CAPITAL INCREASE
Expressed in thousands of Reais(Free translation from the Portuguese)
According to Corporate Law
STOCKHOLDERS’EQUITY
ELETROBRÁSEQUITY (%)
NET INCOME(LOSS) OFCOMPANY
EQUITYADJUSTMENTS
EVALUATED ONTHE EQUITY
METHOD
ADVANCESFOR FUTURE
CAPITALINCREASE
A) RETURN ON INVESTMENTS
SUBSIDIARIES
FURNAS 10.169.124 99,54 516.312 509.255 10.122.346 31.154
CHESF 9.857.685 99,45 (72.451) (69.541) 9.803.468 284.452
ELETROSUL 1.485.510 99,71 84.543 84.543 1.481.202 114.599
ELETRONORTE 10.669.602 98,72 (864.202) (864.204) 10.533.469 -
LIGHTPAR 29.691 81,61 (1.283) (2.503) 24.230 20.022
ELETRONUCLEAR 3.130.552 99,54 (219.316) (219.317) 3.116.151 2.029.776
CGTEE 704.943 99,94 2.006 (2.003) 704.520 -
(563.770) 35.785.386 2.480.003
OTHER
ITAIPU 267.130 50,00 - 52.582 133.565
Dividends
SUBTOTAL (511.188) 35.918.951 2.480.003
B) RETURN ON MINORITY SHEREHOLDING
ASSOCIATE UTILITIES 3.637.642 158.250
TOTAL (511.188) 39.556.593 2.638.253
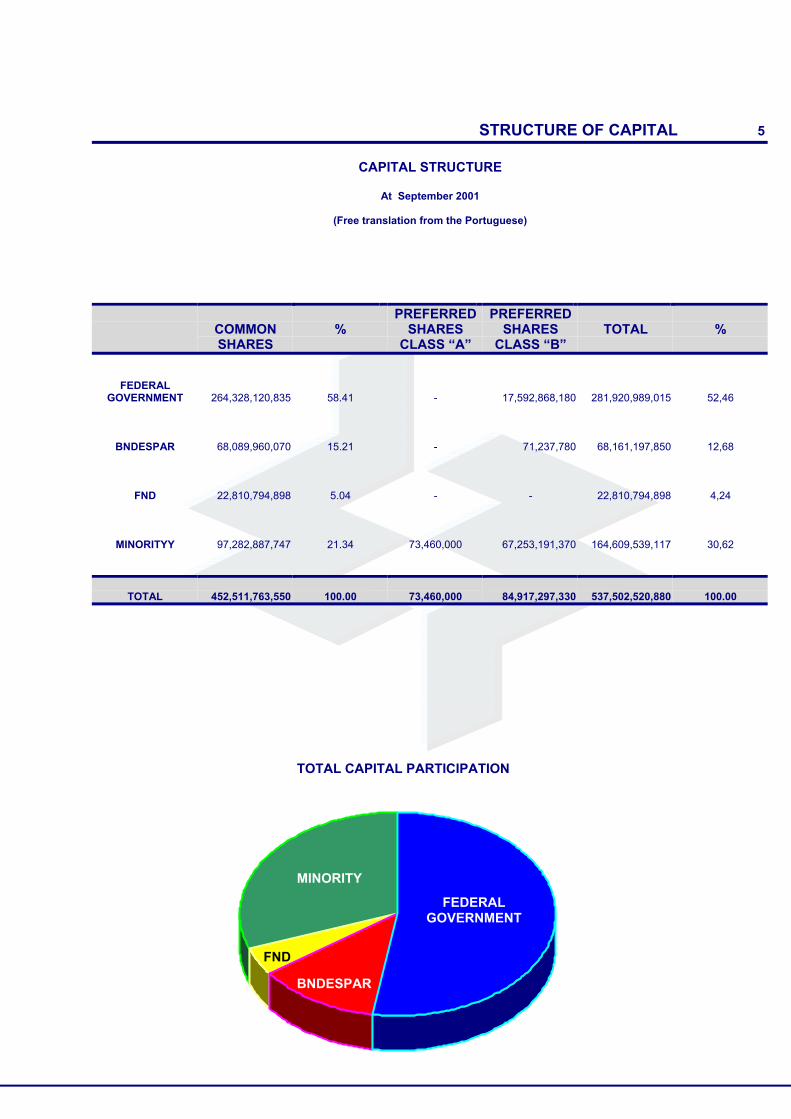
STRUCTURE OF CAPITAL 5
CAPITAL STRUCTURE
At September 2001
(Free translation from the Portuguese)
COMMONSHARES
%PREFERRED
SHARESCLASS “A”
PREFERREDSHARES
CLASS “B”TOTAL %
FEDERALGOVERNMENT 264,328,120,835 58.41 - 17,592,868,180 281,920,989,015 52,46
BNDESPAR 68,089,960,070 15.21 - 71,237,780 68,161,197,850 12,68
FND 22,810,794,898 5.04 - - 22,810,794,898 4,24
MINORITYY 97,282,887,747 21.34 73,460,000 67,253,191,370 164,609,539,117 30,62
TOTAL 452,511,763,550 100.00 73,460,000 84,917,297,330 537,502,520,880 100.00
FEDERALGOVERNMENT
MINORITY
BNDESPAR
FND
TOTAL CAPITAL PARTICIPATION
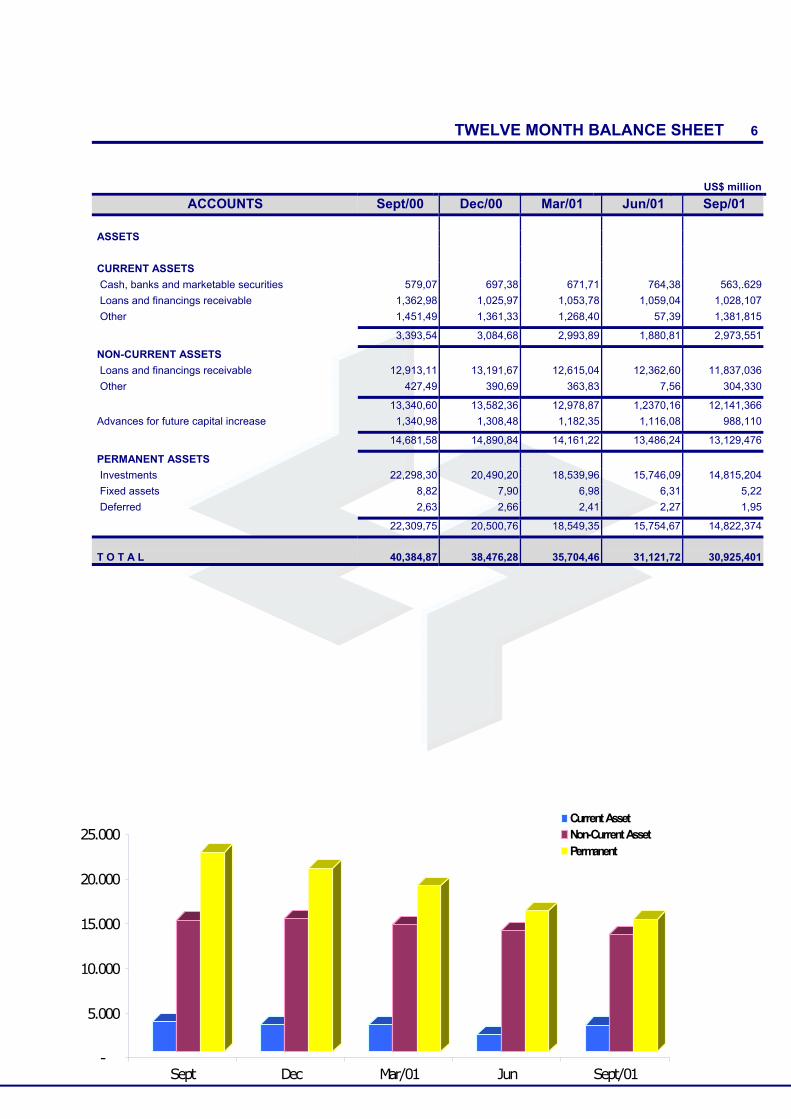
TWELVE MONTH BALANCE SHEET 6
US$ million
ACCOUNTS Sept/00 Dec/00 Mar/01 Jun/01 Sep/01
ASSETS
CURRENT ASSETS
Cash, banks and marketable securities 579,07 697,38 671,71 764,38 563,.629
Loans and financings receivable 1,362,98 1,025,97 1,053,78 1,059,04 1,028,107
Other 1,451,49 1,361,33 1,268,40 57,39 1,381,815
3,393,54 3,084,68 2,993,89 1,880,81 2,973,551
NON-CURRENT ASSETS
Loans and financings receivable 12,913,11 13,191,67 12,615,04 12,362,60 11,837,036
Other 427,49 390,69 363,83 7,56 304,330
13,340,60 13,582,36 12,978,87 1,2370,16 12,141,366
Advances for future capital increase 1,340,98 1,308,48 1,182,35 1,116,08 988,110
14,681,58 14,890,84 14,161,22 13,486,24 13,129,476
PERMANENT ASSETS
Investments 22,298,30 20,490,20 18,539,96 15,746,09 14,815,204
Fixed assets 8,82 7,90 6,98 6,31 5,22
Deferred 2,63 2,66 2,41 2,27 1,95
22,309,75 20,500,76 18,549,35 15,754,67 14,822,374
T O T A L 40,384,87 38,476,28 35,704,46 31,121,72 30,925,401
-
5.000
10.000
15.000
20.000
25.000
Sept Dec Mar/01 Jun Sept/01
Current AssetNon-Current AssetPermanent
TWELVE MONTH BALANCE SHEET 7
US$ million
ACCOUNTS Sept/00 Dec/00 Mar/01 Jun/01 Sep/01
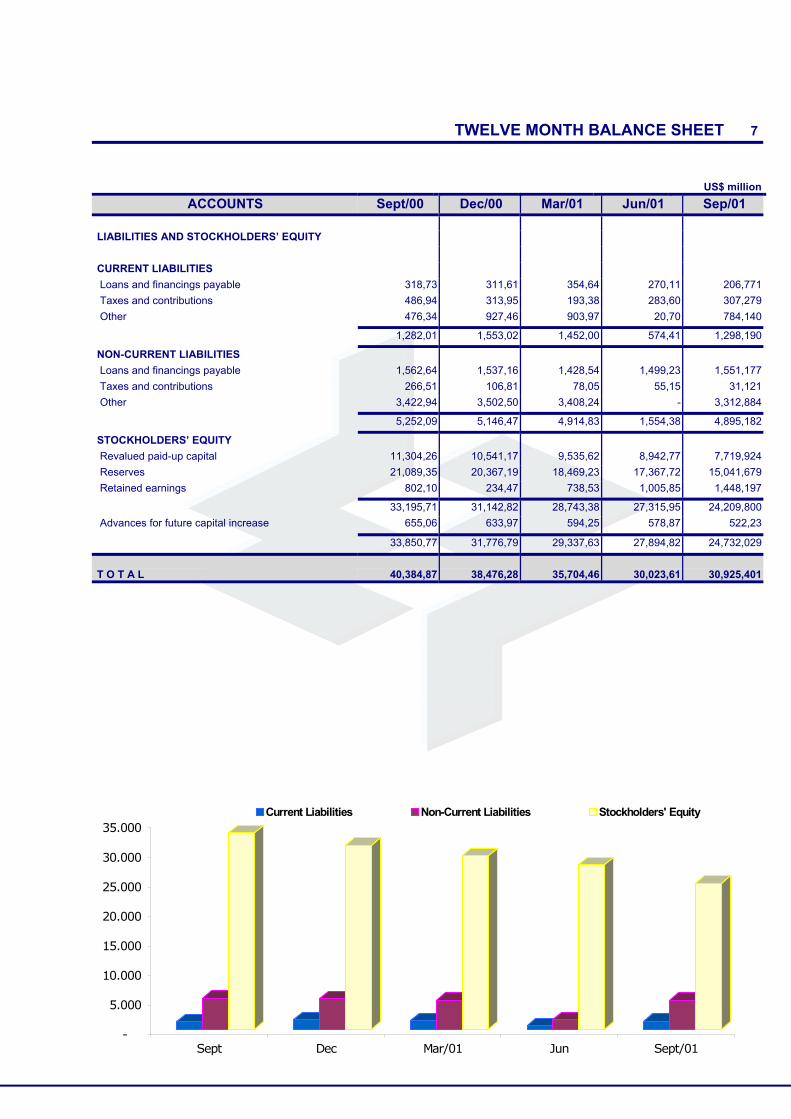
LIABILITIES AND STOCKHOLDERS’ EQUITY
CURRENT LIABILITIES
Loans and financings payable 318,73 311,61 354,64 270,11 206,771
Taxes and contributions 486,94 313,95 193,38 283,60 307,279
Other 476,34 927,46 903,97 20,70 784,140
1,282,01 1,553,02 1,452,00 574,41 1,298,190
NON-CURRENT LIABILITIES
Loans and financings payable 1,562,64 1,537,16 1,428,54 1,499,23 1,551,177
Taxes and contributions 266,51 106,81 78,05 55,15 31,121
Other 3,422,94 3,502,50 3,408,24 - 3,312,884
5,252,09 5,146,47 4,914,83 1,554,38 4,895,182
STOCKHOLDERS’ EQUITY
Revalued paid-up capital 11,304,26 10,541,17 9,535,62 8,942,77 7,719,924
Reserves 21,089,35 20,367,19 18,469,23 17,367,72 15,041,679
Retained earnings 802,10 234,47 738,53 1,005,85 1,448,197
33,195,71 31,142,82 28,743,38 27,315,95 24,209,800
Advances for future capital increase 655,06 633,97 594,25 578,87 522,23
33,850,77 31,776,79 29,337,63 27,894,82 24,732,029
T O T A L 40,384,87 38,476,28 35,704,46 30,023,61 30,925,401
-
5.000
10.000
15.000
20.000
25.000
30.000
35.000
Sept Dec Mar/01 Jun Sept/01
Current Liabilities Non-Current Liabilities Stockholders' Equity
TWELVE MONTH BALANCE SHEET 8
US$ million
ACCOUNTS Sept/00 Dec/00 Mar/01 Jun/01 Sep/01
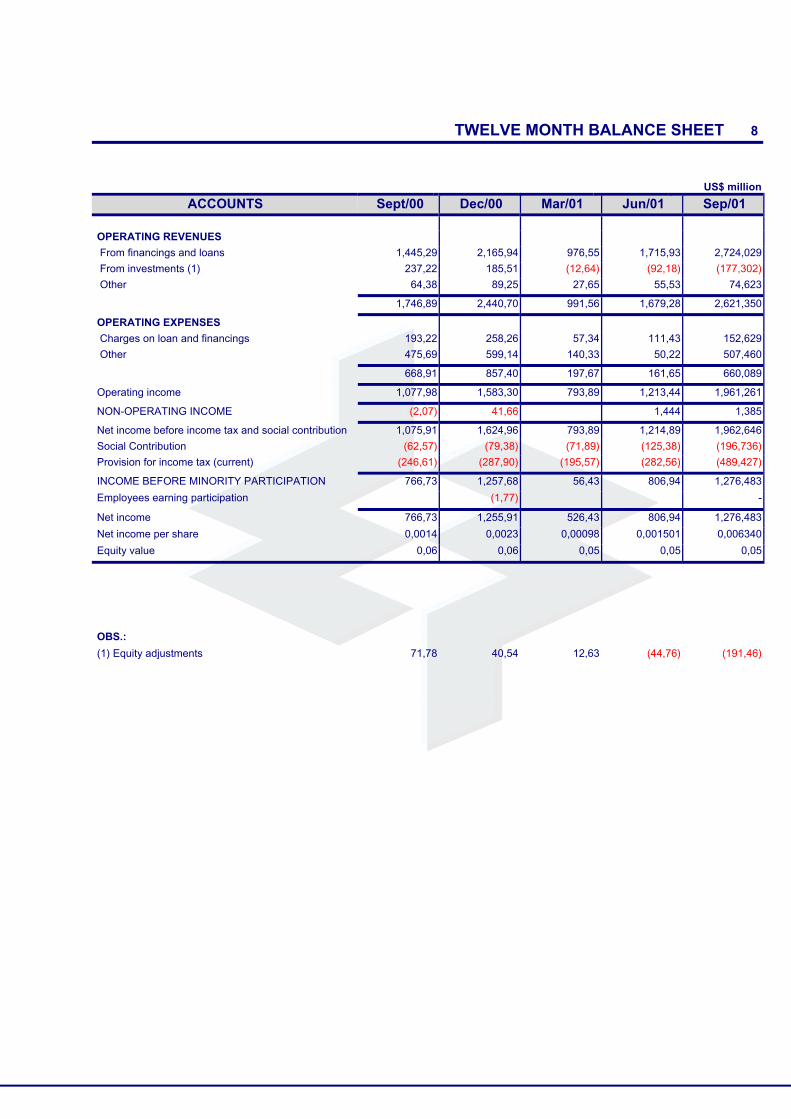
OPERATING REVENUES
From financings and loans 1,445,29 2,165,94 976,55 1,715,93 2,724,029
From investments (1) 237,22 185,51 (12,64) (92,18) (177,302)
Other 64,38 89,25 27,65 55,53 74,623
1,746,89 2,440,70 991,56 1,679,28 2,621,350
OPERATING EXPENSES
Charges on loan and financings 193,22 258,26 57,34 111,43 152,629
Other 475,69 599,14 140,33 50,22 507,460
668,91 857,40 197,67 161,65 660,089
Operating income 1,077,98 1,583,30 793,89 1,213,44 1,961,261
NON-OPERATING INCOME (2,07) 41,66 1,444 1,385
Net income before income tax and social contribution 1,075,91 1,624,96 793,89 1,214,89 1,962,646
Social Contribution (62,57) (79,38) (71,89) (125,38) (196,736)
Provision for income tax (current) (246,61) (287,90) (195,57) (282,56) (489,427)
INCOME BEFORE MINORITY PARTICIPATION 766,73 1,257,68 56,43 806,94 1,276,483
Employees earning participation (1,77) -
Net income 766,73 1,255,91 526,43 806,94 1,276,483
Net income per share 0,0014 0,0023 0,00098 0,001501 0,006340
Equity value 0,06 0,06 0,05 0,05 0,05
OBS.:
(1) Equity adjustments 71,78 40,54 12,63 (44,76) (191,46)
0,00
50,00
100,00
150,00
200,00
250,00
300,00
Sept Dec Mar/01 Jun Sep/01
Current Assets / Current Liabilities
0
2
4
6
8
Sept Dec Mar/01 Jun Sep/01
Total Loans and Financings / Stockholders' Equity
TWELVE MONTH BALANCE SHEET 9
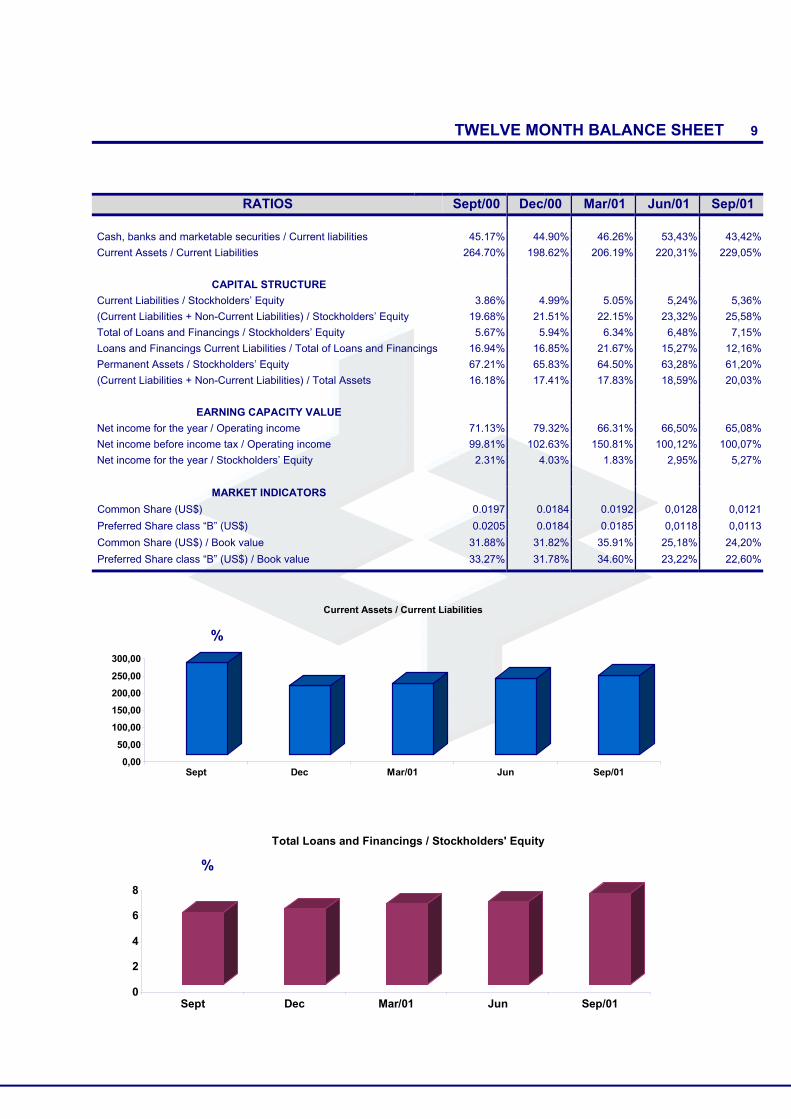
RATIOS Sept/00 Dec/00 Mar/01 Jun/01 Sep/01
Cash, banks and marketable securities / Current liabilities 45.17% 44.90% 46.26% 53,43% 43,42%
Current Assets / Current Liabilities 264.70% 198.62% 206.19% 220,31% 229,05%
CAPITAL STRUCTURE
Current Liabilities / Stockholders’ Equity 3.86% 4.99% 5.05% 5,24% 5,36%
(Current Liabilities + Non-Current Liabilities) / Stockholders’ Equity 19.68% 21.51% 22.15% 23,32% 25,58%
Total of Loans and Financings / Stockholders’ Equity 5.67% 5.94% 6.34% 6,48% 7,15%
Loans and Financings Current Liabilities / Total of Loans and Financings 16.94% 16.85% 21.67% 15,27% 12,16%
Permanent Assets / Stockholders’ Equity 67.21% 65.83% 64.50% 63,28% 61,20%
(Current Liabilities + Non-Current Liabilities) / Total Assets 16.18% 17.41% 17.83% 18,59% 20,03%
EARNING CAPACITY VALUE
Net income for the year / Operating income 71.13% 79.32% 66.31% 66,50% 65,08%
Net income before income tax / Operating income 99.81% 102.63% 150.81% 100,12% 100,07%
Net income for the year / Stockholders’ Equity 2.31% 4.03% 1.83% 2,95% 5,27%
MARKET INDICATORS
Common Share (US$) 0.0197 0.0184 0.0192 0,0128 0,0121
Preferred Share class “B” (US$) 0.0205 0.0184 0.0185 0,0118 0,0113
Common Share (US$) / Book value 31.88% 31.82% 35.91% 25,18% 24,20%
Preferred Share class “B” (US$) / Book value 33.27% 31.78% 34.60% 23,22% 22,60%
%
%
STOCK MARKET 10
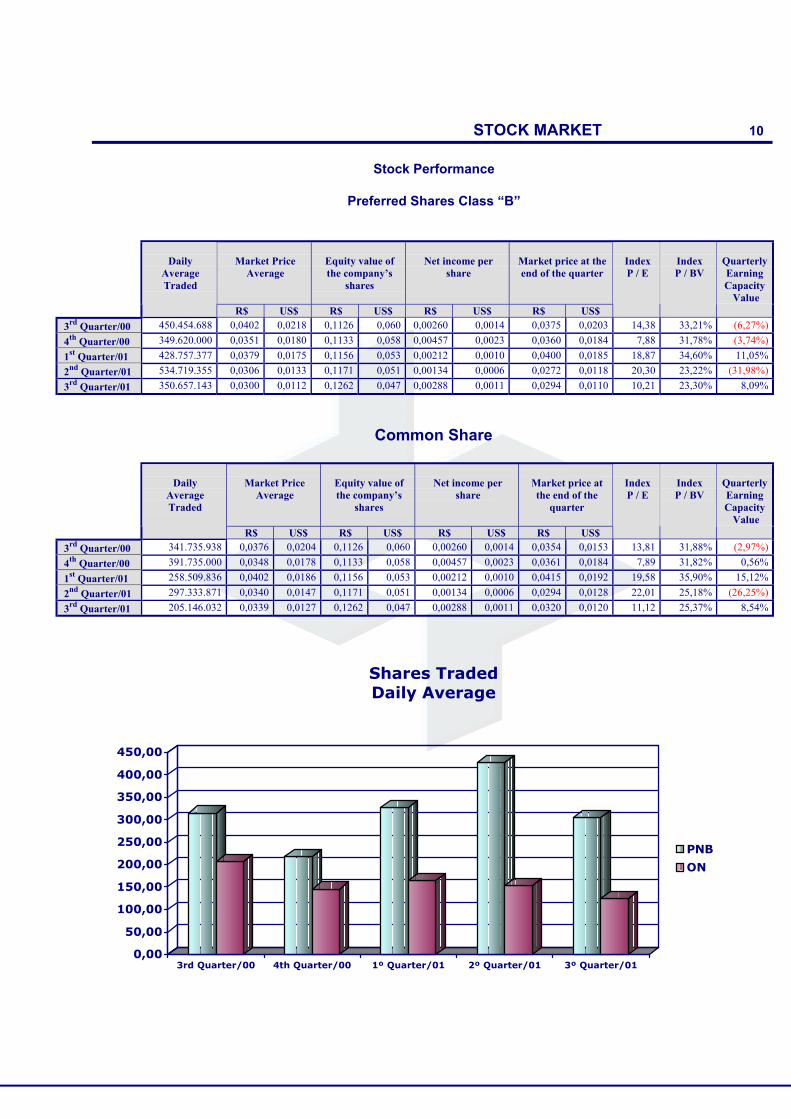
Stock Performance
Preferred Shares Class “B”
Market PriceAverage
Equity value ofthe company’s
shares
Net income pershare
Market price at theend of the quarter
DailyAverageTraded
R$ US$ R$ US$ R$ US$ R$ US$
IndexP / E
IndexP / BV
QuarterlyEarningCapacity
Value
3rd Quarter/00 450.454.688 0,0402 0,0218 0,1126 0,060 0,00260 0,0014 0,0375 0,0203 14,38 33,21% (6,27%)
4th Quarter/00 349.620.000 0,0351 0,0180 0,1133 0,058 0,00457 0,0023 0,0360 0,0184 7,88 31,78% (3,74%)
1st Quarter/01 428.757.377 0,0379 0,0175 0,1156 0,053 0,00212 0,0010 0,0400 0,0185 18,87 34,60% 11,05%
2nd Quarter/01 534.719.355 0,0306 0,0133 0,1171 0,051 0,00134 0,0006 0,0272 0,0118 20,30 23,22% (31,98%)
3rd Quarter/01 350.657.143 0,0300 0,0112 0,1262 0,047 0,00288 0,0011 0,0294 0,0110 10,21 23,30% 8,09%
Common Share
Market PriceAverage
Equity value ofthe company’s
shares
Net income pershare
Market price atthe end of the
quarter
DailyAverageTraded
R$ US$ R$ US$ R$ US$ R$ US$
IndexP / E
IndexP / BV
QuarterlyEarningCapacity
Value
3rd Quarter/00 341.735.938 0,0376 0,0204 0,1126 0,060 0,00260 0,0014 0,0354 0,0153 13,81 31,88% (2,97%)
4th Quarter/00 391.735.000 0,0348 0,0178 0,1133 0,058 0,00457 0,0023 0,0361 0,0184 7,89 31,82% 0,56%
1st Quarter/01 258.509.836 0,0402 0,0186 0,1156 0,053 0,00212 0,0010 0,0415 0,0192 19,58 35,90% 15,12%
2nd Quarter/01 297.333.871 0,0340 0,0147 0,1171 0,051 0,00134 0,0006 0,0294 0,0128 22,01 25,18% (26,25%)
3rd Quarter/01 205.146.032 0,0339 0,0127 0,1262 0,047 0,00288 0,0011 0,0320 0,0120 11,12 25,37% 8,54%
Shares TradedDaily Average
0,00
50,00
100,00
150,00
200,00
250,00
300,00
350,00
400,00
450,00
3rd Quarter/00 4th Quarter/00 1º Quarter/01 2º Quarter/01 3º Quarter/01
PNB
ON
ADR´s Programs 11
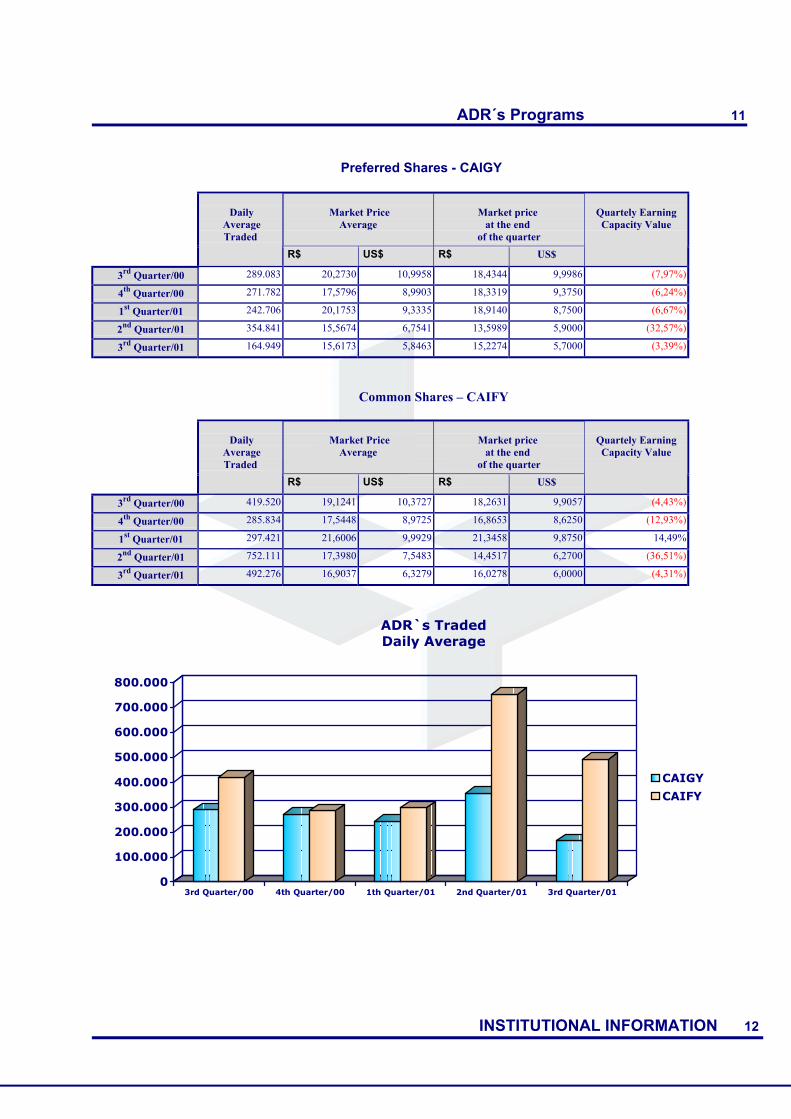
Preferred Shares - CAIGY
Market PriceAverage
Market price at the end
of the quarter
DailyAverageTraded
R$ US$ R$ US$
Quartely EarningCapacity Value
3rd Quarter/00 289.083 20,2730 10,9958 18,4344 9,9986 (7,97%)
4th Quarter/00 271.782 17,5796 8,9903 18,3319 9,3750 (6,24%)
1st Quarter/01 242.706 20,1753 9,3335 18,9140 8,7500 (6,67%)
2nd Quarter/01 354.841 15,5674 6,7541 13,5989 5,9000 (32,57%)
3rd Quarter/01 164.949 15,6173 5,8463 15,2274 5,7000 (3,39%)
Common Shares – CAIFY
Market PriceAverage
Market price at the end
of the quarter
DailyAverageTraded
R$ US$ R$ US$
Quartely EarningCapacity Value
3rd Quarter/00 419.520 19,1241 10,3727 18,2631 9,9057 (4,43%)
4th Quarter/00 285.834 17,5448 8,9725 16,8653 8,6250 (12,93%)
1st Quarter/01 297.421 21,6006 9,9929 21,3458 9,8750 14,49%
2nd Quarter/01 752.111 17,3980 7,5483 14,4517 6,2700 (36,51%)
3rd Quarter/01 492.276 16,9037 6,3279 16,0278 6,0000 (4,31%)
ADR`s TradedDaily Average
INSTITUTIONAL INFORMATION 12
0
100.000
200.000
300.000
400.000
500.000
600.000
700.000
800.000
3rd Quarter/00 4th Quarter/00 1th Quarter/01 2nd Quarter/01 3rd Quarter/01
CAIGY
CAIFY
IInnssttiittuuttiioonnaall IInnffoorrmmaattiioonn
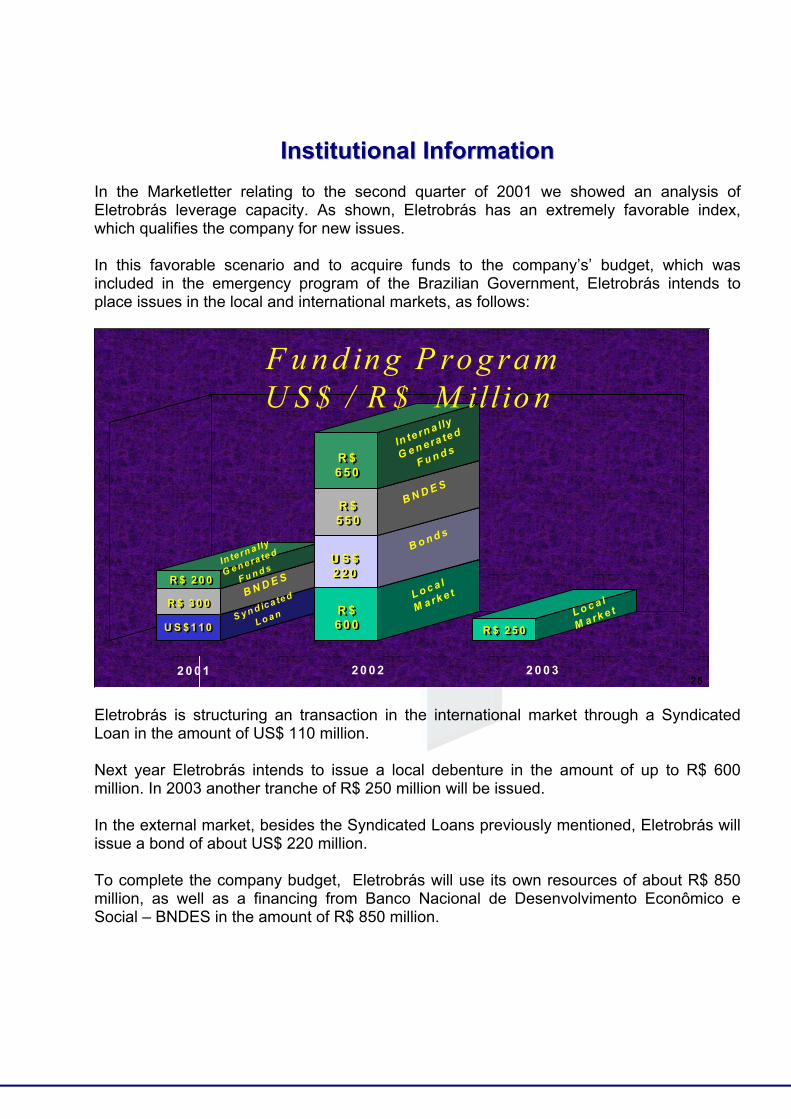
In the Marketletter relating to the second quarter of 2001 we showed an analysis ofEletrobrás leverage capacity. As shown, Eletrobrás has an extremely favorable index,which qualifies the company for new issues.
In this favorable scenario and to acquire funds to the company’s’ budget, which wasincluded in the emergency program of the Brazilian Government, Eletrobrás intends toplace issues in the local and international markets, as follows:
Eletrobrás is structuring an transaction in the international market through a SyndicatedLoan in the amount of US$ 110 million.
Next year Eletrobrás intends to issue a local debenture in the amount of up to R$ 600million. In 2003 another tranche of R$ 250 million will be issued.
In the external market, besides the Syndicated Loans previously mentioned, Eletrobrás willissue a bond of about US$ 220 million.
To complete the company budget, Eletrobrás will use its own resources of about R$ 850million, as well as a financing from Banco Nacional de Desenvolvimento Econômico eSocial – BNDES in the amount of R$ 850 million.
F u n d in g P ro g ra mU S $ / R $ M illio n
2 52 0 0 1 2 0 0 2 2 0 0 3
S y n d ic a te d
L o a n
L o c a l
M a rk e t
L o c a l
M a rk e t
B o n d s
U S $ 1 1 0U S $ 1 1 0
U S $2 2 0
U S $2 2 0
R $6 0 0R $6 0 0
R $ 2 5 0R $ 2 5 0
2 5
B N D E S
R $ 3 0 0R $ 3 0 0
B N D E S
R $5 5 0R $5 5 0
In te rn a lly
G e n e ra te d
F u n d sR $ 2 0 0R $ 2 0 0
In te rn a lly
G e n e ra te d
F u n d sR $6 5 0R $6 5 0
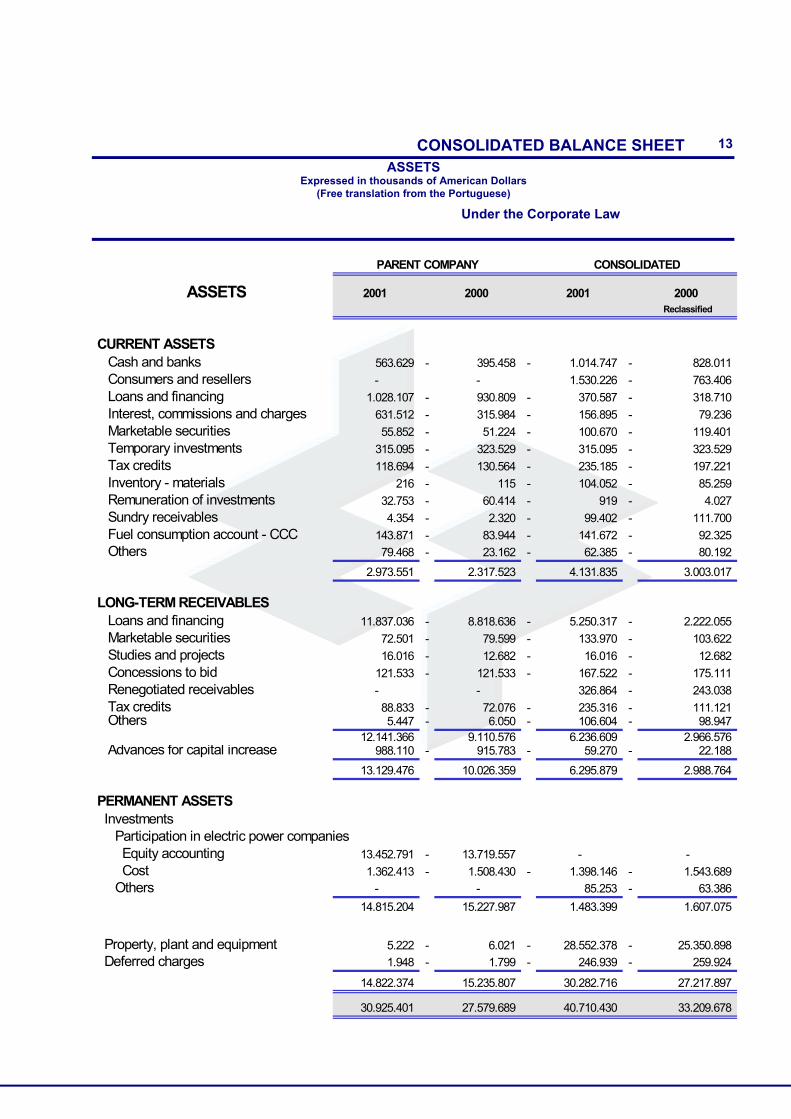
CONSOLIDATED BALANCE SHEET 13
ASSETSExpressed in thousands of American Dollars
(Free translation from the Portuguese)
Under the Corporate Law
PARENT COMPANY CONSOLIDATED
ASSETS 2001 2000 2001 2000Reclassified
CURRENT ASSETS Cash and banks 563.629 - 395.458 - 1.014.747 - 828.011
Consumers and resellers - - 1.530.226 - 763.406
Loans and financing 1.028.107 - 930.809 - 370.587 - 318.710
Interest, commissions and charges 631.512 - 315.984 - 156.895 - 79.236
Marketable securities 55.852 - 51.224 - 100.670 - 119.401
Temporary investments 315.095 - 323.529 - 315.095 - 323.529
Tax credits 118.694 - 130.564 - 235.185 - 197.221
Inventory - materials 216 - 115 - 104.052 - 85.259
Remuneration of investments 32.753 - 60.414 - 919 - 4.027
Sundry receivables 4.354 - 2.320 - 99.402 - 111.700
Fuel consumption account - CCC 143.871 - 83.944 - 141.672 - 92.325
Others 79.468 - 23.162 - 62.385 - 80.192
2.973.551 2.317.523 4.131.835 3.003.017
LONG-TERM RECEIVABLES Loans and financing 11.837.036 - 8.818.636 - 5.250.317 - 2.222.055
Marketable securities 72.501 - 79.599 - 133.970 - 103.622
Studies and projects 16.016 - 12.682 - 16.016 - 12.682
Concessions to bid 121.533 - 121.533 - 167.522 - 175.111
Renegotiated receivables - - 326.864 - 243.038
Tax credits 88.833 - 72.076 - 235.316 - 111.121 Others 5.447 - 6.050 - 106.604 - 98.947
12.141.366 9.110.576 6.236.609 2.966.576 Advances for capital increase 988.110 - 915.783 - 59.270 - 22.188
13.129.476 10.026.359 6.295.879 2.988.764
PERMANENT ASSETS Investments Participation in electric power companies Equity accounting 13.452.791 - 13.719.557 - -
Cost 1.362.413 - 1.508.430 - 1.398.146 - 1.543.689
Others - - 85.253 - 63.386
14.815.204 15.227.987 1.483.399 1.607.075
Property, plant and equipment 5.222 - 6.021 - 28.552.378 - 25.350.898
Deferred charges 1.948 - 1.799 - 246.939 - 259.924
14.822.374 15.235.807 30.282.716 27.217.897
30.925.401 27.579.689 40.710.430 33.209.678
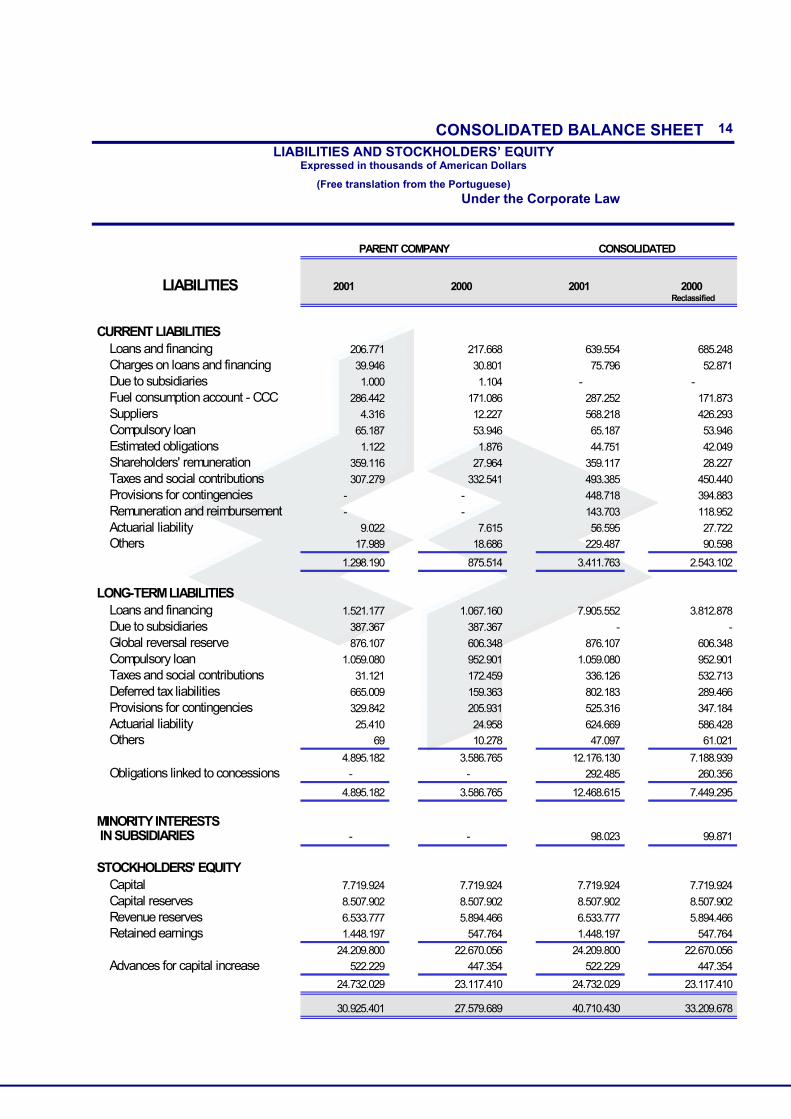
CONSOLIDATED BALANCE SHEET 14
LIABILITIES AND STOCKHOLDERS’ EQUITYExpressed in thousands of American Dollars
(Free translation from the Portuguese)
Under the Corporate Law
PARENT COMPANY CONSOLIDATED
LIABILITIES 2001 2000 2001 2000Reclassified
CURRENT LIABILITIES Loans and financing 206.771 217.668 639.554 685.248
Charges on loans and financing 39.946 30.801 75.796 52.871
Due to subsidiaries 1.000 1.104 - -
Fuel consumption account - CCC 286.442 171.086 287.252 171.873
Suppliers 4.316 12.227 568.218 426.293
Compulsory loan 65.187 53.946 65.187 53.946
Estimated obligations 1.122 1.876 44.751 42.049
Shareholders' remuneration 359.116 27.964 359.117 28.227
Taxes and social contributions 307.279 332.541 493.385 450.440
Provisions for contingencies - - 448.718 394.883
Remuneration and reimbursement - - 143.703 118.952
Actuarial liability 9.022 7.615 56.595 27.722
Others 17.989 18.686 229.487 90.598
1.298.190 875.514 3.411.763 2.543.102
LONG-TERM LIABILITIES Loans and financing 1.521.177 1.067.160 7.905.552 3.812.878
Due to subsidiaries 387.367 387.367 - -
Global reversal reserve 876.107 606.348 876.107 606.348
Compulsory loan 1.059.080 952.901 1.059.080 952.901
Taxes and social contributions 31.121 172.459 336.126 532.713
Deferred tax liabilities 665.009 159.363 802.183 289.466
Provisions for contingencies 329.842 205.931 525.316 347.184
Actuarial liability 25.410 24.958 624.669 586.428
Others 69 10.278 47.097 61.021
4.895.182 3.586.765 12.176.130 7.188.939
Obligations linked to concessions - - 292.485 260.356
4.895.182 3.586.765 12.468.615 7.449.295
MINORITY INTERESTS IN SUBSIDIARIES - - 98.023 99.871
STOCKHOLDERS' EQUITY Capital 7.719.924 7.719.924 7.719.924 7.719.924
Capital reserves 8.507.902 8.507.902 8.507.902 8.507.902
Revenue reserves 6.533.777 5.894.466 6.533.777 5.894.466
Retained earnings 1.448.197 547.764 1.448.197 547.764
24.209.800 22.670.056 24.209.800 22.670.056
Advances for capital increase 522.229 447.354 522.229 447.354
24.732.029 23.117.410 24.732.029 23.117.410
30.925.401 27.579.689 40.710.430 33.209.678
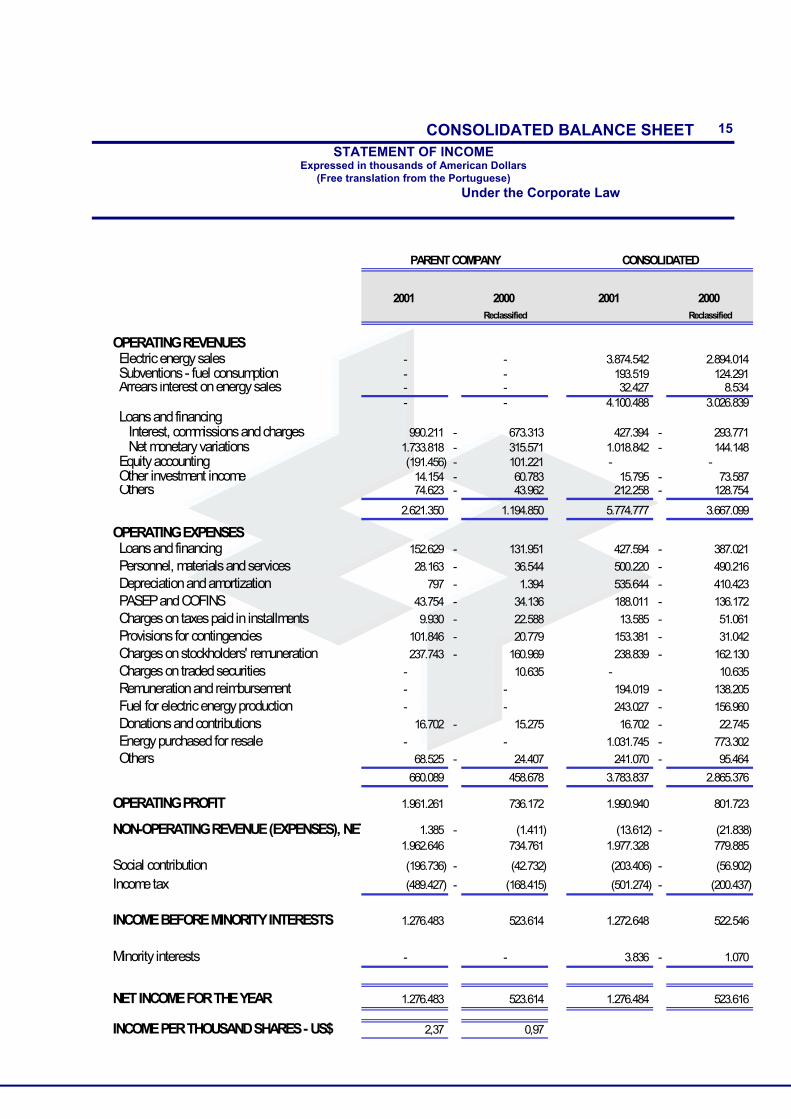
CONSOLIDATED BALANCE SHEET 15
STATEMENT OF INCOMEExpressed in thousands of American Dollars
(Free translation from the Portuguese)
Under the Corporate Law
PARENT COMPANY CONSOLIDATED
2001 2000 2001 2000Reclassified Reclassified
OPERATING REVENUES Electric energy sales - - 3.874.542 2.894.014 Subventions - fuel consumption - - 193.519 124.291 Arrears interest on energy sales - - 32.427 8.534
- - 4.100.488 3.026.839 Loans and financing Interest, commissions and charges 990.211 - 673.313 427.394 - 293.771 Net monetary variations 1.733.818 - 315.571 1.018.842 - 144.148 Equity accounting (191.456) - 101.221 - - Other investment income 14.154 - 60.783 15.795 - 73.587 Others 74.623 - 43.962 212.258 - 128.754
2.621.350 1.194.850 5.774.777 3.667.099
OPERATING EXPENSES Loans and financing 152.629 - 131.951 427.594 - 387.021
Personnel, materials and services 28.163 - 36.544 500.220 - 490.216
Depreciation and amortization 797 - 1.394 535.644 - 410.423
PASEP and COFINS 43.754 - 34.136 188.011 - 136.172
Charges on taxes paid in installments 9.930 - 22.588 13.585 - 51.061
Provisions for contingencies 101.846 - 20.779 153.381 - 31.042
Charges on stockholders' remuneration 237.743 - 160.969 238.839 - 162.130
Charges on traded securities - 10.635 - 10.635
Remuneration and reimbursement - - 194.019 - 138.205
Fuel for electric energy production - - 243.027 - 156.960
Donations and contributions 16.702 - 15.275 16.702 - 22.745
Energy purchased for resale - - 1.031.745 - 773.302
Others 68.525 - 24.407 241.070 - 95.464
660.089 458.678 3.783.837 2.865.376
OPERATING PROFIT 1.961.261 736.172 1.990.940 801.723
NON-OPERATING REVENUE (EXPENSES), NET 1.385 - (1.411) (13.612) - (21.838) 1.962.646 734.761 1.977.328 779.885
Social contribution (196.736) - (42.732) (203.406) - (56.902)
Income tax (489.427) - (168.415) (501.274) - (200.437)
INCOME BEFORE MINORITY INTERESTS 1.276.483 523.614 1.272.648 522.546
Minority interests - - 3.836 - 1.070
NET INCOME FOR THE YEAR 1.276.483 523.614 1.276.484 523.616
INCOME PER THOUSAND SHARES - US$ 2,37 0,97