Embed Size (px)
Citation preview

Paper to be presented at the DRUID 2012
on
June 19 to June 21
at
CBS, Copenhagen, Denmark,
Elements of A Theory Of Entrepreneurial RentsMohammad Keyhani
York UniversitySchulich School of Business
Moren LévesqueYork University
Schulich School of [email protected]
Anoop MadhokYork University
Schulich School of [email protected]
AbstractWe argue that a dynamic theory of strategy needs a comprehensive theory of entrepreneurial rents to be amended tothe theory of Ricardian and monopoly rents. We use cooperative game theory to develop a model and run computersimulation experiments in which entrepreneurial rents can be measured in the dynamic market process as it movesbetween equilibrium and disequilibrium over time. We impute entrepreneurial rents to underlying entrepreneurialcapabilities of creation and discovery under various combinations and derive theoretical propositions that can contributeto the basic elements of a theory of entrepreneurial rents and a dynamic theory of strategy.
Jelcodes:B53,C71

1
ELEMENTS OF A THEORY OF ENTREPRENEURIAL RENTS:
A GAME THEORETICAL MODEL AND SIMULATION OF THE MARKET PROCESS
ABSTRACT
We argue that a dynamic theory of strategy needs a comprehensive theory of entrepreneurial
rents to be amended to the theory of Ricardian and monopoly rents. We use cooperative game
theory to develop a model and run computer simulation experiments in which entrepreneurial
rents can be measured in the dynamic market process as it moves between equilibrium and
disequilibrium over time. We impute entrepreneurial rents to underlying entrepreneurial
capabilities of creation and discovery under various combinations and derive theoretical
propositions that can contribute to the basic elements of a theory of entrepreneurial rents and a
dynamic theory of strategy.
INTRODUCTION
To achieve a truly dynamic theory of strategy has long been a major aspiration in the strategic
management field (Porter, 1991). The contemporary answer to this question seems to be roughly
that “entrepreneurship” is the missing dynamic ingredient (Jacobson, 1992; Mathews, 2006a;
Rumelt, 1987; Teece, Pisano, & Shuen, 1997). But this argument has yet to be fully fleshed out
in detail and many questions remain unanswered. What exactly do we mean by entrepreneurship
and how is it different from any other strategic manoeuvre? What is the nature and source of
entrepreneurial rent and how is it different from non-entrepreneurial rent? The answers to these
questions are crucial if entrepreneurship is to fulfill its promise as the key to a dynamic theory of
strategy.
The first fundamental theorem of welfare economics states that if markets are perfectly
competitive, they will reach an equilibrium in which there are zero profits. Taking this as a point
of departure, two traditional strategy theories attempt to locate “competitive advantage” or

2
“supernormal profit” or “rent”1 by examining the existence of market imperfections that create
deviations from the first fundamental theorem of welfare economics and thus allow non-zero
profits to be made (Barney, 1986; Foss, 2003; Mahoney, 2001; Yao, 1988). One of these is based
on Industrial Organization (IO) famously championed by Porter based on the work of Caves and
Bain, and the other is the resource-based view (RBV) based on the Chicago-UCLA school of
economics and the work of Demsetz and famously championed by Barney2. The difference
between the two theories is that IO emphasizes imperfections due to the monopoly power of one
firm over others (imperfections in the product market) while RBV emphasizes imperfections due
to the possession of scarce resources not available to others (imperfections in the factor market)3
(Mathews, 2006b). However, these theories retain the equilibrium assumption (Bromiley &
Papenhausen, 2003). Thus they focus on “imperfectly competitive equilibrium” and how the
imperfections give particular advantage to some over others.
Their reliance on the equilibrium assumption has been a major point of criticism for these
theories and a range of scholars have called for moving beyond this assumption (Bromiley &
Papenhausen, 2003; Mathews, 2006a, 2006b; Meyer, Gaba, & Colwell, 2005; Rumelt, Schendel,
& Teece, 1991). These authors argue that ubiquitous information, knowledge and expectation
asymmetries along with transformational innovations and turbulent environments preclude any
prolonged state of equilibrium. The relevant economic framework becomes Austrian economics
(Jacobson, 1992) with a view of the market not as a static state of equilibrium, but as a dynamic
1 For reasons that will be explained below, this paper uses the terms profit, rent, and return interchangeably.
2 The RBV encompasses a broad literature. Here we are not considering the more process-oriented and evolutionary-based branches of RBV based on Penrose, Nelson & Winter, etc. that are less loyal to the neoclassical framework (see Foss (2000b) for this distinction of RBV branches).
3 The terms “monopoly rents” and “Ricardian rents” are often used to describe the supernormal profits gained from product market and factor market imperfections, respectively.

3
process through time constantly driven by entrepreneurial forces of equilibration and
disequilibration (O'Driscoll & Rizzo, 1985).
The shift to disequilibrium naturally puts a spotlight on its sister concept: entrepreneurship.
Unlike neoclassical economics which has traditionally largely ignored entrepreneurship as a
subject of study (Baumol, 1993; Kilby, 1971; Mathews, 2006b), the entrepreneur gains center
stage in Austrian thinking. Entrepreneurship has been recognized as the agentive force that both
disrupts existing equilibria (Schumpeter, 1934), and moves the economy towards new equilibria
(Kirzner, 1997).
These dynamic equilibration and disequilibration processes are said to result in “entrepreneurial
rents” accruing to the entrepreneurs driving them. But what are entrepreneurial rents and how are
they different from other forms of rent due to imperfect competition? Two decades ago, Amit,
Golsten & Muller (1993: 826) asked “Are there abnormal returns to entrepreneurs? Are the
rewards of the successful entrepreneur distinct from what we commonly refer to as ‘monopoly
rents’? Why and how are such rents created? While there are a range of prevailing economic rent
concepts, there is no clear agreement about what constitutes entrepreneurial rents and how to
measure them.” If static theories of strategy are theories of rents due to imperfectly competitive
equilibrium, a dynamic theory of strategy needs to provide a cohesive account of rents in
disequilibrium (i.e. rents accruing to equilibrating and disequilibrating processes). This is the aim
of the present paper. We aim to provide a basic formalization for the building blocks of a theory
of entrepreneurial rent and thus a dynamic theory of strategy.
We follow Lippman & Rumelt’s (2003a) suggestion of cooperative game theory (CGT) as an
approach to model strategic interactions. Although modeling the dynamics of market processes
through time is not a traditional strength of CGT (Foss, 2000a), we are able to add these
dynamics using computer simulation of repeated games. Using these simulations, we are able to

4
design experiments in which the initial rent structure under imperfect competition gives all
players an equal position at time zero, and the only difference between the players is their
entrepreneurial capabilities. Under these conditions, simulating the market dynamics over time
allows us to calculate the returns to entrepreneurship and impute them to underlying
entrepreneurial capabilities under different conditions.
We distinguish between two main types of entrepreneurial capability: creation and discovery. By
creation, we mean the adding of new value to the economy such that new opportunities are
created, but not exploited. By discovery, we mean the identification and exploitation of existing
opportunities in the economy without creating any new opportunities. The distinction between
creation and discovery is the most widespread typology of entrepreneurship used in the literature
(Alvarez & Barney, 2007; Zahra, 2008) and corresponds to the distinction between equilibration
and disequilibration in the market process (Keyhani & Lévesque, 2011).
Being able to impute rents to entrepreneurial capabilities under various competitive conditions
allows us to develop building blocks for a theory of entrepreneurial rents. Such a theory is not
only an important contribution to the theory of rents in general, but has significant implications
for a firm’s competitive strategy, including its resource allocation and resource development
strategies.
THE CONCEPT OF RENT IN ENTREPRENEURSHIP AND STRATEGY
The rent concept has been the source of much confusion in the literature. At the heart of
Neoclassical economics—the dominant paradigm in this field—lies the Walrasian model of
perfectly competitive equilibrium, with its assumptions of perfect information, free entry, and
price-taking agents (Makowski & Ostroy, 2001). But perfect competition under these
assumptions means that no one makes a profit. For non-zero profits to be possible competition
must either be imperfect and/or the economy must be in disequilibrium. Strategy scholars have

5
mostly focused on the former, while entrepreneurship scholars have mainly studied the latter
condition. In either case, the non-zero profits are commonly referred to as economic rents.
Illustration: A simple model of rent
The concept of rent as supernormal profits in imperfectly competitive equilibrium can be
demonstrated with a simple model. Suppose a woman—call her A—owns a diamond ring that is
worth $10 to herself but $20 to her friend B. It is then to the benefit of both A and B that they
exchange the ring for a price greater than $10 but less than $20. Lower than 10 and the owner
would be unwilling to sell, higher than 20 and the friend would be unwilling to buy. Anywhere
in between is a win-win situation. Suppose they agree on the price of $15. Now let B be the only
consumer, but suppose A was facing perfect competition among ring producers. Then another
ring owner would enter into the game and provide the same ring for lower, say $14. Then price
competition among the two ring providers would lower the cost to the extent that one player
finds it no longer worthwhile to compete. Even then, if other producers can provide the ring at a
lower price they will enter the market and do so. Ultimately, an equilibrium will be reached in
which the price of the ring in the market will equal the cost of production for the most efficient
producer, who will be the only one actually able to sell. Ultimately, no sellers make a profit and
the one buyer reaps all the rewards. But similarly perfect competition can be imagined among
buyers, thus driving their rewards to zero as well. Such is the outcome of a perfectly competitive
equilibrium.
Now suppose imperfect competition, such that A and B are the only players in the economy, and
there are perfect barriers to entry. Then by agreeing on the price of $15, each is making a profit
of $5. This can be considered an equilibrium price because everyone is happy and no-one is
better off by leaving the exchange. They each have a competitive advantage in this imperfectly
competitive equilibrium, because there are no competitors, but the amount of value they are able

6
to appropriate (somewhere between zero and $10) depends on their bargaining power in terms of
negotiating the price. Often however, imperfections in the economy are such that a certain
amount of competitive advantage is guaranteed irrespective of this kind of bargaining, due to the
structure of the market imperfections. To see this, suppose that in addition to B, a third person C
also would like to purchase the ring and that the ring was worth $30 to him. Now any
equilibrium price must be higher than $20 because any lower price would create a price bidding
competition between B and C. If C offers anything above $20 (and up to $30) however, B cannot
compete and A could agree to an exchange with C. Thus unlike the previous situation in which A
had a possible but not guaranteed rent of $0-$10, in the new situation, A has a guaranteed
equilibrium rent of $10 with an additional $0-$10 of possible but not guaranteed profit.
The above two situations involving A, B and C are actually simple examples of cooperative
games. The value structure of the economy is modeled using a tool called the characteristic
function which simply assigns a value to every possible coalition (i.e. group) of players. The
characteristic functions for the two games are depicted in Table 1a and 1b. The game in Table 1b
is a variation of the “three cornered market” in Shubik (1982: 151; adapted from Von Neumann
& Morgenstern, 1944). Given the characteristic functions, the imperfectly competitive
equilibrium prices can be calculated. The profit distributions that fall in this range are referred to
as the core of a cooperative game. The illustration above was intended to show that characteristic
function games can be a useful tool for modeling the imperfectly competitive structure of an
economy in equilibrium. This is why Lippamn & Rumelt (2003a) recommend CGT as an
integrative framework for strategy theory. In the next section, we illustrate how the dynamics of
disequilibrium can be added to this framework to model creation and discovery entrepreneurship.
------------------------------------Insert Table 1 about here------------------------------------

7
Entrepreneurial rent
The market is not a state but actually an uncertain process unfolding through time (Von Mises,
1949). Once we bring in the notions of time and uncertainty, entrepreneurial rent can be defined
as the difference between ex ante and ex post rents / profit / value resulting from an action
(Rumelt, 1987). But we must translate this to an operational definition in our analytical model.
In the neo-Austrian school of thought, based on the works of Kirzner (Kirzner, 1973, 1997), the
economy is seen as always existing in a state of disequilibrium. Profit opportunities exist, mostly
due to asymmetric information. That is, prices do not contain complete information about all
productive opportunities (Eckhardt & Shane, 2003), and agents have their own subjective
perceptions of these opportunities. These opportunities are discovered by entrepreneurs and
exploited, such that the gaps in the market are filled and the economy is moved towards
equilibrium. This type of entrepreneurship—the discovery and exploitation of existing
opportunities—is referred to as discovery entrepreneurship in this paper.
To see how discovery can be modeled in a characteristic function game, consider again the game
of Table 1a. We assumed above that all players have perfect knowledge of the characteristic
function, but what if it were not so? Suppose that none of them even knew each other and were
unaware of any trade opportunities. Now if player B meets player A and becomes aware of how
much she values her ring ($10), and compares it with his or her own valuation ($20), s/he would
discover a profit opportunity. If s/he is able to negotiate a price and purchase the ring, s/he has
completed an act of Kirznerian discovery entrepreneurship.
But even when the economy is in equilibrium, entrepreneurship is possible. In the Schumpeterian
perspective (Schumpeter, 1934) unlike the Kirznerian view, equilibrium is not seen as a situation
in which no more opportunities exist. Entrepreneurs can actively pursue new combinations (new
products, processes, organizational arrangements, etc.) that disrupt the existing equilibrium and

8
create new opportunities. In this paper, we refer to the creation of new opportunities as creation
entrepreneurship.
Suppose that in the game of Table 1b all three individuals know each other and have perfect
knowledge of the characteristic function. Now suppose A is able to skillfully carve a beautiful
and creative image on the ring, increasing its value by $2 for anyone who owns it. Note that
unlike discovery entrepreneurship, this innovation actually changes that characteristic function
(from Table 1b to Table 1c) and the new value is ultimately to the benefit of the innovator in
equilibrium. Now the “core” outcome is for C to pay anywhere between $22 and $32 to A. If
they had previously negotiated a price of $21, this outcome now becomes unstable as the ring
owner would no longer be satisfied with the deal. If the innovation had been more radical (say
$20 instead of $2 of added value, as in Table 1d) then none of the previous “core” outcomes
would remain stable.
The above examples demonstrate how the cooperative game model can be adopted for modeling
movements towards and away from disequilibrium through discovery and creation
entrepreneurship. In this paper we build on the CGT model to construct a formal analytic
framework within which equilibrium and disequilibrium can be clearly distinguished. Then by
holding all other variables that could result in “rent” due to imperfectly competitive equilibrium
constant (for example, initial resource endowments, initial market power, number of competitors,
etc.), and experimentally manipulating only entrepreneurial capabilities, we are able to calculate
returns to these capabilities. In other words, we are able to measure disequilibrium rents by
holding initial equilibrium rents constant. Under these conditions any remaining rent differentials
observed through time can be attributed to differences in entrepreneurial capabilities.

9
A FORMAL MODEL OF THE ENTREPRENEURIAL MARKET PROCESS
Analytical approach
In recent years strategic management scholars have increasingly utilized CGT to model
equilibrium-based competitive advantage in imperfectly competitive markets (Adegbesan, 2009;
Brandenburger & Stuart, 2007; Lippman & Rumelt, 2003a; MacDonald & Ryall, 2004). But
despite some early efforts (Littlechild, 1979a, 1979b) and some suggestions (Foss, 2000a; Reid,
1993), entrepreneurship research has not utilized the power of this modeling toolbox. Part of the
reason for this dearth of antecedent may lie in the fact that the mathematical CGT literature has
traditionally focused on static equilibrium (Foss, 2000a; Shubik, 1982). Thus it is not a trivial
matter to adapt CGT to the study of a dynamic market process with entrepreneurial action taking
place through time, moving between equilibrium and disequilibrium. Our model builds on the
literature on coalition formation games (Arnold & Schwalbe, 2002; Hart & Kurz, 1983; Konishi
& Ray, 2003; Ray & Vohra, 1999) to model discovery entrepreneurship and the process of
moving towards equilibrium within a given characteristic function. We also take inspiration from
dynamic cooperative game theory (Filar & Petrosjan, 2000) to model creation entrepreneurship
using repeated games in which the characteristic function can change over time. Thus our
framework adds two levels of dynamics to the traditional CGT model: an inter-game dynamic
and an intra-game dynamic.
Preliminaries and definitions
The economy is modeled as a cooperative game with transferable utility. The actors in the
economy are a non-changing set � = {1,2, … , �} of self-interested players who can form
coalitions with each other to create and appropriate value. The value that can be created by any
coalition at any point in time is given by a characteristic function : � → ℝ� that associates a
non-negative real number value to all subsets of � where the value of the empty set is zero, i.e.
��� = 0. The characteristic function depicts the rent structure of the economy in each time

10
period. We call the set of all non-empty subsets of �, the set of all possible coalitions. The set of
actual coalitions however, is the term we use to refer to the coalitions that have actually formed
at any point in time. This information is given by a coalition structure �� = {��, ��, … , ��}
which specifies a partition of � into non-empty subsets, meaning that � ������ = � and �� ∩ �� =
�, ∀ ≠ ". Each player is a member of exactly one actual coalition (possibly the singleton
coalition if the player is alone) at any time.
Although the characteristic function defines how much value can be created in any coalition, it
does not say anything about how that value is appropriated, i.e. how it is divided between the
coalition’s members. Such divisions are described with a payoff distribution which is a vector
# = �#�, … , #$� ∈ ℝ�$ . The payoff of a coalition � is the sum of the payoffs of its members,
which we denote by #��� = ∑ #��∈( . A payoff distribution # is efficient for an actual coalition �
if #��� = ���, meaning that the members of � cannot achieve a bigger “pie” to divide between
themselves within that coalition according to . However, some members of � may find it
worthwhile to leave that coalition and form another coalition ) with other players if #�)� <
�)�. This is called the blocking of payoff distribution # by the blocking coalition ). The
difference between #�)�, the payoff that members of ) are receiving before they actually form
), and �)�, the larger pie that awaits them, is called the excess of ) and is what motivates the
blocking. Excess is a measure of the objective size of the profit opportunity that ) is aiming to
exploit. In this paper we assume that one member of the blocking coalition needs to discover this
excess and rally the other members to exploit it. We call this act of blocking discovery
entrepreneurship by that member.4 The idea that entrepreneurship can be modeled as the
4 We assume the discovery entrepreneur chooses the blocking coalition based on the criteria of highest excess per capita. We assume that players are not perfect exploiters of the value they discover. We set the default exploitation efficiency to 0.7 (i.e. 70% of the objective value of the discovered opportunity is divided among the blocking coalition’s members). See also Table 2.

11
discovery and exploitation of excess in a characteristic function game is expressed in Littlechild
(1979a, 1979b) and Reid (1993).
The process by which members of a coalition decide on how exactly to divide the pie of value
between them is called bargaining. For simplicity, in this paper we assume a default of equal
bargaining power, i.e. in any bargaining situation, the involved parties distribute value equally
among themselves. If given a payoff distribution # = �#�, … , #$�, no possible coalition has any
excess, then the game is said to be in the core. This is analogous to the notion of equilibrium in
the sense that all gains from coalition formation have been exhausted and players cannot achieve
higher payoffs by changing their coalition (i.e. within the current characteristic function, all
profit opportunities from discovery entrepreneurship have been depleted). They do however
continue to receive their core payoffs in each time period. If the current profit distribution is not
in the core or if the core is empty for the current characteristic function, we say that the economy
is in disequilibrium and we measure the distance from equilibrium by the average amount of
positive excess that exists for all possible coalitions.
The marginal contribution of a player to a coalition � that contains is defined as the
difference between the value of � and the value of � without , or more formally: ��� −
��/{ }�. We define an act of innovation or creation entrepreneurship by a player as the process
by which that player’s marginal contribution to some possible coalition(s) increases. The idea
that innovation can be modeled as increasing marginal contribution in a characteristic function
game is expressed in Afuah (2009: 291). For simplicity, in this paper we assume that creation
entrepreneurship increases marginal contribution to all possible coalitions that include the
innovator. Furthermore, we assume that in each instance of creation, all such value increases are
by default equal to one unit of value (this is the ‘innovation magnitude’ in Table 2). We define a

12
state of the game as a triple �, ��, #� that gives a full snapshot of the game at any time point
with its characteristic function, coalition structure, and payoff distribution.
Default Conditions, Simulation Mechanics and Main Variables
Some variables are assumed fixed in order to fully specify the inputs needed to run the
simulations. The main results of the paper are produced with these fixed values. As we report
throughout the paper, reliability checks indicate that the simulation results are relatively robust to
these default values. The defaults were chosen for ease of implementation and visual
simplification. Table 2 provides a complete list of the variables used, their operational
definitions, default values, and the way in which different values of each were systematically
tested for reliability analysis. These tests were conducted for all experiments discussed below,
but they are only elaborated on for cases where they provide additional insight or alter the results
in important ways.
The game begins with a default number of four players unless specified otherwise. The game
starts in a state where each of the four agents is in its own singleton coalition, the default payoff
distribution is (0,0,0,0), and the characteristic function defining the value structure is given by
Table 1e. The last number in the characteristic function reflects the value of the grand coalition
-���, which we refer to as the size of the economy since it is the largest value in the
characteristic function. At each time period either nothing or at most one instance of each type of
entrepreneurship (creation or discovery) can occur. Time flows independently of these events,
but each instance of these events happens during a single time period. Following Konishi & Ray
(2003) we interpret each time period as an interval for which a coalition structure (and the
associated payoff) remains a binding agreement. After each period, each player receives a payoff
according to the payoff distribution of the state of the game at the end of that period.

13
The main independent variables that we give as inputs to the model are the capabilities of each
player in creation and discovery entrepreneurship. Each of these capabilities is represented by a
probability of action for each player. The probability of action for each type of entrepreneurship
determines how likely a player is to initiate that type of entrepreneurship at any time period.
These probabilities of action are the main independent variables we experiment with. The
dependent variable we are interested in is the performance of each player measured by their
cumulative payoff over time. The time horizon for each run of the simulation is 1000 time
periods unless stated otherwise, and all averages of the dependent variable are calculated over
200 runs. The simulation code was written and executed in MATLAB version 7.10.
------------------------------------Insert Table 2 about here------------------------------------
ANALYSIS
Returns to Discovery and Creation
We start our analysis with the simplest case of just one entrepreneur with only one
entrepreneurial capability. If that capability is pure creation (see Figure 1), it means that there is
no exploitation going on in the economy, thus leaving no one able to profit (Figures 1a and 1b).
The size of the economy (i.e. the value of the grand coalition, ���) grows however (Figure 1c),
reflecting the increasingly created value. Increasingly created but unexploited value continuously
increases the level of disequilibrium in the economy (Figure 1d). A roughly corresponding5
hypothetical real-world example would be the case of an inventor who keeps on inventing new
products with real market potential, but no one, including himself, has the initiative to
commercialize any of those products, neither alone nor in partnerships with others.
------------------------------------Insert Figure 1 about here------------------------------------
If on the other hand, the only entrepreneur is a discovery entrepreneur (Figure 2), no new value
is created and the size of the economy stays constant (Figure 2c). The players all appropriate
5 Real world examples can at best “roughly” correspond to idealized types in formal models.

14
value however, because the discovery entrepreneur quickly takes the economy to equilibrium
where players have payoffs within the core of the game (Figure 2d). Since the rent structure of
the characteristic function (Table 1e) is such that all players have equal advantage in equilibrium,
on average they end up with a similar share of the rents when all opportunities have been
exploited (Figure 2b). Once equilibrium has been reached no other changes occur and in each
time period from there on, the same constant profit is accumulated by each player, hence a linear
cumulative profit curve (Figure 2a). An example would be the case of four firms each producing
one product (say a video game console, two video games, and a motion sensing camera) that are
failing to compete well in their own product category. One of these firms may notice that by
combining the four products into 1 package, the package may sell better than the sum of its parts.
Once the four firms form a partnership, they are in equilibrium because no one benefits and
everyone loses from the removal of any of the four parts from the package.
------------------------------------Insert Figure 2 about here------------------------------------
One might expect that the discovery entrepreneur (the firm that came up with the idea) should
have some kind of performance advantage in this case compared to the passive players. The
reason it does not is that the most advantageous coalition for it is the grand coalition in which the
core (equilibrium) can be realized. So it continues to exploit opportunities by forming coalitions
until the grand coalition has been formed. But once that coalition has been formed, since we
assume it has equal bargaining power with all other players, the shares are divided evenly among
them. Reliability analysis did show that if we increase the bargaining power of the discovery
entrepreneur, this player gains a performance advantage over the passive players exactly
proportional to the relative difference in bargaining power. Reliability tests also showed that if
the characteristic function had been different, the discovery entrepreneur may have easily been
able to use the passivity of other players to its advantage. For example, if the characteristic

15
function was such that the discoverer had a disadvantage in equilibrium compared to some state
in disequilibrium, it would not equilibrate the market beyond that point.
Since the default starting characteristic function is not giving anyone an advantage over others,
the only way such an advantage may be created is through creation entrepreneurship. But as we
have seen, a creation entrepreneur cannot profit alone; some discovery entrepreneurship is
needed as well. Figure 3 shows the results for an economy with one discovery and one creation
entrepreneur. The discovery and creation entrepreneurs are able to outperform the passive
players considerably, each requiring the other’s support. The creation entrepreneur gets help
from the discoverer to exploit the advantages it creates in the characteristic function. The
discovery entrepreneur is able to locate and exploit the opportunities made available by the
creation entrepreneur while the passive players do not recognize these opportunities or take
initiative to exploit them. This setup resembles a situation in which a scientist or engineer invents
new products but does not know how to patent, commercialize and market them. Another player
is a businessman well versed in patenting and commercializing but does not have the scientific
and engineering knowledge to create or enhance the underlying technologies. Other players
either have no exploitations skill or are unaware of the potential value of the inventions and are
also unable to invent. Note that as shown in Figure 3d, it takes a while before the creation
entrepreneur’s innovations add up to enough new value to substantially destabilize
(disequilibrate) previously equilibrium outcomes. Before that point, the market process looks
very much similar to the case where no creation entrepreneur was present because the discovery
entrepreneur is able to equilibrate the market. This “while” is of course a relative concept and for
the time horizons of entrepreneurs in real life, the time may very well be too late.
Reliability analyses revealed that starting with advantageous positions in the characteristic
function or starting with an advantageous coalition structure and profit distribution can hasten

16
the arrival of the breakaway point when the creation and discovery entrepreneur start making
more than the passive players.
------------------------------------Insert Figure 3 about here------------------------------------
Returns to Improved Creation and Discovery Capabilities
In the set-up of Figure 2, the discovery entrepreneur with a 0.05 level discovery capability, along
with other players reach a payoff of 7.5 on average in equilibrium and a cumulative performance
of approximately 7300 over 1000 time periods (a bit less than 7500 because it takes some time to
reach equilibrium). How would this performance change if the discovery entrepreneur had a
different level of discovery capability (i.e. a different probability of action)? Would the
discoverer gain much from increasing this capability? To investigate this, we can measure the
final performance (at period 1000) against a changing level of discovery capability for player 2.
The results are shown in Figure 4a and 4b.
The figures demonstrate that for any constant level of creation activity, returns to improving
discovery capability are diminishing. They increase up to the point where all the opportunities
afforded by the characteristic function and the creation activity can be exploited by the discovery
activity in the time period given. Beyond that point there are no returns to increasing discovery
capacity. As long as the discovery entrepreneur’s level of discovery activity is enough to keep up
with the creation activity, no more of it is needed. Before that point is reached however, in the
area in which returns to improved discovery are increasing, these returns also benefit everyone
else in the economy to the extent allowed by the initial rent structure, and benefit the creation
entrepreneur beyond that (Figure 4b) to the extent that his or her creation activity allows.
Comparing Figures 4a and 4b also gives us an idea on the shape of returns to improved creation
capability which is explicitly considered in Figure 4c. While discovery activity is required to
reach the ceiling of possible profit, creation activity pushes the ceiling up. For a given level of

17
discovery activity, returns to improved creation entrepreneurship capabilities are linearly
increasing, without an upper limit, as they change the value structure of the economy and push
beyond existing possibilities. These increasing returns also benefit the discovery entrepreneur
with any given discovery capability, because they in fact could not be appropriated without
discovery. But the increased creation activity has no effect on passive players.
Overall, the results in this section support the argument that discovery and creation
entrepreneurship are highly synergistic and complementary (Darroch, Miles, & Paul, 2005;
Zahra, 2008), but move beyond this statement to provide a formalization and measure returns to
improved creation and discovery capabilities more precisely.
------------------------------------Insert Figure 4 about here------------------------------------
Returns to discovery and creation under competition
Let us bring competition into the picture. We start with the setup in Figure 3 (Figure 3a is
reproduced in 5a for convenience), and add an additional discovery entrepreneur. This would be
similar to a situation in which two manufacturing firms compete for the same inventions of one
R&D firm. The result of competition among the discovery entrepreneurs is devastating for them,
and hugely beneficial to the creation entrepreneur (Figure 5b). In fact, the performance of the
discovery entrepreneurs is reduced to the level of a passive player. Since they add no new value,
discovery entrepreneurs are perfect substitutes for each other. This allows the creation
entrepreneur to fully appropriate the new value created by playing the two discoverers against
each other. Note however, that the creation entrepreneur could not profit at all if it were not for
the discovery activity going on. This gives the discoverers strong incentive to engage in collusive
arrangements. For example, they could agree not to compete for the same inventions or to only
bargain with the R&D firm as partners. In such a case, the market structure is again reduced to
Figure 5a, with the difference being that the two discoverers now have to share their joint profit

18
(which is equal to the creation entrepreneur’s profit) among themselves. Further analysis of
collusive agreements and cartels is beyond the scope of this paper.
Moving on to competition among creators, suppose we have only one discovery entrepreneur but
two creation entrepreneurs (Figure 5c). For example, two R&D companies may be producing
patents but only one producer exists to manufacture and market them. The figure indicates that
no player is hurt by the competition and the creation entrepreneurs and the discovery
entrepreneur are all in fact better off and appropriating equally. The reason is that creation
entrepreneurs in this model are adding purely new value, and their inventions do not reduce the
value of previous inventions (i.e. their creations have no negative externalities). They are not
substitutes but complements and so do not really compete head to head in a zero-sum situation.
However, Figure 5c assumes that the discovery entrepreneur has enough capability to keep up
with the inventions of both creation entrepreneurs. If this were not so, the creation entrepreneurs
would need to compete for the limited time or attention of the discoverer, who would be unable
to attend to all possible opportunities. Hence the performance of the three would decline and be
limited by the upper bound allowed by the discoverer’s capability.
However, for a discoverer with enough discovery capability, it seems curious that in Figure 5c
the discoverer is unable to surpass the performance level of the two creators by taking advantage
of the fact that he or she can jump between them, always forming coalitions with whichever
innovator has created the most value. Reliability analyses showed that in 5 and 6 player
situations, when we increase the number of creation entrepreneurs competing for the services of
one discovery entrepreneur from two to three and from three to four competitors, the discoverer
does gain a performance advantage over the creation entrepreneurs. This advantage is not
because the competing creators do any worse, but just because the discovery entrepreneur is
better able to profit the way s/he does when there are more coalitions to choose from.

19
------------------------------------Insert Figure 5 about here------------------------------------
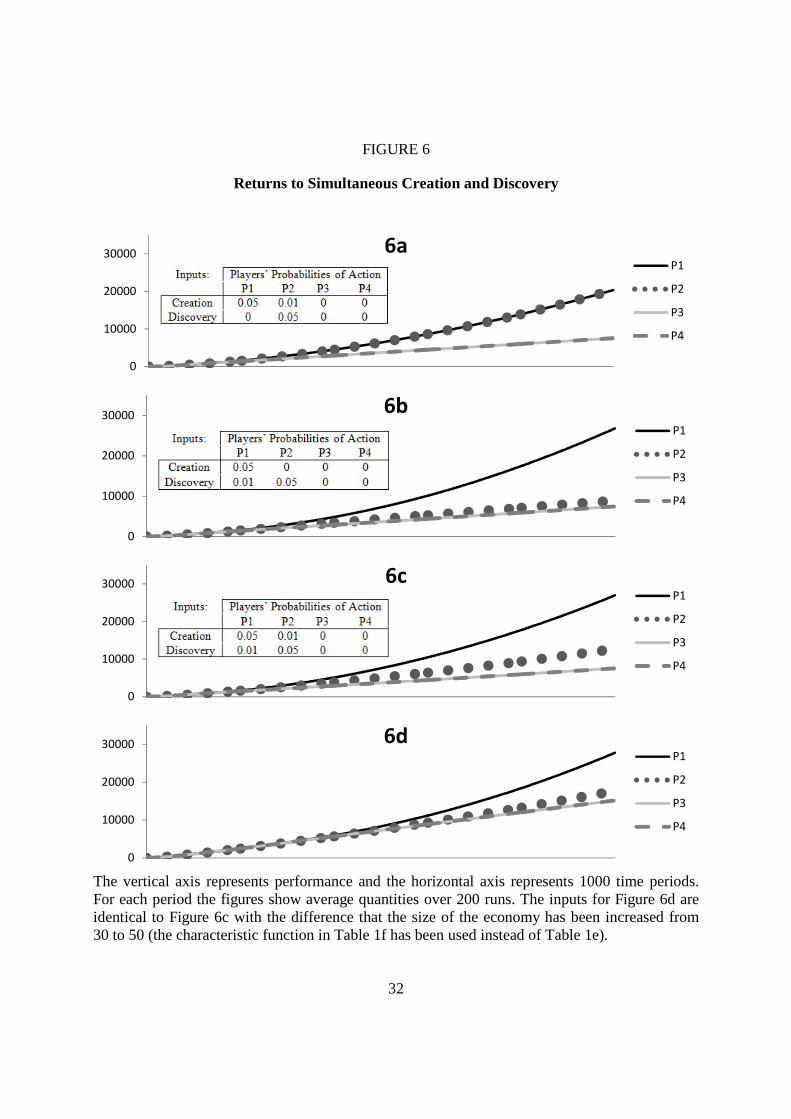
Returns to simultaneous discovery and creation (entrepreneurial ambidexterity)
So far we have assumed that players are either strictly creation entrepreneurs or strictly discovery
entrepreneurs. Now we consider what happens when they can do both, i.e. when they can be
entrepreneurially ambidextrous. Research on organizational ambidexterity usually refers to
simultaneous exploration and exploitation, with many other concepts in the literature more or
less corresponding to these two categories (Raisch & Birkinshaw, 2008). The way we have
modeled creation and discovery entrepreneurship corresponds to exploration and exploitation to
some extent because the former refers to the creation of completely new opportunities without
exploiting them while the latter refers to exploiting existing opportunities without creating any
new ones.
Results in the previous two sections already give us some hints on what we can expect the
returns to entrepreneurial ambidexterity to look like. Again we start with the base case of Figure
3 (also reproduced in 5a). If we suppose that the discovery entrepreneur develops a small level
of creation capability (Figure 6a) the results are that no one is hurt and the two entrepreneurs do
slightly better. The reason is that as we learned from Figure 5, creation entrepreneurs are
complements for each other and not substitutes. The small level of creation activity that is added
to the economy complements the earlier creation activity and increases the value of the coalitions
that the two entrepreneurs profit from. The ambidexterity does not create any particular
advantage for player 2 (the ambidextrous entrepreneur) over player 1 (the pure creation
entrepreneur) because the best opportunities for player 2 still involve player 1.
But if the creation entrepreneur was to learn a small level of discovery capability (Figure 6b), the
discovery entrepreneur would be devastated. This is because, as we learned from Figure 5,
discovery entrepreneurs are substitutes. The creation entrepreneur’s small discovery capability

20
substitutes for the discovery entrepreneur and brings the creation entrepreneur independence and
relative advantage. The reason that such a small level of discovery capability (0.01) is able to
substitute so well for the pure discovery entrepreneur’s capability (0.05) is that this small level is
sufficient to saturate the level of discovery capability that is needed. We learned from Figure 4
that there are no increasing returns to discovery beyond a certain point.
Figure 6c shows an economy in which two ambidextrous entrepreneurs exist, but one of them
specializes in discovery while the other specializes in creation. The figure shows that the
ambidextrous entrepreneur who specializes in creation (player 1) gains a competitive advantage
over the one who specializes in discovery (player 2). However, it should be noted that this
advantage is relative. It depends on the relative magnitude of the value added by the creation
activity compared to the size of the economy. To illustrate, observe that when we increase the
size of the economy from 30 (Table 1e) to 50 (Table 1f), with the same setup of Figure 6c, the
results are different such that the creation specialist starts to gain a competitive advantage over
the discovery specialist much later in time (Figure 6d).
------------------------------------Insert Figure 6 about here------------------------------------
DISCUSSION AND CONCLUSION
Theoretical contributions: Towards a dynamic theory of strategy
In this paper we have aimed to develop the basic elements of a theory of entrepreneurial rents so
that the current theories of strategy based on the notion of economic rent can be amended with
the “dynamics” they have been searching for within a shared formal framework. This framework
needs to model both the imperfectly competitive structure of the economic space (usually
associated with monopoly and/or Ricardian rents) and the movement of players through this
space from disequilibrium to equilibrium and vice versa (usually associated with Schumpeterian,
Austrian or entrepreneurial rents). For the first aspect, traditional cooperative game theory
models allow us to model the imperfectly competitive structure of the economy and a recent

21
wave of studies in the strategic management literature have begun to take advantage of this
modeling tool for exactly this reason (Adegbesan, 2009; Brandenburger & Stuart, 2007;
Lippman & Rumelt, 2003a; MacDonald & Ryall, 2004). Our contribution has been to add the
second aspect to these models by incorporating insights from coalition formation theory (Arnold
& Schwalbe, 2002; Hart & Kurz, 1983; Konishi & Ray, 2003; Ray & Vohra, 1999) to model the
dynamics of coalition formation, and the insights of dynamic cooperative game theory (Filar &
Petrosjan, 2000) to model the dynamics of repeated games over time.
Beyond measuring entrepreneurial rents in general, we have distinguished between two types of
entrepreneurial capability (creation and discovery) and have been able to impute entrepreneurial
rents to these capabilities. The imputation of value to its sources has always been a crucial issue
in strategic management (Lippman & Rumelt, 2003b; Winter, 1987). Winter (1987: 165) argues
that “a proper economic valuation of a collection of resources is one that precisely accounts for
the returns the resources make possible.” Thus it is important to know what portion of economic
returns can be traced to what kinds of entrepreneurial activity. After all, firms and entrepreneurs
need to make strategic decisions on the allocation of limited resources among these activities as
well as learning and developing the capabilities for better performance of these activities.
Implications for entrepreneurship strategy
Our results have many implications for entrepreneurship strategy, at least in situations
corresponding closely enough to the abstract assumptions of our model. Creation and discovery
are found to be highly synergistic and complementary, which supports theoretical arguments by
previous authors (Darroch, et al., 2005; Zahra, 2008). Without discovery, no one profits no
matter how much creation is happening. Without creation, profits are possible if there is
discovery, but those profits quickly reach a ceiling and do not afford the discoverer any
particular advantage if such an advantage does not already exist in the rent structure. If creation

22
and discovery both exist however, players with these capabilities can surpass other players even
if they start out with the same level of advantage. In combinations of one creation and one
discovery entrepreneur, returns to improved creation entrepreneurship capabilities are linearly
increasing as they change the value structure of the economy and push beyond existing
possibilities. These linearly increasing returns also benefit the discovery entrepreneur with any
given discovery capability. But for a given level of creation activity, returns to improved
discovery capabilities are diminishing, as they cannot go beyond the upper limit of whatever
opportunities are made available by the rent structure and creation activity.
Because discovery entrepreneurs are substitutes, competition among discovery entrepreneurs is
considerably devastating for them and hugely beneficial to creation entrepreneurs. Thus
discovery entrepreneurs have a strong incentive to collude and raise barriers to entry, as well as
encourage creation entrepreneurs to specialize purely in creation activity. Creation entrepreneurs
however, do not lose anything from the entrance of other creation entrepreneurs, since their
creation activities are complementary. As long as there is some level of discovery
entrepreneurship happening, it never hurts anyone to increase creation activity. Creation
entrepreneurs have an incentive to encourage competition among discovery entrepreneurs and do
not mind and even benefit if discovery entrepreneurs also learn to create some new value (as
long as it is completely new value, it does not substitute for their own efforts).
Since returns to improved discovery capability diminish quickly, an already capable discovery
entrepreneur would benefit more from developing creation capability than more discovery
capability. If a discovery entrepreneur cannot develop creation capability, he or she would
benefit more from enabling others to improve their creation capability than from improving his
or her own discovery capability. A creation entrepreneur would always gain from developing
further creation capabilities, but only if there is at least one discovery entrepreneur to collaborate

23
with. If there is no discovery entrepreneur out there, a creation entrepreneur would benefit much
more from learning some discovery or enabling some other partner to do so, than from
improving his or her own creation capability. Also, if there is one other discovery entrepreneur
but there is no competition among discovery entrepreneurs, learning some discovery or enabling
a new discoverer to enter the market can be more beneficial to the creation entrepreneur than
improving his or her own creation capability.
Limitations and Opportunities for Future Research
Any formal model must leave some significant variables out of the picture in order to focus on
others. Thus inevitably, our analysis is based on many constraining assumptions that can be
experimented with in future research. For example, the dynamics of player exit and entry,
learning and improvement of entrepreneurial capabilities over time, differences in bargaining
power among agents, and the role of possible exogenous shocks to the economy are all worthy of
further study. But as this paper has aimed to show, all of these and more can be fruitfully studied
within the integrative framework of cooperative game theory amended here to better incorporate
the dynamics of strategy.
REFERENCES
Adegbesan, J. A. (2009). On the Origins of Competitive Advantage: Strategic Factor Markets and Heterogeneous Resource Complementarity. Academy of Management Review, 34(3), 463-475.
Adner, R., Pólos, L., Ryall, M., & Sorenson, O. (2009). The Case for Formal Theory. Academy of Management Review, 34(2), 201-208.
Afuah, A. (2009). Strategic innovation : new game strategies for competitive advantage. New York: Routledge.
Alvarez, S. A., & Barney, J. (2007). Discovery and creation: Alternative theories of entrepreneurial action. Strategic Entrepreneurship Journal, 1, 11-26.
Amit, R., Glosten, L., & Muller, E. (1993). Challenges to Theory Development in Entrepreneurship Research. Journal of Management Studies, 30(5), 815-834.
Aoki, M. (1984). The co-operative game theory of the firm. Oxford: Oxford University Press. Arnold, T., & Schwalbe, U. (2002). Dynamic coalition formation and the core. Journal of Economic
Behavior & Organization, 49(3), 363-380. Barney, J. B. (1986). Strategic factor markets: expectations, luck, and business strategy. Management
Science, 32(10), 1231-1241. Baumol, W. J. (1993). Entrepreneurship, Management, and the Structure of Payoffs. Cambridge,
Massachusetts: The MIT Press. Brandenburger, A. M., & Stuart, H. W. (2007). Biform games. Management Science, 53(4), 537-549.
24
Bromiley, P., & Papenhausen, C. (2003). Assumptions of rationality and equilibrium in strategy research: The limits of traditional economic analysis. Strategic Organization, 1(4), 413.
Chavez, A. K. (2004). Adaptive agents in coalition formation games. In S. O. Kimbrough & D. J. Wu (Eds.), Formal Modelling in Electronic Commerce (pp. 421-443). Berlin: Springer.
Chavez, A. K., & Kimbrough, S. O. (2004). A model of human behavior in coalition formation games Proceedings of the Sixth International Conference on Cognitive Modeling.
Choi, Y. R., Lévesque, M., & Shepherd, D. A. (2008). When should entrepreneurs expedite or delay opportunity exploitation? Journal of Business Venturing, 23(3), 333-355.
Darroch, J., Miles, M. P., & Paul, C. W. (2005). Corporate venturing and the rent cycle. Technovation, 25(12), 1437-1442.
Dworman, G. O. (1994). Games computers play: simulating characteristic function game playing agents with classifier systems. Proceedings of the First IEEE Conference on Evolutionary Computation, June 27-29, Orlando, FL (pp. 696–701).
Dworman, G. O., Kimbrough, S. O., & Laing, J. D. (1995). On Automated Discovery of Models Using Genetic Programming: Bargaining in a Three-Agent Coalitions Game. Journal of Management Information Systems, 12(3), 97-125.
Eckhardt, J. T., & Shane, S. A. (2003). Opportunities and entrepreneurship. Journal of Management, 29(3), 333-349.
Filar, J. A., & Petrosjan, L. A. (2000). Dynamic Cooperative Games. International Game Theory Review, 2(1), 47-65.
Foss, N. J. (2000a). Austrian economics and game theory: a stocktaking and an evaluation. The Review of Austrian Economics, 13(1), 41-58.
Foss, N. J. (2000b). Equilibrium vs. evolution in the resource-based perspective. In N. J. Foss & P. L. Robertson (Eds.), Resources, Technology and Strategy (pp. 11-29). London: Routledge.
Foss, N. J. (2003). The strategic management and transaction cost nexus: Past debates, central questions, and future research possibilities. Strategic Organization, 1(2), 139-169.
Gifford, S. (1992). Allocation of entrepreneurial attention. Journal of Economic Behavior & Organization, 19(3), 265-284.
Gifford, S., & Wilson, C. (1995). A model of project evaluation with limited attention. Economic Theory, 5(1), 67-78.
Gupta, A. K., Smith, K. G., & Shalley, C. E. (2006). The interplay between exploration and exploitation. The Academy of Management Journal, 49(4), 693-706.
Harrison, J. R., Lin, Z., Carroll, G. R., & Carley, K. M. (2007). Simulation modeling in organizational and management research. Academy of Management Review, 32(4), 1229-1245.
Hart, S., & Kurz, M. (1983). Endogenous Formation of Coalitions. Econometrica, 51(4), 1047-1064. He, Z. L., & Wong, P. K. (2004). Exploration vs. exploitation: An empirical test of the ambidexterity
hypothesis. Organization Science, 15(4), 481-494. Helfat, C. E. (2007). Dynamic capabilities: understanding strategic change in organizations. Malden,
MA: Blackwell. Jacobson, R. (1992). The Austrian School of Strategy. Academy of Management Review, 17(4), 782-807. Keyhani, M., & Lévesque, M. (2011). The role of entrepreneurship in the market process: A simulation
study. Proceedings of the Academy of Management Annual Meeting, 1-7. Kilby, P. (1971). Hunting the Heffalump. In P. Kilby (Ed.), Entrepreneurship and Economic
Development (pp. 1-40). New York: The Free Press. Kirzner, I. M. (1973). Competition and Entrepreneurship. Chicago: The University of Chicago Press. Kirzner, I. M. (1997). Entrepreneurial discovery and the competitive market process: An Austrian
approach. Journal of Economic Literature, 35(1), 60-85. Klusch, M., & Gerber, A. (2002). Dynamic coalition formation among rational agents. IEEE Intelligent
Systems, 17(3), 42-47. Knight, F. H. (1921). Risk, uncertainty and profit. New York: Houghton Mifflin Company.

25
Konishi, H., & Ray, D. (2003). Coalition formation as a dynamic process. Journal of Economic Theory, 110(1), 1-41.
Kreps, D. M. (1990). Game theory and economic modelling. Oxford: Oxford University Press. Lippman, S. A., & Rumelt, R. P. (2003a). A bargaining perspective on resource advantage. Strategic
Management Journal, 24(11), 1069-1086. Lippman, S. A., & Rumelt, R. P. (2003b). The payments perspective: Micro-foundations of resource
analysis. Strategic Management Journal, 24(10), 903-927. Littlechild, S. C. (1979a). An application of the entrepreneurial theory of games. In S. J. Brams, A.
Schotter & G. Schwödiauer (Eds.), Applied Game Theory (pp. 313-324). Wurtzburg: Physica-Verlag.
Littlechild, S. C. (1979b). An Entrepreneurial Theory of Games. Metroeconomica, 31(2), 145-165. MacDonald, G., & Ryall, M. D. (2004). How do value creation and competition determine whether a firm
appropriates value? Management Science, 50(10), 1319-1333. Mahoney, J. T. (2001). A resource-based theory of sustainable rents. Journal of Management, 27(6),
651-660. Makowski, L., & Ostroy, J. M. (2001). Perfect Competition and the Creativity of the Market. Journal of
Economic Literature, 39(2), 479-535. March, J. G. (1991). Exploration and exploitation in organizational learning. Organization Science, 2(1),
71-87. Mathews, J. A. (2006a). Ricardian rents or Knightian profits? More on Austrian insights on strategic
organization. Strategic Organization, 4(1), 97-108. Mathews, J. A. (2006b). Strategizing, disequilibrium, and profit. Stanford, Calif.: Stanford Business
Books. Meyer, A. D., Gaba, V., & Colwell, K. A. (2005). Organizing far from equilibrium: Nonlinear change in
organizational fields. Organization Science, 16(5), 456-473. Nell, G. (2010). Competition as market progress: An Austrian rationale for agent-based modeling. The
Review of Austrian Economics, 23(2), 127-145. O'Driscoll, G. P., & Rizzo, M. J. (1985). The economics of time and ignorance. New York: Blackwell. Porter, M. E. (1991). Towards a Dynamic Theory of Strategy. Strategic Management Journal, 12(52),
95-117. Raisch, S., & Birkinshaw, J. (2008). Organizational ambidexterity: Antecedents, outcomes, and
moderators. Journal of Management, 34(3), 375-409. Ray, D., & Vohra, R. (1999). A theory of endogenous coalition structures. Games and Economic
Behavior, 26(2), 286-336. Reid, G. C. (1993). The survival of small business enterprise Discussion paper series: University of St.
Andrews. Department of Economics, Centre for Research into Industry, Enterprise, Finance and the Firm.
Ross, R. B., & Westgren, R. E. (2006). Economic returns to entrepreneurial behavior. Journal of Agricultural and Applied Economics, 38(2).
Rumelt, R. P. (1987). Theory, strategy, and entrepreneurship. In D. J. Teece (Ed.), The competitive challenge: Strategies for industrial innovation and renewal (pp. 137-158). Cambridge, Mass.: Ballinger.
Rumelt, R. P., Schendel, D., & Teece, D. J. (1991). Strategic management and economics. Strategic Management Journal, 12(S2), 5-29.
Schumpeter, J. A. (1934). The theory of economic development; an inquiry into profits, capital, credit, interest, and the business cycle (R. Opie, Trans.). Cambridge: Harvard University Press.
Shepherd, D. A., & Lévesque, M. (2002). A search strategy for assessing a business opportunity. IEEE Transactions on Engineering Management, , 49(1), 140-154.
Shubik, M. (1982). Game theory in the social sciences : concepts and solutions. Cambridge, Mass.: MIT Press.

26
Teece, D. J., Pisano, G., & Shuen, A. (1997). Dynamic capabilities and strategic management. Strategic Management Journal, 18(7), 509-533.
Von Mises, L. (1949). Human action; a treatise on economics. London: Hodge. Von Neumann, J., & Morgenstern, O. (1944). Theory of games and economic behavior. Princeton, NJ:
Princeton university press. Winter, S. G. (1987). Knowledge and competence as strategic assets. In D. J. Teece (Ed.), The
Competitive Challenge: Strategies for Industrial Innovation and Renewal (pp. 159-184). Cambridge, MA: Ballinger.
Yao, D. A. (1988). Beyond the Reach of the Invisible Hand - Impediments to Economic-Activity, Market Failures, and Profitability. Strategic Management Journal, 9, 59-70.
Zahra, S. A. (2008). The virtuous cycle of discovery and creation of entrepreneurial opportunities. Strategic Entrepreneurship Journal, 2, 243-257.
TABLE 1
The Characteristic Functions Used in This Paper
Coalition A B C AB Value 10 0 0 20
1a: The characteristic function of the 2-player diamond ring example
Coalition A B C AB AC BC ABC Value 10 0 0 20 30 0 30
1b: The characteristic function of the “three cornered market” example
Coalition A B C AB AC BC ABC Value 12 0 0 22 32 0 32
1c: The “three cornered market” example after an incremental innovation
Coalition A B C AB AC BC ABC Value 30 0 0 40 50 0 50
1d: The “three cornered market” example after a radical innovation
Coalition 1 2 3 4 12 13 14 23 24 34 123 124 134 234 1234 Value 0 0 0 0 10 10 10 10 10 10 20 20 20 20 30
1e: The default characteristic function used in the simulations
Coalition 1 2 3 4 12 13 14 23 24 34 123 124 134 234 1234 Value 0 0 0 0 10 10 10 10 10 10 20 20 20 20 50
1f: The default characteristic function modified to have a larger value for the grand coalition (i.e. size of the economy)

27
TABLE 2 List of Variables, Operational Definitions and Values
Variable Operational Definition Default values Reliability check Creation entrepreneurship capability (Creation)
The probability that a player will add value to all possible coalitions including that player in a time period. (See also: innovation magnitude)
0 for passive players and 0.05 for active players.
A variety of values between 0.01 and 0.2 were tested systematically. In some cases values up to 0.9 were tested for additional checks.
Discovery entrepreneurship capability (Discovery)
The probability that a player will discover a coalition in which s/he can appropriate greater value, rally others to form that coalition, and divide a percentage of the value s/he can exploit with the members of this new coalition according to each member’s bargaining power. (See also: exploitation efficiency, bargaining power)
0 for passive players and 0.05 for active players.
A variety of values between 0.01 and 0.2 were tested systematically. In some cases values up to 0.9 were tested for additional checks.
Number of time periods
The number of time periods in each trial. 1000 Shorter time frame results were already visible within the 1000 periods; longer time frames of 2000 and 5000 were also tested.
Starting characteristic function
A function assigning a value to each possible coalition at the start of each trial. (It may later be changed within the trial through acts of creation).
���
= 10�|�| − 1� as in Table 1e.
Coalition values were altered where relevant to test for the effect of providing some players with a starting potential payoff advantage over others or increasing the size of the economy.
Starting coalition structure and profit distribution
The actual coalitions formed at the start of each trial and the payoff each player in those coalitions is assigned at that time. The payoff distribution depends on the coalition structure because the sum of the payoffs for each player cannot exceed the characteristic function value of their actual coalition.
All players are assumed to start as singleton coalitions and thus receive zero payoffs.
Coalition structures and corresponding payoff distributions were altered where relevant to test for the effect of providing some players with a starting realized payoff advantage over others.
Innovation magnitude
The amount of value that a player’s act of creation will add to all possible coalitions including that player.
1 Values between 0.1 and 10 were tested.
Exploitation efficiency
The percentage of the excess value of a coalition that a player’s act of discovery can exploit and divide between the members of that coalition
70% (0.7) Values between 0.1 and 1 were tested.
Bargaining power The weight assigned to each player determining the share of value appropriated by that player when joining a new coalition and dividing its discovered value. The share of value appropriated by a player is in proportion to its bargaining power divided by the sum of all other coalition member’s bargaining power.
1 for all players Values were altered from 0.1 (10% of others) to 10 (%1000 of others). These changes provided interesting insights and the full implications are beyond the scope of this paper. Therefore, only some general trends are discussed here.
Number of players The number of players interacting in each trial. 4 Conditions with 5 and 6 players were also tested. Trends indicate that no major results are likely to change for higher numbers.

28
FIGURE 1 Base Case of One Creation Entrepreneur
FIGURE 2 Base Case of One Discovery Entrepreneur
Inputs: Players’ Probabilities of Action P1 P2 P3 P4
Creation 0.05 0 0 0 Discovery 0 0 0 0
Characteristic function: Table 1e
Inputs: Players’ Probabilities of Action P1 P2 P3 P4
Creation 0 0 0 0 Discovery 0 0.05 0 0
Characteristic function: Table 1e
1a: Cumulative profit (performance)
2a: Cumulative profit (performance)
1b: Non-cumulative profit
2b: Non-cumulative profit
1c: Size of the economy
2c: Size of the economy
1d: Distance from equilibrium
2d: Distance from equilibrium
The horizontal axis in all figures represents 1000 time periods. For each time period the figures show average quantities over 200 runs.
0
10000
20000
30000 P1
P2
P3
P4
0
10000
20000
30000 P1
P2
P3
P4
0
10
20
30
40
P1
P2
P3
P4
0
10
20
30
40
P1
P2
P3
P4
0
50
100
150
200
0
50
100
150
200
0
50
100
0
50
100

29
FIGURE 3
Base Case of One Creation and One Discovery Entrepreneur
Inputs: Players’ Probabilities of Action P1 P2 P3 P4
Creation 0.05 0 0 0 Discovery 0 0.05 0 0
Characteristic function: Table 1e
3a: Cumulative profit (performance)
3b: Non-cumulative profit
3c: Size of the economy
3d: Distance from equilibrium
The horizontal axis in all figures represents 1000 time periods. For each time period the figures show average quantities over 200 runs.
0
10000
20000
30000 P1
P2
P3
P4
0
10
20
30
40
P1
P2
P3
P4
0
50
100
150
200
0
50
100

30
FIGURE 4
Returns to Improving Creation and Discovery Entrepreneurship Capability
4a & 4b Inputs:
Players’ Probabilities of Action
P1 P2 P3 P4
Creation 4a: 0
4b: 0.05 0 0 0
Discovery 0 x 0 0
4c Inputs:
Players’ Probabilities of Action
P1 P2 P3 P4 Creation x 0 0 0
Discovery 0 0.05 0 0
The vertical axis represents performance at time period 1000. For each data point the figures show average quantities over 200 runs.
0
10000
20000
30000
40000
50000
0
0.01
0.02
0.03
0.04
0.05
0.06
0.07
0.08
0.09
0.1
0.11
0.12
0.13
0.14
0.15
0.16
0.17
0.18
0.19
0.2
4a P1
P2
P3
P4
0
10000
20000
30000
40000
50000
0
0.01
0.02
0.03
0.04
0.05
0.06
0.07
0.08
0.09
0.1
0.11
0.12
0.13
0.14
0.15
0.16
0.17
0.18
0.19
0.2
4b
P1
P2
P3
P4
0
10000
20000
30000
40000
50000
0
0.01
0.02
0.03
0.04
0.05
0.06
0.07
0.08
0.09
0.1
0.11
0.12
0.13
0.14
0.15
0.16
0.17
0.18
0.19
0.2
4c
P1
P2
P3
P4

31
FIGURE 5
Returns to Creation and Discovery Under Competition
5b Inputs: Players’ Probabilities of Action P1 P2 P3 P4
Creation 0.05 0 0 0 Discovery 0 0.05 0.05 0
5c Inputs: Players’ Probabilities of Action P1 P2 P3 P4
Creation 0.05 0 0.05 0 Discovery 0 0.05 0 0
The vertical axis represents performance and the horizontal axis represents 1000 time periods. For each period the figures show average quantities over 200 runs. The inputs for 5a are given in Figure 3.
0
10000
20000
300005a
P1
P2
P3
P4
0
10000
20000
30000 5bP1
P2
P3
P4
0
10000
20000
30000 5cP1
P2
P3
P4
32
FIGURE 6
Returns to Simultaneous Creation and Discovery
The vertical axis represents performance and the horizontal axis represents 1000 time periods. For each period the figures show average quantities over 200 runs. The inputs for Figure 6d are identical to Figure 6c with the difference that the size of the economy has been increased from 30 to 50 (the characteristic function in Table 1f has been used instead of Table 1e).
0
10000
20000
300006a
P1
P2
P3
P4
0
10000
20000
300006b
P1
P2
P3
P4
0
10000
20000
300006c
P1
P2
P3
P4
0
10000
20000
300006d
P1
P2
P3
P4