Embed Size (px)
Citation preview
OIV’s Focus
The sparkling wine market
The sparkling wine market has expanded in recent years, boosted by high global demand.
• Production has increased significantly: + 40% in 10 years, while that of still wines only increased by 7% over the same period.
• Although EU countries are still the leaders in this market segment, sparkling wine production as well as consumption is on the rise in the rest of the world.
• Consumption of this type of product is changing: we are seeing a progression
from mainly festive consumption to more regular consumption.
Contents
1. Introduction
2. Sparkling wine production in 2013
3. Consumption
4. Foreign trade

15,4 mhl
wines
0
500
1000
1500
2000
2500
3000
3500
4000
Rest of the
world
RussiaSpainGermanyItalyFrance
2
3
4
5
20122010200820062004200220002
4
6
8
10
2012201020082006200420022000
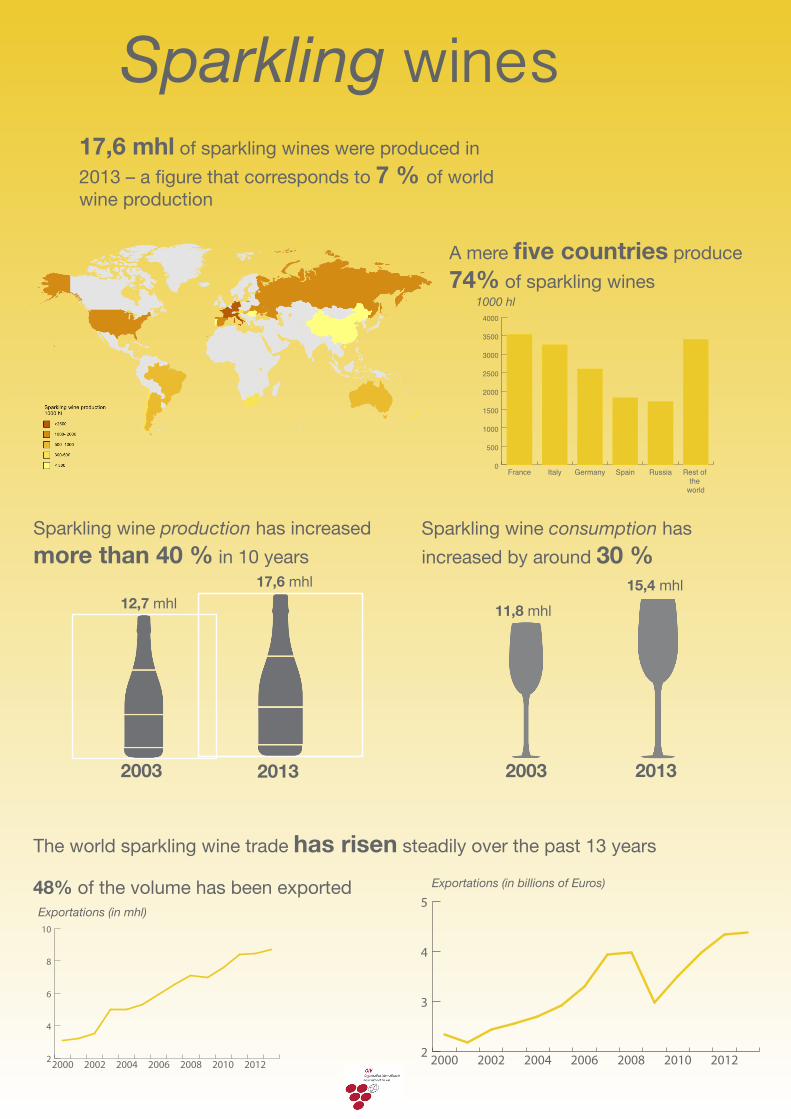
17,6 mhl of sparkling wines were produced in 2013 – a figure that corresponds to 7 % of world wine production
A mere five countries produce 74% of sparkling wines
Sparkling wine production has increased more than 40 % in 10 years
Sparkling wine consumption has increased by around 30 %
2003 2013 2003 2013
17,6 mhl12,7 mhl 11,8 mhl
1000 hl
Exportations (in billions of Euros)
Exportations (in mhl)
The world sparkling wine trade has risen steadily over the past 13 years
48% of the volume has been exported
Sparkling
OIV 2014 -Sparkling wines Page 2
1. Introduction
The purpose of this report is to provide an overview of the sparkling wine segment and its
place in the wine sector.
Grouped under the term sparkling wines are naturally (fermented) sparkling and carbonated wines derived from grapes, must or wine. These must have been treated according to the techniques allowed by the International Organisation of Vine and Wine (OIV), including the traditional or cuve-close (closed tank) methods for which carbon dioxide (CO2) is of endogenous origin, as well as methods of addition of CO2 of exogenous origin.
2. Sparkling wine production in 2013
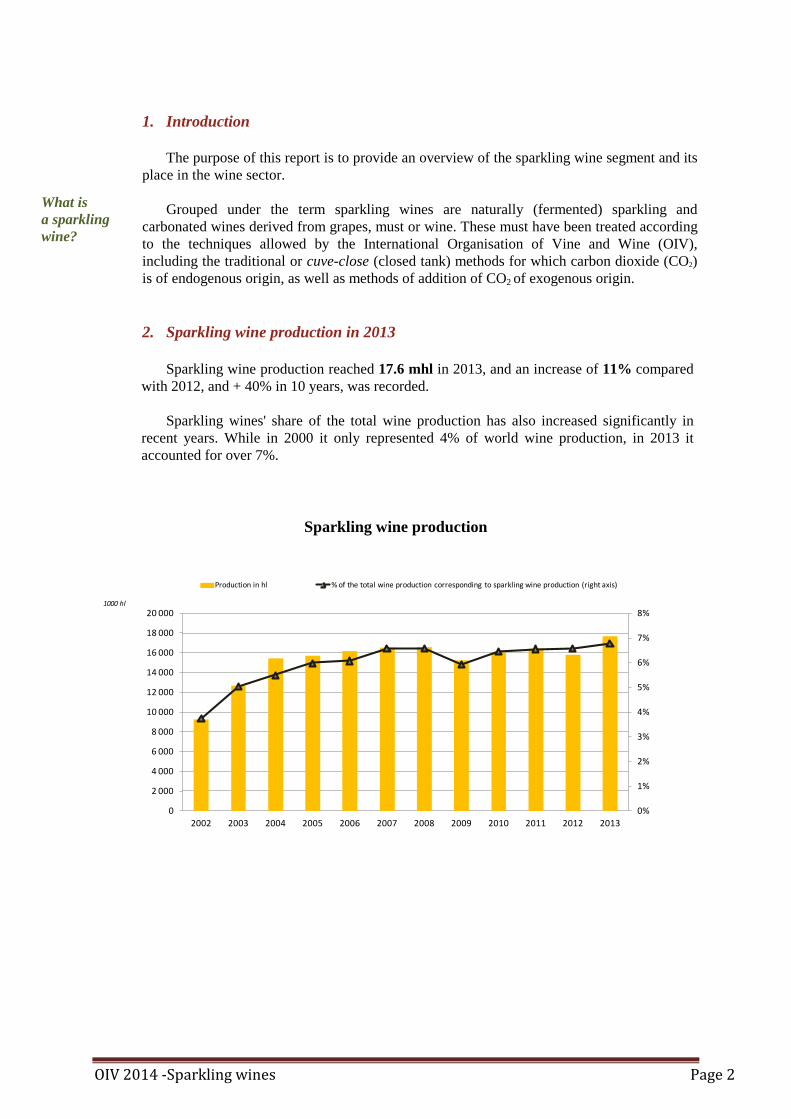
Sparkling wine production reached 17.6 mhl in 2013, and an increase of 11% compared with 2012, and + 40% in 10 years, was recorded.
Sparkling wines' share of the total wine production has also increased significantly in
recent years. While in 2000 it only represented 4% of world wine production, in 2013 it accounted for over 7%.
Sparkling wine production
0%
1%
2%
3%
4%
5%
6%
7%
8%
0
2 000
4 000
6 000
8 000
10 000
12 000
14 000
16 000
18 000
20 000
2002 2003 2004 2005 2006 2007 2008 2009 2010 2011 2012 2013
1000 hl
Production in hl % of the total wine production corresponding to sparkling wine production (right axis)
What is a sparkling wine?
OIV 2014 -Sparkling wines Page 3
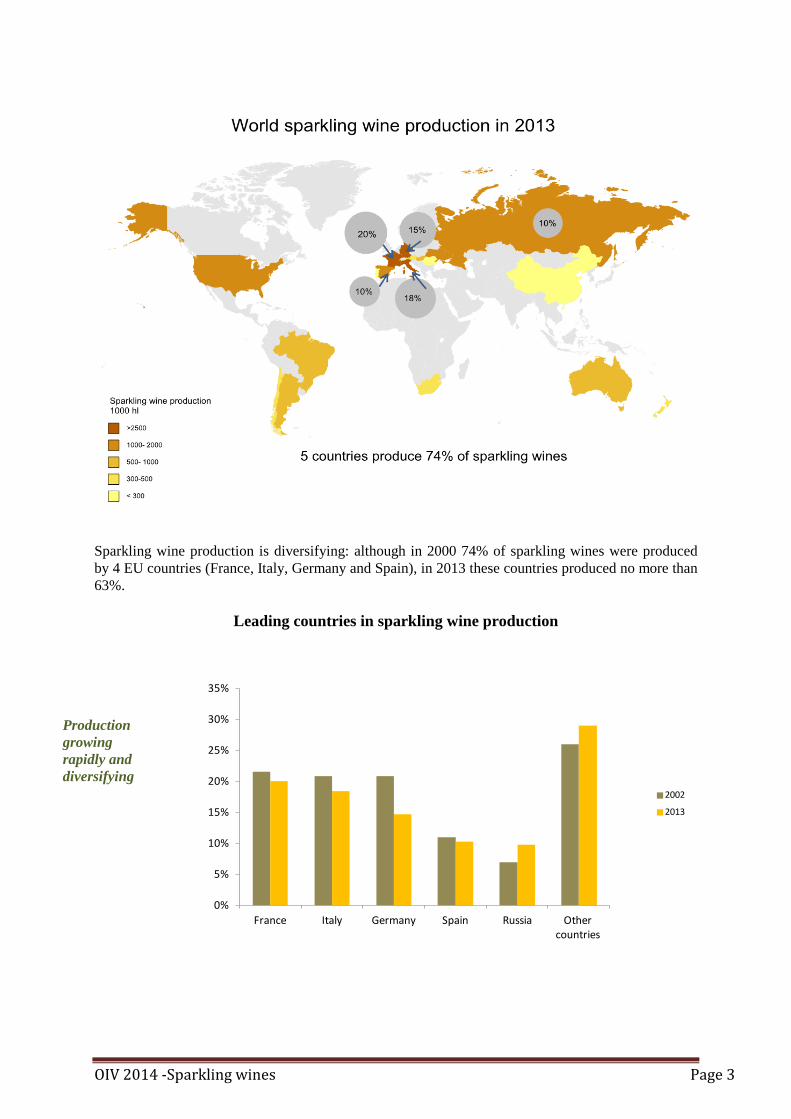
Sparkling wine production is diversifying: although in 2000 74% of sparkling wines were produced by 4 EU countries (France, Italy, Germany and Spain), in 2013 these countries produced no more than 63%.
Leading countries in sparkling wine production
Production growing rapidly and diversifying
0%
5%
10%
15%
20%
25%
30%
35%
France Italy Germany Spain Russia Other countries
2002
2013

OIV 2014 -Sparkling wines Page 4
1. France remains the biggest producing country with 3.5 mhl produced in 2013. Champagne alone accounts for more than 15% of sparkling wines produced globally.
2. With 3.2 mhl, Italy is the second biggest producing country. Its production has increased significantly over the past 10 years, + 22% compared with 2002.
3. Germany is in third place with 2.6 mhl, sparkling wines representing 31% of its wine production.
4. Spain produces 1.8 mhl of sparkling wines using the classic traditional method.
Countries of growing importance in sparkling wine production
0
200
400
600
800
1 000
1 200
1 400
1 600
1 800
2 000
Russia USA Ukraine Australia Argentina Hungary Brazil
1000 hl
2002 2013
Although production of this type of wine remains concentrated in Western Europe, Eastern European countries as well as Australia and the United States are becoming increasingly important. In these countries, sparkling wine production has greatly increased over the past 10 years (+ 29% in Australia, + 25% in the United States, and three times the size in Argentina [+ 198%] and Brazil [+ 248%]).
3. Consumption
The seasonality of sparkling wine consumption is its main characteristic. It is generally
linked to end-of-year celebrations. However, we are seeing a trend towards a levelling in consumption. It is now spread throughout the year1
. Sparkling wines have come to be consumed in a more regular and less specific manner; they are thus associated with all celebrations (such as birthdays, retirements, etc.) as well as being consumed as an aperitif and used to make cocktails.
1 Worldwide survey on the sparkling wine sector, London market research institute TNS, 2012; Instituto Nacional de Vitivinicultura (INV)
World consumption evaluated at 15.4 mhl and on the rise
OIV 2014 -Sparkling wines Page 5
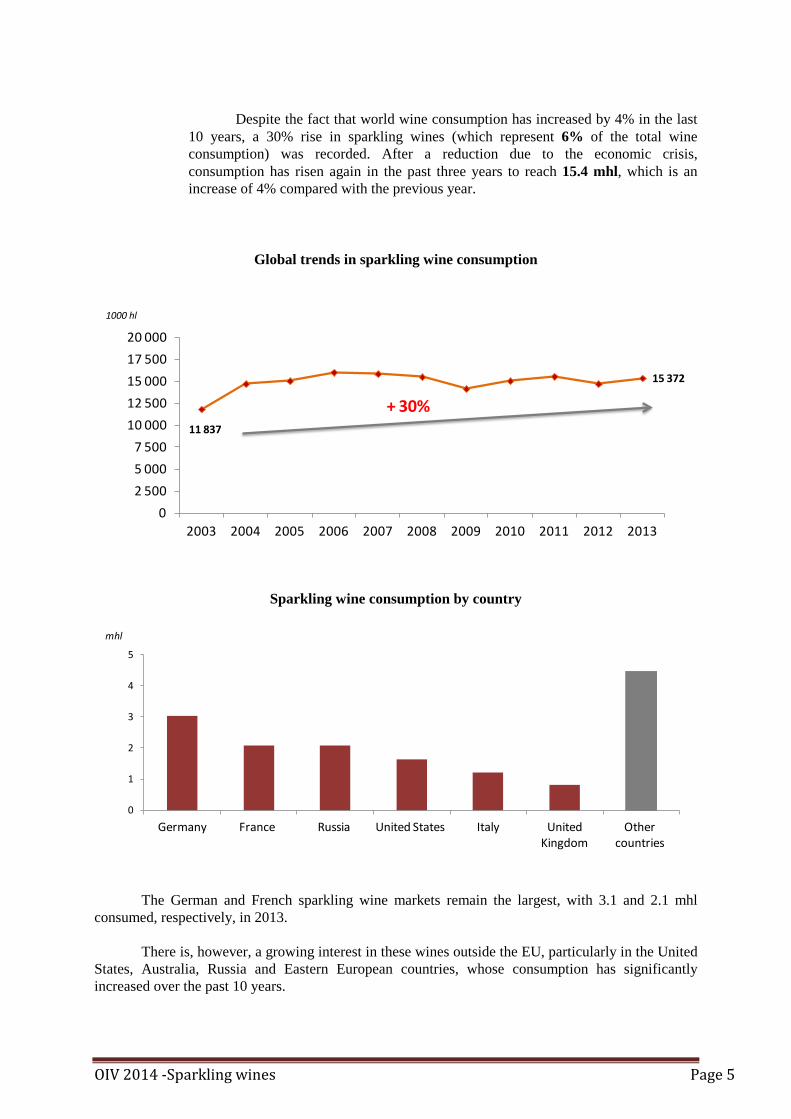
Despite the fact that world wine consumption has increased by 4% in the last
10 years, a 30% rise in sparkling wines (which represent 6% of the total wine consumption) was recorded. After a reduction due to the economic crisis, consumption has risen again in the past three years to reach 15.4 mhl, which is an increase of 4% compared with the previous year.
Global trends in sparkling wine consumption
11 837
15 372
0
2 500
5 000
7 500
10 000
12 500
15 000
17 500
20 000
2003 2004 2005 2006 2007 2008 2009 2010 2011 2012 2013
1000 hl
+ 30%
Sparkling wine consumption by country
0
1
2
3
4
5
Germany France Russia United States Italy United Kingdom
Other countries
mhl
The German and French sparkling wine markets remain the largest, with 3.1 and 2.1 mhl consumed, respectively, in 2013.
There is, however, a growing interest in these wines outside the EU, particularly in the United States, Australia, Russia and Eastern European countries, whose consumption has significantly increased over the past 10 years.

OIV 2014 -Sparkling wines Page 6
The growth in Australian consumption of this type of product (+ 7% in 5 years and + 42% in 10 years) is due to Australia's good level of purchasing power and a favourable exchange rate, but also to the democratisation of sparkling wine consumption (a fad).
The consumption of Champagne and, more generally, "bulles" (fine sparkling) wines is also
on the rise in China. This country is now the fifth biggest Champagne-importing country in the world, after the EU and just behind the United States, Japan and Australia.
Main sparkling wine-consuming countries
4. Foreign trade
The sparkling wine trade has increased steadily since the end of the last century, in terms of volume as well as in value:
• Since 2000, world exports of sparkling wines have more than doubled,
with an average annual growth rate of 9%, going from 3.11 mhl to 8.7 mhl in 2013.
• The growth in terms of value has been relatively slower; the average annual growth rate since 2000 stands at 5%, going from 2.3 billion euros in 2000 to 4.3 billion euros in 2013. The 2008 economic crisis and its effects on world wine consumption, particularly with regard to high-end products, significantly affected the change in terms of value.
World trade has steadily increased
Unit: 1000 hl
Germany 3134 2992 2838 3090 3047 2922 2820 2924 2813 3251 3052 -3%France 1509 3220 3364 3589 3429 3458 2457 2120 2446 1403 2084 38%Russia 967 1363 1556 1626 2307 2271 2113 2509 2553 2363 2084 115%United State 1090 1166 1173 1222 1243 1209 1251 1386 1566 1593 1650 51%Italy 1886 2576 2502 2422 1428 1226 1284 1288 1311 1078 1219 -35%UK 641 670 713 936 756 740 664 765 936 809 815 27%Australia 348 383 437 457 485 490 461 503 449 459 495 42%Belgium 156 185 196 215 217 178 283 338 357 417 458 194%Spain 375 285 269 157 328 318 339 460 375 368 319 -15%Switzerland 128 127 132 133 149 144 153 161 168 175 174 37%Netherlands 70 61 77 96 109 96 92 85 94 91 84 20%Portugal 57 60 70 71 76 79 71 85 44 68 75 31%
2013/2003 Variation2007 2008 2009 2010 2011 2012 20132003 2004 2005 2006

OIV 2014 -Sparkling wines Page 7
Exports: trends in terms of volume and value
0
1
2
3
4
5
6
0123456789
10
2000 2001 2002 2003 2004 2005 2006 2007 2008 2009 2010 2011 2012 2013
Billions of euros mhl
Millions of hectolitres Billions of euros
The share of sparkling wine exports accounts for nearly 9% of the total volume of wine exports and 18% of their value.
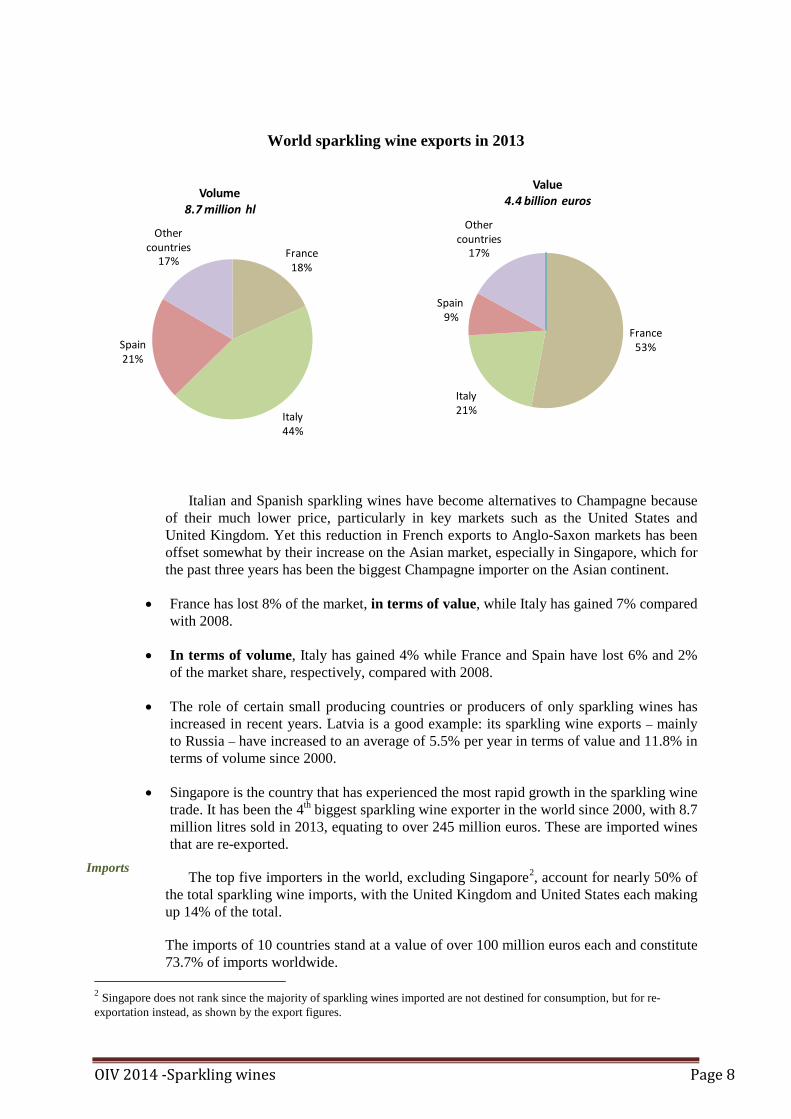
The three biggest exporters of sparkling wines represent more than 80% of world exports in terms of volume and value, with France alone accounting for 53% of the total exports in terms of value.
The market shares of the biggest exporters have grown significantly in the last 10 years. As mentioned above, sparkling wine exports from France, both in terms of volume and value, were severely affected by the effects of the 2008 economic crisis, which favoured products marketed at a lower price such as Italian Prosecco and Spanish Cava. Nevertheless, it is important to note that Italian and Spanish exports are still worth less than French exports, driven by Champagne (which accounts for over half of the value despite less volume being exported).
EU: the leader in exports
0
20
40
60
80
100
120
2003 2004 2005 2006 2007 2008 2009 2010 2011 2012 2013
mhl World wine export trends, in terms of volume
Sparkling wines
Still wines
5 %
9 %
OIV 2014 -Sparkling wines Page 8
World sparkling wine exports in 2013
Italian and Spanish sparkling wines have become alternatives to Champagne because of their much lower price, particularly in key markets such as the United States and United Kingdom. Yet this reduction in French exports to Anglo-Saxon markets has been offset somewhat by their increase on the Asian market, especially in Singapore, which for the past three years has been the biggest Champagne importer on the Asian continent.
• France has lost 8% of the market, in terms of value, while Italy has gained 7% compared with 2008.
• In terms of volume, Italy has gained 4% while France and Spain have lost 6% and 2% of the market share, respectively, compared with 2008.
• The role of certain small producing countries or producers of only sparkling wines has increased in recent years. Latvia is a good example: its sparkling wine exports – mainly to Russia – have increased to an average of 5.5% per year in terms of value and 11.8% in terms of volume since 2000.
• Singapore is the country that has experienced the most rapid growth in the sparkling wine trade. It has been the 4th biggest sparkling wine exporter in the world since 2000, with 8.7 million litres sold in 2013, equating to over 245 million euros. These are imported wines that are re-exported.
The top five importers in the world, excluding Singapore2
The imports of 10 countries stand at a value of over 100 million euros each and constitute 73.7% of imports worldwide.
, account for nearly 50% of the total sparkling wine imports, with the United Kingdom and United States each making up 14% of the total.
2 Singapore does not rank since the majority of sparkling wines imported are not destined for consumption, but for re-exportation instead, as shown by the export figures.
Imports
France18%
Italy44%
Spain21%
Other countries
17%
Volume8.7 million hl
France53%
Italy21%
Spain9%
Other countries
17%
Value4.4 billion euros

OIV 2014 -Sparkling wines Page 9
France is the top provider for all key markets, followed by Italy.
Abbreviations: hl: hectolitres khl: thousands of hectolitres mhl: millions of hectolitres
Sources
The data is based on the questionnaire on sparkling wines submitted to OIV Member States. For several countries that did not provide the requested information and for the majority of non-Member States, the data published in this report was estimated using the FranceAgriMer database. Trade data was provided by the "Observatorio Español del Mercado del Vino (OEMV)".
For more information, contact Barbara Iasiello at [email protected]

18 rue d'Aguesseau 75008 Paris, France
www.oiv.int Tél: +33 1 44 94 80 80
Follow us: