Embed Size (px)
Citation preview
Elementary Course in Using Elementary Course in Using GIS in Geography CurriculumGIS in Geography Curriculum
Session 3Session 3 ( 3 hours ) ( 3 hours )
Geographic Data provided in Geographic Data provided in Hong KongHong Kong
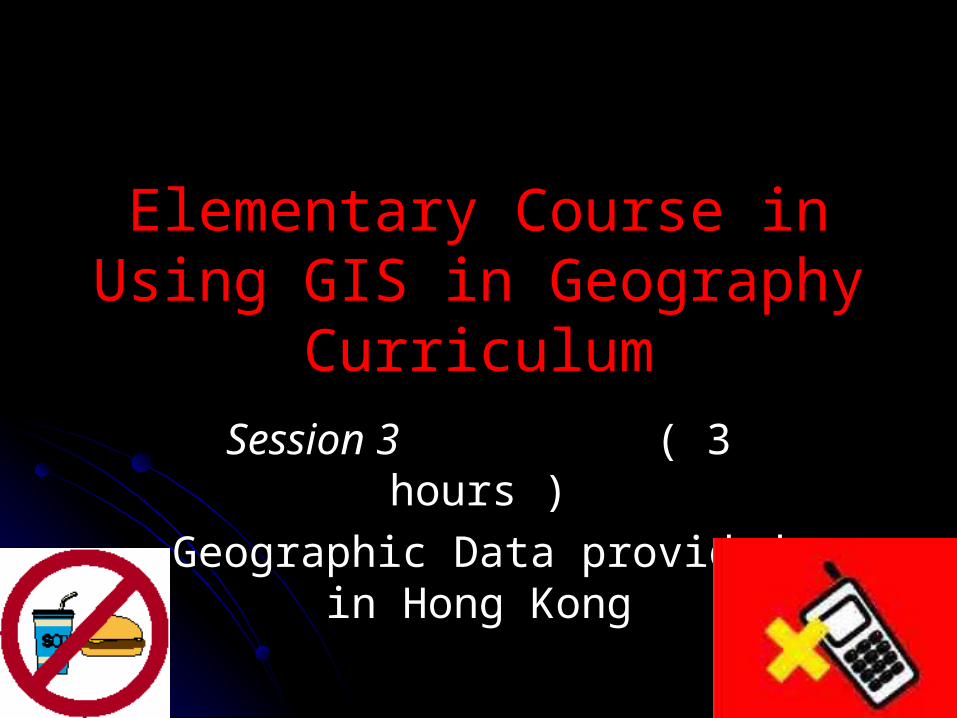
1. Import Hong Kong digital maps 1. Import Hong Kong digital maps E00 filesE00 files to to ArcInfArcInfo shapefiles o shapefiles
2. Types and sources of digital data provided in Hon2. Types and sources of digital data provided in Hong Kongg Kong
3. Free Internet resources for GIS data3. Free Internet resources for GIS data
4. Supplementary techniques of GIS4. Supplementary techniques of GIS
5. Review and consolidation on the kinds of skill lear5. Review and consolidation on the kinds of skill learned in Sessions 1 and 2ned in Sessions 1 and 2
6. Practical exercise and useful websites6. Practical exercise and useful websites
Import Hong Kong digital maps Import Hong Kong digital maps E00 E00 filesfiles to to ArcInfo shapefilesArcInfo shapefiles
a.a. Defining data attributesDefining data attributes
b.b. Converting raw data into system Converting raw data into system databasedatabase
c.c. Archiving data for future useArchiving data for future use
d.d. Correlating data among layersCorrelating data among layers
( see ( see handouthandout p. 2 - 3 ) p. 2 - 3 )
1. Demonstration1. Demonstration by instructor to use by instructor to use Hong Kong map for displaying GIS Hong Kong map for displaying GIS
layers and making analysis layers and making analysis
2.2. PracticalPractical by teacher participants to by teacher participants to convert Hong Kong convert Hong Kong E00 filesE00 files to to shapeshape
filesfiles
Hong Kong navigation street mapHong Kong navigation street mapMapKingMapKing by MapAsia by MapAsia
( see handout p. 4 – 5 )
www.mapasia.com
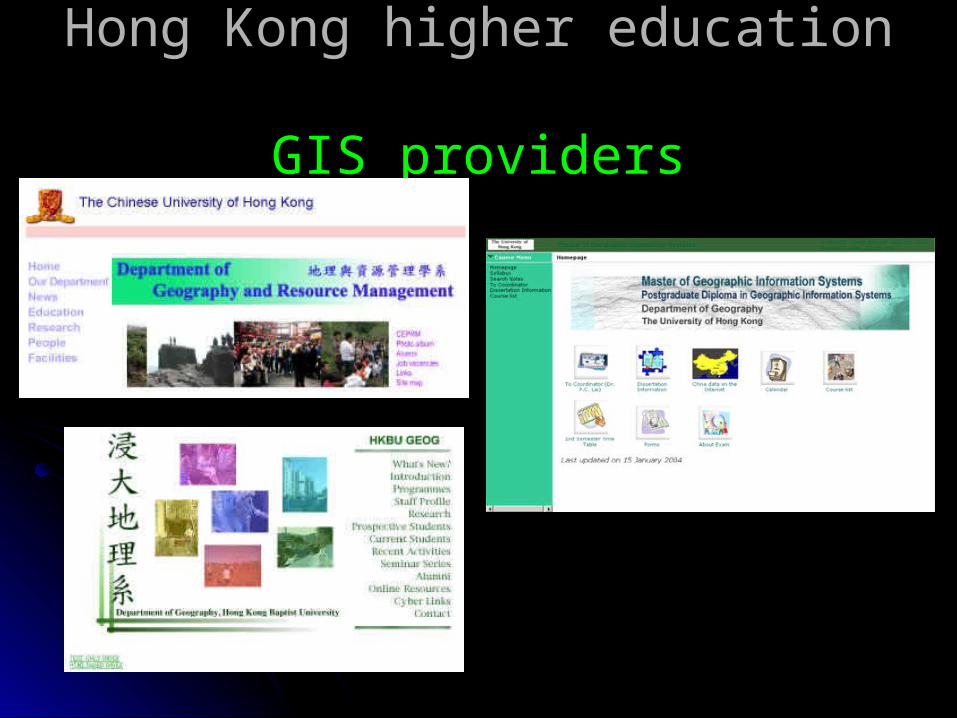
Hong Kong higher education Hong Kong higher education GIS providersGIS providers

Hong Kong GIS selected sourcesHong Kong GIS selected sources
Hong Kong Baptist University – Geography DepartmentHong Kong Baptist University – Geography Department
http://geog.hkbu.edu.hk/geog3600/http://geog.hkbu.edu.hk/geog3600/
Using HK Lands Department GIS maps as referenceUsing HK Lands Department GIS maps as reference
http://www.centamap.com/gc/home.aspx?ck=glist&ft3=cpal
Hong Kong Geographic Information Systems AssociationHong Kong Geographic Information Systems Association
http://www.hkgisa.org.hk/GovernmentGIS.phphttp://www.hkgisa.org.hk/GovernmentGIS.php
Hong Kong Government GIS usersHong Kong Government GIS users
1. Lands Department1. Lands Department
2. Environmental Protection Department2. Environmental Protection Department
3. Planning Department3. Planning Department
4. Civil Engineering Department4. Civil Engineering Department
China GIS selected sourcesChina GIS selected sources
1. China Historical GIS1. China Historical GIS
http://www.fas.harvard.edu/~chgis/data/chgis/downhttp://www.fas.harvard.edu/~chgis/data/chgis/downloads/v4/loads/v4/
2. China Association for Geographic Information System2. China Association for Geographic Information System
http://www.cagis.org.cn/http://www.cagis.org.cn/3. China State Bureau of Surveying and Mapping3. China State Bureau of Surveying and Mapping
http://www.sbsm.gov.cn/http://www.sbsm.gov.cn/4. China Academy of Science Remote Sensing Research I4. China Academy of Science Remote Sensing Research I
nstitutenstitutehttp://www.remotesensing.csdb.cn/rsdata/default.htmhttp://www.remotesensing.csdb.cn/rsdata/default.htm
Explore Explore Amazon rain forest Amazon rain forest
with GISwith GIS
>>>>>> Disappearing Green Disappearing Green Canopy – Who should pay for Canopy – Who should pay for the massive deforestation in the massive deforestation in
rain forest regions?rain forest regions?

Amazon GIS by Smithsonian National Zoological Amazon GIS by Smithsonian National Zoological Park, USAPark, USA
1.http://nationalzoo.si.edu/ConservationAndScience1.http://nationalzoo.si.edu/ConservationAndScience/ConservationGIS/AmazonGIS//ConservationGIS/AmazonGIS/
Amazonia studiesAmazonia studies2. http://www.agteca.com/amazon.htm2. http://www.agteca.com/amazon.htm3. http://amazongis.org/library/GISatSI/3. http://amazongis.org/library/GISatSI/
GIS model to study Brazilian tropical forest sustainaGIS model to study Brazilian tropical forest sustainable logging and conservationble logging and conservation
4.http://www.ecologyandsociety.org/vol6/iss1/art4/4.http://www.ecologyandsociety.org/vol6/iss1/art4/
Global WarmingGlobal Warming – –
fact or fiction?fact or fiction?
1. http://climatehotmap.org/asia.html1. http://climatehotmap.org/asia.html
2. 2. http://www.ipcc.ch/http://www.ipcc.ch/
3. 3. http://epa.gov/climatechange/effects/coastal/index.htmlhttp://epa.gov/climatechange/effects/coastal/index.html
4.4.http://globalchange.nasa.gov/Resources/pointers/http://globalchange.nasa.gov/Resources/pointers/glob_warm.htmlglob_warm.html
5.5.http://plasma.nationalgeographic.com/mapmachinehttp://plasma.nationalgeographic.com/mapmachine//
6.6.http://www.climatecrisis.net/http://www.climatecrisis.net/
7.7.http://environment.newscientist.com/channel/earth/http://environment.newscientist.com/channel/earth/climate-change/climate-change/
8.8. http://freegeographytools.com/2007/animated-flooding-http://freegeographytools.com/2007/animated-flooding-maps-storm-surge-sea-level-rise-and-river-floodingmaps-storm-surge-sea-level-rise-and-river-flooding
9.9. http://www.msnbc.msn.com/id/18230533/ http://www.msnbc.msn.com/id/18230533/
10.10.http://en.wikipedia.org/wiki/Global_warminghttp://en.wikipedia.org/wiki/Global_warming
11.11. http://www.hko.gov.hk/contente.htmhttp://www.hko.gov.hk/contente.htm
Documentary Documentary videos and moviesvideos and movies about about Global WarmingGlobal Warming : :
a.a. An Inconvenient TruthAn Inconvenient Truth
b.b. Six Degrees Could Change the World Six Degrees Could Change the World (NGC)(NGC)
c.c. The Great Global Warming SwindleThe Great Global Warming Swindle
Supplementary techniques of GISSupplementary techniques of GIS
1.1. Measuring Measuring Length / DistanceLength / Distance2.2. Creating Creating piepie chartscharts ( to show proportional ( to show proportional
relationship and spatial distribution ) on relationship and spatial distribution ) on layerslayers
3.3. Highlight Highlight areasareas with similar nature with similar nature
( see ( see handouthandout p. 8 )p. 8 )
Digital Maps sold in Hong Kong
Survey and Mapping Office
( Lands Department )http://www.landsd.gov.hk/mapping/welcome.htm
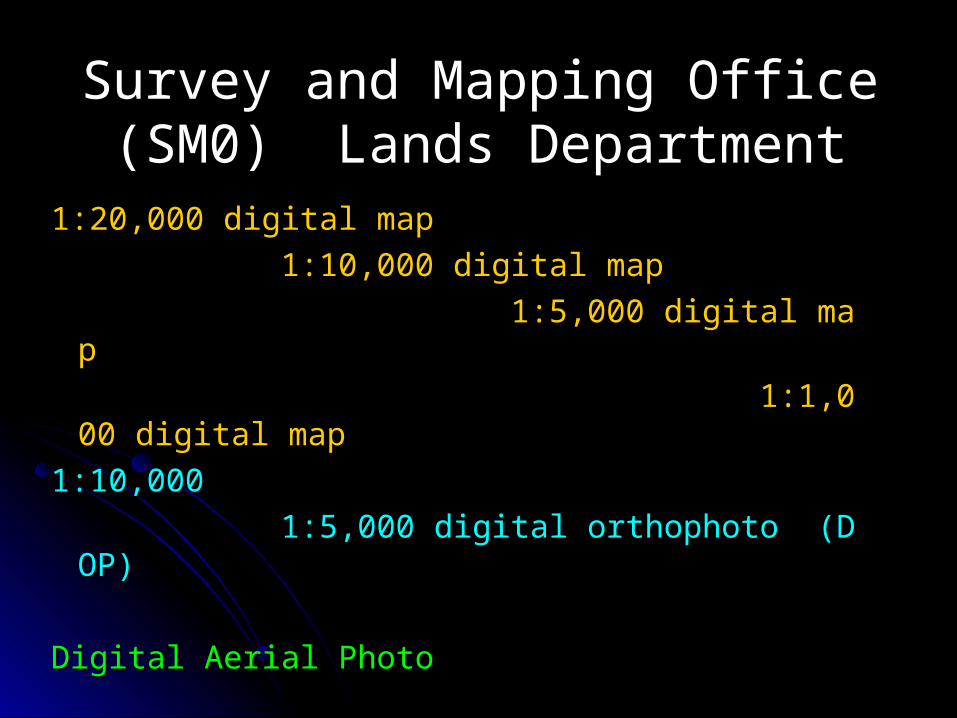
Survey and Mapping Office (SM0) Survey and Mapping Office (SM0) Lands DepartmentLands Department
1:20,000 digital map1:20,000 digital map
1:10,000 digital map1:10,000 digital map
1:5,000 digital map1:5,000 digital map
1:1,000 digital map1:1,000 digital map
1:10,0001:10,000
1:5,000 digital orthophoto (DOP)1:5,000 digital orthophoto (DOP)
Digital Aerial PhotoDigital Aerial Photo
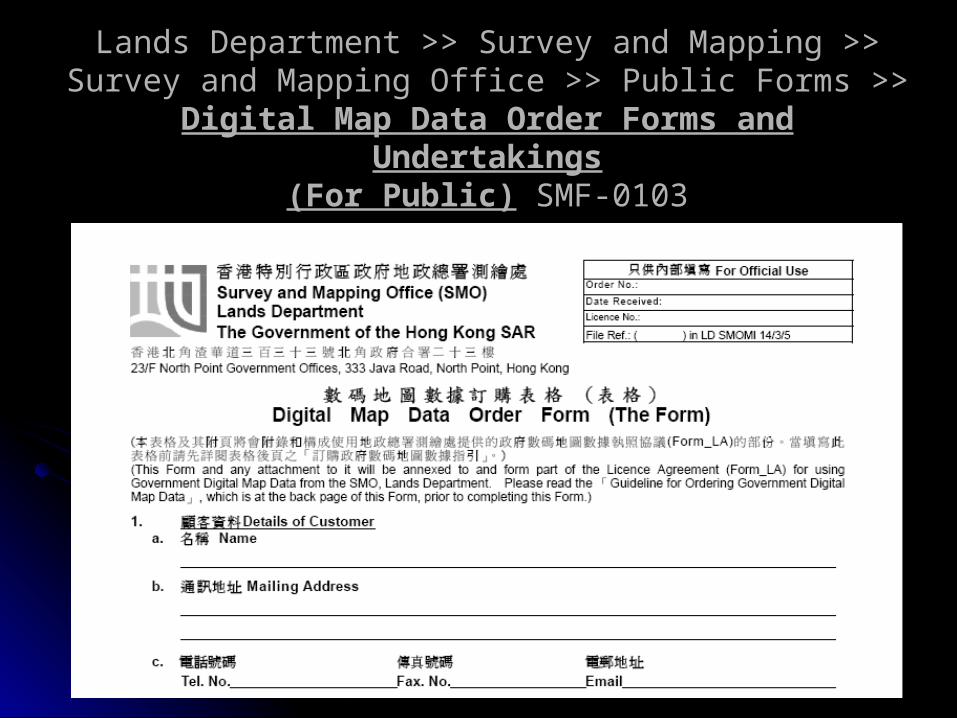
Lands Department >> Survey and Mapping >> Survey and Lands Department >> Survey and Mapping >> Survey and Mapping Office >> Public Forms >> Mapping Office >> Public Forms >> Digital Map Data Digital Map Data
Order Forms and UndertakingsOrder Forms and Undertakings(For Public)(For Public) SMF-0103 SMF-0103
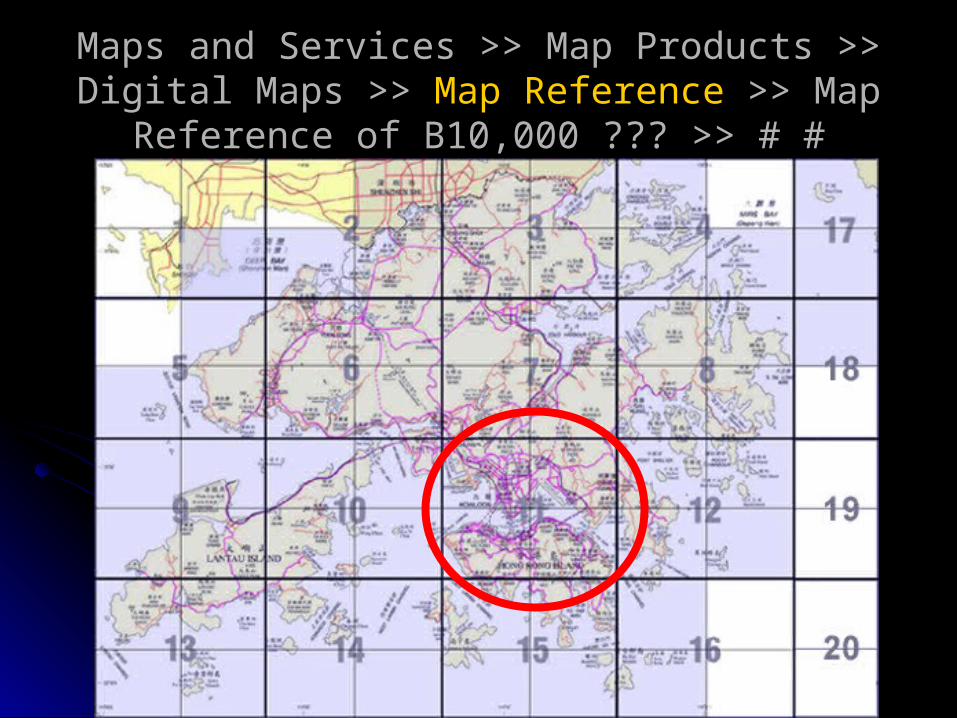
Maps and Services >> Map Products >> Digital Maps and Services >> Map Products >> Digital Maps >> Maps >> Map ReferenceMap Reference >> Map Reference of >> Map Reference of
B10,000 ??? >> # #B10,000 ??? >> # #

To purchase Hong Kong digital maTo purchase Hong Kong digital maps from Survey and Mapping Office,ps from Survey and Mapping Office,
Lands Department Lands Department
go togo to http://www.landsd.gov.hkhttp://www.landsd.gov.hk
Consolidation of skills learned in Consolidation of skills learned in creating GIS overlays creating GIS overlays
Additional ExerciseAdditional Exercise: : Effect of screen-like buildings on the quality of airEffect of screen-like buildings on the quality of airin Kowloon districts – Air Pollution in Hong Kongin Kowloon districts – Air Pollution in Hong Kong
( pay special attention to the ( pay special attention to the polluted areaspolluted areas caused caused by either the traffic or “wall effect”, study the data by either the traffic or “wall effect”, study the data included in the “attribute tables” )included in the “attribute tables” )

屏風效應是指樓宇建築猶如天幕,阻礙自然風進出,這使城市內的空氣轉差、「不見天日」、悶熱難擋,影響周邊居民的生活環境、空氣質素、景觀及自然光,令相對內陸的地區的空氣流動減弱,氣溫升高,加劇地區性的空氣污染問題,令區內居民患呼吸道毛病的比例增加。
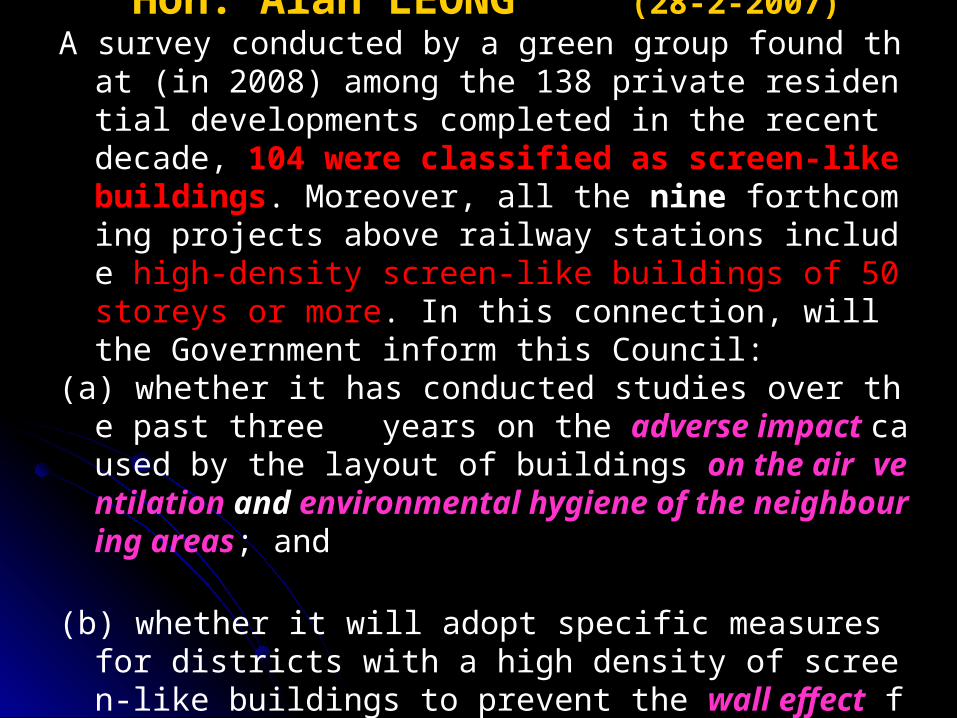
Hon. Alan LEONG (28-2-2007)A survey conducted by a green group found that (in 2008) a
mong the 138 private residential developments completed in the recent decade, 104 were classified as screen-like buildings. Moreover, all the nine forthcoming projects above railway stations include high-density screen-like buildings of 50 storeys or more. In this connection, will the Government inform this Council:
(a) whether it has conducted studies over the past three years on the adverse impact caused by the layout of buildings on the air ventilation and environmental hygiene of the neighbouring areas; and
(b) whether it will adopt specific measures for districts with a high density of screen-like buildings to prevent the wall effect from worsening
NoteNote: : The following The following exerciseexercise (Additional Exercise: Air (Additional Exercise: Air
Pollution in Hong Kong)Pollution in Hong Kong) is purely a is purely a make-up make-up exampleexample for teachers to consolidate the skills for teachers to consolidate the skills learnt in Sessions 1 – 3 usinglearnt in Sessions 1 – 3 using data data for displaying for displaying GIS layers; and all the data involved are GIS layers; and all the data involved are notnot official ones and thus may be biased.official ones and thus may be biased.
If teachers use similar exemplars, they should If teachers use similar exemplars, they should lead the students to discuss all possible reasons lead the students to discuss all possible reasons for the spatial pattern of distribution of air for the spatial pattern of distribution of air pollutants in the studied area.pollutants in the studied area.
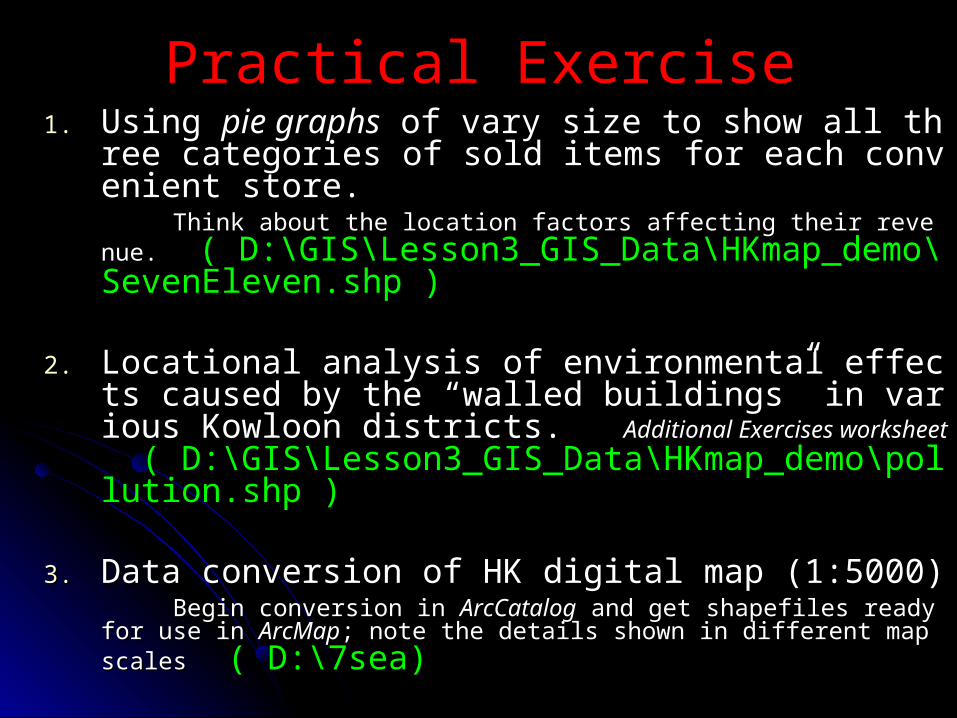
Practical ExercisePractical Exercise1.1. Using Using pie graphspie graphs of vary size to show all three cat of vary size to show all three cat
egories of sold items for each convenient store. egories of sold items for each convenient store. Think about the location factors affecting their revenue.Think about the location factors affecting their revenue. ( D:\GIS\L ( D:\GIS\L
esson3_GIS_Data\HKmap_demo\SevenEleven.shesson3_GIS_Data\HKmap_demo\SevenEleven.shp )p )
2.2. Locational analysis of environmental effects causeLocational analysis of environmental effects caused by the “walled buildings” in various Kowloon distrd by the “walled buildings” in various Kowloon districts. icts. Additional Exercises worksheetAdditional Exercises worksheet ( D:\GIS\Lesson3_G( D:\GIS\Lesson3_GIS_Data\HKmap_demo\pollution.shp )IS_Data\HKmap_demo\pollution.shp )
3.3. Data conversion of HK digital map (1:5000)Data conversion of HK digital map (1:5000) Begin conversion in Begin conversion in ArcCatalogArcCatalog and get shapefiles ready for use in and get shapefiles ready for use in ArcArc
MapMap; note the details shown in different map scales; note the details shown in different map scales ( D:\7sea)( D:\7sea)
Lesson planLesson plan to be prepared by to be prepared by teacher participants for teacher participants for Lesson 4Lesson 4( refer to topics listed on p. 6 of Lesson 1 ( refer to topics listed on p. 6 of Lesson 1
handout or any other topic listed in the handout or any other topic listed in the geography curriculum )geography curriculum )
Sample Lesson PlanSample Lesson Plan >>> >>>
pleaseplease complete Course Evaluationcomplete Course EvaluationThank youThank you


![Geographic Information System [GIS]](https://img.pdfslide.us/doc/110x75/56813e57550346895da84a4e/geographic-information-system-gis-568e78fe5e678.jpg)