Embed Size (px)
Citation preview
18750 DOI: 10.1021/la102325e Langmuir 2010, 26(24), 18750–18759Published on Web 11/19/2010
pubs.acs.org/Langmuir
© 2010 American Chemical Society
Elemental Depth Profiling of Fluoridated Hydroxyapatite:
Saving Your Dentition by the Skin of Your Teeth?
Frank M€uller,*,† Christian Zeitz,† Hubert Mantz,† Karl-Heinz Ehses,† Flavio Soldera,‡
J€org Schmauch,§ Matthias Hannig, ) Stefan H€ufner,† and Karin Jacobs†
†Experimental Physics, ‡Functional Materials, and §Engineering Physics, Faculty of Natural Sciencesand Technology, Saarland University, 66123 Saarbr€ucken, Germany, and )Clinic of Operative Dentistry,
Periodontology and Preventive Dentistry, Faculty of Medicine - Clinical Medicine,Saarland University Hospital, 66421 Homburg, Germany
Received June 8, 2010. Revised Manuscript Received September 14, 2010
Structural and chemical changes that arise from fluoridationof hydroxyapatite (Ca5(PO4)3OHor “HAp”), as representingthe synthetic counterpart of tooth enamel, are investigated by X-ray photoelectron spectroscopy (XPS). Elementaldepth profiles with a depth resolution on the nanometer scale were determined to reveal the effect of fluoridation inneutral (pH=6.2) and acidic agents (pH=4.2). With respect to the chemical composition and the crystal structure, XPSdepth profiling reveals different effects of the two treatments. In both cases, however, the fluoridation affects the surfaceonly on the nanometer scale, which is in contrast to recent literature with respect to XPS analysis on dental fluoridation,where depth profiles of F extending to several micrometers were reported. In addition to the elemental depth profiles,as published in various other studies, we also present quantitative depth profiles of the compounds CaF2, Ca(OH)2, andfluorapatite (FAp) that were recently proposed by a three-layer model concerning the fluoridation of HAp in an acidicagent. The analysis of our experimental data exactly reproduces the structural order of this model, however, on a scalethat differs by nearly 2 orders of magnitude from previous predictions. The results also reveal that the amount ofCa(OH)2 and FAp is small compared to that of CaF2. Therefore, it has to be asked whether such narrow Ca(OH)2 andFAp layers really can act as protective layers for the enamel.
1. Introduction
The destruction of the enamel by caries is a major oral healthproblem in industrialized countries. InGermany, for example, theeconomical loss caused by caries increased from 6.4 billion eurosin 2002 to 7.5 billion euros in 2004.1 Data from clinical investiga-tions clearly demonstrate the cariostatic effect of fluoride com-pounds in various forms of applications.2-5 Although numerousexperimental studies have been performed up to now,6-9 nomodel comprehensively describes the reaction mechanisms offluoride with enamel.
In principle, enamel can be affected in different ways by aF-containing agent, depending on the parameters at which theagent is applied. Fluoridation can be considered as a pure sub-stitutional mechanism where the (OH)- groups within the crystalstructure of the enamel, as mainly formed by hydroxyapatite(Ca5(PO4)3OH or HAp), are replaced by F- ions, leading to theisostructural fluorapatite (Ca5(PO4)3F or FAp). FAp is known tobe more resistant to acids than HAp and is therefore regarded to
protect the tooth (for HAp and FAp, demineralization startsat pH∼ 5.5 and pH∼ 4.6, respectively10). Especially in the acidicrange, fluoridation is no longer a pure substitutional mechanismand also complex chemical reactions can take place, leading toa decomposition of the initial crystal structure of the enamelby the formation of other compounds, such as, e.g., CaF2 andCa(OH)2.
6
The lack of understanding of the nature of fluoridation yetrenders an optimization of the procedure difficult. In the presentstudy, we investigate the chemical and structural effects offluoridation in order to answer the following questions:
(i) How deep does fluoridation reach into the enamellayer?
(ii) Which chemical species are produced in enamel byfluoridation?
(iii) Which, if any, structural changes in the enamel takeplace by fluoridation?
These questions were recently dealt with by Gerth et al. usingdepth-selective X-ray photoelectron spectroscopy (XPS).6 Theauthors proposed that, after the fluoridation by an acidic agent,the surface of enamel can be described by a three-layer-model,containing CaF2, Ca(OH)2, Ca5(PO4)3F, and Ca5(PO4)3OH. Theresults of the present work support this model, but on a com-pletely different length scale (nanometers instead ofmicrometers).It is the discrepancy of the length scale that is the important resultof the present study, since this questions all earlier interpretationsof the effect of fluoride on enamel.
XPS is a well-established andwell-suitedmethod11 to study thefluoridationof enamel. CombinedwithAr ion etching, the surface
*Corresponding author. E-mail: [email protected].(1) Gesundheit und Krankheitskosten 2002 und 2004; Statistisches Bundesamt:
Wiesbaden, Germany, 2007.(2) A. R. TenCateOralHistology: Development, Structure, and Function, 5th ed.;
C. V. Mosby: St. Louis, MO, 1998.(3) Ross, M.H.; Kaye, G.I.; Pawlina, W. Histology: A Text and Atlas, 4th ed.;
Lippincott Williams & Wilkins: Philadelphia/London, 2003.(4) Dean, H. T. Public Health Rep. 1938, 53, 1443.(5) Dean, H. T.; Arnold, F. A.; Elvone, E. Public Health Rep. 1942, 57, 1155.(6) Gerth, H. U. V.; Dammaschke, T.; Sch€afer, E.; Z€uchner, H. Dent. Mater.
2007, 23, 1521.(7) Uchtmann, H.; Duschner, H. J. Dent. Res. 1982, 61, 423.(8) Duschner, H.; Uchtmann, H. Caries Res. 1988, 22, 65.(9) Caslavska, V.; Duschner, H. Caries Res. 1991, 25, 27.(10) Featherstone, J. D. B.; Ten Cate, J.M. Physicochemical aspects of fluoride-
enamel interactions. In Fluoride in Dentistry; Ekstrand, J., Fejerskov, O., Silverstone,L.M., Eds.; Munskgaard International Publishers: Copenhagen, 1988; pp 125-149.
(11) Oechsner, H. Thin Film and Depth Profile Analysis; Topics in Current Physics37; Springer: Berlin/Heidelberg/New York/Tokyo, 1984.
DOI: 10.1021/la102325e 18751Langmuir 2010, 26(24), 18750–18759
M€uller et al. Article
sensitivity of XPS allows investigating the chemistry of the sur-face of the sample layer-by-layer with a depth resolution in therange of 1 nm. So far, literature reports on a large variety of suchinvestigations,6-9 but the results of these studies are often contra-dictory, and therefore, there is still no consistent picture concern-ing the mechanism of fluoridation. In contrast, it seems that eachnew experiment provides new results. Especially with respectto the penetration depth of the F- ions,12 as representing themain indicator for fluoridation, the published data do not showa consistent dependence on the applied agent, the pH value, thefluorine concentration, or the exposure time. A possible clue toexplain the discrepancies of previous studies could lie in thesamples that were used to investigate fluoridation. In most ofthese studies,6-9 XPS depth profiling was performed on toothenamel (bovine or human), on powders of synthetic HAp or onnonsintered pellets of synthetic HAp, but these kinds of specimendo not represent appropriate systems to reveal the fluorida-tion mechanism for a single grain by a technique without spatialresolution, such asXPS, especially since the results of such experi-ments may be affected by structural defects and/or porosities.Therefore, the interaction between fluoride and the enamel can bededuced from these studies only with some restrictions.
On one hand, the main interest to reveal the impact of fluorideon enamel is to gain detailed insight into the mechanisms thatare involved in this process in order to optimize the protection ofthe tooth’s surface. On the other hand, the tooth itself is notnecessarily an ideal model system to investigate the basic princi-ples of fluoridation, especially since it represents a solid with avery complex (and maybe individual) structure with defects.For example, Dowker et al.13 reported porosities of teeth up to45%, depending on the physical condition of a particular speci-men. The porosity of a tooth is expected to have a double impacton the elemental depth distributions that are finally observed in anexperiment:
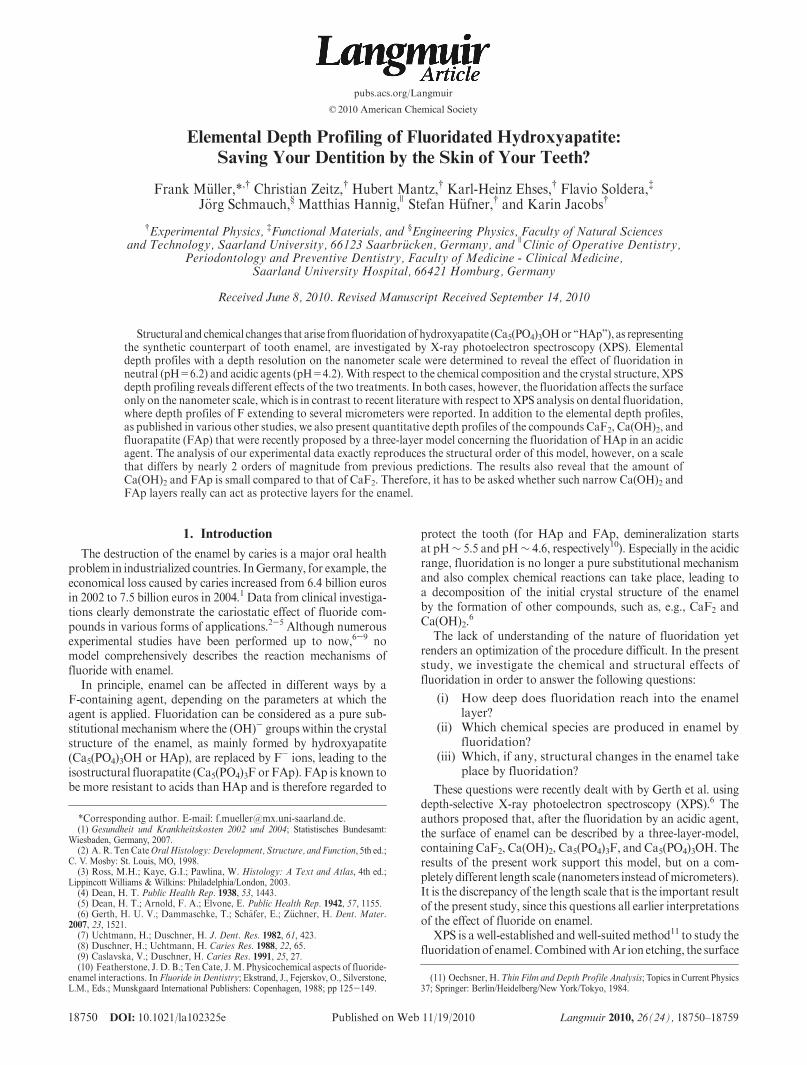
(1) If the agent is provided via themacroscopic surface ofthe sample, microporosities of the sample, especiallyif present as microchannels, result in a larger micro-scopic surface. For a particular crystallite, the agentsare also provided along lateral directions, and there-fore the “macroscopic” depth profile, as determinedin experiment, displays a deeper penetration depththan the true depth profile for a particular crystallite.
(2) The depth profile of the F distribution is not onlydetermined by the HAp-FAp substitution withinthe enamel. In addition, it can be strongly affected byan embedding of the F containing solvent within theporosities.
Both scenarios are schematically sketched in Figure 1. Thesurface porosity of tooth enamel is a particular problem, espe-cially in case where the enamel crystallites are dissolved in partand exposed as a result of treatment with an acidic agent, asapplied in most of the previous studies.6-9 Since a powder can beconsidered as a solid with extremely high porosity, this problem isalso valid for powder samples of synthetic HAp that have beenalso used for elemental depth profiling experiments.6,7
For a comprehensive understanding of the nature of fluorida-tion, it is therefore essential to exclude (or at least to reduce) these
porosity-related errors. Only then the depth dependence of theelement composition as displayed macroscopically by the experi-ment is equal (or at least close) to the microscopic depth profile ofeach particular crystallite. For that reason, we have used sinteredpellets of synthetic HAp with densities close to the crystallo-graphic density (∼90%, cf. section 2.3) to investigate the effect offluoridation for solvents with different pH values. Although this90%-density is comparable to the density of sound enamel,13
there is a decisive difference between such sintered HAp samplesand teeth. In contrast to the microchannels within tooth enamel,the HAp samples exhibit just a distribution of isolated pores. Forthe HAp samples, F is provided by just the “chemistry” of fluo-ridation but not by a long-range percolation of the solvent.
According to the results that are obtained for such compactsamples, there is strong evidence that previous studies reportingdepth-resolved elemental composition are very likely inaccurateby 1 or even 2 orders of magnitude. We assign these differencesto the structural properties of the used samples, which cause theexperimental depth profiles to display a superposition of fluo-ridation and diffusion. Depending on the contribution of diffu-sion, large errors can occur.
Addressing the fundamental problemof a reliable depth scaling,careful attention has also been paid to the depth calibration duringAr ion etching. Thus, in the present study, we will also describe amethod developed to obtain a reliable depth scale in XPS.
2. Experimental Section
2.1. Photoelectron Spectroscopy. In XPS, slow electronswith kinetic energies in the range of a few hundred electron volts(eV) are used for probing a sample. In this rangeofkinetic energies,the electronmean free path within the sample is very small, result-ing in an escape depth of about 1 nm.14 Therefore, XPS provides avery high surface sensitivity for the analysis of elemental composi-tion. It is a perfect tool to investigate elemental depth profiles,provided the sample can be ablated layer-by-layer on the nano-meter scale (for details, cf. chapter 4 in ref 15).
Figure 1. Schematic drawing of “fluoridation” for (a) a compactsample, as a sintered pellet of synthetic HAp with ∼90% densityand (b) for a porous sample, such as a tooth, HAp powder, ornonsintered HAp pellets. The compact structure of synthetic HApand the layered, needle-like crystallite of enamel after applyingan acidic agent are demonstrated by the 2 μm � 2 μm scanningelectron microscope images.
(12) Since all intensity profiles of F can be approximated (at least roughly) by anexponential decay, we refer to the decay length as the penetration depth. For anexponential decay with amplitude A and decay length λ, the overall area of theprofile is given by A 3 λ, equal to a step-like distribution (box) of amplitude A andwidth λ.(13) Dowker, S. E. P.; Elliott, J. C.; Davis, G. R.; Wilson, R. M.; Cloetens, P.
Caries Res. 2004, 38, 514.
(14) Seah, M. P.; Dench, W. A. Surf. Interface Anal. 1979, 1, 2.(15) Briggs, D.; Seah, M. P. Practical Surface Analysis: Auger and X-ray
Photoelectron Spectroscopy, 2nd ed.; Wiley Interscience: Chichester, UK, 1990.
18752 DOI: 10.1021/la102325e Langmuir 2010, 26(24), 18750–18759
Article M€uller et al.
Fora controlled ablationon the nanometer scale,Ar ion etchingrepresents an established tool in surface science.11,15,16 After eachetching step, XPS spectra are recorded, and the characteristic corelevel intensities of the respective elements can be quantitativelyanalyzed to obtain the stoichiometry of the topmost nanometer ofthe sample.11,15 It is therefore of utmost necessity to determine theetching ratewith extreme care. It cannotbe inferred solely fromtheparameters of theAr ion source (accelerationvoltage and emissioncurrent), since the actual numberofAr ions hitting the surface thenremains unchecked (due to instabilities of the ion source, as, e.g.,by variations of gas pressure). Instead, the number ofAr ionsmustbe controlled directly via themeasurement of the deposited chargeon the sample, as shown in Appendix A.1.White light interferom-etry is then applied to reveal the sputter efficiency with nanometerresolution in z-scale (along the surface normal).
2.2. Experimental Setup. The experiments were performedwith anESCALabMkIIphotoelectron spectrometer (byVacuumGenerators, Hastings, England) with an ultra high vacuum inthe range of 10-10 mbar. The XPS spectra were recorded with AlKR radiation (hν=1486.6 eV) in normal emission mode (takeoffangle 0� with respect to the surface normal). The elemental com-position of the samples was determined by extracting intensitiesfrom detail spectra (recorded with 20 eV pass energy) of the F-1s,O-1s, Ca-2p, Ca-2s, P-2p, P-2s, Na-1s (NaF agent), and N-1s(Olaflur agent) core levels. The spectra were normalized to thephoton flux and the corresponding orbital specific photoemissioncross section, as listed in ref 17. For Ca and P, the stoichiometrywas averaged by the values derived from the 2p and 2s core levelintensities.Due to the insulatingnatureofHAp, the samples exhibita strong charging (∼15 eV) that was not compensated by applyingcharge neutralization (as, e.g., by using a flood gun). For the cali-bration of the binding energies, it was not possible to refer to theC-1s binding energy because the C-1s intensity strongly drops withincreasing depth. Instead, the binding energy of the P-2p electronswas used as a reference, because in the structural models, as dis-cussed below, P is only contained in HAp and FAp. In these com-pounds, the P-2p energies just differ by 200meV (HAp: 133.8 eV,18
FAp: 133.6 eV,18 mean value 133.7 eV as P-2p reference). The Arion etching was performed with a IQ-100 ion source (by VacuumScience Instruments, Bad Schwalbach, Germany) with an accel-eration voltage of 4 keV and an emission current 10 mA, resultingin an Ar ion current of∼1 μA at the sample and an etching rate of∼0.12 nm/min. For details of the calibration of the Ar ion etching,see Appendix A.1; for details of the XPS technique, see ref 19.
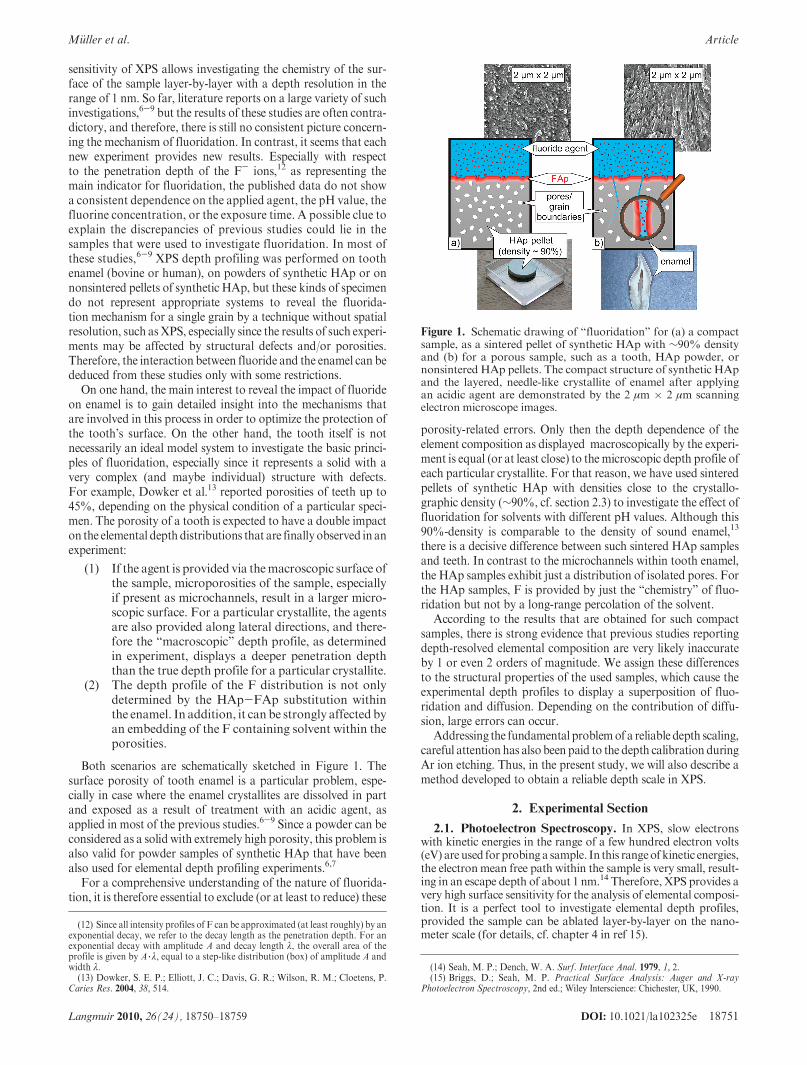
2.3. Preparation of the Samples. The preparation of theHAppellets beganwith several cycles of filtrationof a commercialHAp powder (by Fluka/Sigma Aldrich, Taufkirchen, Germany)in order to remove impurities such as sodium and chlorine. Thestructural quality of the HAp powder was checked by X-raydiffraction (XRD),which exactly displays the diffractionpattern20
of the hexagonal P63/m space group (cf. Figure 2). The powder(∼1 g) was pressed (∼8 tons/cm2) to pellets (Ø ∼ 16 mm, h ∼2.5mm) with green densities of 60-65% (HAp: F=3.156 g/cm3),followed by sintering at about 1150 �C using the temperatureprofile given in ref 21. This procedure finally results in a density(as given by the mass-to-volume ratio of a cylindrical pellet) thatis 90% of the theoretical value (as given by the atomic mass-to-volume ratio of a crystallographic unit cell).
With respect to the chemical composition of the sinteredHAp samples, the XPS data provide a stoichiometry of
Ca:O:P = 5:12.7:3.1, which is very close to the nominal 5:13:3ratio of the Ca5(PO4)3OH compound (note that the H contentcannot be detected in XPS).
For fluoridation, the HAp pellets were exposed to aNaF agent(246 ppm, by Gaba, Basel, Switzerland) and an Olaflur agent(242 ppm, by Gaba) with pH = 6.2 and 4.2, respectively, at37.5(5) �C for 5 min. After fluoridation, the samples were trans-ferred to the vacuum system in the “wet state”, and residues of theagentwere removed by evacuating the entrance lock of the vacuumsystemdown to 10-5-10-6mbar.After fluoridation, an additionalrinsing of the samples by, e.g., distilled water, was not applied inorder to avoid an ablation of any physisorbed species that areformed after or during the application of the agent.
3. Results
Fluoridation ofHAp in the nearly neutralNaFagent and in theacidic Olaflur agent results in strong differences in the elementaldepth profiles of the sample. After the NaF treatment, the depthprofiles display the characteristics of a HAp-FAp substitutionmechanism, while the depth profiles after the Olaflur treatmentindicate strong structural and chemical modifications of thesample.3.1. NaF Agent (246 ppm, pH=6.2). For the sample ex-
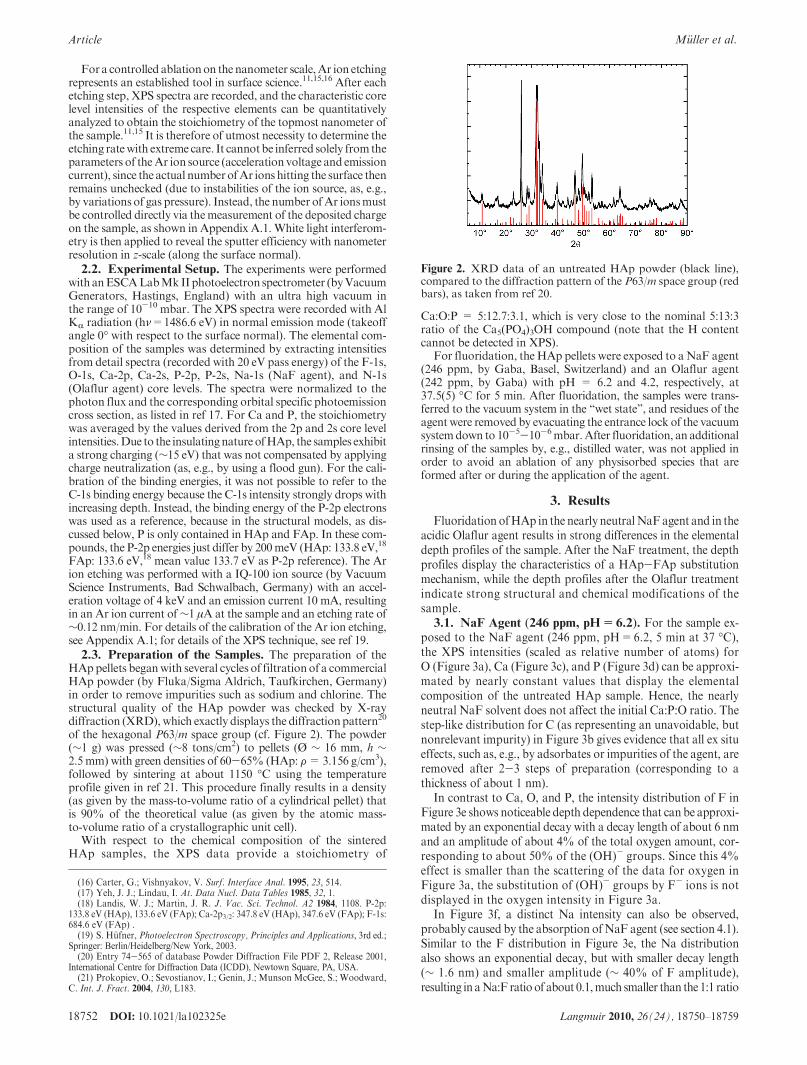
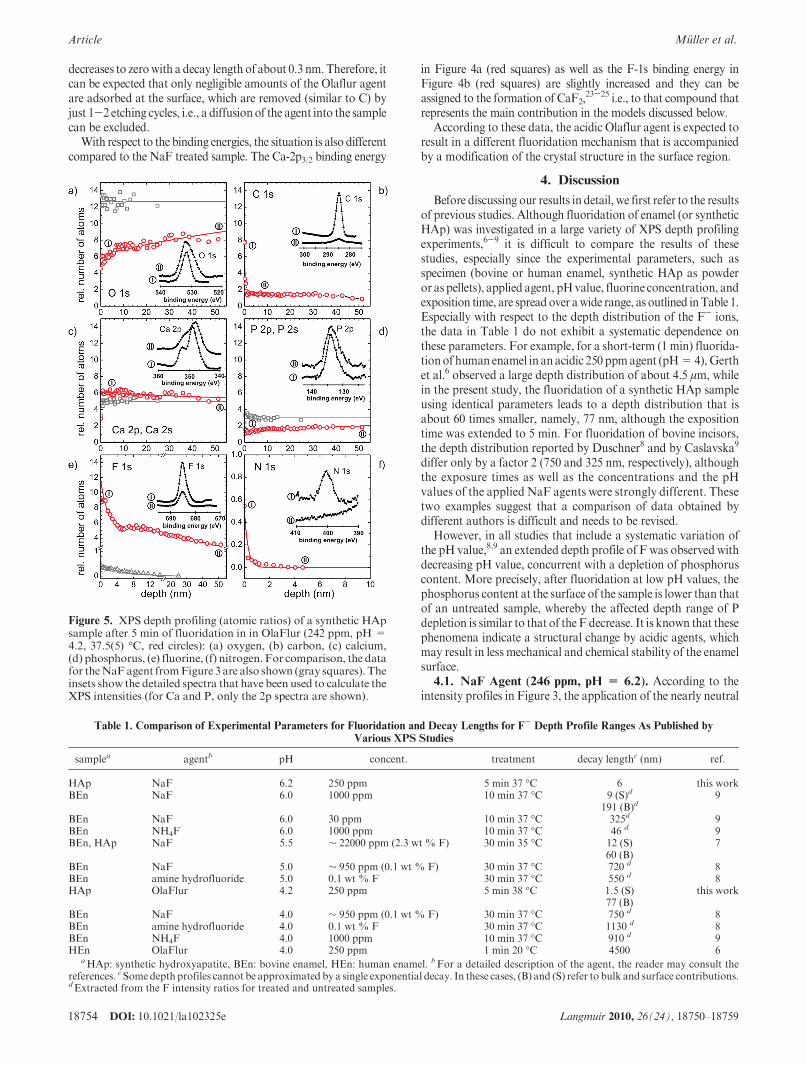
posed to the NaF agent (246 ppm, pH=6.2, 5 min at 37 �C),the XPS intensities (scaled as relative number of atoms) forO (Figure 3a), Ca (Figure 3c), and P (Figure 3d) can be approxi-mated by nearly constant values that display the elementalcomposition of the untreated HAp sample. Hence, the nearlyneutral NaF solvent does not affect the initial Ca:P:O ratio. Thestep-like distribution for C (as representing an unavoidable, butnonrelevant impurity) in Figure 3b gives evidence that all ex situeffects, such as, e.g., by adsorbates or impurities of the agent, areremoved after 2-3 steps of preparation (corresponding to athickness of about 1 nm).
In contrast to Ca, O, and P, the intensity distribution of F inFigure 3e shows noticeable depth dependence that can be approxi-mated by an exponential decay with a decay length of about 6 nmand an amplitude of about 4% of the total oxygen amount, cor-responding to about 50% of the (OH)- groups. Since this 4%effect is smaller than the scattering of the data for oxygen inFigure 3a, the substitution of (OH)- groups by F- ions is notdisplayed in the oxygen intensity in Figure 3a.
In Figure 3f, a distinct Na intensity can also be observed,probably caused by the absorption ofNaF agent (see section 4.1).Similar to the F distribution in Figure 3e, the Na distributionalso shows an exponential decay, but with smaller decay length(∼ 1.6 nm) and smaller amplitude (∼ 40% of F amplitude),resulting in aNa:F ratioof about 0.1,much smaller than the1:1 ratio
Figure 2. XRD data of an untreated HAp powder (black line),compared to the diffraction pattern of the P63/m space group (redbars), as taken from ref 20.
(16) Carter, G.; Vishnyakov, V. Surf. Interface Anal. 1995, 23, 514.(17) Yeh, J. J.; Lindau, I. At. Data Nucl. Data Tables 1985, 32, 1.(18) Landis, W. J.; Martin, J. R. J. Vac. Sci. Technol. A2 1984, 1108. P-2p:
133.8 eV (HAp), 133.6 eV (FAp); Ca-2p3/2: 347.8 eV (HAp), 347.6 eV (FAp); F-1s:684.6 eV (FAp) .(19) S. H€ufner, Photoelectron Spectroscopy, Principles and Applications, 3rd ed.;
Springer: Berlin/Heidelberg/New York, 2003.(20) Entry 74-565 of database Powder Diffraction File PDF 2, Release 2001,
International Centre for Diffraction Data (ICDD), Newtown Square, PA, USA.(21) Prokopiev, O.; Sevostianov, I.; Genin, J.; Munson McGee, S.; Woodward,
C. Int. J. Fract. 2004, 130, L183.
DOI: 10.1021/la102325e 18753Langmuir 2010, 26(24), 18750–18759
M€uller et al. Article
of theNaF solvent. If the F distribution is rescaled by theNa distri-bution (cf. triangles inFigure 3e), the amplitude of theF intensity isslightly reduced to about 40%of the (OH)- groupswhile the decaylength remains unchanged in the range of about 6 nm.
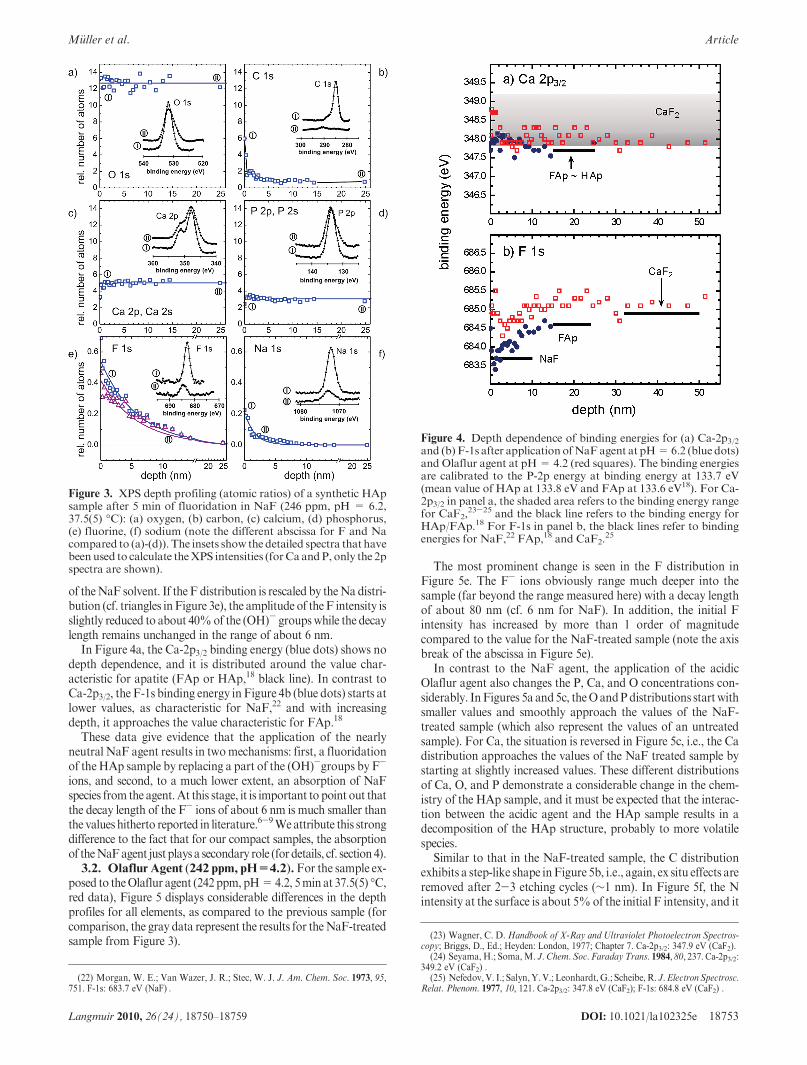
In Figure 4a, the Ca-2p3/2 binding energy (blue dots) shows nodepth dependence, and it is distributed around the value char-acteristic for apatite (FAp or HAp,18 black line). In contrast toCa-2p3/2, the F-1s binding energy in Figure 4b (blue dots) starts atlower values, as characteristic for NaF,22 and with increasingdepth, it approaches the value characteristic for FAp.18
These data give evidence that the application of the nearlyneutral NaF agent results in twomechanisms: first, a fluoridationof theHAp sample by replacing a part of the (OH)-groups by F-
ions, and second, to a much lower extent, an absorption of NaFspecies from the agent.At this stage, it is important to point out thatthe decay length of the F- ions of about 6 nm is much smaller thanthe values hitherto reported in literature.6-9Weattribute this strongdifference to the fact that for our compact samples, the absorptionof theNaFagent justplays a secondary role (fordetails, cf. section4).3.2. Olaflur Agent (242 ppm, pH=4.2).For the sample ex-
posed to theOlaflur agent (242ppm, pH=4.2, 5min at 37.5(5) �C,red data), Figure 5 displays considerable differences in the depthprofiles for all elements, as compared to the previous sample (forcomparison, the gray data represent the results for theNaF-treatedsample from Figure 3).
The most prominent change is seen in the F distribution inFigure 5e. The F- ions obviously range much deeper into thesample (far beyond the range measured here) with a decay lengthof about 80 nm (cf. 6 nm for NaF). In addition, the initial Fintensity has increased by more than 1 order of magnitudecompared to the value for the NaF-treated sample (note the axisbreak of the abscissa in Figure 5e).
In contrast to the NaF agent, the application of the acidicOlaflur agent also changes the P, Ca, and O concentrations con-siderably. InFigures 5a and5c, theOandPdistributions startwithsmaller values and smoothly approach the values of the NaF-treated sample (which also represent the values of an untreatedsample). For Ca, the situation is reversed in Figure 5c, i.e., the Cadistribution approaches the values of the NaF treated sample bystarting at slightly increased values. These different distributionsof Ca, O, and P demonstrate a considerable change in the chem-istry of the HAp sample, and it must be expected that the interac-tion between the acidic agent and the HAp sample results in adecomposition of the HAp structure, probably to more volatilespecies.
Similar to that in the NaF-treated sample, the C distributionexhibits a step-like shape inFigure 5b, i.e., again, ex situ effects areremoved after 2-3 etching cycles (∼1 nm). In Figure 5f, the Nintensity at the surface is about 5%of the initial F intensity, and it
Figure 3. XPS depth profiling (atomic ratios) of a synthetic HApsample after 5 min of fluoridation in NaF (246 ppm, pH = 6.2,37.5(5) �C): (a) oxygen, (b) carbon, (c) calcium, (d) phosphorus,(e) fluorine, (f) sodium (note the different abscissa for F and Nacompared to (a)-(d)). The insets show the detailed spectra that havebeenused to calculate theXPS intensities (forCaandP, only the 2pspectra are shown).
Figure 4. Depth dependence of binding energies for (a) Ca-2p3/2and (b) F-1s after applicationofNaFagent at pH=6.2 (blue dots)and Olaflur agent at pH= 4.2 (red squares). The binding energiesare calibrated to the P-2p energy at binding energy at 133.7 eV(mean value of HAp at 133.8 eV and FAp at 133.6 eV18). For Ca-2p3/2 in panel a, the shaded area refers to the binding energy rangefor CaF2,
23-25 and the black line refers to the binding energy forHAp/FAp.18 For F-1s in panel b, the black lines refer to bindingenergies for NaF,22 FAp,18 and CaF2.
25
(22) Morgan, W. E.; Van Wazer, J. R.; Stec, W. J. J. Am. Chem. Soc. 1973, 95,751. F-1s: 683.7 eV (NaF) .
(23) Wagner, C. D.Handbook of X-Ray and Ultraviolet Photoelectron Spectros-copy; Briggs, D., Ed.; Heyden: London, 1977; Chapter 7. Ca-2p3/2: 347.9 eV (CaF2).
(24) Seyama, H.; Soma,M. J. Chem. Soc. Faraday Trans. 1984, 80, 237. Ca-2p3/2:349.2 eV (CaF2) .
(25) Nefedov,V. I.; Salyn,Y.V.; Leonhardt,G.; Scheibe,R. J.ElectronSpectrosc.Relat. Phenom. 1977, 10, 121. Ca-2p3/2: 347.8 eV (CaF2); F-1s: 684.8 eV (CaF2) .
18754 DOI: 10.1021/la102325e Langmuir 2010, 26(24), 18750–18759
Article M€uller et al.
decreases to zerowith a decay length of about 0.3 nm.Therefore, itcan be expected that only negligible amounts of the Olaflur agentare adsorbed at the surface, which are removed (similar to C) byjust 1-2 etching cycles, i.e., a diffusionof the agent into the samplecan be excluded.
With respect to the binding energies, the situation is also differentcompared to the NaF treated sample. The Ca-2p3/2 binding energy
in Figure 4a (red squares) as well as the F-1s binding energy inFigure 4b (red squares) are slightly increased and they can beassigned to the formation of CaF2,
23-25 i.e., to that compound thatrepresents the main contribution in the models discussed below.
According to these data, the acidic Olaflur agent is expected toresult in a different fluoridation mechanism that is accompaniedby a modification of the crystal structure in the surface region.
4. Discussion
Before discussing our results in detail, we first refer to the resultsof previous studies. Although fluoridation of enamel (or syntheticHAp) was investigated in a large variety of XPS depth profilingexperiments,6-9 it is difficult to compare the results of thesestudies, especially since the experimental parameters, such asspecimen (bovine or human enamel, synthetic HAp as powderor as pellets), applied agent, pHvalue, fluorine concentration, andexposition time, are spreadover awide range, as outlined inTable 1.Especially with respect to the depth distribution of the F- ions,the data in Table 1 do not exhibit a systematic dependence onthese parameters. For example, for a short-term (1 min) fluorida-tionof human enamel in an acidic 250 ppmagent (pH=4),Gerthet al.6 observed a large depth distribution of about 4.5 μm, whilein the present study, the fluoridation of a synthetic HAp sampleusing identical parameters leads to a depth distribution that isabout 60 times smaller, namely, 77 nm, although the expositiontime was extended to 5 min. For fluoridation of bovine incisors,the depth distribution reported by Duschner8 and by Caslavska9
differ only by a factor 2 (750 and 325 nm, respectively), althoughthe exposure times as well as the concentrations and the pHvalues of the applied NaF agents were strongly different. Thesetwo examples suggest that a comparison of data obtained bydifferent authors is difficult and needs to be revised.
However, in all studies that include a systematic variation ofthe pH value,8,9 an extended depth profile of F was observed withdecreasing pH value, concurrent with a depletion of phosphoruscontent. More precisely, after fluoridation at low pH values, thephosphorus content at the surface of the sample is lower than thatof an untreated sample, whereby the affected depth range of Pdepletion is similar to that of the F decrease. It is known that thesephenomena indicate a structural change by acidic agents, whichmay result in less mechanical and chemical stability of the enamelsurface.4.1. NaF Agent (246 ppm, pH = 6.2). According to the
intensity profiles in Figure 3, the application of the nearly neutral
Figure 5. XPS depth profiling (atomic ratios) of a synthetic HApsample after 5 min of fluoridation in in OlaFlur (242 ppm, pH=4.2, 37.5(5) �C, red circles): (a) oxygen, (b) carbon, (c) calcium,(d) phosphorus, (e) fluorine, (f) nitrogen. For comparison, the datafor theNaFagent fromFigure 3 are also shown (gray squares). Theinsets show the detailed spectra that have been used to calculate theXPS intensities (for Ca and P, only the 2p spectra are shown).
Table 1. Comparison of Experimental Parameters for Fluoridation and Decay Lengths for F- Depth Profile Ranges As Published by
Various XPS Studies
samplea agentb pH concent. treatment decay lengthc (nm) ref.
HAp NaF 6.2 250 ppm 5 min 37 �C 6 this workBEn NaF 6.0 1000 ppm 10 min 37 �C 9 (S)d 9
191 (B)d
BEn NaF 6.0 30 ppm 10 min 37 �C 325d 9BEn NH4F 6.0 1000 ppm 10 min 37 �C 46 d 9BEn, HAp NaF 5.5 ∼ 22000 ppm (2.3 wt % F) 30 min 35 �C 12 (S) 7
60 (B)BEn NaF 5.0 ∼ 950 ppm (0.1 wt % F) 30 min 37 �C 720 d 8BEn amine hydrofluoride 5.0 0.1 wt % F 30 min 37 �C 550 d 8HAp OlaFlur 4.2 250 ppm 5 min 38 �C 1.5 (S) this work
77 (B)BEn NaF 4.0 ∼ 950 ppm (0.1 wt % F) 30 min 37 �C 750 d 8BEn amine hydrofluoride 4.0 0.1 wt % F 30 min 37 �C 1130 d 8BEn NH4F 4.0 1000 ppm 10 min 37 �C 910 d 9HEn OlaFlur 4.0 250 ppm 1 min 20 �C 4500 6
aHAp: synthetic hydroxyapatite, BEn: bovine enamel, HEn: human enamel. bFor a detailed description of the agent, the reader may consult thereferences. c Somedepth profiles cannot be approximated by a single exponential decay. In these cases, (B) and (S) refer to bulk and surface contributions.dExtracted from the F intensity ratios for treated and untreated samples.
DOI: 10.1021/la102325e 18755Langmuir 2010, 26(24), 18750–18759
M€uller et al. Article
NaF solution to the HAp sample has no noticeable impact on theelemental distribution of O, Ca, and P. Therefore, it can beexpected that the absorption ofF- ions by theHAp sample indeedresults in a fluoridation mechanism in terms of a pure substitutionof the (OH)- groups by F- ions from the agent, leading to theformation of the isostructural FAp compound. This picture is alsosupported by the Ca-2p3/2 binding energy in Figure 4a (blue),indicating (at least roughly) thatCa is only present as apatite.Withrespect to the parameters for the exponential intensity distributionof F in Figure 3e, the HAp-FAp transformation starts byreplacing 40% of the (OH)- groups by F- ions, and it decreaseswith a decay length of about 6 nm.
This decay length is much smaller (up to 1 to 2 orders of mag-nitude) than the values reported in previous studies (see Table 1)and one has to critically ask where these deviations come from.This question is answered (at least indirectly) by the observationofvery smallNa intensities in Figure 3f. Comparing the total amountof F and Na in Figure 3e,f, the Na:F ratio corresponds only to10% of the Na:F = 1:1 ratio of the agent. Therefore, it can beexpected that after the fluoridation of theHAp sample by theNaFagent, the overall F distribution inFigure 3e displays two differentmechanisms: the fluoridation of the HAp sample as well as theabsorptionofNaF species from the agentwithin the pores or grainboundaries of the sample. However, due to the very small overallamount of Na, the latter process seems to plays a secondary role.With respect to the large differences in the decay lengths of F, weassume that in some of the previous studies the situation isreversed, i.e., the observed F distribution displays the absorptionof Naþ and F- species from the agent rather than the fluoridationof the HAp crystallites. In our experiment, the NaF agent wasapplied to a HAp sample with a density of about 90%, and thesmall portion of isolated pores strongly suppresses diffusion of theagent into the sample. Therefore, the absorption of Na is expectedto be restricted to a small range near the surface, as experimentallyconfirmed by the small decay length of the Na intensity (∼1.6 nm)in Figure 3f. Hence, the observed F distribution in Figure 3emainly displays the fluoridationof the sample via the uptake ofF-
ions during the HAp-FAp transformation. In order to supportthis assumption, we refer to the study of Uchtmann et al.7 thatreports a Na:F ratio of 1:1 for depths up to 300 nm (and beyond)after the fluoridationof syntheticHApbyaNaFagent (cf. Figure 9in ref 7). Compared to our values from Figure 3e,f, these depthsdiffer by nearly 2 orders ofmagnitude, andwe attribute this strongdifference to the different microstructures of the HAp samples.In ref 7, synthetic HAp powder was pressed by 6000 kp/cm2
(∼6 tons/cm2), which is close to the pressure applied in the presentstudy (8 tons/cm2). However, since the authors give no informa-tion on additional sintering, their HAp samples are expected toexhibit densities similar to the green densities of our HAp samplesbefore sintering, i.e., densities in the range of 60%. For such aspecimen, the large amount of pores then favors a percolation ofthe agent, resulting in a depth distribution of F that displays theabsorption of the NaF agent rather than the fluoridation of thecrystallites. This scenario would be also in accordance with theobservation of two different decay lengths for the F distributionsin ref 7 (see alsoTable 1). The small decay lengthprobably displaysthe absorption of F- ions by fluoridation (with the value of 12 nmbeing comparable to our value of 6 nm) while the larger decaylength of about 60 nm then displays F contributions due to theabsorption of the agent.
According to the data in Figure 3e, the application of the NaFagent at pH=6.2 leads to the result that the F- ions penetrate thesample with a decay length of only about 6 nm. This provides aninteresting result for two reasons:
First, this small value (or at least its order of magnitude)seems to be confirmed by a molecular dynamic simulation byde Leeuw26 concerning the F-HAp interaction. In this study, thecalculations predict that F- replaces (OH)- mainly within thetopmost layers of the HAp sample, and no considerable penetra-tion into the bulk is expected. In addition to a partial F--(OH)-
substitution, i.e., FAp/HAp formation by incorporation of F inthe HAp lattice, also an adsorption of F on the HAp surfacemight be expected, i.e., f-HAp formation.27
Second, a decay length of about 6 nm is close to the daily wearof human teeth (∼3 nm per day, assuming an annual wear ofhuman enamel of about 1 μm28). Therefore, a daily application ofnearly neutral NaF agent would result in a fluoridation of exactlythat part of the tooth that is ablated between two applications.At first sight, this looks as an optimal procedure, but on the otherhand, one has to critically ask whether a 6 nm FAp layer indeedacts as a protective layer. This question will be investigated indetail in a subsequent study.4.2. Olaflur Agent (242 ppm, pH=4.2). In contrast to the
application of the nearly neutral NaF agent that just results in afluoridation in terms of a HAp-FAp transition by replacing the(OH)- groups by F- ions, the application of the acidic Olafluragent (pH = 4.2) also considerably changes the observed P, Ca,and O distributions in Figure 5. Therefore, an additional decom-position of the HAp structure has to be expected. This phenom-enon has also been observed in previous studies that report achange in the surface structure to an ablation depth up to severalmicrometers,6,7,9 and especially the recent study by Gerth et al.6
has given detailed insight into such structural modifications. Forthe fluoridation by an acidic agent, the authors proposed a three-layer model whereby the fluoridated enamel is formed by astacking (from outside to inside) of CaF2, Ca(OH)2, Ca5(PO4)3F,and Ca5(PO4)3(OH). For these compounds, depth profiles havebeen presented based on an analysis of the depth dependence ofthe chemical shifts for the Ca-2p3/2 binding energy.6
In this study, we present a different method to extract depthprofiles for CaF2, Ca(OH)2, Ca5(PO4)3F, and Ca5(PO4)3(OH)from XPS data. Apart from an analysis of binding energies, it isalsopossible to refer to the elemental depth profiles of theCa,O, Pand F intensities (as given in Figure 5) to obtain the depth profilesof the compounds.29
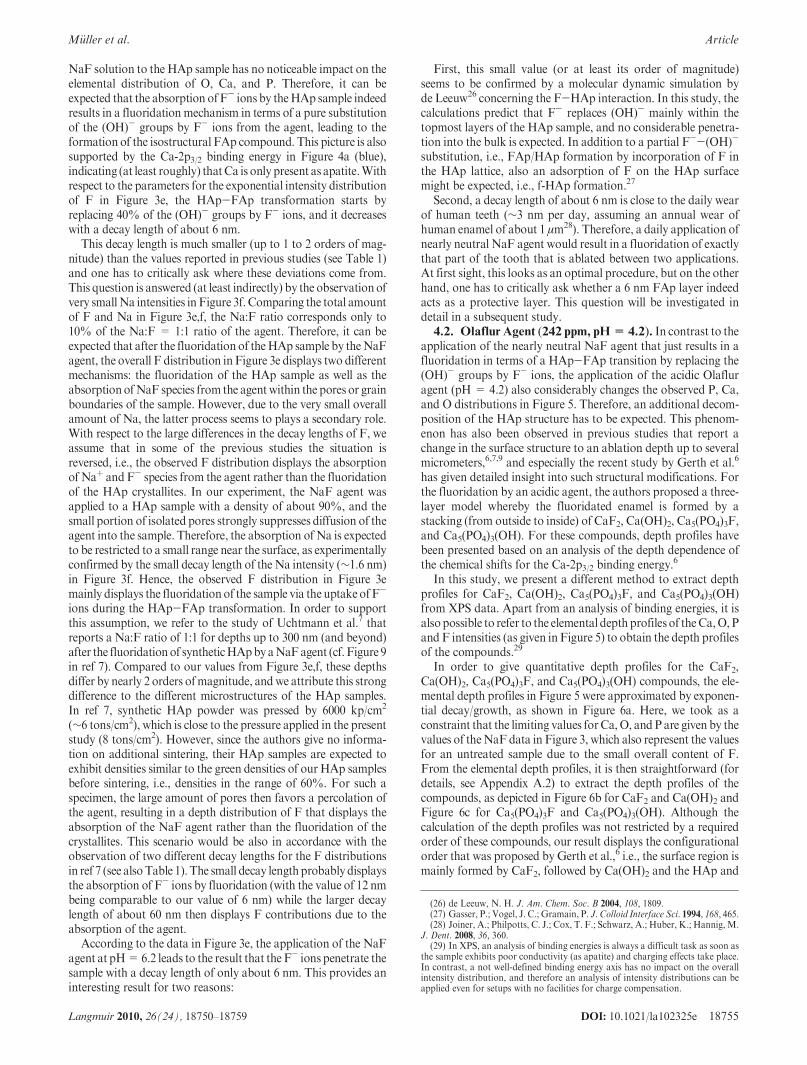
In order to give quantitative depth profiles for the CaF2,Ca(OH)2, Ca5(PO4)3F, and Ca5(PO4)3(OH) compounds, the ele-mental depth profiles in Figure 5 were approximated by exponen-tial decay/growth, as shown in Figure 6a. Here, we took as aconstraint that the limiting values forCa,O, and P are given by thevalues of theNaF data in Figure 3, which also represent the valuesfor an untreated sample due to the small overall content of F.From the elemental depth profiles, it is then straightforward (fordetails, see Appendix A.2) to extract the depth profiles of thecompounds, as depicted in Figure 6b for CaF2 and Ca(OH)2 andFigure 6c for Ca5(PO4)3F and Ca5(PO4)3(OH). Although thecalculation of the depth profiles was not restricted by a requiredorder of these compounds, our result displays the configurationalorder that was proposed by Gerth et al.,6 i.e., the surface region ismainly formed by CaF2, followed by Ca(OH)2 and the HAp and
(26) de Leeuw, N. H. J. Am. Chem. Soc. B 2004, 108, 1809.(27) Gasser, P.; Vogel, J. C.; Gramain, P. J. Colloid Interface Sci. 1994, 168, 465.(28) Joiner, A.; Philpotts, C. J.; Cox, T. F.; Schwarz, A.; Huber, K.; Hannig, M.
J. Dent. 2008, 36, 360.(29) In XPS, an analysis of binding energies is always a difficult task as soon as
the sample exhibits poor conductivity (as apatite) and charging effects take place.In contrast, a not well-defined binding energy axis has no impact on the overallintensity distribution, and therefore an analysis of intensity distributions can beapplied even for setups with no facilities for charge compensation.
18756 DOI: 10.1021/la102325e Langmuir 2010, 26(24), 18750–18759
Article M€uller et al.
FAp apatites. In addition, it is also amazing that the shapes of thedepth profiles for the compounds in Figure 6b,c, as based on ouranalysis of elemental intensity distributions, are very similar tothose given by Gerth et al.,6 as based on an analysis of bindingenergies. However, the results of the intensity analysis show thatthe stoichiometry of the CaF2 “layer” has to be rescaled toCaF1.43-CaF1.57 in order to avoid nonphysical intensity distribu-tions (cf. Appendix A.2).
Therefore, the proposed three-layer model6 seems to be qua-litatively supported by the present results, but on a completelydifferent length scale. In addition, the term “layer” seems to beunfavorable, because the profiles in Figure 6b,c give evidence thatthese “layers” exhibit strong intercalation instead of formingsharp interfaces (therefore, no distinction between FAp, HAp,FHAp, and f-HAp is made). Within this context, the results inFigure 6b,c also show that the FAp and Ca(OH)2 “layers” pro-vide only a small overall contribution after the surface modifica-tion by the fluoride, compared to the large amount of CaF2. Ingeneral, the fluoridated sample is mainly formed by CaF2 and
HAp, where CaF2 switches to HAp at a depth of about 125 nm.This value is in accordance to the results reported by Petzold inref 30, where a similar treatment of the sample (60 s at pH= 4.5)results in the formation of CaF2-like spheres with diametersranging from 120 to 300 nm.
At least from the chemical point of view, the presence ofCa(OH)2 is a crucial point because this compound is expectedto dissolve in the acidic solution. Togetherwith the observation ofan enrichment of Ca at the surface, i.e., CaF1.43-CaF1.57 insteadof CaF2, the results of our intensity analysis in Appendix A.2 canalso be interpreted in terms of the model given by Petzold.30 Inref 30, the “CaF2-like”material contains additional amounts ofOand Pwithin the CaF2 spheres with P andO contribution stronglydepending on the application time of the solvent. For short-termtreatment (with parameters close to our values) there is onlyadditional amount of O within the CaF2 spheres, and contribu-tions from P can be neglected, resulting in a Ca:F ratio of 1:1.23.This ratio is closer to our CaF1.43-CaF1.57 stoichiometry than tothe regular CaF2 stoichiometry used by Gerth et al.6 Therefore,the intensity distribution of Ca(OH)2 may display the contribu-tion of additional O within the CaF2 spheres rather than thepresence of real “Ca(OH)2” (note that H is not detectable byXPS). This seems to also be supported in Figure 6b by the “CaF2”and “Ca(OH)2” distributions that share a common range. Con-sequently, the results of our analysis of XPS intensities data arenot in contrast to theXPS data byGerth et al.,6 but because of thelarge differences in the ablation depths and due to the observationof nonstoichiometricCaFx<2, our data seem to rather support theatomic force micrscopy/energy dispersive X-ray spectroscopy(AFM/EDX) study by Petzold.30
A further modification of the three-layer model by replacingCa(OH)2 by calcium carbonate can be excluded because, for theOlaflur-treated sample, the amount of carbon in Figure 5b is thesame as that in Figure 3b for theNaF-treated sample andmust beassigned to ubiquitous contaminations.
With respect to the modification of crystal structure, the XPSdata in Figures 5 and 6 are in accordance with the results ofpreviousXPS studies,6-9 but similar to the case of theNaF agent,there are strong differences concerning the depth scale, andagain, one has to refer to the effect of porosity to explain suchdiscrepancies.
The XPS data of the present study also fit well with the AFMobservations reported by Petzold,30 especially with regard to thedepth scale of fluoridation and chemical modification of theHApsurface with a high amount of CaF2 after application of an acidicamine fluoride solution for 5 min. In these AFM investigations30
it is shown that the enamel surface is covered by a continuouslayer of spherical CaF2 globules (diameter of 120-300 nm) withinminutes after the treatmentwith 0.1%amine fluoride (pH=4.5),whereas a treatment with a neutral NaF solution caused the for-mation of only a few scattered CaF2 globules. These findingsindicate that the fluoride deposition in form of CaF2 precipitatesis affected by the pHvalue of the fluoride containing solution. Theaccelerated dissolution of the enamel apatite at lower pHprovidesmore free calcium ions, and, thus, it favors the precipitation of theCaF2 globules.
Irrespective of the “right” depth scale, i.e., irrespective ofwhether the F- ions penetrate into the enamel up to 77 nm (ourvalue from Figure 5e) or up to several micrometers (literaturevalues, cf. Table 1), the results also show that just one applicationof an acidic agent results in a penetration depth that approxi-mately amounts to more than the monthly (from our values) or
Figure 6. (a) Approximation of the elemental depth profiles fromFigure 5 as an exponential decay/growth. (b) Depth profiles of thecalcium compounds CaF2 and Ca(OH)2, as calculated by theelemental distributions from panel a, according to the procedurelisted in Appendix A.2 (for R and β, see Appendix). (c) Depthprofiles of the apatites FAP and HAp, as calculated by theelemental distributions from panel a, according to the procedurelisted inAppendixA.2 (for γ-ε, see Appendix). The solid (dashed)lines for the HAp and FAp disributions represent the case ofmaximal (minimal) FAp content (for explanation, see AppendixA.2). The inset in panel b gives a schematic drawing of the depthprofiles for the compounds for the case of maximal FAp content.The saturation of the color represents the relative depth distribu-tion of each compound, and the width of each color bar representsthe maximal relative amount of each compound.
(30) Petzold, M. Caries Res. 2001, 35, 45.
DOI: 10.1021/la102325e 18757Langmuir 2010, 26(24), 18750–18759
M€uller et al. Article
yearly (from literature values) wear of a tooth, thus influencingthe surface of the tooth considerably.
5. Conclusion
With respect to the application of the acidic Olaflur agent atpH = 4.2, the data of the present study are not in contradictionto the three-layer CaF2-Ca(OH)2-FAp/HAp model by Gerthet al.6 However, the quantitative analysis of the data shows thatthe Ca(OH)2 and FAp (even if its amount is assumed to be maxi-mal, see Appendix A.2) contributions only play a secondary role.The surface area is mainly dominated by large amounts of CaF2,and, as a consequence, such a surface may be less stable than theoriginal one containingHAp.Due to the fluoridation at pH=4.2,an extended “layer” of caries-protecting F- ions is achieved, butaccording to Figure 6 as CaF2 rather than as a protecting FAplayer. According to the AFM study by Petzold, CaF2 is distrib-uted as a layer of densely packed spheres with diameters rangingfrom 120 to 300 nm.30
Since the F ions have only a small penetration depth, F ionshave to be continuously administered (as, e.g., by the regularuse of a neutral fluoridated toothpaste or mouthrinse) sincethe protecting FAp layer is only as thick as the daily wear ofenamel.28
In principle, fluoride can induce cariostatic effects by (1)reducing enamel solubility when incorporated into the mineralstructure; (2) by fostering the remineralization of incipient enamellesions and the deposition of fluoridated phases (within dentalplaque), which provide a source of mineral ions (Ca, P, F) underacidic conditions; and (3) by reducing the net rate of transport ofmatter out of the enamel surface, under acidic conditions, byinducing the reprecipitation of fluoridated HAp phases withinenamel.On the basis of ananalysis of clinical and laboratorydata,it was already concluded two decades ago by Margolis andMoreno31 that the benefits provided by fluoridation result, to alarge degree, from topical effects. Thus, clinical procedures arerecommended that establish and maintain low levels of freefluoride in plaque fluid.32 This will require frequent exposure totopical fluorides.31
6. Summary
The results of the present study on the fluoridation of syntheticHAp samples qualitatively match the results reported in litera-ture. First, the fluoridation by a nearly neutral agent leads to asubstitution of the (OH)- groupby theF- ionswith no changes inthe chemistry and structure of the initial compound, i.e., a partialtransition from HAp to the isostructural FAp takes place(FHAp). Second, the fluoridation by an acidic agent results inconsiderable changes in the surface structure of HAp by theformation of other compounds, such as Ca(OH)2, FAp, andCaF2, as previously proposed byGerth et al.6 or by the formationof a “CaF2material”, i.e., CaF2with additional P andO included,as proposed by Petzold.30 Qualitatively, the results of the presentstudy are not in contrast to the three-layer model from Gerth etal.,6 but the suggested contribution ofCa(OH)2 could also displaythe O impurities within the CaF2 spheres, as observed by Petzoldin ref 30. The lattermodel seems to be favored by the results of thepresent study since the presence of a “CaF2-like” material on theHAp surface (CaF1.43-1.57) as well as the same depth scale for thedistribution of this material is observed.
However, quantitatively, the results of the present investigationare in contrast to previous XPS studies: First, the depth profilesof F are extended in a considerably lower range (1-2 ordersof magnitude!) compared to the range reported by other authors,although the fluoridationwas performed under similar conditions(cf. Table 1). We attribute these large deviations in depth profilesto the different microstructure of the samples. In principle, thedepth profiles, as displayed by a macroscopic sample, must beregarded as a superposition of fluoridation of single crystallitesand diffusion of the agent into the pores of the sample. In the caseof a synthetic HAp pellet with a density of about 90%, as used inthe present study, the latter process is strongly suppressed andthe depth profiles, as displayed by the macroscopic sample, areclose to the depth profiles of the single crystallites. For teeth (andalso for HAp powders or not sinteredHAp pellets), the impact ofdiffusion depends on the porosity of the actual sample, andtherefore the depth profiles of the macroscopically probed sam-ples can display the diffusion rather than the fluoridation of thesingle crystallites, as observed by the large ablation depths for F(and also Na) in previous studies.6-9
However, in the case of a nearly neutral agent, our low valuesof the penetration depth are in accordance with dynamicalsimulations,26 while in the case of the acidic agent, our valuesare in accordance with AFM data.30
Finally, one has to ask of the protective power of such ultrathinFAp layers: Is it possible to save your dentition by “the skin ofyour teeth”? This question will be addressed in a future study.
Acknowledgment. This work was partly supported by theDeutsche Forschungsgemeinschaft within the CollaborativeResearch Centre 277 “Grenzfl€achenbestimmte Materialien”,the Priority Programme SPP 1164 “Nano- & Microfluidics”,and by Saarland Ministry of Finances special research funds.The authors thank H. P. Beck, R. Haberkorn, H. Kohlmann, U.Hartmann, andA.English for providing their facilities and know-how for the preparation of the HAp pellets.
Appendix
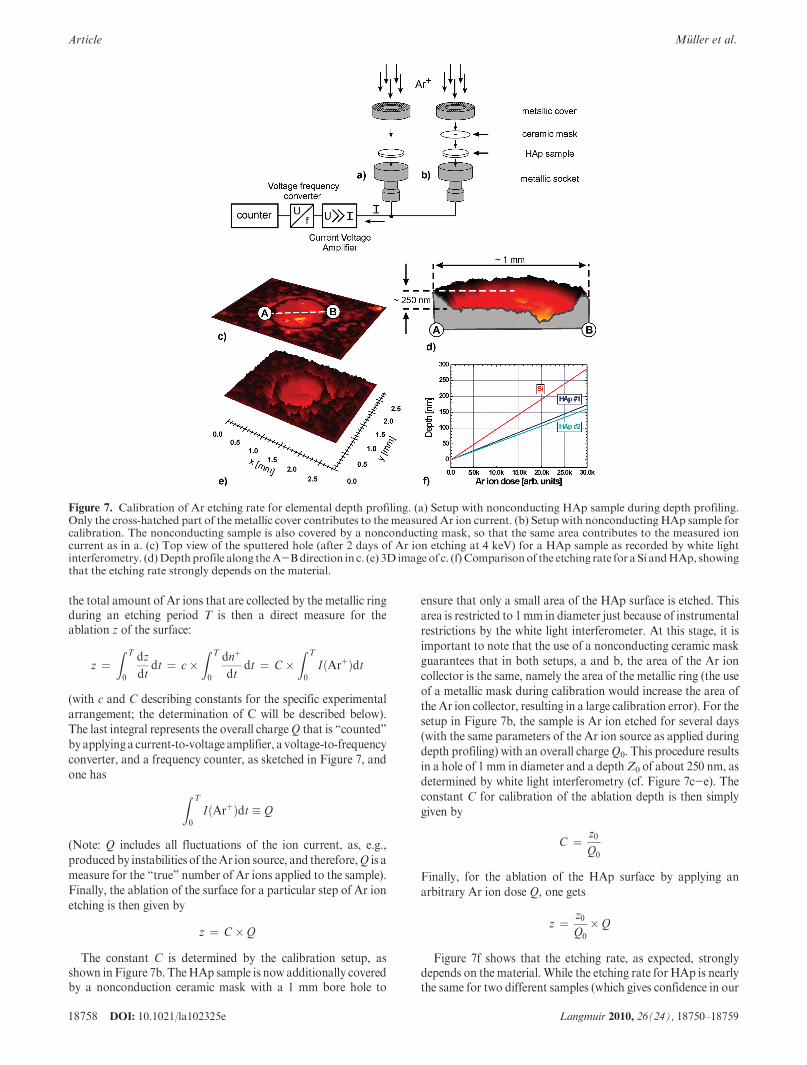
A.1. Calibration of the Ar Ion Etching Dose. The infor-mation needed for a precise depth calibration is the sputterefficiency (etching rate). Therefore, the achieved etching depthhas to be measured as a function of deposited Ar ion dose onthe sample. The latter can be quantified by measuring the(time-integrated) current that flows off the sample, while theresulting etching depth can be determined by white lightinterferometry (in this study, a New View 200 3D ImagingSurface Structure Analyzer by Zygo Corporation, Middlefield,CT, was used).
Figure 7 depicts a schematic drawing of the setup as used forthe calibration of the etching rate.Figure 7a shows the setupof theHAp sample as used during the depth profiling experiments. TheHAp sample is covered by a metallic ring that acts as an Ar ioncollector, i.e., the Ar ion current (a few microamperes) that flowsoff this metallic ring is an instantaneous real-time measure forthe relative number of Ar ions that hit the sample within eachparticular period of time:
IðArþÞ∼ dnþ
dt
Since the rate ofAr ion deposition is also a directmeasure of theetching rate
dz
dt∼dnþ
dt
(31) Margolis, H. C.; Moreno, E. C. J. Dent. Res. 1990, 69, 606.(32) Fejerskov, O. Fluorides in Dentistry; Munksgaard International Publishers:
Copenhagen, 1994.
18758 DOI: 10.1021/la102325e Langmuir 2010, 26(24), 18750–18759
Article M€uller et al.
the total amount of Ar ions that are collected by the metallic ringduring an etching period T is then a direct measure for theablation z of the surface:
z ¼Z T
0
dz
dtdt ¼ c�
Z T
0
dnþ
dtdt ¼ C �
Z T
0
IðArþÞdt
(with c and C describing constants for the specific experimentalarrangement; the determination of C will be described below).The last integral represents the overall chargeQ that is “counted”byapplying a current-to-voltage amplifier, a voltage-to-frequencyconverter, and a frequency counter, as sketched in Figure 7, andone has
Z T
0
IðArþÞdt � Q
(Note: Q includes all fluctuations of the ion current, as, e.g.,producedby instabilities of theAr ion source, and therefore,Q is ameasure for the “true” number of Ar ions applied to the sample).Finally, the ablation of the surface for a particular step of Ar ionetching is then given by
z ¼ C � Q
The constant C is determined by the calibration setup, asshown in Figure 7b. TheHAp sample is now additionally coveredby a nonconduction ceramic mask with a 1 mm bore hole to
ensure that only a small area of the HAp surface is etched. Thisarea is restricted to 1mm in diameter just because of instrumentalrestrictions by the white light interferometer. At this stage, it isimportant to note that the use of a nonconducting ceramic maskguarantees that in both setups, a and b, the area of the Ar ioncollector is the same, namely the area of the metallic ring (the useof a metallic mask during calibration would increase the area ofthe Ar ion collector, resulting in a large calibration error). For thesetup in Figure 7b, the sample is Ar ion etched for several days(with the same parameters of the Ar ion source as applied duringdepth profiling) with an overall chargeQ0. This procedure resultsin a hole of 1 mm in diameter and a depthZ0 of about 250 nm, asdetermined by white light interferometry (cf. Figure 7c-e). Theconstant C for calibration of the ablation depth is then simplygiven by
C ¼ z0Q0
Finally, for the ablation of the HAp surface by applying anarbitrary Ar ion dose Q, one gets
z ¼ z0Q0
� Q
Figure 7f shows that the etching rate, as expected, stronglydepends on the material. While the etching rate for HAp is nearlythe same for two different samples (which gives confidence in our
Figure 7. Calibration of Ar etching rate for elemental depth profiling. (a) Setup with nonconducting HAp sample during depth profiling.Only the cross-hatched part of the metallic cover contributes to the measured Ar ion current. (b) Setup with nonconducting HAp sample forcalibration. The nonconducting sample is also covered by a nonconducting mask, so that the same area contributes to the measured ioncurrent as in a. (c) Top view of the sputtered hole (after 2 days of Ar ion etching at 4 keV) for a HAp sample as recorded by white lightinterferometry. (d)Depthprofile along theA-Bdirection in c. (e) 3D imageof c. (f) Comparisonof the etching rate for a Si andHAp, showingthat the etching rate strongly depends on the material.
DOI: 10.1021/la102325e 18759Langmuir 2010, 26(24), 18750–18759
M€uller et al. Article
method), it strongly deviates from that of a Siwafer. Therefore, anelemental depth profiling by combined XPS/Ar ion etchingexperiments should always be accompanied by a calibration ofthe etching rate for the particular sample. Other procedures, as,e.g., referring to manufacturers0 data sheets, would result in largeerror bars.A.2. Calculation of Ca(OH)2, CaF2, FAp, and HAp
Distributions. If the depth distributions for the compoundsCaF2, Ca(OH)2, Ca5(PO4)3(OH), and Ca5(PO4)3F are describedby R(z), β(z), γ(z), and δ(z), respectively, the relation between theexperimental distribution of the elements nca(z), nO(z), nP(z), andnF(z) and the coefficients R(z), β(z), γ(z), and δ(z) is given by thelinear equation
nCa ¼ 1 3 Rþ 1 3βþ 5 3 γþ 5 3 δnO
¼ 0 3 Rþ 2 3βþ 13 3 γþ 12 3 δ
nP¼ 0 3 Rþ 0 3βþ 3 3 γþ 3 3 δ
nF¼ 2 3 Rþ 0 3βþ 0 3 γþ 1 3 δ
ornCanOnPnF
0BB@
1CCA ¼
1 1 5 50 2 13 120 0 3 32 0 0 1
0BB@
1CCA 3
Rβγδ
0BB@
1CCA
Since the rank of the coefficient matrix is smaller than 4, there isno unambiguous solution. In order to find a solution, we set
ε � γþδ
and, within a first approximation, we introduce a small error inthe second line by replacing
nO ¼ 0 3 Rþ 2 3βþ 13 3 γþ 12 3 δ
with
nO ¼ 0 3 Rþ 2 3 βþ 12:5 3 γþ 12:5 3 δ
Then, the equation
nCanOnP
0@
1A ¼
1 1 50 2 12:50 0 3
0@
1A 3
Rβε
0@
1A
results in the distributions R(z) for CaF2, β(z) for Ca(OH)2, andε(z) for the superposition of Ca5(PO4)3(OH) and Ca5(OP4)3F via
γðzÞþδðzÞ ¼ εðzÞ ¼ 1
3 3nPðzÞ
βðzÞ ¼ 1
2 3nOðzÞ- 25
12 3nPðzÞ
RðzÞ ¼ nCaðzÞþ 5
12 3nPðzÞ- 1
2 3nOðzÞ
The distribution δ(z) for FAp can be extracted from thecalculated distribution R(z) for CaF2 and the experimental Fdistribution nF(z). Taking the regular stoichiometry for CaF2, theequation
nFðzÞ ¼ 2 3 RðzÞþδðzÞwould result in negative values for theFApdistribution δ(z).Withthe constraints that δ(z) must not be negative and that δ(z) mustnot exceed the overall FAp/HApdistributionγ(z), one gets for themaximal amount of FAp
nFðzÞ ¼ 1:43 3 RðzÞþδðzÞand for the minimal amount of FAp
nFðzÞ ¼ 1:57 3 RðzÞþδðzÞi.e., the surface is covered byaCaFx-likematerial (with 1.43exe1.57) rather than by CaF2.