Embed Size (px)
Citation preview

ELEMENTAL AND ISOTOPIC ANALYSIS BY D-SECONDARY ION MASS SPECTROMETRY (D-SIMS)
Nathalie VALLE ([email protected])
Brahime EL ADIB – Esther LENTZEN
Outline
1. D-SIMS: an overview
Principle of the technique
Types of measurements
Facilities available at LIST
2. Main characteristics of the technique through a selection of
examples

Principle of the technique
Primary ions
>> 1015 at/cm2 (dynamic regime)< 1013 at/cm2 (static regime)
Chemical analysis
(elemental and isotopic)
Sample
Mass spectrometerSeparation by mass to charge ratio
(m/z)
Ejected particles
Secondary ions
positive ions
negative ions

Different types of measurements
1E+01
1E+02
1E+03
1E+04
1E+05
1E+06
1E+07
1E+08
1E+09
1E+10
0 10 20 30 40 50 60 70 80 90 100 110 120 130 140 150
amu
inte
nsiti
es c
/s
133Cs
23Na
24Mg
40Ca
39K
27Al
63Cu65Cu
66Zn
64Zn
1H
27Al2
Monatomic ions
Polyatomic ions
Isotopes
Mass spectrum : Secondary ion intensities = f (a.m.u)
Different types of measurements
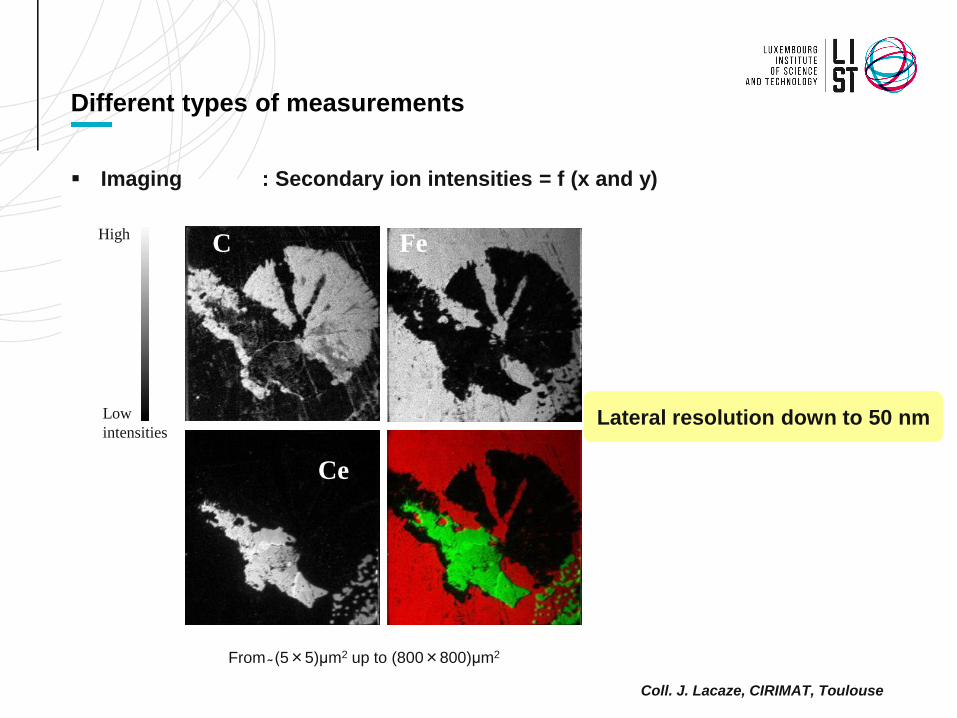
Imaging : Secondary ion intensities = f (x and y)
From ̴ (5×5)μm2 up to (800×800)μm2
C
Ce
FeHigh
Low
intensitiesLateral resolution down to 50 nm
Coll. J. Lacaze, CIRIMAT, Toulouse

Depth profiling : Secondary ion intensities = f (sputtering time)
Different types of measurements
1E+00
1E+02
1E+04
1E+06
1E+08
0 500
Se
co
nd
ary
io
n In
ten
sitie
s
[co
un
ts/s
]
Sputtering time [s]
Si
B
Raw data
1E+13
1E+14
1E+15
1E+16
1E+17
1E+18
0.0 1.0 2.0 3.0
Depth [µm]
Co
nce
ntr
ation
B [
ato
m/c
m3]
B
Depth resolution down to 1 nm
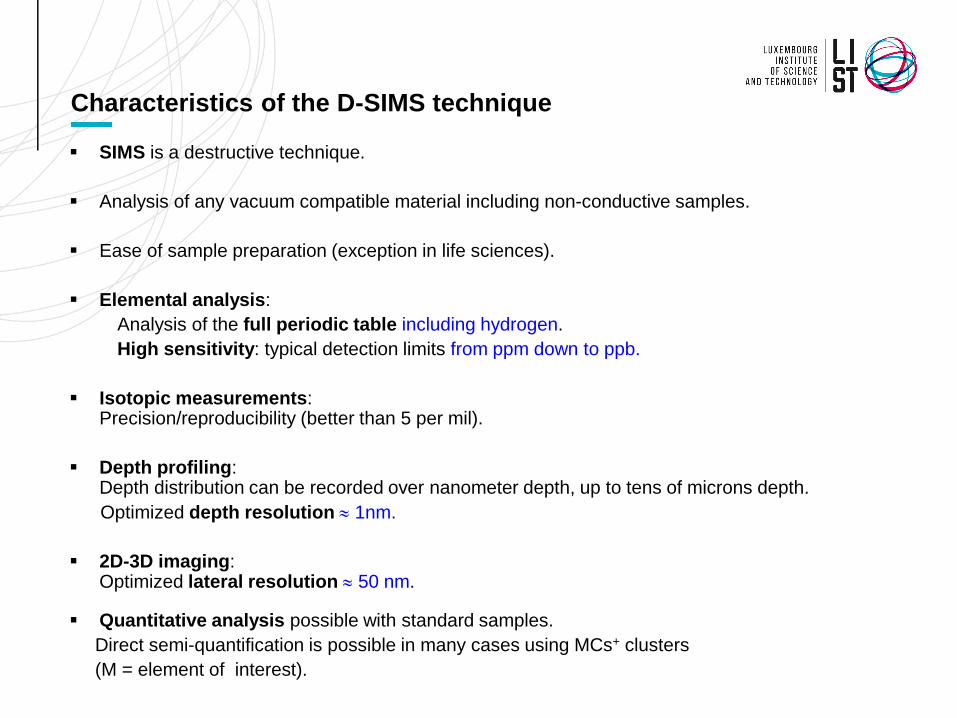
Characteristics of the D-SIMS technique
SIMS is a destructive technique.
Analysis of any vacuum compatible material including non-conductive samples.
Ease of sample preparation (exception in life sciences).
Elemental analysis:
Analysis of the full periodic table including hydrogen.
High sensitivity: typical detection limits from ppm down to ppb.
Isotopic measurements:Precision/reproducibility (better than 5 per mil).
Depth profiling:Depth distribution can be recorded over nanometer depth, up to tens of microns depth.
Optimized depth resolution 1nm.
2D-3D imaging:Optimized lateral resolution 50 nm.
Quantitative analysis possible with standard samples.
Direct semi-quantification is possible in many cases using MCs+ clusters
(M = element of interest).
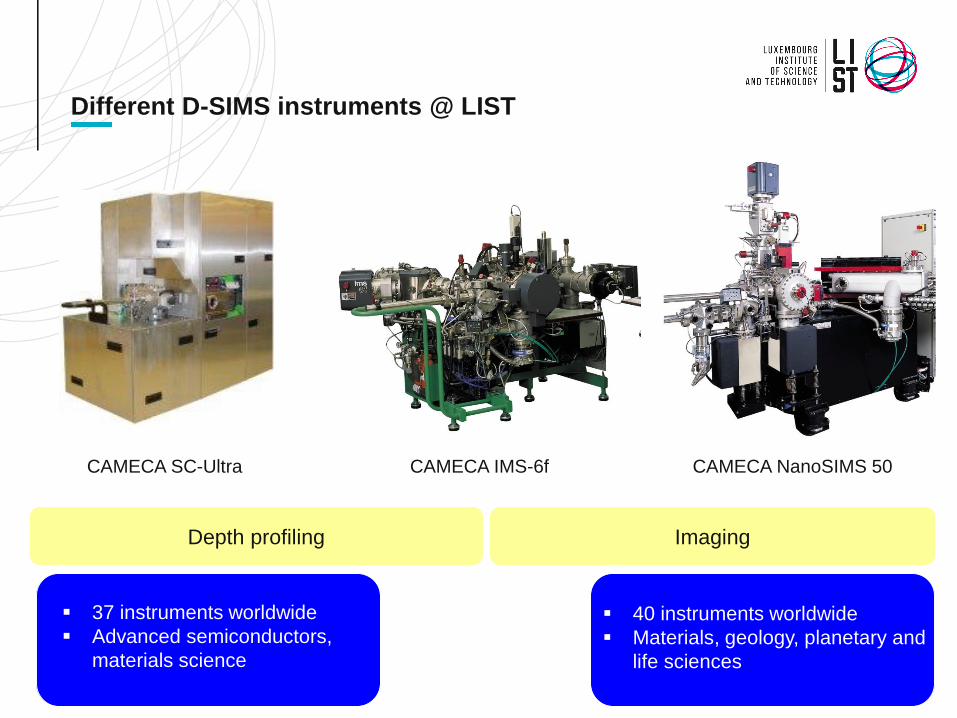
Different D-SIMS instruments @ LIST
CAMECA IMS-6f CAMECA NanoSIMS 50
Imaging
CAMECA SC-Ultra
Depth profiling
37 instruments worldwide
Advanced semiconductors,
materials science
40 instruments worldwide
Materials, geology, planetary and
life sciences

Depth profiling: detection limit
Detection of trace elements and quantification of dopants with high depth resolution in semi-conductors
III-V compounds analysis
Examples of detection limits in silicon.
Element Bombardment Detection limit
(ppm)
Impact energy
(keV)
B O2+ 0.1 0.5
0.001 10
As Cs+ 0.1 0.5
0.04 13
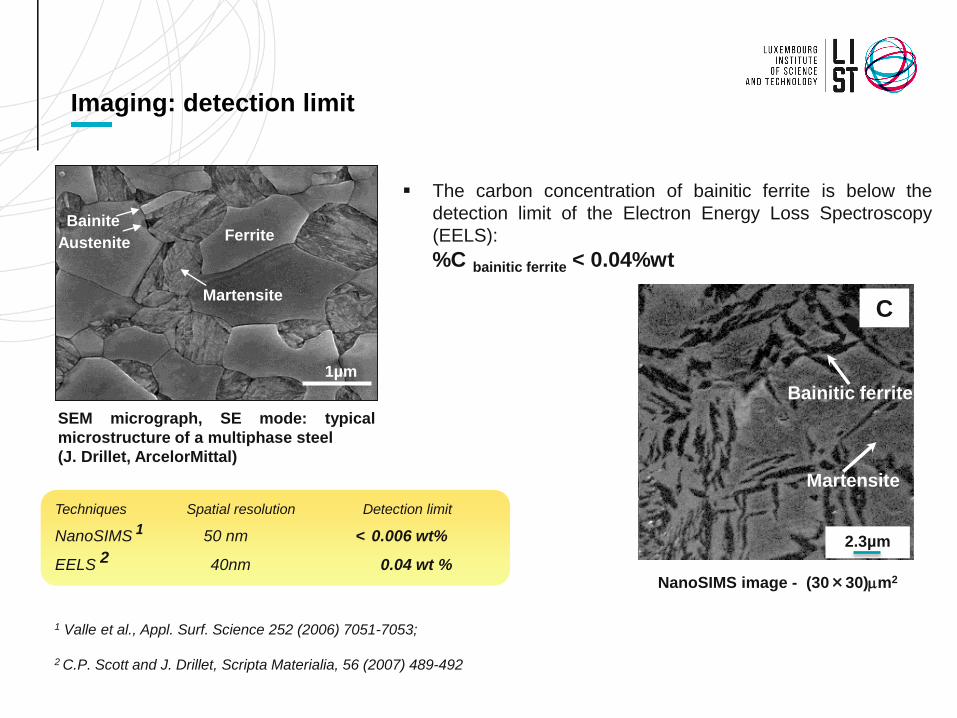
Imaging: detection limit
1µm
Martensite
FerriteBainite
Austenite
SEM micrograph, SE mode: typical
microstructure of a multiphase steel
(J. Drillet, ArcelorMittal)
1 Valle et al., Appl. Surf. Science 252 (2006) 7051-7053;
2 C.P. Scott and J. Drillet, Scripta Materialia, 56 (2007) 489-492
Techniques Spatial resolution Detection limit
NanoSIMS 1 50 nm < 0.006 wt%
EELS 2 40nm 0.04 wt %
Bainitic ferrite
Martensite
NanoSIMS image - (30×30)mm2
The carbon concentration of bainitic ferrite is below the
detection limit of the Electron Energy Loss Spectroscopy
(EELS):
%C bainitic ferrite < 0.04%wt
C
2.3µm

SIMS quantification
01
2
3
45
6
7
8
9Study of nitrogen (n-type dopant) incorporation during SiC growth by
physical vapour transport
Electron affinity: N (0 eV) / CN- (3.86 eV) analysis of nitrogen as CN-
Quantification possible by using implanted standard sample (RSF) – Normalisation to Si
N. Tsavdaris et al. Materials Science Forum, 2015.
Coll. D. Chaussende, LMGP, Grenoble
RSF (CN/Si)
Relative Sensitivity Factor
Implanted standard sample: N, 180keV, 9.5×1012 cm-2
0,00E+00
5,00E-04
1,00E-03
1,50E-03
2,00E-03
2,50E-03
3,00E-03
3,50E-03
4,00E-03
0 1 2 3 4 5 6 7 8 9
Inte
nsi
tés
CN
no
rma
lisé
es
(c/
s)
Numéro de la bande de dopage
#SiC-4
germe
Bande non dopéeUndoped stripe
StripeNorm
aliz
ed
CN
-in
ten
sitie
s

Depth profiling: quantification at high depth resolution
C
Si
N
H
Cr
0 2 4 6
Depth, nm
1e20
1e21
1e22
1e23
Co
nc, a
tom
/cm
3
Cr/ epitaxial graphene / SiC
Impact energy: 150 eV
Graphene layer: ~ 1 nm
N doping < 1 at. %
H ~ 15-17 at. %
A. Merkulov et al., Poster @ SIMS Europe 2014, Münster
Michalowski et al. Appl. Phys. Lett. 109, 011904 (2016)
W. Strupinski et al. Nano Lett. 2011, 11, 1786–1791.
Characterisation of graphene

.
Elemental mapping at high lateral resolution
• TiO2 NPs in skin cells
Presence of nanoparticles in TiO2
sun cream…
Overlay CN & TiO
Nucleus
CN
10 µm 10 µm
TiO
Cytoplasm
Presence of Ti in cytoplasm only
Detection of nanoparticles in skin cells
V. Lopes et al., J. Nanobiotechnol (2016) 14:22

Quantification of light elements
600
Heat treatment
T2: fast cooling
0 3 10 30
T1
1µm
High
Low
intensities
0s 30s 600s
γ γ
B precipitates
B solid solution
B segregation
at dislocation
Development of high strength B-added steels for automotive industry The addition of B (~ 20 ppm) increases the hardenability of steels.
0
2
4
6
8
10
12
14
16
18
20
1 2 3 4 5 6
Co
nce
ntr
atio
n B
(p
pm
)
Time (s)
Solid solution
0 3 10 30 120 600
Ongoing G. Da Rosa ‘s thesis (J. Drillet, K. Hoummada, N. Valle, P. Maugis, V. Hebert)
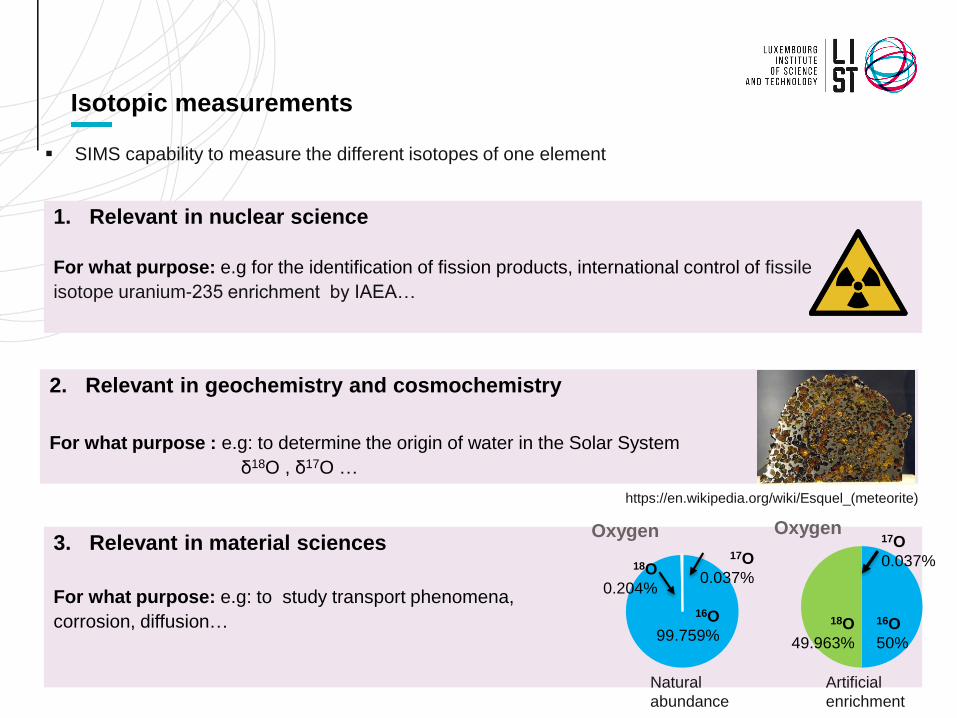
Isotopic measurements
1. Relevant in nuclear science
For what purpose: e.g for the identification of fission products, international control of fissile
isotope uranium-235 enrichment by IAEA…
SIMS capability to measure the different isotopes of one element
2. Relevant in geochemistry and cosmochemistry
For what purpose : e.g: to determine the origin of water in the Solar System
δ18O , δ17O …
3. Relevant in material sciences
For what purpose: e.g: to study transport phenomena,
corrosion, diffusion…
Oxygen
16O
99.759%
18O
0.204%
17O
0.037%
Oxygen
18O
49.963%
16O
50%
17O
0.037%
Natural
abundance
Artificial
enrichment
https://en.wikipedia.org/wiki/Esquel_(meteorite)

Isotopic measurements
An innovative methodology to study glass alteration mechanisms and kinetics (coll. A. Verney-Carron, M. Saheb)
Pallo
t-F
rossard
(2006)
Troyes Cathedral (XIIIth c.)
tDe
2 DH2O
e: alteration thickness (m)
D : diffusion coefficient (m²/s)
t: time of exposure (s)
Altered layer
Medieval stained
glass
18O/16O
0.002
0.005
× 2.5
Drizzle

Isotopic measurements: O and H
Fissure 1Fissure 2
Fissure 3
Origin of cracks ?
Study of the propagation of cracks in Ni-based alloys during stress corrosion cracking
Field of view: (50 x 50) mm2
High
intensities
Low
intensities
P. Laghoutaris’s thesis (CEA)
U-bend test
18O/16O
CrO
D/H
Analysed
area
18O, 2D

3D imaging
16O
Red Oxygen
Green Carbon
Presence of
submicron domain
structures
Analyzed area : (20 x 20) mm2, sputtering rate: 1nm/s
Characterisation of thin films of immiscible polymer systems
PS + PMMA
O
Audinot et al.: Applied Surface Science,
2004, Surf. Interface Anal., 2005Si
PS
Si substrate

Depth profiling in small area 1/2
http://www.gecco.tu-bs.de/pubs.html
http://www.compoundsemiconductor.net/article/95856-whats-the-best-business-model-for-nanowire-leds.html
3D GaN pillars
High
Low
intensities
50 µm
Dopant
Ga
GaN microrods

Depth profiling in small area 2/2
High
Low
intensities 12 µm
Ga
Depth profile in
small area
No
rma
lized
in
ten
sit
ies
Depth (arbitrary unit)
Dopant
Ga
Dopant
Co
nc
ne
ntr
ati
on
of
do
pan
t (u
.a)
Depth (arbitrary unit)
Determination of
different dopant
concentrations
(calibration with a
standard sample)