Embed Size (px)
Citation preview

Electrophysiology

Electroencephalography
• Electrical potential is usually measured at many sites on the head surface
• More is sometimes better

Magnetoencephalography
• MEG systems use many sensors to accomplish source analysis
• MEG and EEG are complementary because they are sensitive to orthogonal current flows
• MEG is very expensive

EEG/MEG
• EEG changes with various states and in response to stimuli

EEG/MEG• Any complex waveform can be decomposed into
component frequencies– E.g.
• White light decomposes into the visible spectrum• Musical chords decompose into individual notes

EEG/MEG
• EEG is characterized by various patterns of oscillations
• These oscillations superpose in the raw data
4 Hz
8 Hz
15 Hz
21 Hz
4 Hz + 8 Hz + 15 Hz + 21 Hz =

How can we visualize these oscillations?
• The amount of energy at any frequency is expressed as % power change relative to pre-stimulus baseline
• Power can change over time
Freq
uenc
y
Time0
(onset)+200 +400
4 Hz
8 Hz
16 Hz
24 Hz
48 Hz
% changeFromPre-stimulus
+600

Where in the brain are these oscillations coming from?
• We can select and collapse any time/frequency window and plot relative power across all sensors
Win Lose

Where in the brain are these oscillations coming from?
• Can we do better than 2D plots on a flattened head?
• we (often) want to know what cortical structures might have generated the signal of interest
• One approach to finding those signal sources is Beamformer

Beamforming• Beamforming is a signal processing technique used in a variety of
applications:– Sonar– Radar– Radio telescopes– Cellular transmision

Beamformer
• Applying the Beamformer approach yields EEG or MEG data with fMRI-like imaging
L
R

The Event-Related Potential (ERP)
• Embedded in the EEG signal is the small electrical response due to specific events such as stimulus or task onsets, motor actions, etc.

The Event-Related Potential (ERP)
• Embedded in the EEG signal is the small electrical response due to specific events such as stimulus or task onsets, motor actions, etc.
• Averaging all such events together isolates this event-related potential

The Event-Related Potential (ERP)
• We have an ERP waveform for every electrode

The Event-Related Potential (ERP)
• We have an ERP waveform for every electrode
• Sometimes that isn’t very useful

The Event-Related Potential (ERP)
• We have an ERP waveform for every electrode
• Sometimes that isn’t very useful
• Sometimes we want to know the overall pattern of potentials across the head surface– isopotential map

The Event-Related Potential (ERP)
• We have an ERP waveform for every electrode
• Sometimes that isn’t very useful
• Sometimes we want to know the overall pattern of potentials across the head surface– isopotential map
Sometimes that isn’t very useful - we want to know the generator source in 3D

Brain Electrical Source Analysis
• Given this pattern on the scalp, can you guess where the current generator was?

Brain Electrical Source Analysis
• Given this pattern on the scalp, can you guess where the current generator was?

Brain Electrical Source Analysis
• Source Analysis models neural activity as one or more equivalent current dipoles inside a head-shaped volume with some set of electrical characteristics

Brain Electrical Source Analysis
This is most likely location of dipole
Project “Forward Solution”
Compare to actual data

Brain Electrical Source Analysis
• EEG data can now be coregistered with high-resolution MRI image

Intracranial and “single” Unit
• Single or multiple electrodes are inserted into the brain
• “chronic” implant may be left in place for long periods

Intracranial and “single” Unit
• Single electrodes may pick up action potentials from a single cell
• An electrode may pick up the combined activity from several nearby cells– spike-sorting attempts to
isolate individual cells
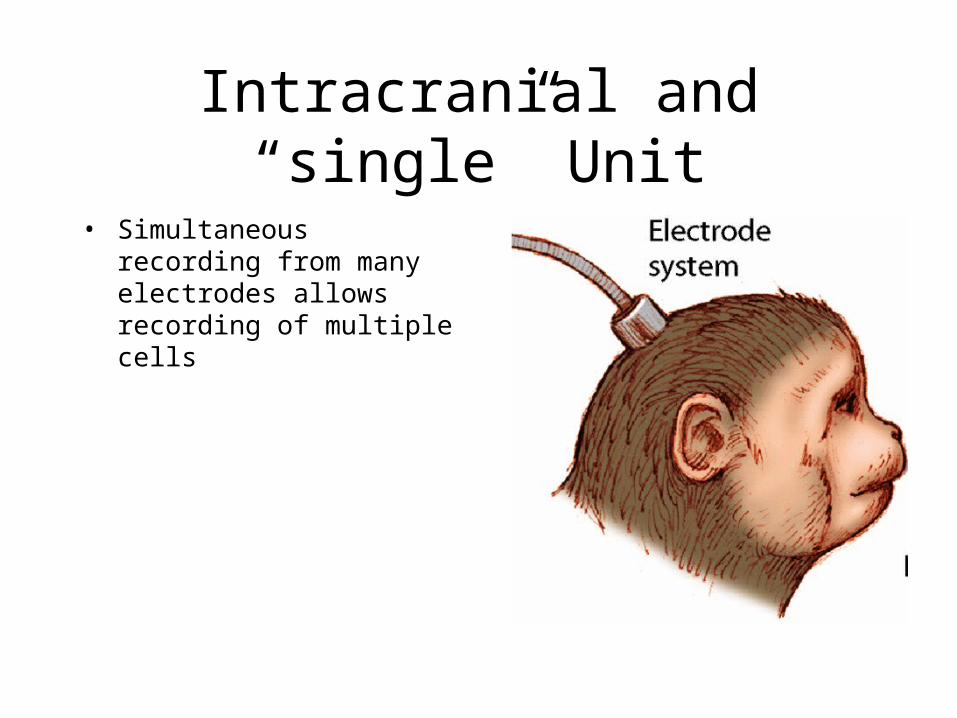
Intracranial and “single” Unit
• Simultaneous recording from many electrodes allows recording of multiple cells

Intracranial and “single” Unit
• Output of unit recordings is often depicted as a “spike train” and measured in spikes/second
Stimulus on
Spikes

Intracranial and “single” Unit
• Output of unit recordings is often depicted as a “spike train” and measured in spikes/second
• Spike rate is almost never zero, even without sensory input– in visual cortex this gives rise
to “cortical grey”
Stimulus on
Spikes
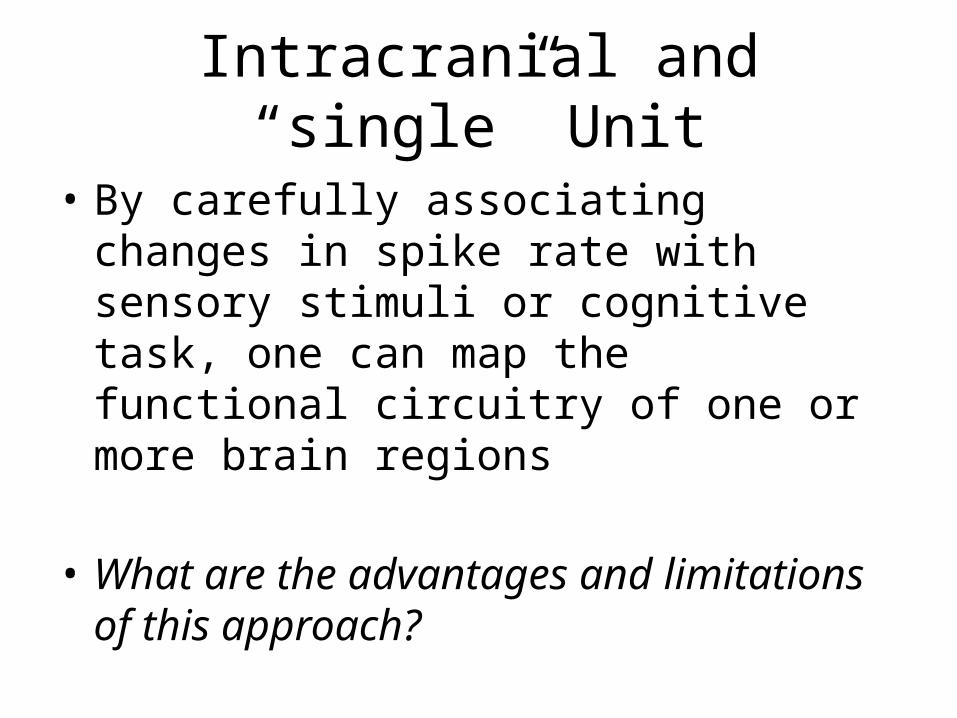
Intracranial and “single” Unit
• By carefully associating changes in spike rate with sensory stimuli or cognitive task, one can map the functional circuitry of one or more brain regions
• What are the advantages and limitations of this approach?