Embed Size (px)
Citation preview
VRRRRS:S:S:S: VALUATION REPORT Electroniki Athinon Group
Please see important disclosure and disclaimer statements at the end of this report.
1
FEBRUARY 2007
ELECTRONIKI ATHINON S.A. [ ELCr.AT ]
Strong retail network and selective expansion abroad drive growth
Valuation & Research Specialists (VRS)
Value Invest - www.valueinvest.gr
Investment Research & Analysis Journal - www.iraj.gr
GREEK EQUITIES RETAIL ELECTRIC & ELECTRONIC APPLIANCES
VRRRRS:S:S:S: VALUATION REPORT Electroniki Athinon Group
Please see important disclosure and disclaimer statements at the end of this report.
2
INITIAL STATEMENT
by VALUATION & RESEARCH SPECIALISTS (VRS)
Information contained herein is based on data obtained from
recognized statistical services, issue reports or communications, or
other sources, believed to be reliable. However, such information has
not been verified by VRS, and VRS does not make any representation
as to its accuracy and completeness. Opinions, estimates, and
statements nonfactual in nature expressed in its research represent
VRS’s judgment as of the date of its reports, are subject to change
without notice and are provided in good faith and without legal
responsibility. In addition, there may be instances when fundamental,
technical and quantitative opinions, estimates, and statements may not
be in concert. Neither the information nor any opinion expressed shall
constitute an offer to sell or a solicitation of an offer to buy any shares,
warrants, convertible securities or options of “covered companies” by
no means.
Please see full disclosure and disclaimer statements at the end of this report
VRRRRS:S:S:S: VALUATION REPORT Electroniki Athinon Group
Please see important disclosure and disclaimer statements at the end of this report.
3
ELECTRONIKI ATHINON SA
Nicholas I. Georgiadis
Christophoros J. Makrias
CA, HCMC
VALUATION & RESEARCH SPECIALISTS
Value Invest - www.valueinvest.gr Investment Research & Analysis Journal – www.iraj.gr
Contact: [email protected] Greek Equities – February 27th, 2007
Key Investment Points
� Electroniki Athinon (EA) is one of the most recognized
brand names in the Greek electric & electronic retail
appliances market, holding about 12% share and
targeting at least 16% in the next 3-years.
� The operation of new stores generates the domestic
growth. Until the end of fiscal 2006-2007, the Group is
planning to add 3 new stores in Greece reaching a
total of 51. The future expansion of the EA retail
network will target the total geographical coverage of
Greece, with stores having an average surface selling
area of 1,500 – 2,000 m2.
� One of the most significant drivers for future growth is
the international expansion in markets where EA can
identify profitable opportunities. The Group is about to
launch a 2,500 m2 Megastore in Serbia, targeting about
€7 million during the first year of operations.
� At the end of fiscal 2005-2006, total revenue for the
Group settled at approximately € 5,390 / m2. According
to our estimates this return will settle at € 5,200 / m2 by
the end of fiscal 2010/11 due to store expansion.
� Our valuation model derives a fair price of € 7.14 per
share for EA based on the DCF method and
comparative earnings multiples.
Company Description:
Electroniki Athinon is a retailer of electric,
electronic and audio - video appliances,
telecommunication (fixed & mobile) devices,
other products & services, offering at the same
time after sales services. The Group operates
48 stores in Greece and 2 in Cyprus, on a total
selling area of about 31,500 m2. The Group’s
stores have one of the broadest ranges of
electrical goods and home audio products
including almost all top brand names like
Philips, Sony, Bosch and Miele.
2005/06 2006/07 E 2007/08 F
(in mil. €)
Turnover 145.54 170.73 199.73
EBITDA 11.16 13.04 14.39
Margin % 7.67% 7.64% 7.21%
Net Income 6.11 6.89 7.59
Margin % 4.20% 4.04% 3.80%
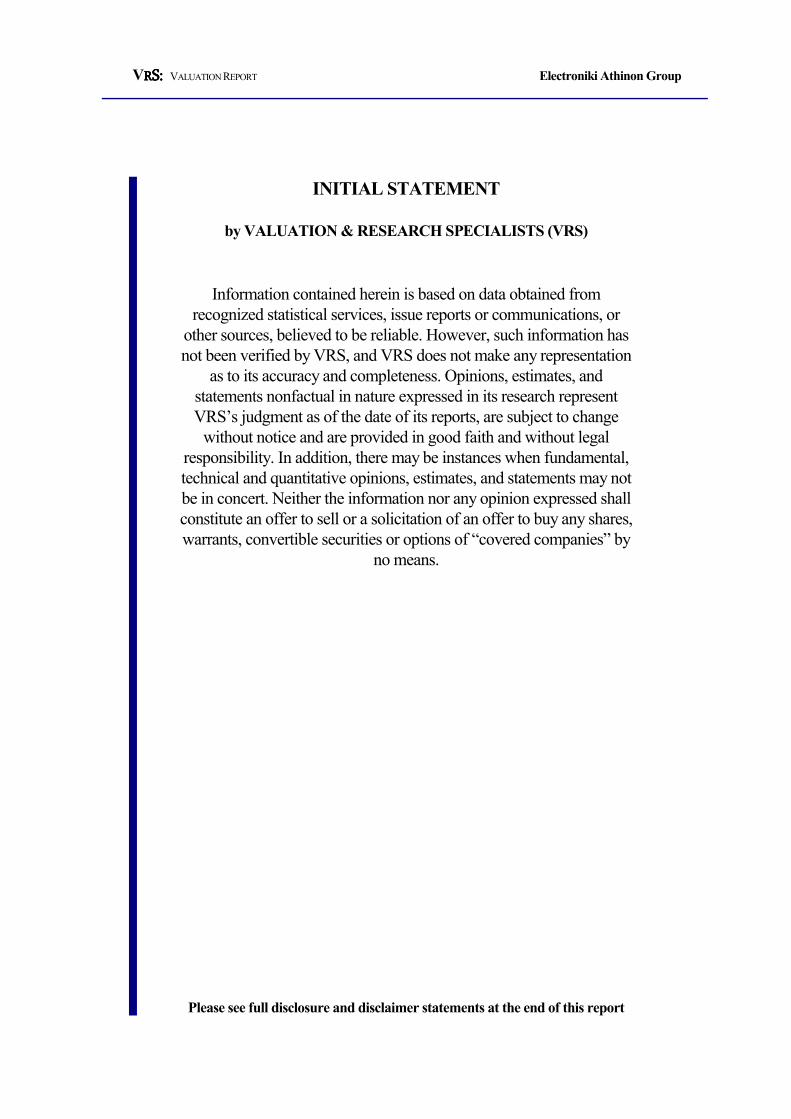
Price (27/02/2007) € 5.54
Shares (outstanding in million) 17.25
MktCap (in million €) 95.565
Hist. Beta 0.80
Div. 05/06 (in €) 0.20
2005/06 2006/07 E 2007/08 F
P/E 15.65x 13.87x 12.58x
P/BV 4.13x 3.62x 3.16x
Debt / Eq. 0.03 0.04 0.03
ROE (avg) 23.56% 27.79% 26.81%
Source: Company Data & VRS Projections
Please see important disclosure and disclaimer statements at the end of this report
VALUATION & RESEARCH SPECIALISTS : 104 Eolou Str., 105 64, Athens, Greece
Tel : + 30 210 32 19 557 FAX: + 30 210 33 16 358 E-mail: [email protected] – [email protected]
Share Price Graph (52 weeks) Min.: € 3.70 - Max.: € 6.86
0
1
2
3
4
5
6
7
8
2 7 / 2 / 2 0 0 6 3 0 / 6 / 2 0 0 6 2 5 / 1 0 / 2 0 0 6 2 2 / 2 / 2 0 0 7
Price in EUR
0
1 0 0 0 0 0
2 0 0 0 0 0
3 0 0 0 0 0
4 0 0 0 0 0
5 0 0 0 0 0
Volume in Shares
VRRRRS:S:S:S: VALUATION REPORT Electroniki Athinon Group
Please see important disclosure and disclaimer statements at the end of this report.
4
TABLE of CONTENTS Page
Investment Case & Growth Drivers 5
Investment Summary 5
Expansion of Store Network and Selling Area 5
Stronger Efficiency and Greater Customer Attraction 6
Benefits from the Withdraw of Major Competitors 7
International Expansion 8
Sector’s Outlook Financial Analysis 9
Historic & Projected Market Statistics & Company’s Revenues 9
Turnover Forecasts 10
Gross Profit Margin Evolution 11
Historic & Projected Turnover Breakdown (Consolidated) 13
Capital Expenditures 14
Balance Sheet Analysis 14
Quarterly Results 16
Management’s Guidance and VRS View 17
Valuation 18
DCF Methodology 18
Sensitivity Analysis 19
Peer Group Valuation 20
Combined Valuation 20
Share Price Performance vs. General Index 21
Valuation Ratios 21
Shareholders’ Structure 21
Company Profile 22
Investment Risks / Mitigating Factors 23
Retail Electronic Appliances Market in Greece 24
Group Historic & Projected Profit & Loss Account 25
Group Historic & Projected Balance Sheet 26
Group Historic & Projected Cash flows 27
Notes 28
Disclosure Statement 30
VRRRRS:S:S:S: VALUATION REPORT Electroniki Athinon Group
Please see important disclosure and disclaimer statements at the end of this report.
5
Investment Case & Growth Drivers
Investment Summary
Electroniki Athinon (EA) is one of the most recognized brand names in the Greek
electric & electronic retail appliances market, holding about 12% market share.
The Group is the largest under Greek ownership retail chain of electronics and
electrical household appliances in the country. Its enviable reputation has been
established since its foundation in 1989, and it is built upon the well-founded
principles of respecting its customers and offering value for money. The Group
has an experienced management team, which knows the retail market very well
and performs its expansion strategy focusing on cost containment.
The Group targets to increase its domestic market share to at least 16% in the next
3-years, and expand operations internationally utilizing the know-how of its
experienced management. EA will also benefit from the modest however steady
growth of the domestic electric and electronic household market, which is
estimated at € 1.3-1.4 million. Domestic annual growth is estimated at 1.5%-2% in
volume and slightly higher, at 2.5%, in value for the next 5-year period.
At the end of fiscal 2005-2006, total revenue for the Group settled at
approximately € 5,390 / m2. According to our estimates this return will settle at €
5,200 / m2 by the end of fiscal 2010/11 due to store expansion. The Group’s
strategy applies for domestic expansion, measured approach to international
expansion, which is seen as significant engine in future growth, focus on capital
management, margin “protection” and greater cost efficiency.
Expansion of Store Network and Selling Area
As of June 30, 2006 (the closing date of the last available fiscal year results),
Electroniki Athinon operated about 27,000 m2 through a network of 46 stores in
Greece and 2 in Cyprus. Opening new stores generates the domestic growth.
During the fiscal year 2006/07, the Group is planning to increase its network by 3
new stores in Greece (2 in Athens and 1 in Thessalonica) and 1 in Serbia raising
its total selling area by 10,500 m2. The expansion of Group’s network will
continue in fiscal 2007/08 with the launching of at least 4 new stores and the
potential opening of 2 more stores in Cyprus (as soon as current stores turn
positive). All new stores will satisfy the condition of an average 1,500 - 1,700 m2
selling area. In addition, the Group examines the potential of increasing the selling
VRRRRS:S:S:S: VALUATION REPORT Electroniki Athinon Group
Please see important disclosure and disclaimer statements at the end of this report.
6
area in selected older stores.
In terms of geographic expansion, the future development of EA retail network
will target the total geographical coverage of Greece, with stores having an
average surface selling area of 1,700 m2. The megastore format has the potential
to generate a much higher profit per m2 as it appears to attract more customers by
displaying a broader range of products. The large store size creates savings in
fixed store costs including rent, labor, service, and overhead.
Electroniki Athinon is also examining the benefits from potential acquisition of
smaller domestic players in order to expand its geographical presence into areas
of low penetration. This is only a potential growth driver for EA and is not
included in our valuation model.
Stronger Efficiency and Greater Customer Attraction
The Group is seeking to increase the return / m2 per year for the well-
established stores (for the whole network, return / m2 demonstrates a different
pattern as illustrated in our model due to expansion of total stores), applying the
concept of aggressive marketing, efficient product mix & merchandising and high
quality service through well-organized operations.
• Implementation of strong & aggressive marketing. The Group is spending
about 3.5%-4.0% of total turnover for its marketing campaign that is mostly
expressed with advertisements in all form of media (leaflets in newspapers,
TV spots, radio spots, ads in magazines) and other promotion techniques like
stock days and special offers.
• Constant improvement of operations and services. Electroniki Athinon
aims at constant improvement of operations and services to customers,
unfolding its strategy on two key areas:
1. Efficient Logistics Centre. EA operates a modern 16,000 m2 central
warehouse closely monitoring the inventory flow and the ordering of
stock. Thus, the Group realizes fast delivery of goods retaining the
minimum possible stock, achieving at the same time cost efficiencies.
2. Personnel Training. EA has a well-trained staff that is committed to
quality service. At the same time, the Group is seeking ways to improve
the staff’s performance and provide innovative retail operations, through
frequent training sessions.
• Alternative product sales. The Group’s top product sales category is
household appliances with the “Electroniki Athinon” name being among the
VRRRRS:S:S:S: VALUATION REPORT Electroniki Athinon Group
Please see important disclosure and disclaimer statements at the end of this report.
7
first in customer’s mind. The Group’s stores have one of the broadest ranges
of electrical goods and home audio products including the majority of top
brand names like Philips, Sony, Bosch and Miele.
The Group has low presence in the PC market due to management’s latest
decision to expand only modestly in this area, since competition is high,
margins are low and there is requirement for extra staff training. However, this
is about to change beginning from this year, as Electroniki places now greater
emphasis on information technology and digital products.
Furthermore, the management sees strong growth potential on
telecommunication market, examining new trends in order to identify
opportunities. Sales are generated from telecom devices and equipment as
well as services regarding the connection with mobile and Internet operators.
The Group is seeking to become distributor of the majority of operators,
satisfying the needs of a broader customer group. In addition, interesting
opportunities appear in the new technology products, such as digital products,
gadgets and games.
Benefits from the Withdraw of Major Competitors
The bankrupt and gradual withdraw of the second largest retail chain ‘Radio
Korasidis’ and ‘Elephant’ from the market during fiscal 2005 gave EA the
potential to capture a large part of their market share and become the second
player in the domestic market place. Total turnover of Radio Korasidis Group at
the end of fiscal 2004 accounted for € 229 million, implying about 17%-18%
market share. Furthermore, a market share of 4% was recently “disposed” into the
domestic market when other smaller players terminated their retail operations.
However, the entrance of large international players in the Greek market –Fnac
and Media Markt have almost one year of operations– increases competition in the
Greek market. Overall, the competitive advantage of EA is long experience
and knowledge of the Greek market and flexibility to implement alternative
strategies in order to benefit or avoid losses from market changes.
VRRRRS:S:S:S: VALUATION REPORT Electroniki Athinon Group
Please see important disclosure and disclaimer statements at the end of this report.
8
International Expansion
International expansion is one of the most significant engines in Group’s
future growth. At this time however, its strategy calls for a measured expansion
of international operations, focusing on markets where EA can identify profitable
opportunities due to low competition, low penetration of new technology products
and favorable consumer spending trends.
The Group recently established a 2,500 m2 Megastore in Serbia. Total sales for the
first year of operations are estimated to reach about € 7 million with the breakeven
level standing at € 10 million.
The Group will proceed with the operation of a second store in the country,
targeting for synergies since total breakeven with 2 stores is estimated at € 15
million.
The successful course of the Serbia investment will signal whether further
expansion in other South European countries is appropriate. Such markets are
Bulgaria, Albania and FYROM standing first in the list among other foreign
markets.
We believe that the above development will not realize before fiscal year 2008.
The management will first monitor the progress of Serbia and based on the
potential success of the first Megastore, it will then take the risk to invest on a
more aggressive pattern. According to our projections, total international revenues
will account for 11% of total consolidated turnover at the end of fiscal 2010/11.
VRRRRS:S:S:S: VALUATION REPORT Electroniki Athinon Group
Please see important disclosure and disclaimer statements at the end of this report.
9
Sector’s Outlook & Financial Analysis
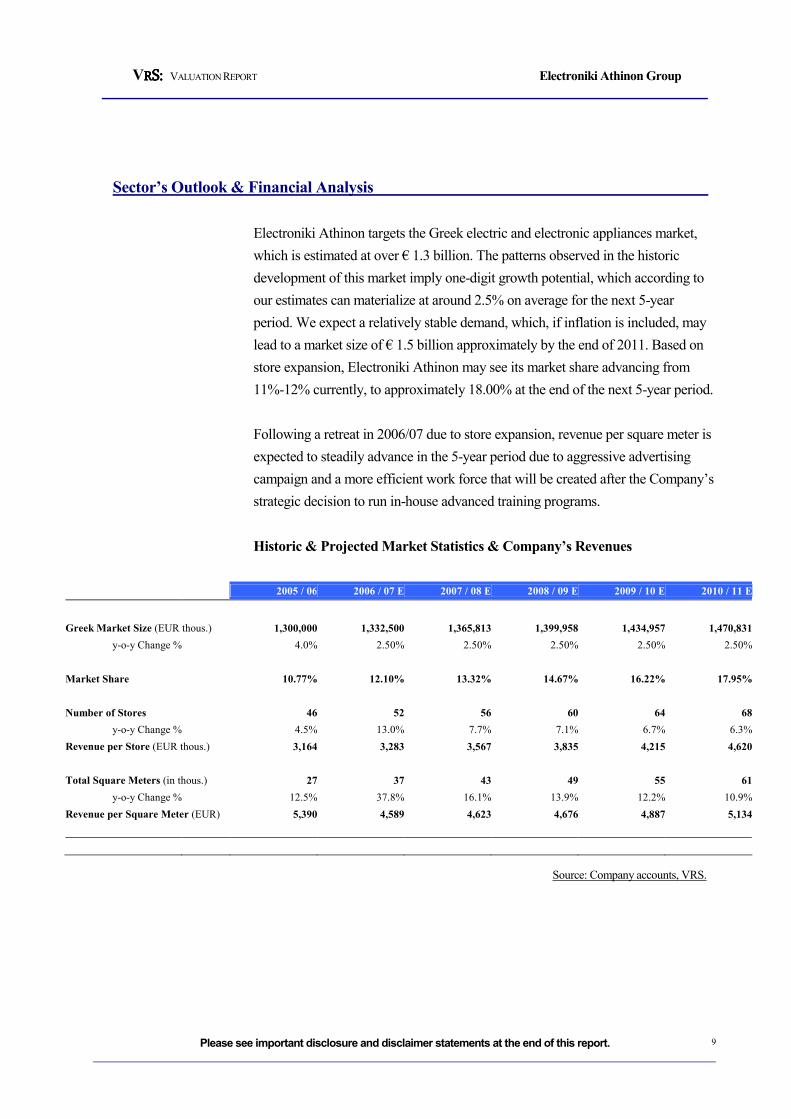
Electroniki Athinon targets the Greek electric and electronic appliances market,
which is estimated at over € 1.3 billion. The patterns observed in the historic
development of this market imply one-digit growth potential, which according to
our estimates can materialize at around 2.5% on average for the next 5-year
period. We expect a relatively stable demand, which, if inflation is included, may
lead to a market size of € 1.5 billion approximately by the end of 2011. Based on
store expansion, Electroniki Athinon may see its market share advancing from
11%-12% currently, to approximately 18.00% at the end of the next 5-year period.
Following a retreat in 2006/07 due to store expansion, revenue per square meter is
expected to steadily advance in the 5-year period due to aggressive advertising
campaign and a more efficient work force that will be created after the Company’s
strategic decision to run in-house advanced training programs.
Historic & Projected Market Statistics & Company’s Revenues
2005 / 06 2006 / 07 E 2007 / 08 E 2008 / 09 E 2009 / 10 E 2010 / 11 E
Greek Market Size (EUR thous.) 1,300,000 1,332,500 1,365,813 1,399,958 1,434,957 1,470,831
y-o-y Change % 4.0% 2.50% 2.50% 2.50% 2.50% 2.50%
Market Share 10.77% 12.10% 13.32% 14.67% 16.22% 17.95%
Number of Stores 46 52 56 60 64 68
y-o-y Change % 4.5% 13.0% 7.7% 7.1% 6.7% 6.3%
Revenue per Store (EUR thous.) 3,164 3,283 3,567 3,835 4,215 4,620
Total Square Meters (in thous.) 27 37 43 49 55 61
y-o-y Change % 12.5% 37.8% 16.1% 13.9% 12.2% 10.9%
Revenue per Square Meter (EUR) 5,390 4,589 4,623 4,676 4,887 5,134
Source: Company accounts, VRS.

VRRRRS:S:S:S: VALUATION REPORT Electroniki Athinon Group
Please see important disclosure and disclaimer statements at the end of this report.
10
Turnover Forecasts
White appliances, vision & sound, and micro appliances are the major drivers
behind the Group’s revenue expansion and earnings growth in the following 5-
year period. Over the course of this period, we also expect a significant
contribution to come from related services, international revenues and air-
conditioning. It is noted that our model includes Cyprus in the domestic revenues
and not in the international activities.
As far as white and micro appliances are concerned, we forecast revenue growth
of around 15% annually, anticipating Electroniki to take advantage of its lifetime
specialization and strong brand recognition in these areas. Vision & sound is a
more promising market in terms of future revenue growth, however with stronger
competition. Therefore, we apply a relatively lower growth rate, of 12% annually,
in our model, making the assumption that despite competition, Electroniki will
continue generating strong revenues from vision & sound due to its large product
spectrum and attractive offering terms to consumers. Revenues from vision &
sound may accelerate in the event of faster materialization of Electroniki’s
investment plan. By the end of 2011, we anticipate revenues from appliances and
vision & sound to exceed 75% of total consolidated turnover.
Our model applies moderate growth rates in telecommunications related products
and personal computers, areas where the Management has decided not to focus its
growth strategy, without however excluding them from its “Megastore” expansion
concept. Air-conditioning revenues are expected to grow on a double-digit rate,
since it is an area where Electroniki intensifies its efforts to gain market share.
International activities are related to the successful launch of the Serbian
Megastore, which we assume that will lead to the opening of new stores abroad,
bringing international revenues (excluding Cyprus) to 11% of total by 2011. In this
projection, we also take into account the management’s conservative approach,
implying that Electroniki proceeds only cautiously and step-by-step with its
international expansion plan.
Finally, related services is an area where Electroniki is building a competitive
advantage against competition, offering after sales and other related services
(transportation, security, etc.) that grow in line with the revenues generated from
its major business categories. In-house training of the Company’s workforce is
also serving this mission, leading to an overall strong double-digit growth rate, of
VRRRRS:S:S:S: VALUATION REPORT Electroniki Athinon Group
Please see important disclosure and disclaimer statements at the end of this report.
11
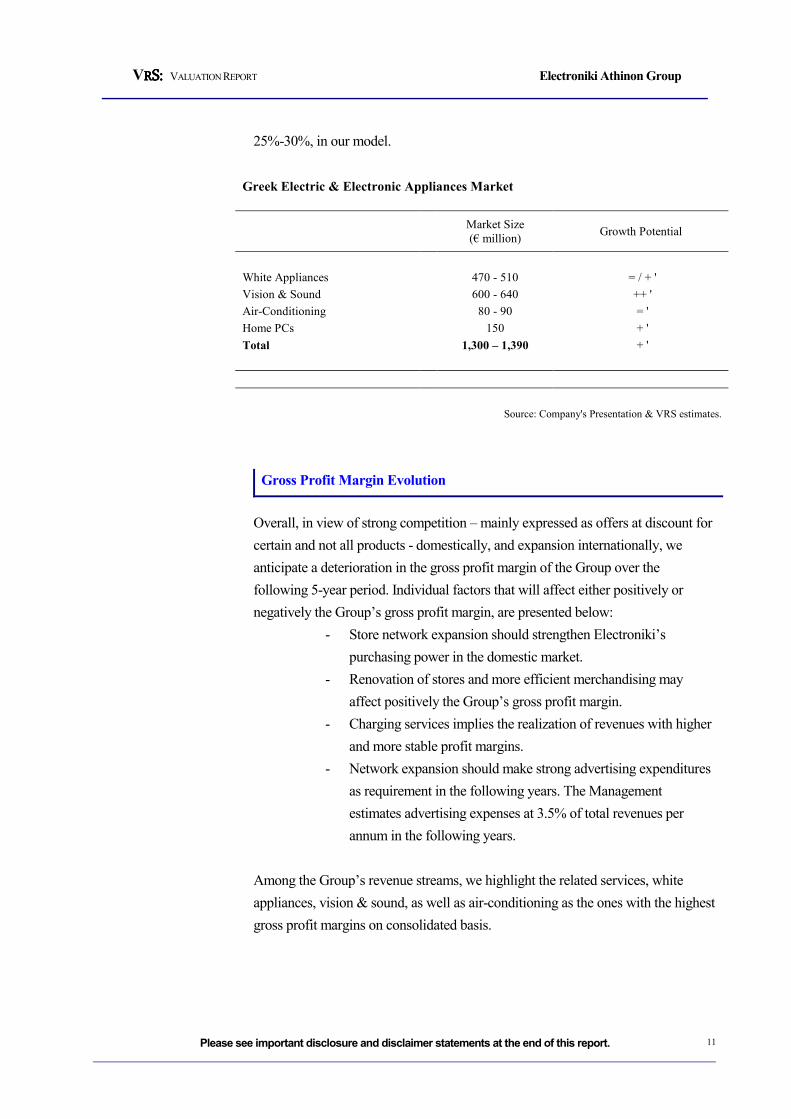
25%-30%, in our model.
Greek Electric & Electronic Appliances Market
Market Size
(€ million) Growth Potential
White Appliances 470 - 510 = / + '
Vision & Sound 600 - 640 ++ '
Air-Conditioning 80 - 90 = '
Home PCs 150 + '
Total 1,300 – 1,390 + '
Source: Company's Presentation & VRS estimates.
Gross Profit Margin Evolution
Overall, in view of strong competition – mainly expressed as offers at discount for
certain and not all products - domestically, and expansion internationally, we
anticipate a deterioration in the gross profit margin of the Group over the
following 5-year period. Individual factors that will affect either positively or
negatively the Group’s gross profit margin, are presented below:
- Store network expansion should strengthen Electroniki’s
purchasing power in the domestic market.
- Renovation of stores and more efficient merchandising may
affect positively the Group’s gross profit margin.
- Charging services implies the realization of revenues with higher
and more stable profit margins.
- Network expansion should make strong advertising expenditures
as requirement in the following years. The Management
estimates advertising expenses at 3.5% of total revenues per
annum in the following years.
Among the Group’s revenue streams, we highlight the related services, white
appliances, vision & sound, as well as air-conditioning as the ones with the highest
gross profit margins on consolidated basis.
VRRRRS:S:S:S: VALUATION REPORT Electroniki Athinon Group
Please see important disclosure and disclaimer statements at the end of this report.
12
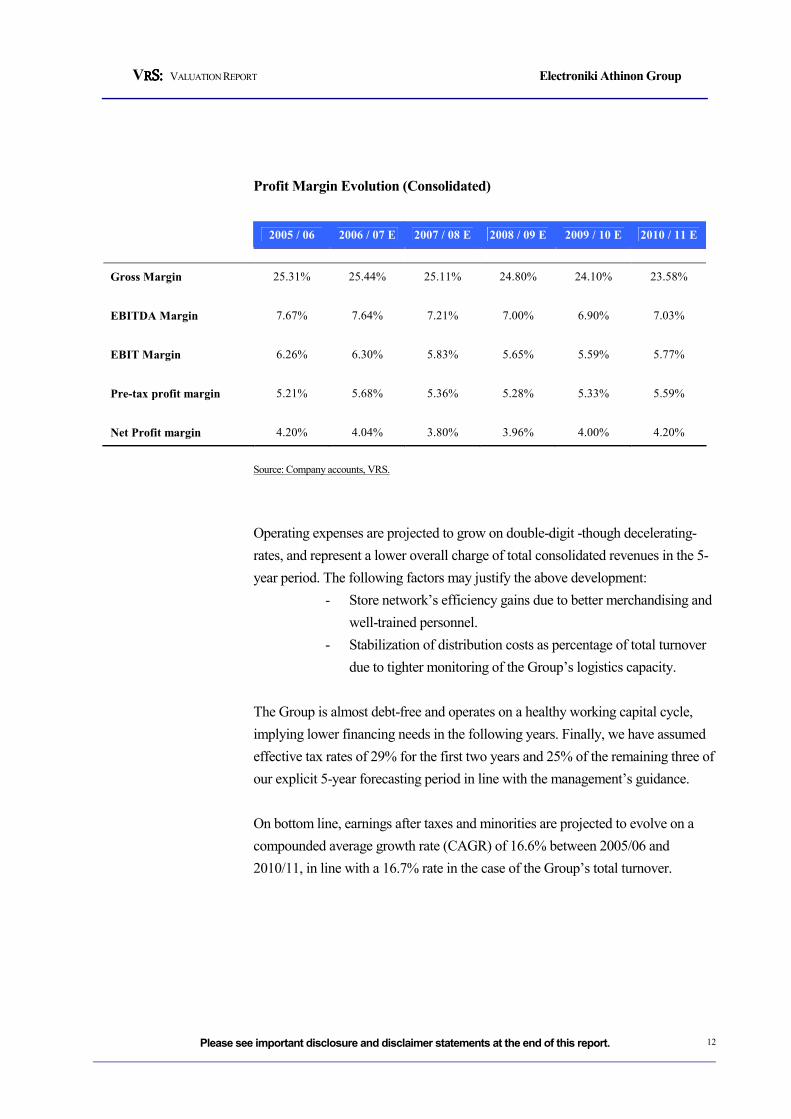
Profit Margin Evolution (Consolidated)
2005 / 06 2006 / 07 E 2007 / 08 E 2008 / 09 E 2009 / 10 E 2010 / 11 E
Gross Margin 25.31% 25.44% 25.11% 24.80% 24.10% 23.58%
EBITDA Margin 7.67% 7.64% 7.21% 7.00% 6.90% 7.03%
EBIT Margin 6.26% 6.30% 5.83% 5.65% 5.59% 5.77%
Pre-tax profit margin 5.21% 5.68% 5.36% 5.28% 5.33% 5.59%
Net Profit margin 4.20% 4.04% 3.80% 3.96% 4.00% 4.20%
Source: Company accounts, VRS.
Operating expenses are projected to grow on double-digit -though decelerating-
rates, and represent a lower overall charge of total consolidated revenues in the 5-
year period. The following factors may justify the above development:
- Store network’s efficiency gains due to better merchandising and
well-trained personnel.
- Stabilization of distribution costs as percentage of total turnover
due to tighter monitoring of the Group’s logistics capacity.
The Group is almost debt-free and operates on a healthy working capital cycle,
implying lower financing needs in the following years. Finally, we have assumed
effective tax rates of 29% for the first two years and 25% of the remaining three of
our explicit 5-year forecasting period in line with the management’s guidance.
On bottom line, earnings after taxes and minorities are projected to evolve on a
compounded average growth rate (CAGR) of 16.6% between 2005/06 and
2010/11, in line with a 16.7% rate in the case of the Group’s total turnover.
VRRRRS:S:S:S: VALUATION REPORT Electroniki Athinon Group
Please see important disclosure and disclaimer statements at the end of this report.
13
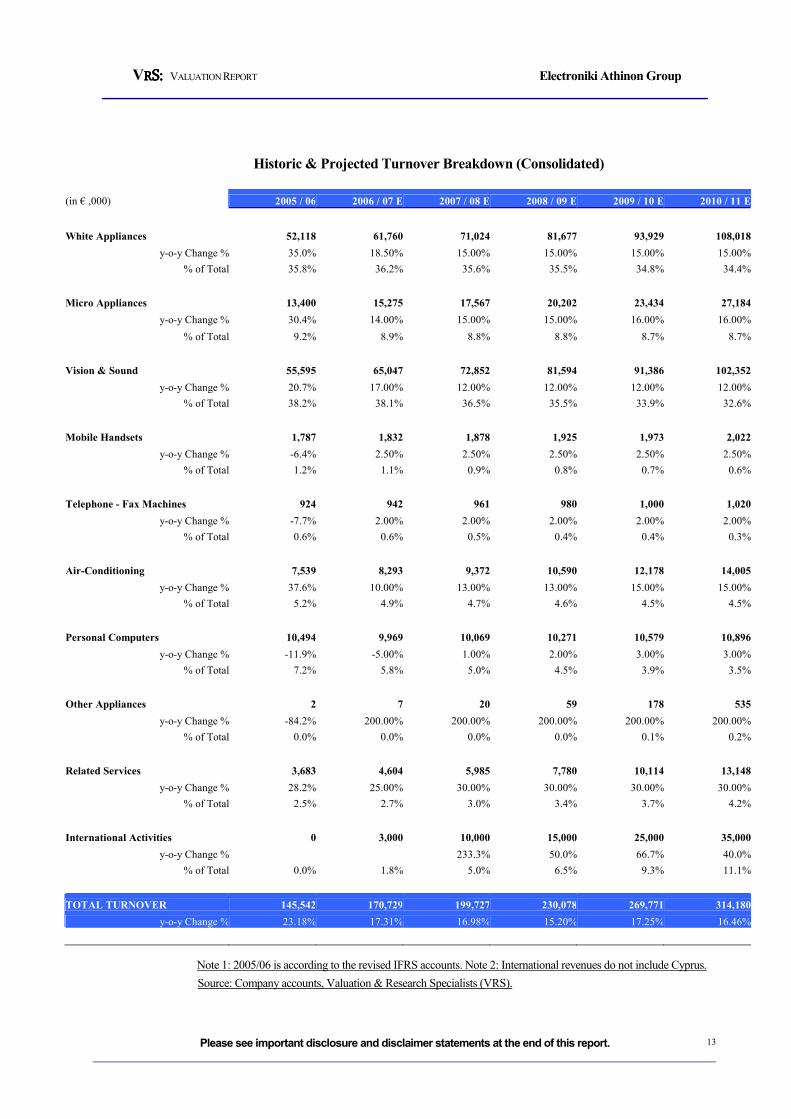
Historic & Projected Turnover Breakdown (Consolidated)
(in € ,000) 2005 / 06 2006 / 07 E 2007 / 08 E 2008 / 09 E 2009 / 10 E 2010 / 11 E
White Appliances 52,118 61,760 71,024 81,677 93,929 108,018
y-o-y Change % 35.0% 18.50% 15.00% 15.00% 15.00% 15.00%
% of Total 35.8% 36.2% 35.6% 35.5% 34.8% 34.4%
Micro Appliances 13,400 15,275 17,567 20,202 23,434 27,184
y-o-y Change % 30.4% 14.00% 15.00% 15.00% 16.00% 16.00%
% of Total 9.2% 8.9% 8.8% 8.8% 8.7% 8.7%
Vision & Sound 55,595 65,047 72,852 81,594 91,386 102,352
y-o-y Change % 20.7% 17.00% 12.00% 12.00% 12.00% 12.00%
% of Total 38.2% 38.1% 36.5% 35.5% 33.9% 32.6%
Mobile Handsets 1,787 1,832 1,878 1,925 1,973 2,022
y-o-y Change % -6.4% 2.50% 2.50% 2.50% 2.50% 2.50%
% of Total 1.2% 1.1% 0.9% 0.8% 0.7% 0.6%
Telephone - Fax Machines 924 942 961 980 1,000 1,020
y-o-y Change % -7.7% 2.00% 2.00% 2.00% 2.00% 2.00%
% of Total 0.6% 0.6% 0.5% 0.4% 0.4% 0.3%
Air-Conditioning 7,539 8,293 9,372 10,590 12,178 14,005
y-o-y Change % 37.6% 10.00% 13.00% 13.00% 15.00% 15.00%
% of Total 5.2% 4.9% 4.7% 4.6% 4.5% 4.5%
Personal Computers 10,494 9,969 10,069 10,271 10,579 10,896
y-o-y Change % -11.9% -5.00% 1.00% 2.00% 3.00% 3.00%
% of Total 7.2% 5.8% 5.0% 4.5% 3.9% 3.5%
Other Appliances 2 7 20 59 178 535
y-o-y Change % -84.2% 200.00% 200.00% 200.00% 200.00% 200.00%
% of Total 0.0% 0.0% 0.0% 0.0% 0.1% 0.2%
Related Services 3,683 4,604 5,985 7,780 10,114 13,148
y-o-y Change % 28.2% 25.00% 30.00% 30.00% 30.00% 30.00%
% of Total 2.5% 2.7% 3.0% 3.4% 3.7% 4.2%
International Activities 0 3,000 10,000 15,000 25,000 35,000
y-o-y Change % 233.3% 50.0% 66.7% 40.0%
% of Total 0.0% 1.8% 5.0% 6.5% 9.3% 11.1%
TOTAL TURNOVER 145,542 170,729 199,727 230,078 269,771 314,180
y-o-y Change % 23.18% 17.31% 16.98% 15.20% 17.25% 16.46%
Note 1: 2005/06 is according to the revised IFRS accounts. Note 2: International revenues do not include Cyprus.
Source: Company accounts, Valuation & Research Specialists (VRS).
VRRRRS:S:S:S: VALUATION REPORT Electroniki Athinon Group
Please see important disclosure and disclaimer statements at the end of this report.
14
Capital Expenditures
The Group has planned significant capital expenditures for the next 5-year period,
in view of its strategic goal to bring the total network of stores to 68 in the
financial year 2010/11 from 46 in 2005/06. The financing scheme of this plan is
mainly based on the Company’s strong operating cash flows, which are projected
to settle at over € 10 million on average in the next 5-year period.
Balance Sheet Analysis
Electroniki Athinon has an exceptional capital structure highlighted by zero bank
debt, favorable working capital cycle and healthy current ratio. We anticipate that
own capital due to strong cash flows, and competitive suppliers agreements due to
high purchasing power will finance future asset growth, both the current and the
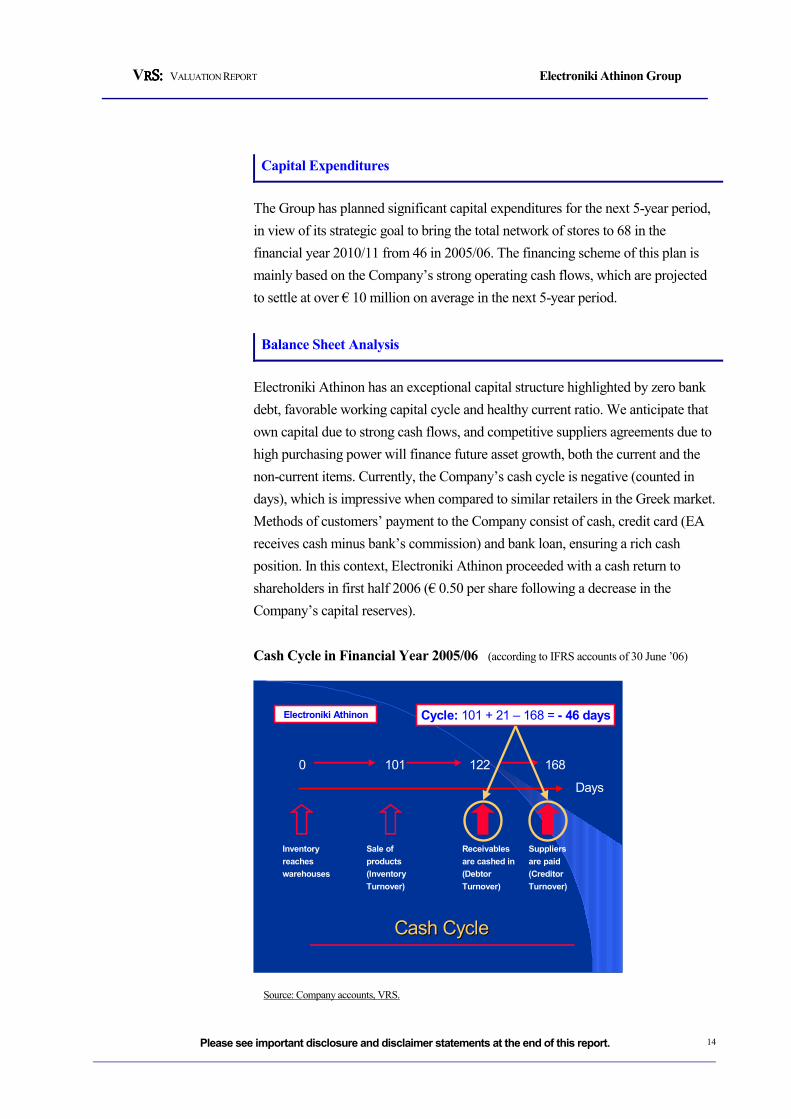
non-current items. Currently, the Company’s cash cycle is negative (counted in
days), which is impressive when compared to similar retailers in the Greek market.
Methods of customers’ payment to the Company consist of cash, credit card (EA
receives cash minus bank’s commission) and bank loan, ensuring a rich cash
position. In this context, Electroniki Athinon proceeded with a cash return to
shareholders in first half 2006 (€ 0.50 per share following a decrease in the
Company’s capital reserves).
Cash Cycle in Financial Year 2005/06 (according to IFRS accounts of 30 June ’06)
Days
0 101 122 168
Cycle: 101 + 21 – 168 = - 46 days
Cash CycleCash Cycle
Inventory
reaches
warehouses
Sale of
products
(Inventory
Turnover)
Receivables
are cashed in
(Debtor
Turnover)
Suppliers
are paid
(Creditor
Turnover)
Electroniki Athinon
Source: Company accounts, VRS.
VRRRRS:S:S:S: VALUATION REPORT Electroniki Athinon Group
Please see important disclosure and disclaimer statements at the end of this report.
15
On the fixed asset side, the Company’s real estate assets are valued at a discount
compared to current market standards, which leaves Electroniki with another
alternative financial mechanism, when it comes to value or cash enhancement. No
assumption related to the above has been made in our model.
In December 2006, the Annual Shareholders’ Meeting approved the issuance of a
convertible bond amounting up to € 20 million, which is to be utilized for the
Group’s investment plan. As the Management has not yet disclosed any intention
to use this alternative financing scheme in the near future, we have not
incorporated any relevant assumption in our model.
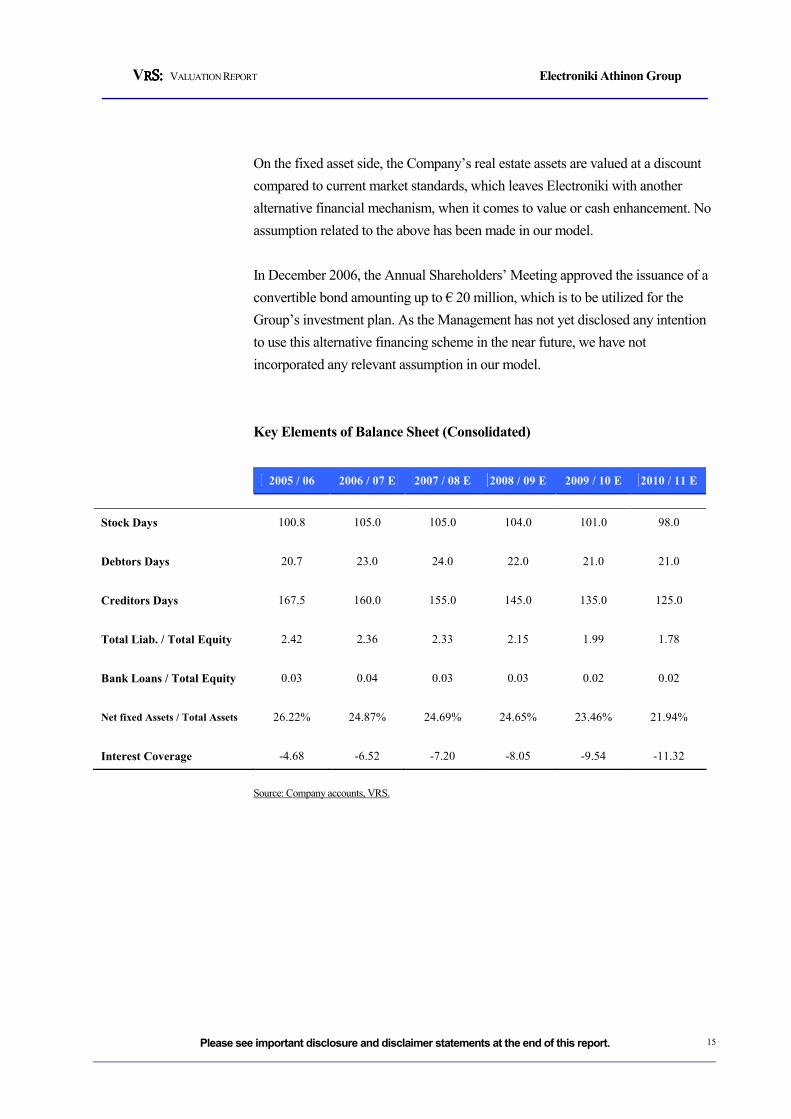
Key Elements of Balance Sheet (Consolidated)
2005 / 06 2006 / 07 E 2007 / 08 E 2008 / 09 E 2009 / 10 E 2010 / 11 E
Stock Days 100.8 105.0 105.0 104.0 101.0 98.0
Debtors Days 20.7 23.0 24.0 22.0 21.0 21.0
Creditors Days 167.5 160.0 155.0 145.0 135.0 125.0
Total Liab. / Total Equity 2.42 2.36 2.33 2.15 1.99 1.78
Bank Loans / Total Equity 0.03 0.04 0.03 0.03 0.02 0.02
Net fixed Assets / Total Assets 26.22% 24.87% 24.69% 24.65% 23.46% 21.94%
Interest Coverage -4.68 -6.52 -7.20 -8.05 -9.54 -11.32
Source: Company accounts, VRS.
VRRRRS:S:S:S: VALUATION REPORT Electroniki Athinon Group
Please see important disclosure and disclaimer statements at the end of this report.
16
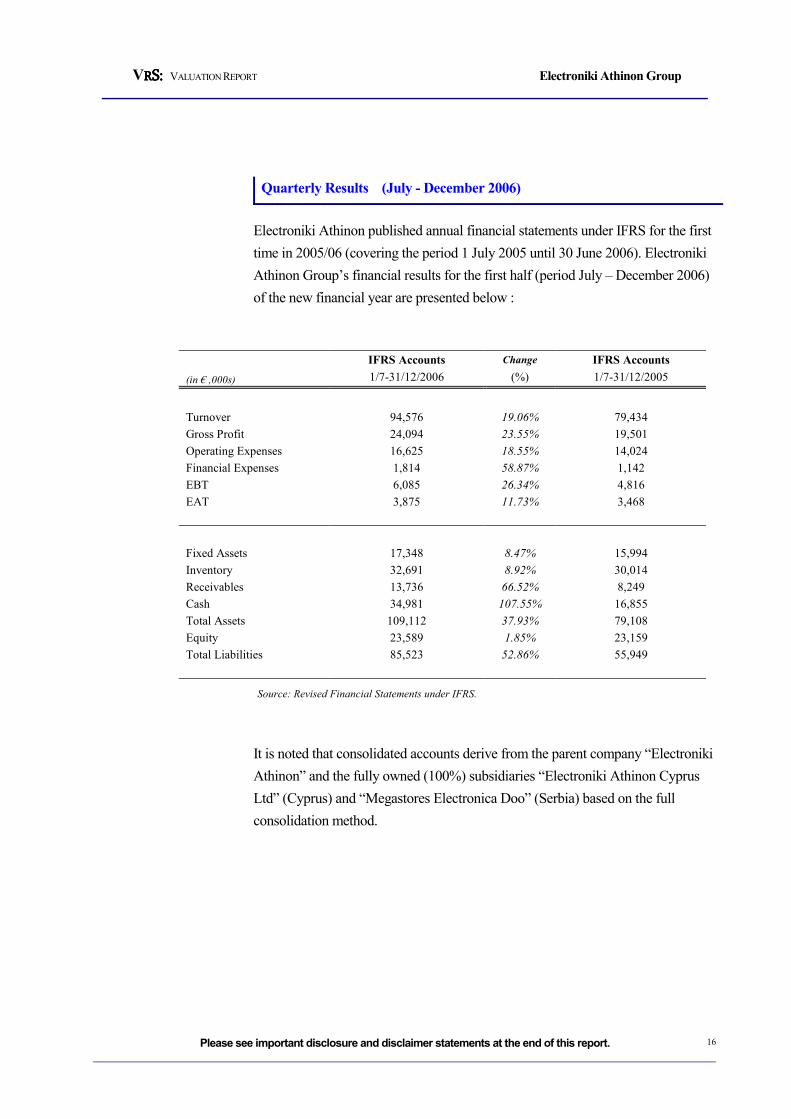
Quarterly Results (July - December 2006)
Electroniki Athinon published annual financial statements under IFRS for the first
time in 2005/06 (covering the period 1 July 2005 until 30 June 2006). Electroniki
Athinon Group’s financial results for the first half (period July – December 2006)
of the new financial year are presented below :
IFRS Accounts Change IFRS Accounts
(in € ,000s) 1/7-31/12/2006 (%) 1/7-31/12/2005
Turnover 94,576 19.06% 79,434
Gross Profit 24,094 23.55% 19,501
Operating Expenses 16,625 18.55% 14,024
Financial Expenses 1,814 58.87% 1,142
EBT 6,085 26.34% 4,816
EAT 3,875 11.73% 3,468
Fixed Assets 17,348 8.47% 15,994
Inventory 32,691 8.92% 30,014
Receivables 13,736 66.52% 8,249
Cash 34,981 107.55% 16,855
Total Assets 109,112 37.93% 79,108
Equity 23,589 1.85% 23,159
Total Liabilities 85,523 52.86% 55,949
Source: Revised Financial Statements under IFRS.
It is noted that consolidated accounts derive from the parent company “Electroniki
Athinon” and the fully owned (100%) subsidiaries “Electroniki Athinon Cyprus
Ltd” (Cyprus) and “Megastores Electronica Doo” (Serbia) based on the full
consolidation method.
VRRRRS:S:S:S: VALUATION REPORT Electroniki Athinon Group
Please see important disclosure and disclaimer statements at the end of this report.
17
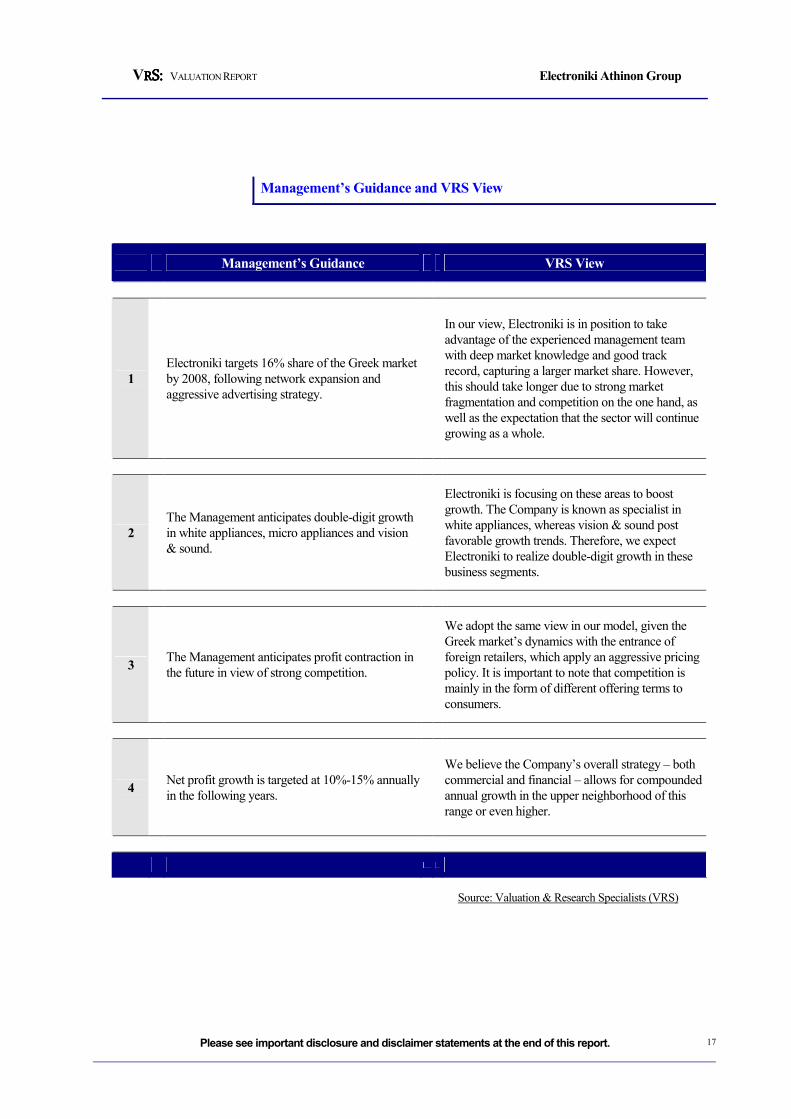
Management’s Guidance and VRS View
Management’s Guidance VRS View
1
Electroniki targets 16% share of the Greek market
by 2008, following network expansion and
aggressive advertising strategy.
In our view, Electroniki is in position to take
advantage of the experienced management team
with deep market knowledge and good track
record, capturing a larger market share. However,
this should take longer due to strong market
fragmentation and competition on the one hand, as
well as the expectation that the sector will continue
growing as a whole.
2
The Management anticipates double-digit growth
in white appliances, micro appliances and vision
& sound.
Electroniki is focusing on these areas to boost
growth. The Company is known as specialist in
white appliances, whereas vision & sound post
favorable growth trends. Therefore, we expect
Electroniki to realize double-digit growth in these
business segments.
3 The Management anticipates profit contraction in
the future in view of strong competition.
We adopt the same view in our model, given the
Greek market’s dynamics with the entrance of
foreign retailers, which apply an aggressive pricing
policy. It is important to note that competition is
mainly in the form of different offering terms to
consumers.
4 Net profit growth is targeted at 10%-15% annually
in the following years.
We believe the Company’s overall strategy – both
commercial and financial – allows for compounded
annual growth in the upper neighborhood of this
range or even higher.
Source: Valuation & Research Specialists (VRS)
VRRRRS:S:S:S: VALUATION REPORT Electroniki Athinon Group
Please see important disclosure and disclaimer statements at the end of this report.
18
Valuation
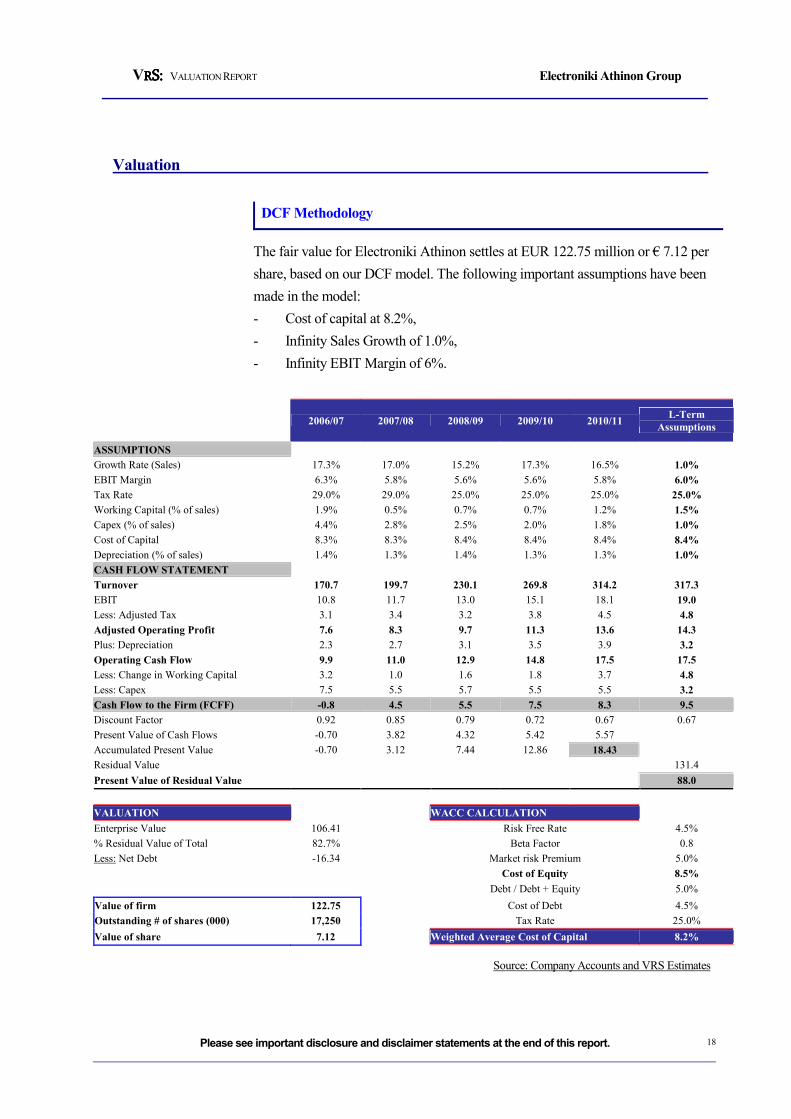
DCF Methodology
The fair value for Electroniki Athinon settles at EUR 122.75 million or € 7.12 per
share, based on our DCF model. The following important assumptions have been
made in the model:
- Cost of capital at 8.2%,
- Infinity Sales Growth of 1.0%,
- Infinity EBIT Margin of 6%.
2006/07 2007/08 2008/09 2009/10 2010/11 L-Term
Assumptions
ASSUMPTIONS
Growth Rate (Sales) 17.3% 17.0% 15.2% 17.3% 16.5% 1.0%
EBIT Margin 6.3% 5.8% 5.6% 5.6% 5.8% 6.0%
Tax Rate 29.0% 29.0% 25.0% 25.0% 25.0% 25.0%
Working Capital (% of sales) 1.9% 0.5% 0.7% 0.7% 1.2% 1.5%
Capex (% of sales) 4.4% 2.8% 2.5% 2.0% 1.8% 1.0%
Cost of Capital 8.3% 8.3% 8.4% 8.4% 8.4% 8.4%
Depreciation (% of sales) 1.4% 1.3% 1.4% 1.3% 1.3% 1.0%
CASH FLOW STATEMENT
Turnover 170.7 199.7 230.1 269.8 314.2 317.3
EBIT 10.8 11.7 13.0 15.1 18.1 19.0
Less: Adjusted Tax 3.1 3.4 3.2 3.8 4.5 4.8
Adjusted Operating Profit 7.6 8.3 9.7 11.3 13.6 14.3
Plus: Depreciation 2.3 2.7 3.1 3.5 3.9 3.2
Operating Cash Flow 9.9 11.0 12.9 14.8 17.5 17.5
Less: Change in Working Capital 3.2 1.0 1.6 1.8 3.7 4.8
Less: Capex 7.5 5.5 5.7 5.5 5.5 3.2
Cash Flow to the Firm (FCFF) -0.8 4.5 5.5 7.5 8.3 9.5
Discount Factor 0.92 0.85 0.79 0.72 0.67 0.67
Present Value of Cash Flows -0.70 3.82 4.32 5.42 5.57
Accumulated Present Value -0.70 3.12 7.44 12.86 18.43
Residual Value 131.4
Present Value of Residual Value 88.0
VALUATION WACC CALCULATION
Enterprise Value 106.41 Risk Free Rate 4.5%
% Residual Value of Total 82.7% Beta Factor 0.8
Less: Net Debt -16.34 Market risk Premium 5.0%
Cost of Equity 8.5%
Debt / Debt + Equity 5.0%
Value of firm 122.75 Cost of Debt 4.5%
Outstanding # of shares (000) 17,250 Tax Rate 25.0%
Value of share 7.12 Weighted Average Cost of Capital 8.2%
Source: Company Accounts and VRS Estimates
VRRRRS:S:S:S: VALUATION REPORT Electroniki Athinon Group
Please see important disclosure and disclaimer statements at the end of this report.
19
The model’s assumptions relate to the following conditions:
• EA completes store network expansion as planned.
• EA gains market share due to network expansion, market concentration and
rising demand.
• Group’s profitability remains solid in the following 5 years.
• EA applies an efficient financial policy in terms of investments and working
capital cycle.
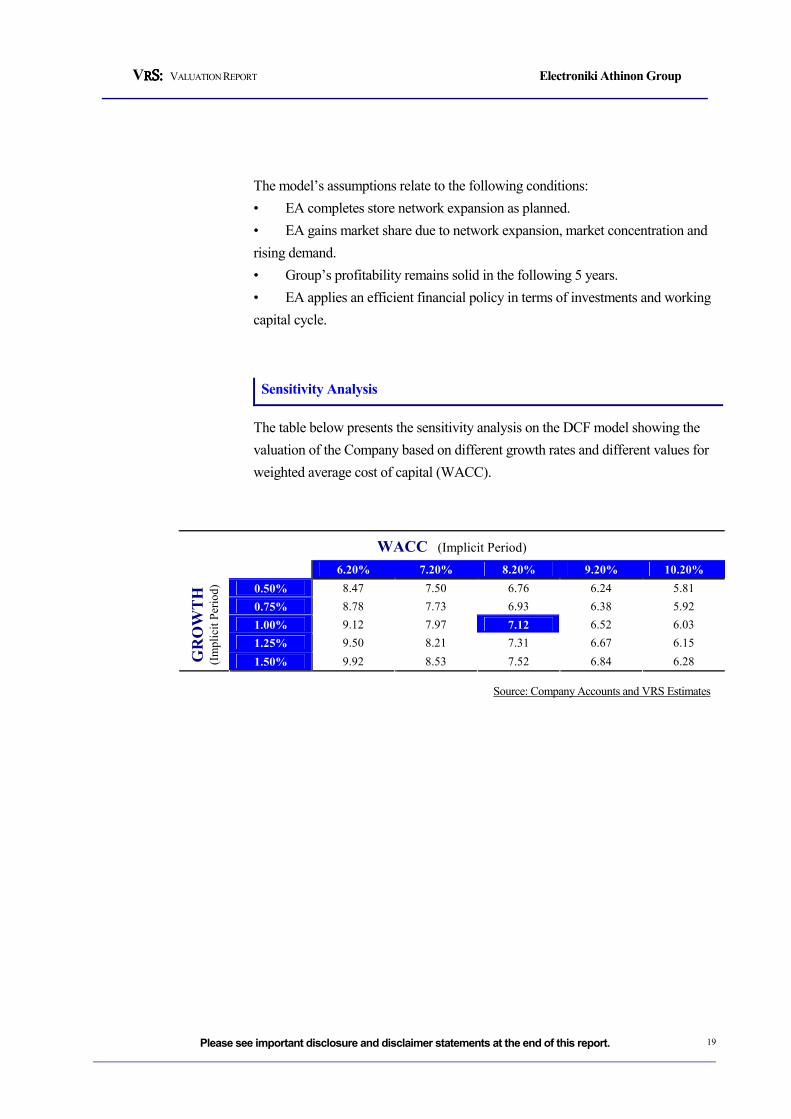
Sensitivity Analysis
The table below presents the sensitivity analysis on the DCF model showing the
valuation of the Company based on different growth rates and different values for
weighted average cost of capital (WACC).
WACC (Implicit Period)
6.20% 7.20% 8.20% 9.20% 10.20%
0.50% 8.47 7.50 6.76 6.24 5.81
0.75% 8.78 7.73 6.93 6.38 5.92
1.00% 9.12 7.97 7.12 6.52 6.03
1.25% 9.50 8.21 7.31 6.67 6.15
GROWTH
(Implicit Period)
1.50% 9.92 8.53 7.52 6.84 6.28
Source: Company Accounts and VRS Estimates
VRRRRS:S:S:S: VALUATION REPORT Electroniki Athinon Group
Please see important disclosure and disclaimer statements at the end of this report.
20
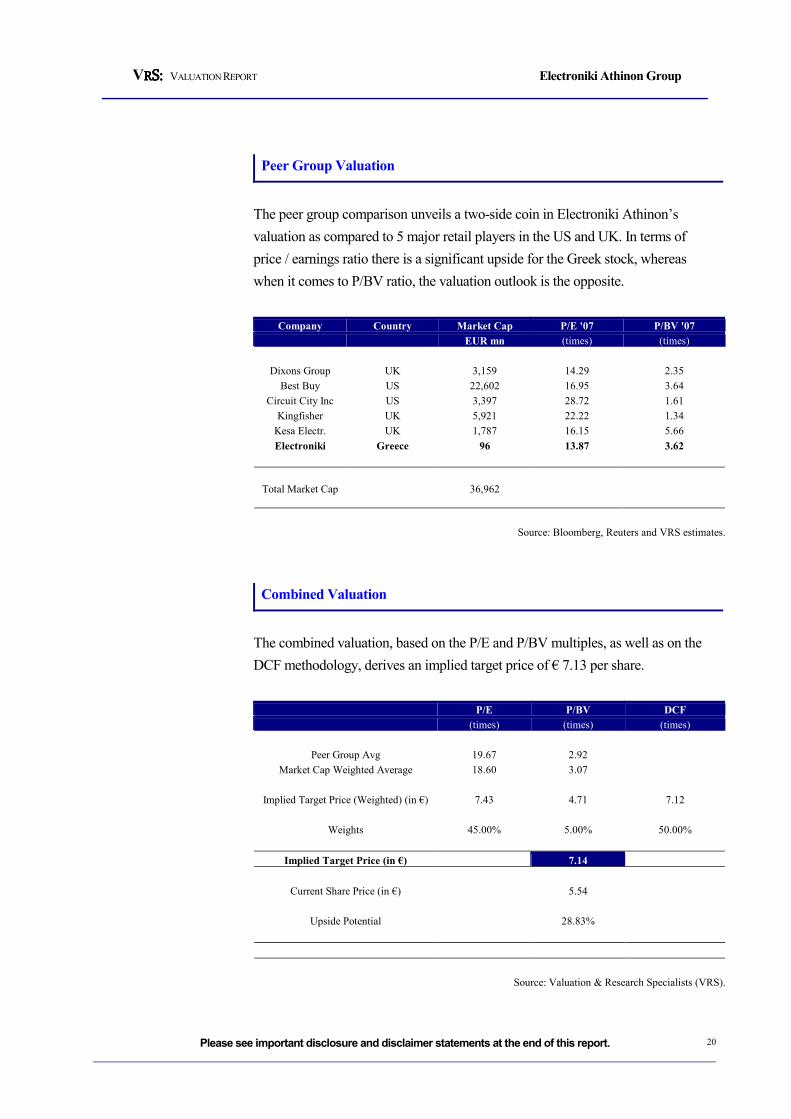
Peer Group Valuation
The peer group comparison unveils a two-side coin in Electroniki Athinon’s
valuation as compared to 5 major retail players in the US and UK. In terms of
price / earnings ratio there is a significant upside for the Greek stock, whereas
when it comes to P/BV ratio, the valuation outlook is the opposite.
Company Country Market Cap P/E '07 P/BV '07
EUR mn (times) (times)
Dixons Group UK 3,159 14.29 2.35
Best Buy US 22,602 16.95 3.64
Circuit City Inc US 3,397 28.72 1.61
Kingfisher UK 5,921 22.22 1.34
Kesa Electr. UK 1,787 16.15 5.66
Electroniki Greece 96 13.87 3.62
Total Market Cap 36,962
Source: Bloomberg, Reuters and VRS estimates.
Combined Valuation
The combined valuation, based on the P/E and P/BV multiples, as well as on the
DCF methodology, derives an implied target price of € 7.13 per share.
P/E P/BV DCF
(times) (times) (times)
Peer Group Avg 19.67 2.92
Market Cap Weighted Average 18.60 3.07
Implied Target Price (Weighted) (in €) 7.43 4.71 7.12
Weights 45.00% 5.00% 50.00%
Implied Target Price (in €) 7.14
Current Share Price (in €) 5.54
Upside Potential 28.83%
Source: Valuation & Research Specialists (VRS).
VRRRRS:S:S:S: VALUATION REPORT Electroniki Athinon Group
Please see important disclosure and disclaimer statements at the end of this report.
21
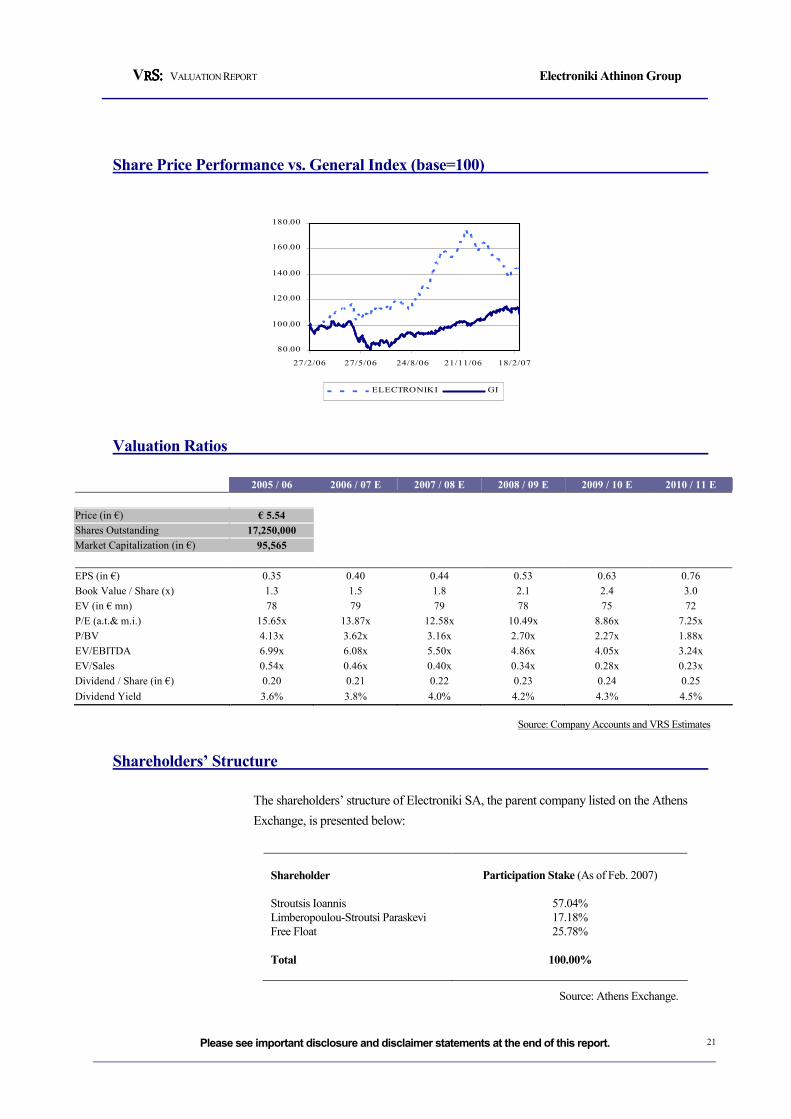
Share Price Performance vs. General Index (base=100)
80.00
100.00
120.00
140.00
160.00
180.00
27/2/06 27/5/06 24/8/06 21/11/06 18/2/07
ELECTRONIKI GI
Valuation Ratios
2005 / 06 2006 / 07 E 2007 / 08 E 2008 / 09 E 2009 / 10 E 2010 / 11 E
Price (in €) € 5.54
Shares Outstanding 17,250,000
Market Capitalization (in €) 95,565
EPS (in €) 0.35 0.40 0.44 0.53 0.63 0.76
Book Value / Share (x) 1.3 1.5 1.8 2.1 2.4 3.0
EV (in € mn) 78 79 79 78 75 72
P/E (a.t.& m.i.) 15.65x 13.87x 12.58x 10.49x 8.86x 7.25x
P/BV 4.13x 3.62x 3.16x 2.70x 2.27x 1.88x
EV/EBITDA 6.99x 6.08x 5.50x 4.86x 4.05x 3.24x
EV/Sales 0.54x 0.46x 0.40x 0.34x 0.28x 0.23x
Dividend / Share (in €) 0.20 0.21 0.22 0.23 0.24 0.25
Dividend Yield 3.6% 3.8% 4.0% 4.2% 4.3% 4.5%
Source: Company Accounts and VRS Estimates
Shareholders’ Structure
The shareholders’ structure of Electroniki SA, the parent company listed on the Athens
Exchange, is presented below:
Shareholder Participation Stake (As of Feb. 2007)
Stroutsis Ioannis 57.04%
Limberopoulou-Stroutsi Paraskevi 17.18%
Free Float 25.78%
Total 100.00%
Source: Athens Exchange.
VRRRRS:S:S:S: VALUATION REPORT Electroniki Athinon Group
Please see important disclosure and disclaimer statements at the end of this report.
22
Company Profile
Electroniki Athinon SA was founded on 25 July 1989. The Group specializes in
the sale of high technology consumer electronics, household electric appliances,
personal computers, photographic equipment, communication products and related
services, and after sales services. The following products and product categories
are sold through the outlets of the Company:
1. White appliances (refrigerators, deep freezers, electric stoves, washing
machines etc).
2. Built-in appliances (refrigerators, electric stoves, cooker hoods etc), which
demonstrate rising trend in the Greek market.
3. Small electric appliances (mixers, microwave ovens, electric irons, coffee
machines etc).
4. Video products (TVs, video recorders, video cameras, DVDs, home cinemas
etc).
5. Audio products (compact stereo systems, amplifiers, CD players, mini discs,
car audio systems, loudspeakers etc).
6. Air conditioners of several kinds.
7. Personal computers and peripherals (notebooks, printers, scanners, screens
etc).
8. Mobile phones, and related products and services.
In August 2000, Electroniki Athinon completed a 16,000 m2 warehouse. In 2002,
the Company entered the Cypriot market by establishing the 100% subsidiary
Electroniki Athinon (Cyprus) Ltd. The Company operates two stores, holding
about 6% share of the Cyprian retail electric and electronic appliances market.
VRRRRS:S:S:S: VALUATION REPORT Electroniki Athinon Group
Please see important disclosure and disclaimer statements at the end of this report.
23
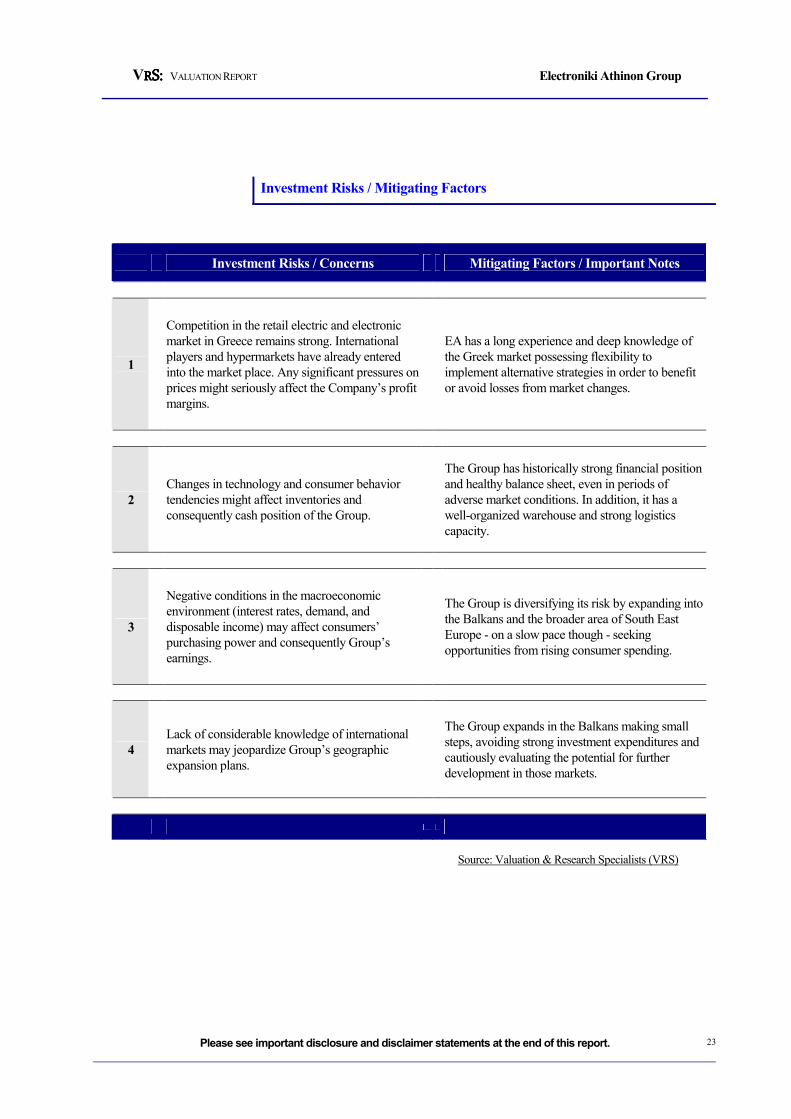
Investment Risks / Mitigating Factors
Investment Risks / Concerns Mitigating Factors / Important Notes
1
Competition in the retail electric and electronic
market in Greece remains strong. International
players and hypermarkets have already entered
into the market place. Any significant pressures on
prices might seriously affect the Company’s profit
margins.
EA has a long experience and deep knowledge of
the Greek market possessing flexibility to
implement alternative strategies in order to benefit
or avoid losses from market changes.
2
Changes in technology and consumer behavior
tendencies might affect inventories and
consequently cash position of the Group.
The Group has historically strong financial position
and healthy balance sheet, even in periods of
adverse market conditions. In addition, it has a
well-organized warehouse and strong logistics
capacity.
3
Negative conditions in the macroeconomic
environment (interest rates, demand, and
disposable income) may affect consumers’
purchasing power and consequently Group’s
earnings.
The Group is diversifying its risk by expanding into
the Balkans and the broader area of South East
Europe - on a slow pace though - seeking
opportunities from rising consumer spending.
4
Lack of considerable knowledge of international
markets may jeopardize Group’s geographic
expansion plans.
The Group expands in the Balkans making small
steps, avoiding strong investment expenditures and
cautiously evaluating the potential for further
development in those markets.
Source: Valuation & Research Specialists (VRS)
VRRRRS:S:S:S: VALUATION REPORT Electroniki Athinon Group
Please see important disclosure and disclaimer statements at the end of this report.
24
Retail Electronic Appliances Market in Greece
For the fiscal year 2005, the domestic electric and electronic household market
was estimated at € 1.30-1.35 million. The following players are active in the Greek
market:
1. Internationally recognized players like Dixons (through its participation
in ‘Kotsovolos’ chain), Fnac and Media Markt that hold about 30% of
the market.
2. Large and medium domestic chains like Electoniki Athinon and Sarafidis
holding about 15%-16% market share.
3. Partnerships or joint ventures like Expert and Electronet holding about
24% market share.
4. International hypermarkets like Carrefour and Praktiker holding about
14% market share.
5. Independent stores.
It is evident the Greek market is significantly concentrated around the major
players characterized of international or domestic origination. According to market
surveys, large retail chains currently control about 50% of the total market,
whereas this share may advance to 60% in the following 2 years.
Since 1997, the annual growth of the market was estimated at 5.1% in value, while
for fiscal 2005 the annual growth reached about 2.9%. In our model, domestic
annual growth is estimated at 1.5%-2% in volume and slightly higher, at 2.5%, in
value for the next 5-year period.
We believe that in the following years, the strong competition among the leaders
of the market will put pressures on operating margins and force smaller players to
leave the market through acquisitions or withdraws. The above development is
expected to “shrink” the sector and “allow” 5-6 large chains to dominate the
market. Electroniki Athinon has the financial strategy and experience to remain a
major domestic player and enhance its market position capturing at least 20%
market share in the longer run.
VRRRRS:S:S:S: VALUATION REPORT Electroniki Athinon Group
Please see important disclosure and disclaimer statements at the end of this report.
25
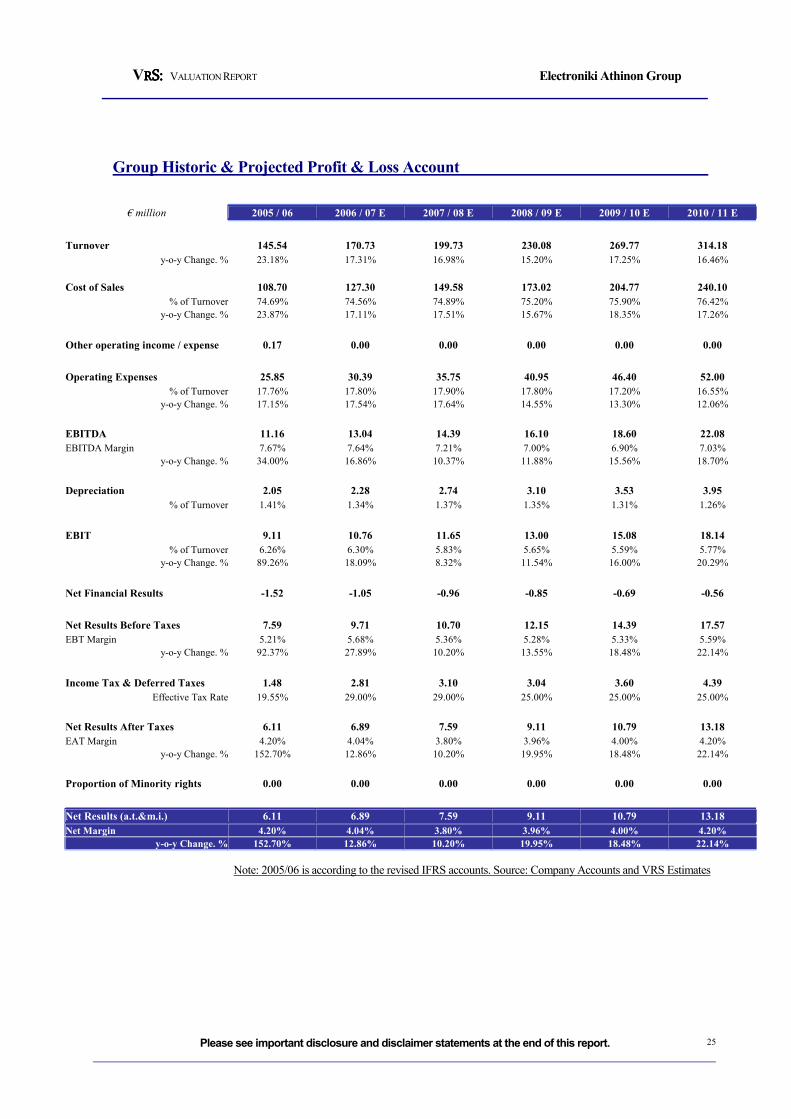
Group Historic & Projected Profit & Loss Account
€ million 2005 / 06 2006 / 07 E 2007 / 08 E 2008 / 09 E 2009 / 10 E 2010 / 11 E
Turnover 145.54 170.73 199.73 230.08 269.77 314.18
y-o-y Change. % 23.18% 17.31% 16.98% 15.20% 17.25% 16.46%
Cost of Sales 108.70 127.30 149.58 173.02 204.77 240.10
% of Turnover 74.69% 74.56% 74.89% 75.20% 75.90% 76.42%
y-o-y Change. % 23.87% 17.11% 17.51% 15.67% 18.35% 17.26%
Other operating income / expense 0.17 0.00 0.00 0.00 0.00 0.00
Operating Expenses 25.85 30.39 35.75 40.95 46.40 52.00
% of Turnover 17.76% 17.80% 17.90% 17.80% 17.20% 16.55%
y-o-y Change. % 17.15% 17.54% 17.64% 14.55% 13.30% 12.06%
EBITDA 11.16 13.04 14.39 16.10 18.60 22.08
EBITDA Margin 7.67% 7.64% 7.21% 7.00% 6.90% 7.03%
y-o-y Change. % 34.00% 16.86% 10.37% 11.88% 15.56% 18.70%
Depreciation 2.05 2.28 2.74 3.10 3.53 3.95
% of Turnover 1.41% 1.34% 1.37% 1.35% 1.31% 1.26%
EBIT 9.11 10.76 11.65 13.00 15.08 18.14
% of Turnover 6.26% 6.30% 5.83% 5.65% 5.59% 5.77%
y-o-y Change. % 89.26% 18.09% 8.32% 11.54% 16.00% 20.29%
Net Financial Results -1.52 -1.05 -0.96 -0.85 -0.69 -0.56
Net Results Before Taxes 7.59 9.71 10.70 12.15 14.39 17.57
EBT Margin 5.21% 5.68% 5.36% 5.28% 5.33% 5.59%
y-o-y Change. % 92.37% 27.89% 10.20% 13.55% 18.48% 22.14%
Income Tax & Deferred Taxes 1.48 2.81 3.10 3.04 3.60 4.39
Effective Tax Rate 19.55% 29.00% 29.00% 25.00% 25.00% 25.00%
Net Results After Taxes 6.11 6.89 7.59 9.11 10.79 13.18
EAT Margin 4.20% 4.04% 3.80% 3.96% 4.00% 4.20%
y-o-y Change. % 152.70% 12.86% 10.20% 19.95% 18.48% 22.14%
Proportion of Minority rights 0.00 0.00 0.00 0.00 0.00 0.00
Net Results (a.t.&m.i.) 6.11 6.89 7.59 9.11 10.79 13.18
Net Margin 4.20% 4.04% 3.80% 3.96% 4.00% 4.20%
y-o-y Change. % 152.70% 12.86% 10.20% 19.95% 18.48% 22.14%
Note: 2005/06 is according to the revised IFRS accounts. Source: Company Accounts and VRS Estimates
VRRRRS:S:S:S: VALUATION REPORT Electroniki Athinon Group
Please see important disclosure and disclaimer statements at the end of this report.
26
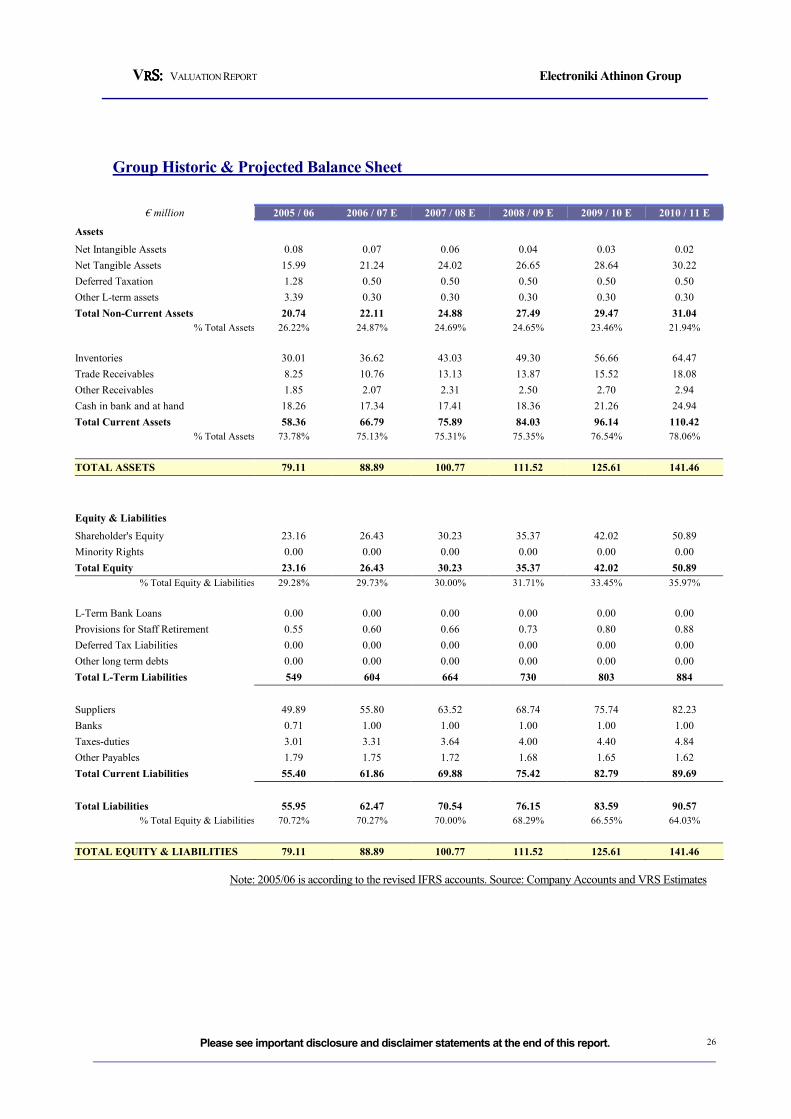
Group Historic & Projected Balance Sheet
€ million 2005 / 06 2006 / 07 E 2007 / 08 E 2008 / 09 E 2009 / 10 E 2010 / 11 E
Assets
Net Intangible Assets 0.08 0.07 0.06 0.04 0.03 0.02
Net Tangible Assets 15.99 21.24 24.02 26.65 28.64 30.22
Deferred Taxation 1.28 0.50 0.50 0.50 0.50 0.50
Other L-term assets 3.39 0.30 0.30 0.30 0.30 0.30
Total Non-Current Assets 20.74 22.11 24.88 27.49 29.47 31.04
% Total Assets 26.22% 24.87% 24.69% 24.65% 23.46% 21.94%
Inventories 30.01 36.62 43.03 49.30 56.66 64.47
Trade Receivables 8.25 10.76 13.13 13.87 15.52 18.08
Other Receivables 1.85 2.07 2.31 2.50 2.70 2.94
Cash in bank and at hand 18.26 17.34 17.41 18.36 21.26 24.94
Total Current Assets 58.36 66.79 75.89 84.03 96.14 110.42
% Total Assets 73.78% 75.13% 75.31% 75.35% 76.54% 78.06%
TOTAL ASSETS 79.11 88.89 100.77 111.52 125.61 141.46
Equity & Liabilities
Shareholder's Equity 23.16 26.43 30.23 35.37 42.02 50.89
Minority Rights 0.00 0.00 0.00 0.00 0.00 0.00
Total Equity 23.16 26.43 30.23 35.37 42.02 50.89
% Total Equity & Liabilities 29.28% 29.73% 30.00% 31.71% 33.45% 35.97%
L-Term Bank Loans 0.00 0.00 0.00 0.00 0.00 0.00
Provisions for Staff Retirement 0.55 0.60 0.66 0.73 0.80 0.88
Deferred Tax Liabilities 0.00 0.00 0.00 0.00 0.00 0.00
Other long term debts 0.00 0.00 0.00 0.00 0.00 0.00
Total L-Term Liabilities 549 604 664 730 803 884
Suppliers 49.89 55.80 63.52 68.74 75.74 82.23
Banks 0.71 1.00 1.00 1.00 1.00 1.00
Taxes-duties 3.01 3.31 3.64 4.00 4.40 4.84
Other Payables 1.79 1.75 1.72 1.68 1.65 1.62
Total Current Liabilities 55.40 61.86 69.88 75.42 82.79 89.69
Total Liabilities 55.95 62.47 70.54 76.15 83.59 90.57
% Total Equity & Liabilities 70.72% 70.27% 70.00% 68.29% 66.55% 64.03%
TOTAL EQUITY & LIABILITIES 79.11 88.89 100.77 111.52 125.61 141.46
Note: 2005/06 is according to the revised IFRS accounts. Source: Company Accounts and VRS Estimates
VRRRRS:S:S:S: VALUATION REPORT Electroniki Athinon Group
Please see important disclosure and disclaimer statements at the end of this report.
27
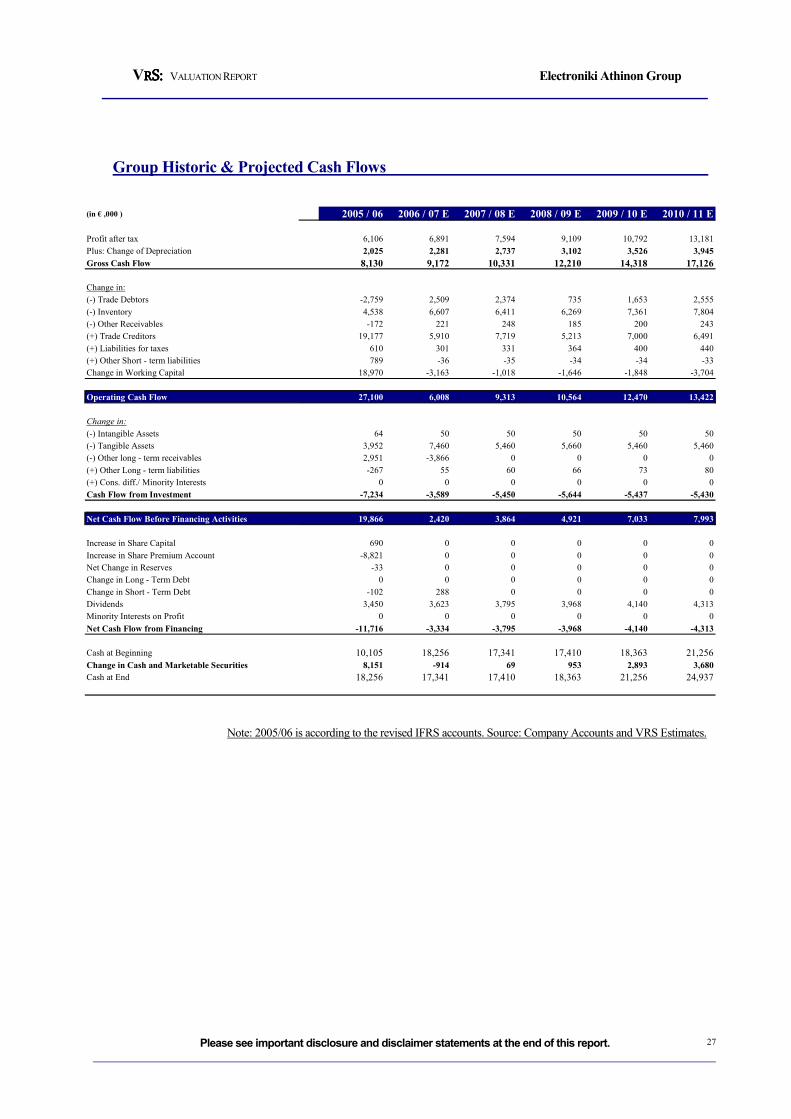
Group Historic & Projected Cash Flows
(in € ,000 ) 2005 / 06 2006 / 07 E 2007 / 08 E 2008 / 09 E 2009 / 10 E 2010 / 11 E
Profit after tax 6,106 6,891 7,594 9,109 10,792 13,181
Plus: Change of Depreciation 2,025 2,281 2,737 3,102 3,526 3,945
Gross Cash Flow 8,130 9,172 10,331 12,210 14,318 17,126
Change in:
(-) Trade Debtors -2,759 2,509 2,374 735 1,653 2,555
(-) Inventory 4,538 6,607 6,411 6,269 7,361 7,804
(-) Other Receivables -172 221 248 185 200 243
(+) Trade Creditors 19,177 5,910 7,719 5,213 7,000 6,491
(+) Liabilities for taxes 610 301 331 364 400 440
(+) Other Short - term liabilities 789 -36 -35 -34 -34 -33
Change in Working Capital 18,970 -3,163 -1,018 -1,646 -1,848 -3,704
Operating Cash Flow 27,100 6,008 9,313 10,564 12,470 13,422
Change in:
(-) Intangible Assets 64 50 50 50 50 50
(-) Tangible Assets 3,952 7,460 5,460 5,660 5,460 5,460
(-) Other long - term receivables 2,951 -3,866 0 0 0 0
(+) Other Long - term liabilities -267 55 60 66 73 80
(+) Cons. diff./ Minority Interests 0 0 0 0 0 0
Cash Flow from Investment -7,234 -3,589 -5,450 -5,644 -5,437 -5,430
Net Cash Flow Before Financing Activities 19,866 2,420 3,864 4,921 7,033 7,993
Increase in Share Capital 690 0 0 0 0 0
Increase in Share Premium Account -8,821 0 0 0 0 0
Net Change in Reserves -33 0 0 0 0 0
Change in Long - Term Debt 0 0 0 0 0 0
Change in Short - Term Debt -102 288 0 0 0 0
Dividends 3,450 3,623 3,795 3,968 4,140 4,313
Minority Interests on Profit 0 0 0 0 0 0
Net Cash Flow from Financing -11,716 -3,334 -3,795 -3,968 -4,140 -4,313
Cash at Beginning 10,105 18,256 17,341 17,410 18,363 21,256
Change in Cash and Marketable Securities 8,151 -914 69 953 2,893 3,680
Cash at End 18,256 17,341 17,410 18,363 21,256 24,937
Note: 2005/06 is according to the revised IFRS accounts. Source: Company Accounts and VRS Estimates.

VRRRRS:S:S:S: VALUATION REPORT Electroniki Athinon Group
Please see important disclosure and disclaimer statements at the end of this report.
28
Notes
VRRRRS:S:S:S: VALUATION REPORT Electroniki Athinon Group
Please see important disclosure and disclaimer statements at the end of this report.
29
Notes
VRRRRS:S:S:S: VALUATION REPORT Electroniki Athinon Group
Please see important disclosure and disclaimer statements at the end of this report.
30
DISCLOSURE STATEMENT
VALUATION & RESEARCH SPECIALISTS (VRS) is an independent firm providing advanced equity research, quality valuations and value-
related advisory services to local and international business entities and / or communities. VRS services include valuations of intangible assets,
business enterprises, and fixed assets. VRS’s focus business is in providing independent equity research to its institutional and retail clients /
subscribers.
VRS is not a brokerage firm and does not trade in securities of any kind. VRS is not an investment bank and does not act as an underwriter
for any type of securities.
VRS accepts fees from the companies it covers and researches (the “covered companies”), and from major financial institutions. The sole purpose of
this policy is to defray the cost of researching small and medium capitalization stocks which otherwise receive little research coverage. In this manner
VRS can minimize fees to its clients / subscribers and thus broaden investor’s attention to the “covered companies.”
VRS analysts are compensated on a per-company basis and not on the basis of their recommendations. Analysts are not allowed to solicit prospective
“covered companies” for research coverage by VRS and are not allowed to accept any fees or other consideration from the companies they cover for
VRS. Analysts are also not allowed to trade in the shares, warrants, convertible securities, or options of companies they cover for VRS.
Furthermore, VRS, its officers, and directors cannot trade in shares, warrants, convertible securities or options of any of the “covered companies.”
VRS accepts payment for research only in cash and will not accept payment in shares, warrants, convertible securities or options of “covered
companies” by no means.
To ensure complete independence and editorial control over its research, VRS follows certain business practices and compliance procedures, which
are also applied internationally. Among other things, fees from “covered companies” are due and payable prior to the commencement of research and,
as a contractual right, VRS retains complete editorial control over the research process and the final equity analysis report.
Information contained herein is based on data obtained from recognized statistical services, issue reports or communications, or other sources,
believed to be reliable. However, such information has not been verified by VRS, and VRS does not make any representation as to its accuracy and
completeness. Opinions, estimates, and statements nonfactual in nature expressed in its research represent VRS’s judgment as of the date of its reports,
are subject to change without notice and are provided in good faith and without legal responsibility. In addition, there may be instances when
fundamental, technical and quantitative opinions, estimates, and statements may not be in concert. Neither the information nor any opinion expressed
shall constitute an offer to sell or a solicitation of an offer to buy any shares, warrants, convertible securities or options of “covered companies” by no
means.
DISCLOSURE CHECKLIST
Covered Company Reuters Price Price Close Date Disclosure
Electroniki Athinon ELCr.AT € 5.54 27 February 2007 2,3,6
1. VRS has acted as financial consultant for the covered company within the past 24 months.
2. VRS has sent the research report to the covered company, prior to publication or dissemination, for factual verification.
3. VRS has changed the contents of the initially sent report, with respect to: guidance on financial performance and market trends.
4. VRS has received compensation from the covered company for the preparation of this research report.
5. VRS produces research reports for this company on systematic basis.
6. VRS produces research reports for this company on demand basis.
7. VRS has produced a research report for this company within the past 12 months.
COMPLIANCE WITH EU DIRECTIVES and GREEK LAWS
VRS prepares its equity research reports in a best effort to comply with the provisions of the EU Directive 2003/6/EK of the European Commission
(L 339/73/24.12.2003, L 096/16/2003), the Guidelines 2003/125/EK and the Decision 4/347/12.7.2005 of the Hellenic Capital Markets Committee,
as well as with the provisions of article 14, Greek Law 3340/2005, and the relevant clarifications with regard to the legal obligations of equity
analysts.
VRS analysts are certified by the Hellenic Capital Markets Committee. The latter may request from VRS analysts to justify their views and
conclusions with regard to this research report.
ANALYST CERTIFICATION
The views expressed in this report accurately reflect the personal views of the undersigned analyst(s) about the subject issuer and the securities of the
issuer. In addition, the undersigned lead analyst(s) has not and will not receive any compensation for providing a specific recommendation or view in
this research report.
Please contact “VALUATION & RESEARCH SPECIALISTS” for further information on Equity Research Related Fees.
VALUATION & RESEARCH SPECIALISTS
Value Invest - www.valueinvest.gr Investment Research & Analysis Journal – www.iraj.gr


![PASAL DEVELOPMENT SA [ PASAL GA ] - IRAJiraj.gr/IRAJ/PASAL_Valuation_Report_by_VRS.pdf · PASAL’s management has given VRS guidance of a 3-year development plan as well as of prospective](https://img.pdfslide.us/doc/110x75/5c8961e609d3f23d648d04bd/pasal-development-sa-pasal-ga-pasals-management-has-given-vrs-guidance.jpg)


![[Iraj Bashiri] the Samanids & the Revival of the Civilisation of Iranian Peoples_1998](https://img.pdfslide.us/doc/110x75/55cf9d3e550346d033acd4ad/iraj-bashiri-the-samanids-the-revival-of-the-civilisation-of-iranian-peoples1998.jpg)