Embed Size (px)
Citation preview
1 1 For updated information, please visit www.ibef.org
Electronics AUGUST
2012
2 2
Contents
Advantage India
Market overview and trends
Growth drivers
Success stories: BEL, Videocon
Opportunities
Useful information
For updated information, please visit www.ibef.org
Electronics AUGUST
2012
3 3
Electronics
For updated information, please visit www.ibef.org ADVANTAGE INDIA
Advantage India
AUGUST
2012
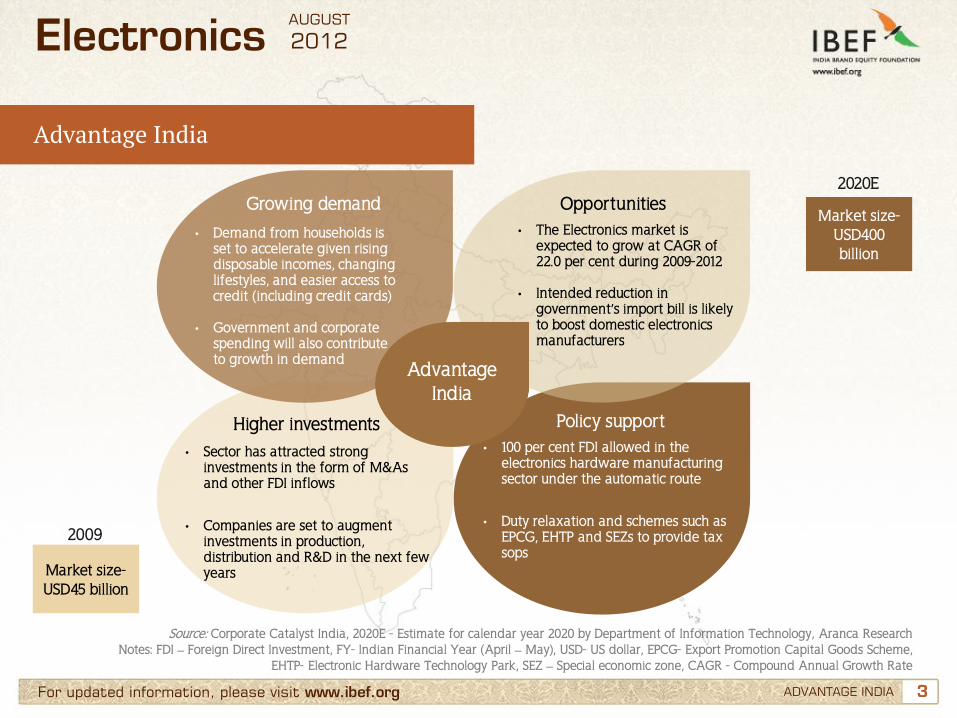
Advantage India
• Demand from households is set to accelerate given rising disposable incomes, changing lifestyles, and easier access to credit (including credit cards)
• Government and corporate spending will also contribute to growth in demand
• The Electronics market is expected to grow at CAGR of 22.0 per cent during 2009-2012
• Intended reduction in government’s import bill is likely to boost domestic electronics manufacturers
• Sector has attracted strong investments in the form of M&As and other FDI inflows
• Companies are set to augment investments in production, distribution and R&D in the next few years
• 100 per cent FDI allowed in the electronics hardware manufacturing sector under the automatic route
• Duty relaxation and schemes such as EPCG, EHTP and SEZs to provide tax sops
Market size- USD400 billion
2020E
Market size- USD45 billion
2009
Source: Corporate Catalyst India, 2020E - Estimate for calendar year 2020 by Department of Information Technology, Aranca Research Notes: FDI – Foreign Direct Investment, FY- Indian Financial Year (April – May), USD- US dollar, EPCG- Export Promotion Capital Goods Scheme,
EHTP- Electronic Hardware Technology Park, SEZ – Special economic zone, CAGR - Compound Annual Growth Rate
Growing demand Opportunities
Higher investments Policy support
4 4
Contents
Advantage India
Market overview and trends
Growth drivers
Success stories: BEL, Videocon
Opportunities
Useful information
For updated information, please visit www.ibef.org
Electronics AUGUST
2012
5 5 For updated information, please visit www.ibef.org MARKET OVERVIEW AND TRENDS
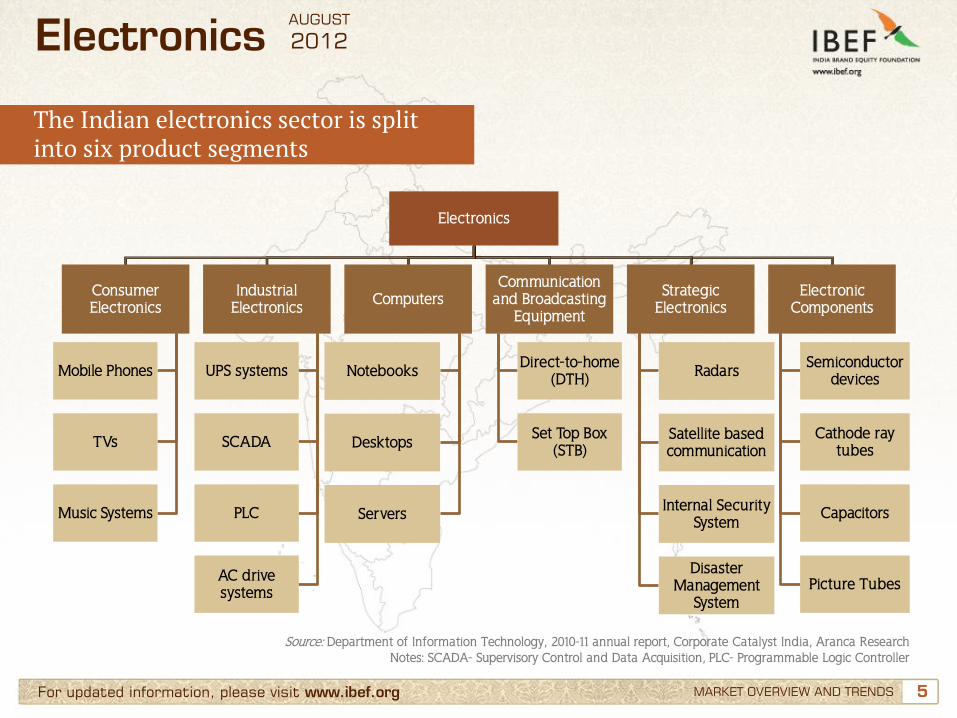
The Indian electronics sector is split into six product segments
Source: Department of Information Technology, 2010-11 annual report, Corporate Catalyst India, Aranca Research Notes: SCADA- Supervisory Control and Data Acquisition, PLC- Programmable Logic Controller
Electronics
Consumer Electronics
Mobile Phones
TVs
Music Systems
Industrial Electronics
UPS systems
SCADA
PLC
AC drive systems
Computers
Notebooks
Desktops
Servers
Communication and Broadcasting
Equipment
Direct-to-home (DTH)
Set Top Box (STB)
Strategic Electronics
Radars
Satellite based communication
Internal Security System
Disaster Management
System
Electronic Components
Semiconductor devices
Cathode ray tubes
Capacitors
Picture Tubes
Electronics AUGUST
2012
6 6 For updated information, please visit www.ibef.org
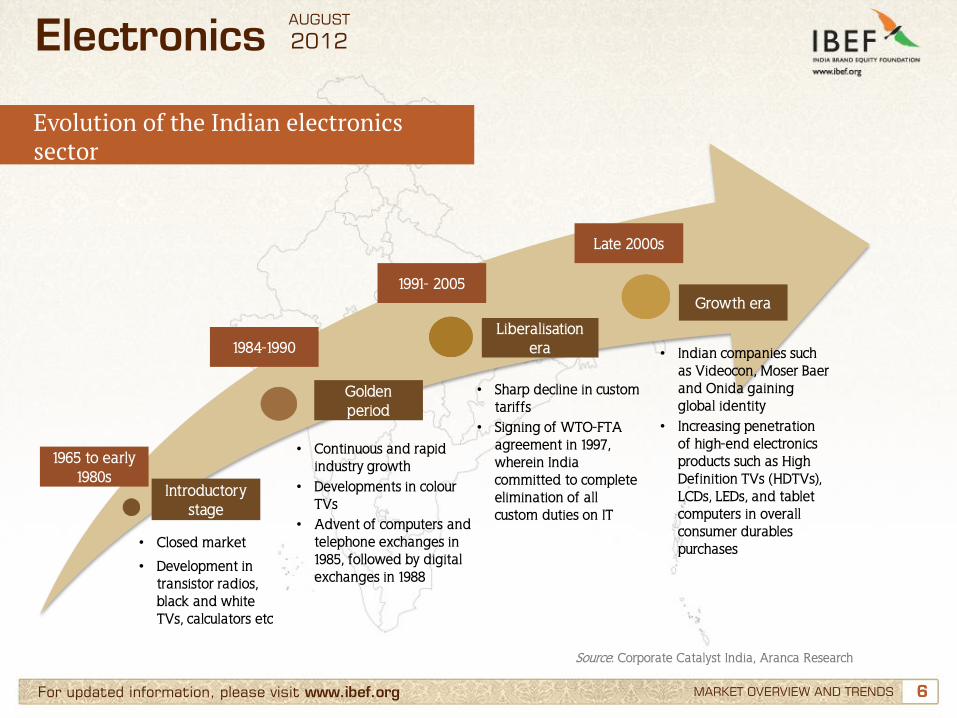
Evolution of the Indian electronics sector
MARKET OVERVIEW AND TRENDS
• Closed market
• Development in transistor radios, black and white TVs, calculators etc
• Continuous and rapid industry growth
• Developments in colour TVs
• Advent of computers and telephone exchanges in 1985, followed by digital exchanges in 1988
• Sharp decline in custom
tariffs • Signing of WTO-FTA
agreement in 1997, wherein India committed to complete elimination of all custom duties on IT
• Indian companies such as Videocon, Moser Baer and Onida gaining global identity
• Increasing penetration of high-end electronics products such as High Definition TVs (HDTVs), LCDs, LEDs, and tablet computers in overall consumer durables purchases
Source: Corporate Catalyst India, Aranca Research
Introductory stage
1984-1990
Golden period
1991- 2005
Liberalisation era
Late 2000s
Growth era
1965 to early 1980s
Electronics AUGUST
2012
7 7
13.8 17.6
20.3
23.1 26.8
29.9
0.0
5.0
10.0
15.0
20.0
25.0
30.0
35.0
FY07 FY08 FY09 FY10 FY11 FY12
For updated information, please visit www.ibef.org
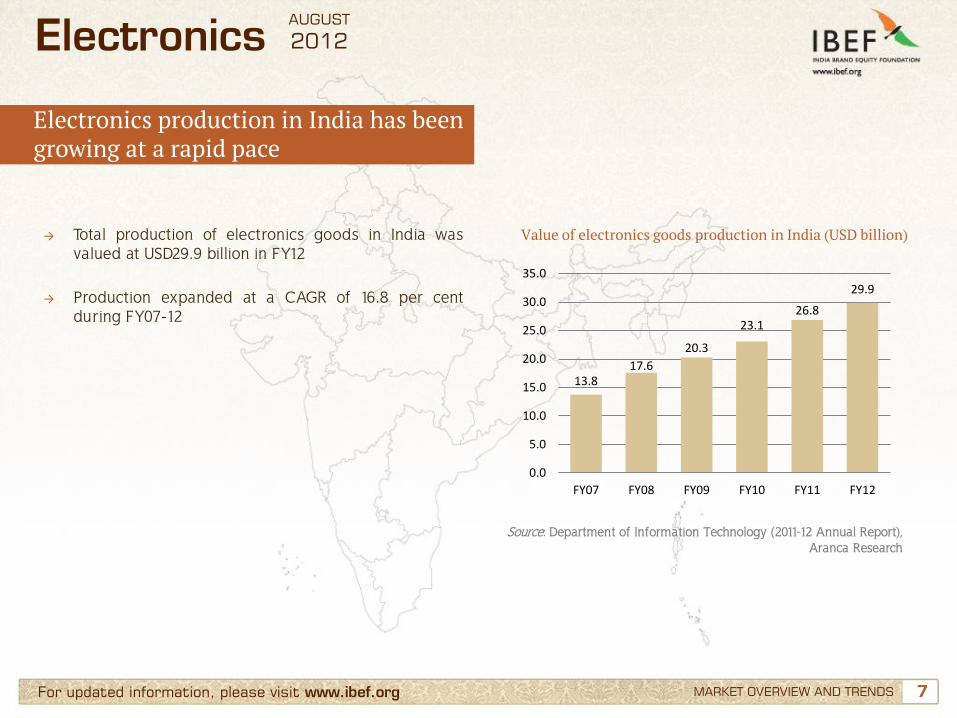
Electronics production in India has been growing at a rapid pace
→ Total production of electronics goods in India was valued at USD29.9 billion in FY12
→ Production expanded at a CAGR of 16.8 per cent during FY07-12
Value of electronics goods production in India (USD billion)
Source: Department of Information Technology (2011-12 Annual Report), Aranca Research
MARKET OVERVIEW AND TRENDS
Electronics AUGUST
2012
8 8 For updated information, please visit www.ibef.org
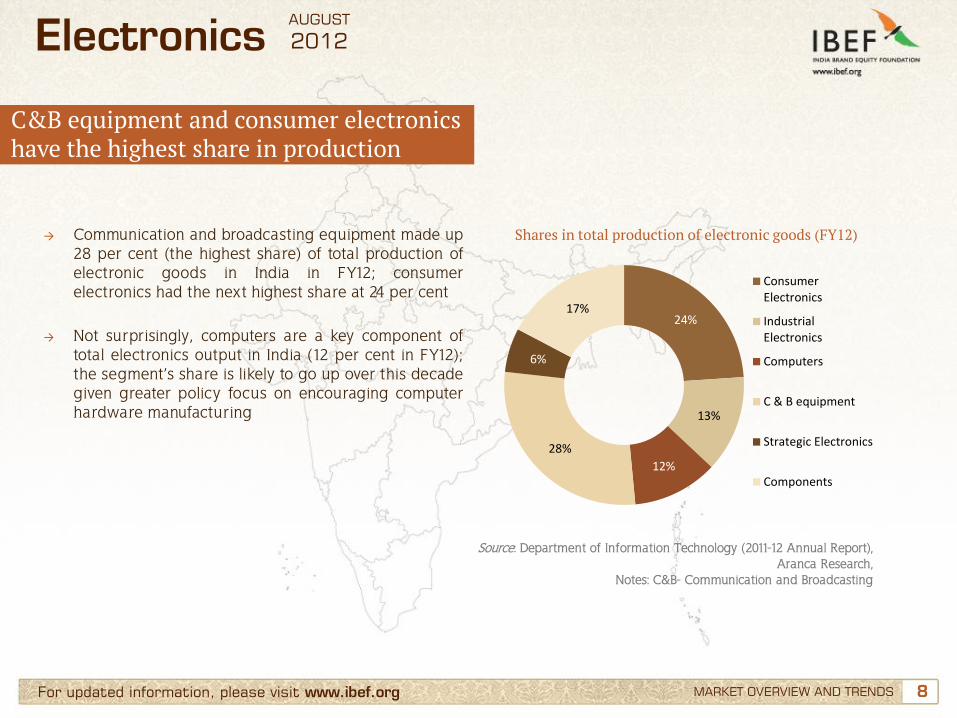
C&B equipment and consumer electronics have the highest share in production
→ Communication and broadcasting equipment made up 28 per cent (the highest share) of total production of electronic goods in India in FY12; consumer electronics had the next highest share at 24 per cent
→ Not surprisingly, computers are a key component of total electronics output in India (12 per cent in FY12); the segment’s share is likely to go up over this decade given greater policy focus on encouraging computer hardware manufacturing
Shares in total production of electronic goods (FY12)
Source: Department of Information Technology (2011-12 Annual Report), Aranca Research,
Notes: C&B- Communication and Broadcasting
MARKET OVERVIEW AND TRENDS
24%
13%
12%
28%
6%
17%
ConsumerElectronics
IndustrialElectronics
Computers
C & B equipment
Strategic Electronics
Components
Electronics AUGUST
2012
9 9 For updated information, please visit www.ibef.org
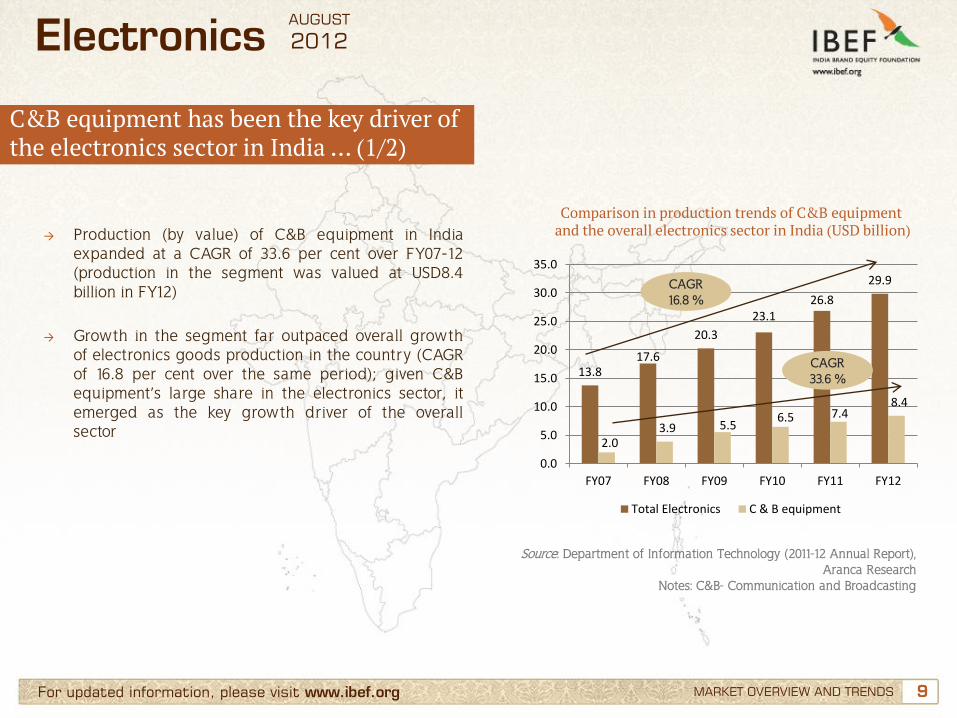
C&B equipment has been the key driver of the electronics sector in India ... (1/2)
→ Production (by value) of C&B equipment in India expanded at a CAGR of 33.6 per cent over FY07-12 (production in the segment was valued at USD8.4 billion in FY12)
→ Growth in the segment far outpaced overall growth of electronics goods production in the country (CAGR of 16.8 per cent over the same period); given C&B equipment’s large share in the electronics sector, it emerged as the key growth driver of the overall sector
Comparison in production trends of C&B equipment and the overall electronics sector in India (USD billion)
Source: Department of Information Technology (2011-12 Annual Report), Aranca Research
Notes: C&B- Communication and Broadcasting
MARKET OVERVIEW AND TRENDS
13.8 17.6
20.3
23.1 26.8
29.9
2.0 3.9 5.5
6.5 7.4 8.4
0.0
5.0
10.0
15.0
20.0
25.0
30.0
35.0
FY07 FY08 FY09 FY10 FY11 FY12
Total Electronics C & B equipment
CAGR 16.8 %
CAGR 33.6 %
Electronics AUGUST
2012
10 10 For updated information, please visit www.ibef.org
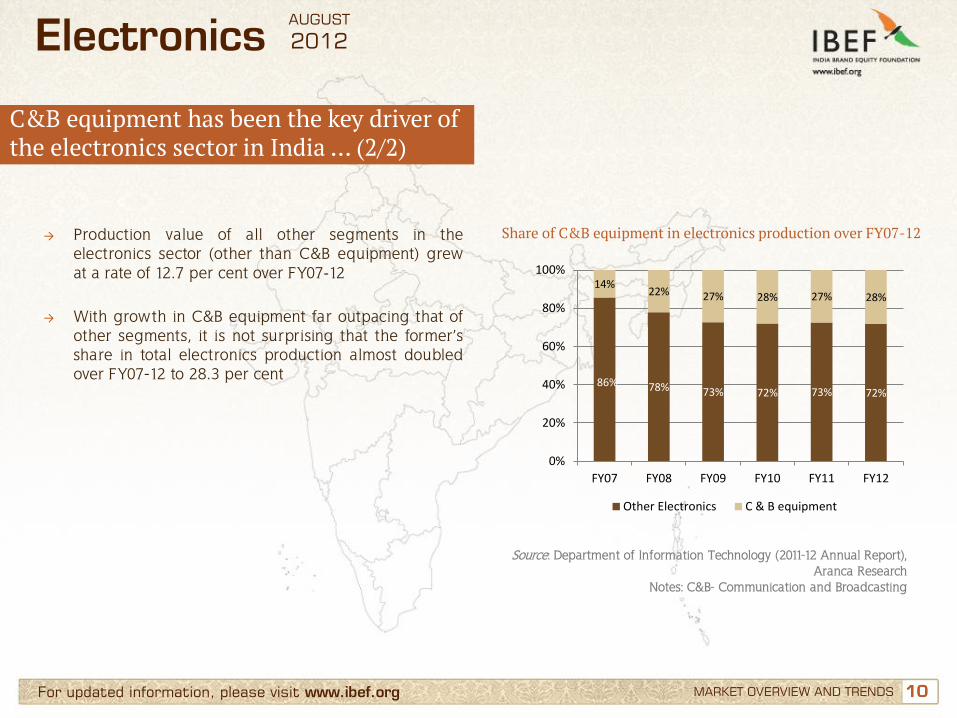
→ Production value of all other segments in the electronics sector (other than C&B equipment) grew at a rate of 12.7 per cent over FY07-12
→ With growth in C&B equipment far outpacing that of other segments, it is not surprising that the former’s share in total electronics production almost doubled over FY07-12 to 28.3 per cent
Share of C&B equipment in electronics production over FY07-12
Source: Department of Information Technology (2011-12 Annual Report), Aranca Research
Notes: C&B- Communication and Broadcasting
MARKET OVERVIEW AND TRENDS
C&B equipment has been the key driver of the electronics sector in India … (2/2)
86% 78% 73% 72% 73% 72%
14% 22% 27% 28% 27% 28%
0%
20%
40%
60%
80%
100%
FY07 FY08 FY09 FY10 FY11 FY12
Other Electronics C & B equipment
Electronics AUGUST
2012
11 11 For updated information, please visit www.ibef.org
Electronics exports from India have outpaced total production in the sector
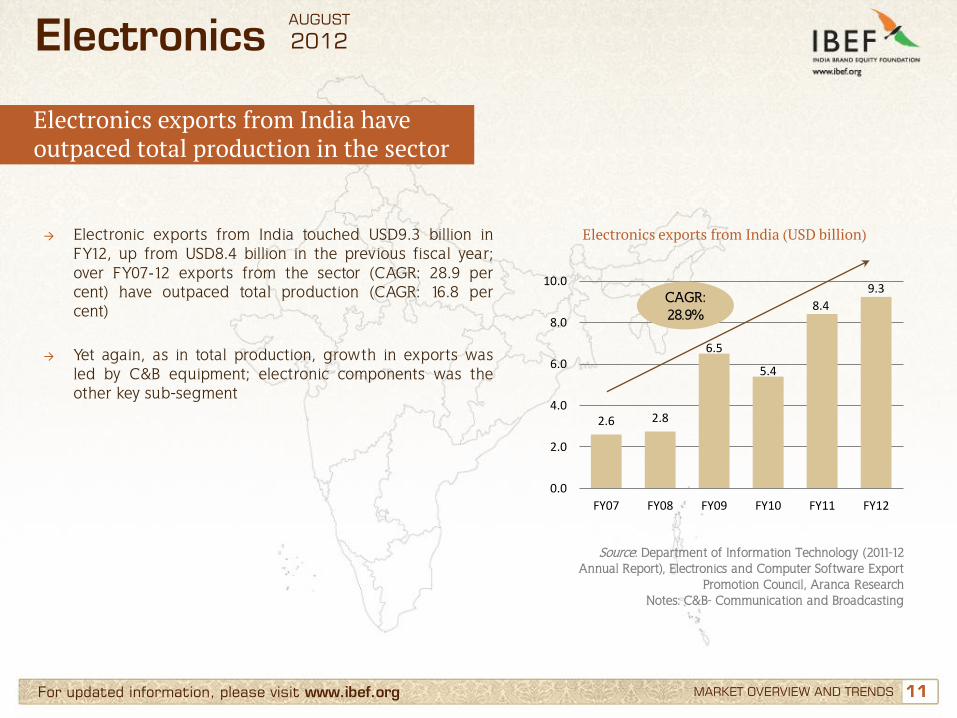
→ Electronic exports from India touched USD9.3 billion in FY12, up from USD8.4 billion in the previous fiscal year; over FY07-12 exports from the sector (CAGR: 28.9 per cent) have outpaced total production (CAGR: 16.8 per cent)
→ Yet again, as in total production, growth in exports was led by C&B equipment; electronic components was the other key sub-segment
Electronics exports from India (USD billion)
Source: Department of Information Technology (2011-12 Annual Report), Electronics and Computer Software Export
Promotion Council, Aranca Research Notes: C&B- Communication and Broadcasting
MARKET OVERVIEW AND TRENDS
2.6 2.8
6.5
5.4
8.4
9.3
0.0
2.0
4.0
6.0
8.0
10.0
FY07 FY08 FY09 FY10 FY11 FY12
CAGR: 28.9%
Electronics AUGUST
2012
12 12 For updated information, please visit www.ibef.org
Large shares for C&B equipment and components in total electronics exports
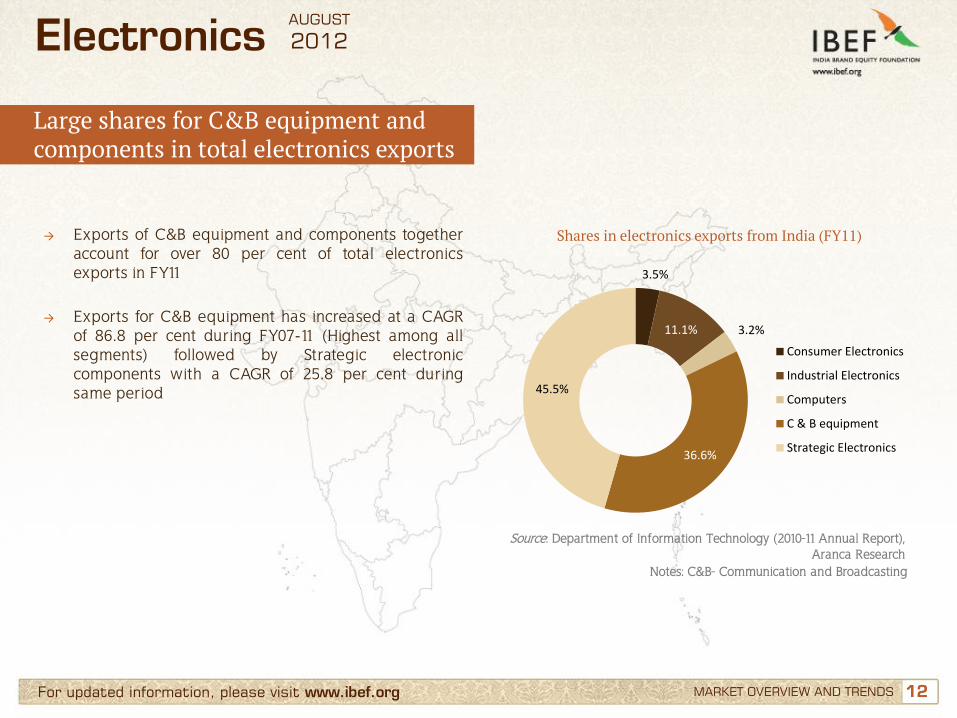
→ Exports of C&B equipment and components together account for over 80 per cent of total electronics exports in FY11
→ Exports for C&B equipment has increased at a CAGR of 86.8 per cent during FY07-11 (Highest among all segments) followed by Strategic electronic components with a CAGR of 25.8 per cent during same period
Shares in electronics exports from India (FY11)
Source: Department of Information Technology (2010-11 Annual Report), Aranca Research
MARKET OVERVIEW AND TRENDS
Notes: C&B- Communication and Broadcasting
3.5%
11.1% 3.2%
36.6%
45.5%
Consumer Electronics
Industrial Electronics
Computers
C & B equipment
Strategic Electronics
Electronics AUGUST
2012
13 13 For updated information, please visit www.ibef.org
Key players in the electronics sector … (1/2)
MARKET OVERVIEW AND TRENDS
Company Business description
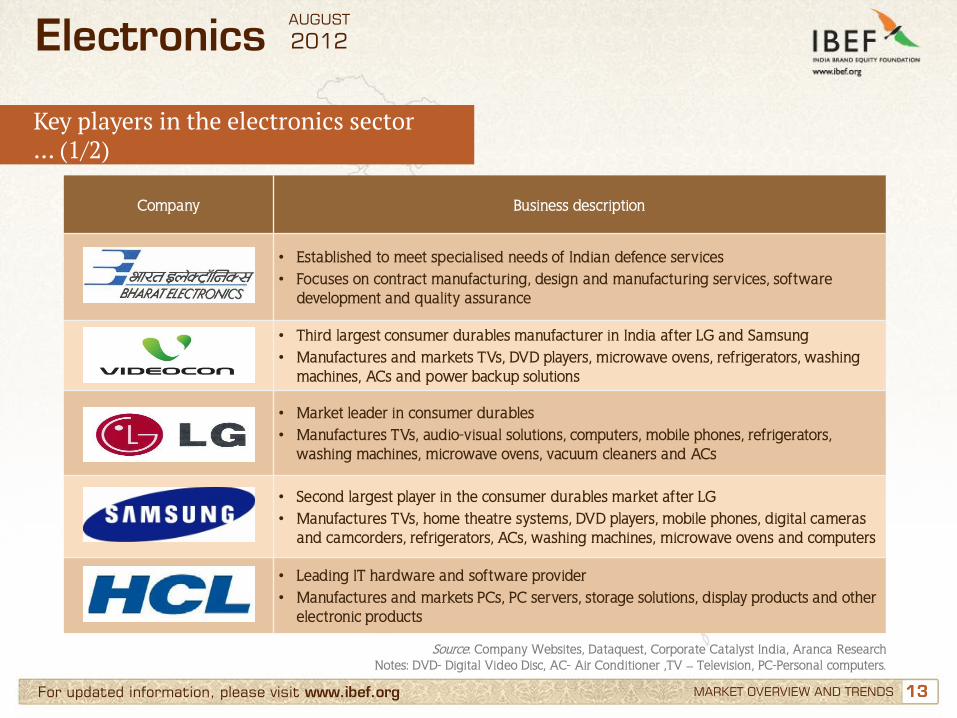
• Established to meet specialised needs of Indian defence services • Focuses on contract manufacturing, design and manufacturing services, software
development and quality assurance
• Third largest consumer durables manufacturer in India after LG and Samsung • Manufactures and markets TVs, DVD players, microwave ovens, refrigerators, washing
machines, ACs and power backup solutions
• Market leader in consumer durables • Manufactures TVs, audio-visual solutions, computers, mobile phones, refrigerators,
washing machines, microwave ovens, vacuum cleaners and ACs
• Second largest player in the consumer durables market after LG • Manufactures TVs, home theatre systems, DVD players, mobile phones, digital cameras
and camcorders, refrigerators, ACs, washing machines, microwave ovens and computers
• Leading IT hardware and software provider • Manufactures and markets PCs, PC servers, storage solutions, display products and other
electronic products
Source: Company Websites, Dataquest, Corporate Catalyst India, Aranca Research Notes: DVD- Digital Video Disc, AC- Air Conditioner ,TV – Television, PC-Personal computers.
Electronics AUGUST
2012
14 14 For updated information, please visit www.ibef.org
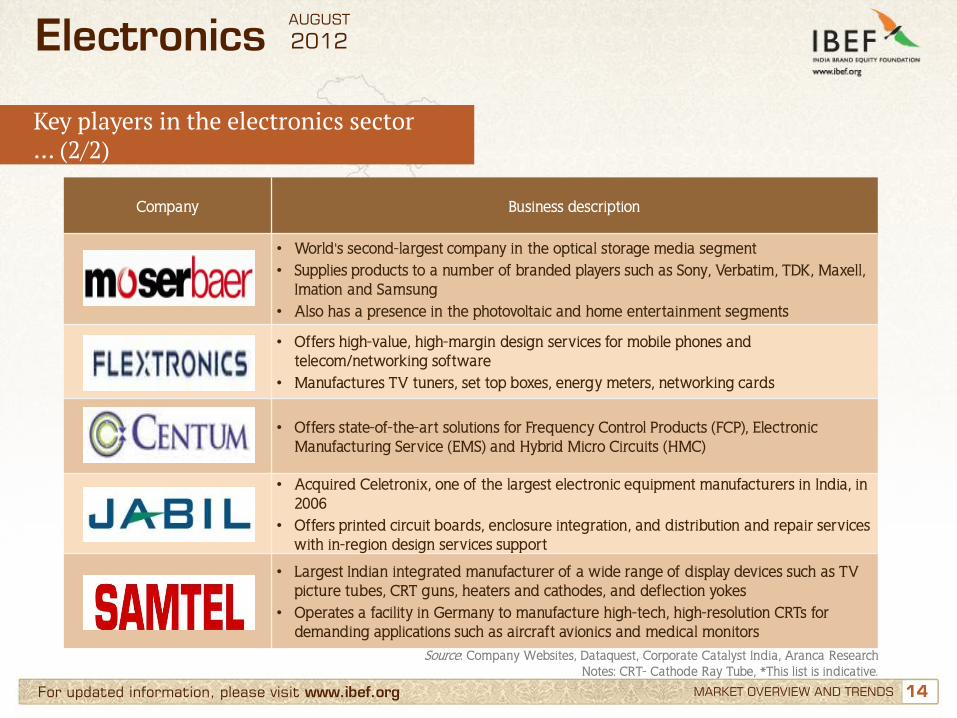
Key players in the electronics sector … (2/2)
MARKET OVERVIEW AND TRENDS
Company Business description
• World's second-largest company in the optical storage media segment • Supplies products to a number of branded players such as Sony, Verbatim, TDK, Maxell,
Imation and Samsung • Also has a presence in the photovoltaic and home entertainment segments
• Offers high-value, high-margin design services for mobile phones and
telecom/networking software • Manufactures TV tuners, set top boxes, energy meters, networking cards
• Offers state-of-the-art solutions for Frequency Control Products (FCP), Electronic
Manufacturing Service (EMS) and Hybrid Micro Circuits (HMC)
• Acquired Celetronix, one of the largest electronic equipment manufacturers in India, in 2006
• Offers printed circuit boards, enclosure integration, and distribution and repair services with in-region design services support
• Largest Indian integrated manufacturer of a wide range of display devices such as TV
picture tubes, CRT guns, heaters and cathodes, and deflection yokes • Operates a facility in Germany to manufacture high-tech, high-resolution CRTs for
demanding applications such as aircraft avionics and medical monitors
Source: Company Websites, Dataquest, Corporate Catalyst India, Aranca Research Notes: CRT- Cathode Ray Tube, *This list is indicative.
Electronics AUGUST
2012
15 15 For updated information, please visit www.ibef.org
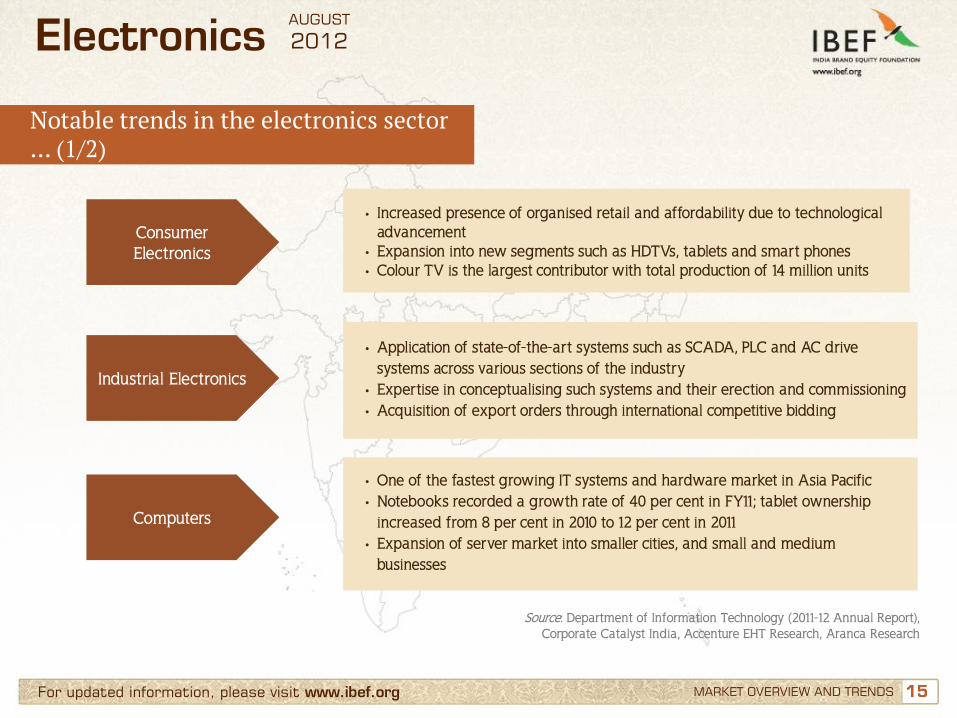
Notable trends in the electronics sector … (1/2)
MARKET OVERVIEW AND TRENDS
Consumer Electronics
• Increased presence of organised retail and affordability due to technological advancement
• Expansion into new segments such as HDTVs, tablets and smart phones • Colour TV is the largest contributor with total production of 14 million units
Industrial Electronics
• Application of state-of-the-art systems such as SCADA, PLC and AC drive systems across various sections of the industry
• Expertise in conceptualising such systems and their erection and commissioning • Acquisition of export orders through international competitive bidding
Computers
• One of the fastest growing IT systems and hardware market in Asia Pacific • Notebooks recorded a growth rate of 40 per cent in FY11; tablet ownership
increased from 8 per cent in 2010 to 12 per cent in 2011 • Expansion of server market into smaller cities, and small and medium
businesses
Source: Department of Information Technology (2011-12 Annual Report), Corporate Catalyst India, Accenture EHT Research, Aranca Research
Electronics AUGUST
2012
16 16 For updated information, please visit www.ibef.org
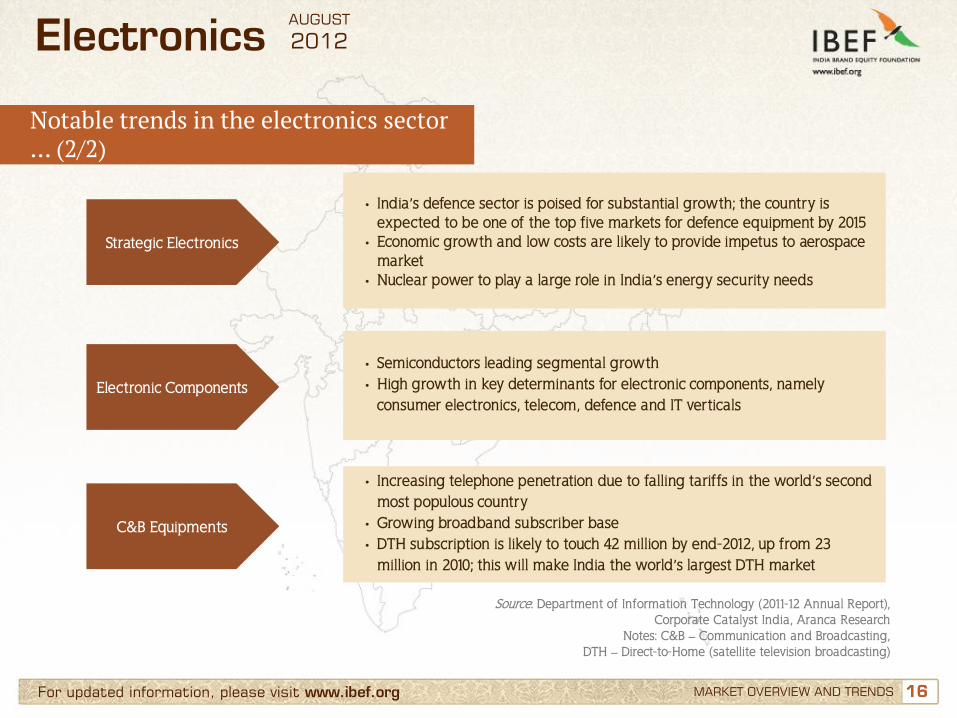
Notable trends in the electronics sector … (2/2)
MARKET OVERVIEW AND TRENDS
Strategic Electronics
• India’s defence sector is poised for substantial growth; the country is expected to be one of the top five markets for defence equipment by 2015
• Economic growth and low costs are likely to provide impetus to aerospace market
• Nuclear power to play a large role in India’s energy security needs
Electronic Components
• Semiconductors leading segmental growth • High growth in key determinants for electronic components, namely
consumer electronics, telecom, defence and IT verticals
C&B Equipments
• Increasing telephone penetration due to falling tariffs in the world’s second most populous country
• Growing broadband subscriber base • DTH subscription is likely to touch 42 million by end-2012, up from 23
million in 2010; this will make India the world’s largest DTH market
Source: Department of Information Technology (2011-12 Annual Report), Corporate Catalyst India, Aranca Research
Notes: C&B – Communication and Broadcasting, DTH – Direct-to-Home (satellite television broadcasting)
Electronics AUGUST
2012
17 17
Contents
Advantage India
Market overview and trends
Growth drivers
Success stories: BEL, Videocon
Opportunities
Useful information
For updated information, please visit www.ibef.org
Electronics AUGUST
2012

18 18 For updated information, please visit www.ibef.org GROWTH DRIVERS
Strong demand and policy support driving investments
Strong
government
support
Growing demand
Inviting Resulting
in
Growing demand Increasing investments Policy support
Higher real disposable
incomes, easy consumer credit
Falling prices, increasing penetration
Growing consumer and industrial base
Setting up of EHTPs, SEZs,
favourable FDI climate
Increasing liberalisation,
tariff relaxation
Draft National Policy on
electronics, 2011
Expanding production and
distribution facilities in India
Increased R&D activity
Providing support to global projects
from India
Source : Aranca Research Notes: EHTP- Electronic Hardware Technology Park, SEZ- Special Economic Zone, FDI-
Foreign Direct Investment, R&D- Research and Development
Electronics AUGUST
2012
19 19 For updated information, please visit www.ibef.org
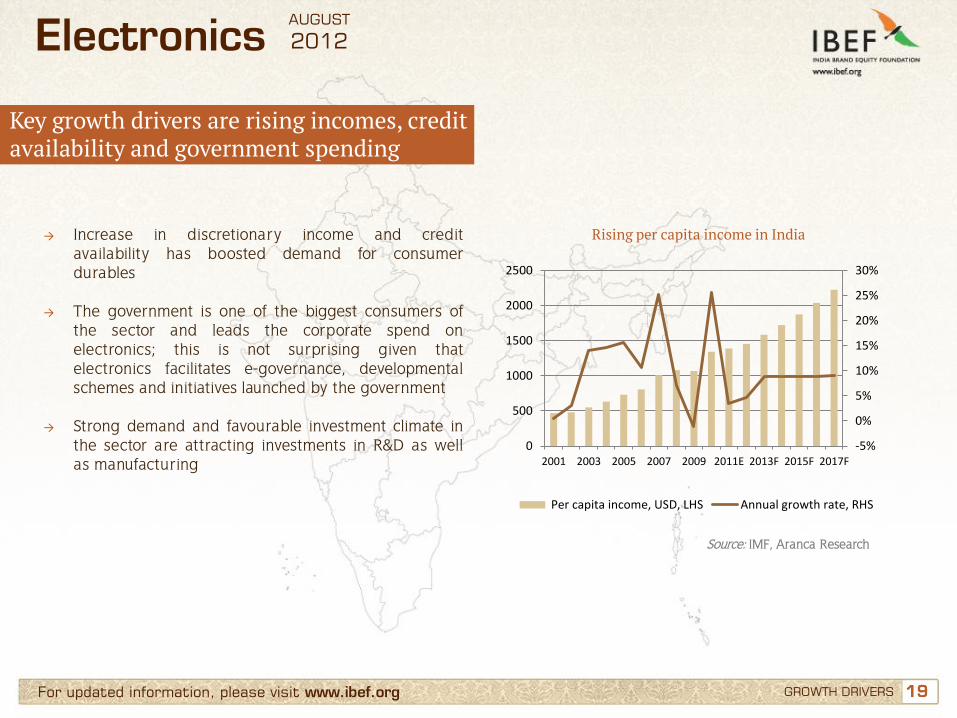
Key growth drivers are rising incomes, credit availability and government spending
GROWTH DRIVERS
Rising per capita income in India
Source: IMF, Aranca Research
→ Increase in discretionary income and credit availability has boosted demand for consumer durables
→ The government is one of the biggest consumers of the sector and leads the corporate spend on electronics; this is not surprising given that electronics facilitates e-governance, developmental schemes and initiatives launched by the government
→ Strong demand and favourable investment climate in the sector are attracting investments in R&D as well as manufacturing
-5%
0%
5%
10%
15%
20%
25%
30%
0
500
1000
1500
2000
2500
2001 2003 2005 2007 2009 2011E 2013F 2015F 2017F
Per capita income, USD, LHS Annual growth rate, RHS
Electronics AUGUST
2012
20 20 For updated information, please visit www.ibef.org
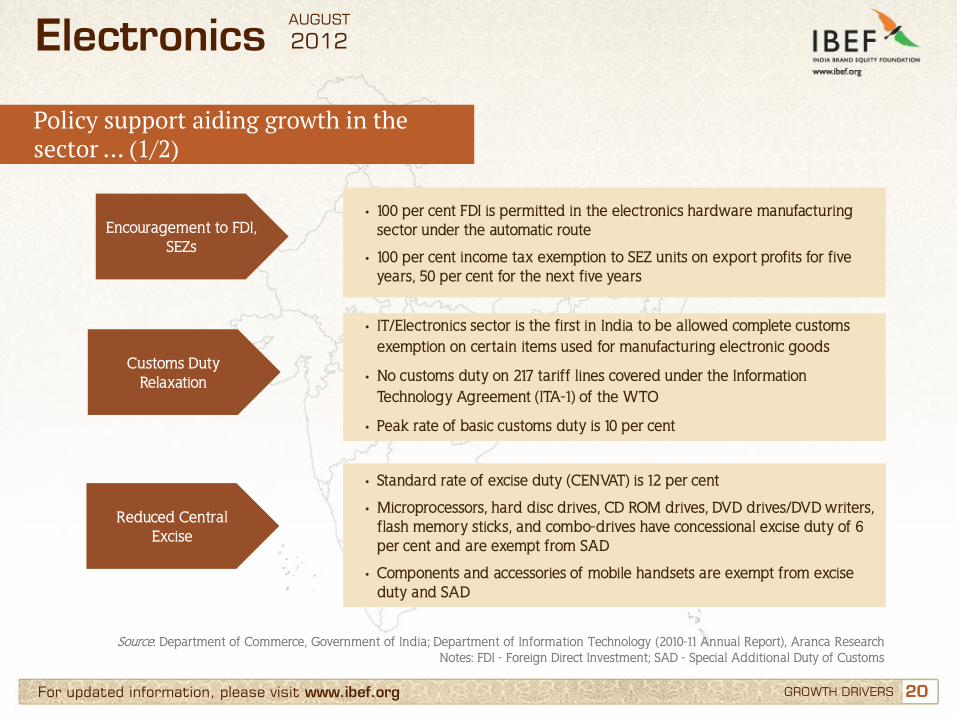
Policy support aiding growth in the sector … (1/2)
GROWTH DRIVERS
Encouragement to FDI, SEZs
• 100 per cent FDI is permitted in the electronics hardware manufacturing sector under the automatic route
• 100 per cent income tax exemption to SEZ units on export profits for five years, 50 per cent for the next five years
Customs Duty Relaxation
• IT/Electronics sector is the first in India to be allowed complete customs exemption on certain items used for manufacturing electronic goods
• No customs duty on 217 tariff lines covered under the Information Technology Agreement (ITA-1) of the WTO
• Peak rate of basic customs duty is 10 per cent
Reduced Central Excise
• Standard rate of excise duty (CENVAT) is 12 per cent
• Microprocessors, hard disc drives, CD ROM drives, DVD drives/DVD writers, flash memory sticks, and combo-drives have concessional excise duty of 6 per cent and are exempt from SAD
• Components and accessories of mobile handsets are exempt from excise duty and SAD
Source: Department of Commerce, Government of India; Department of Information Technology (2010-11 Annual Report), Aranca Research Notes: FDI - Foreign Direct Investment; SAD - Special Additional Duty of Customs
Electronics AUGUST
2012
21 21 For updated information, please visit www.ibef.org
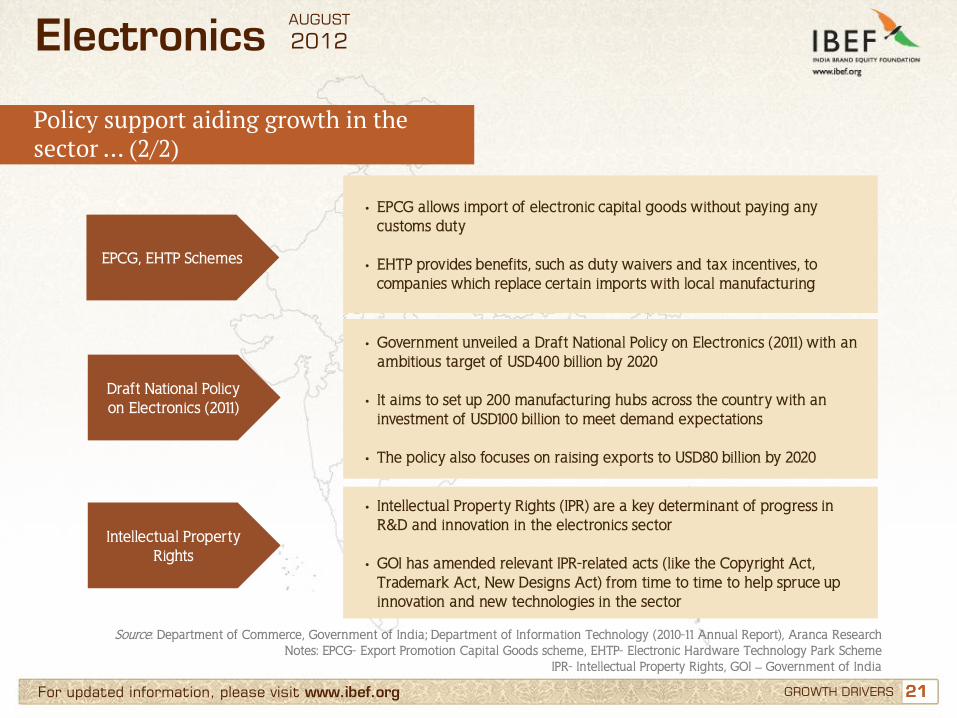
Policy support aiding growth in the sector … (2/2)
GROWTH DRIVERS
EPCG, EHTP Schemes
• EPCG allows import of electronic capital goods without paying any customs duty
• EHTP provides benefits, such as duty waivers and tax incentives, to
companies which replace certain imports with local manufacturing
Draft National Policy on Electronics (2011)
• Government unveiled a Draft National Policy on Electronics (2011) with an ambitious target of USD400 billion by 2020
• It aims to set up 200 manufacturing hubs across the country with an investment of USD100 billion to meet demand expectations
• The policy also focuses on raising exports to USD80 billion by 2020
Source: Department of Commerce, Government of India; Department of Information Technology (2010-11 Annual Report), Aranca Research Notes: EPCG- Export Promotion Capital Goods scheme, EHTP- Electronic Hardware Technology Park Scheme
IPR- Intellectual Property Rights, GOI – Government of India
Intellectual Property Rights
• Intellectual Property Rights (IPR) are a key determinant of progress in R&D and innovation in the electronics sector
• GOI has amended relevant IPR-related acts (like the Copyright Act, Trademark Act, New Designs Act) from time to time to help spruce up innovation and new technologies in the sector
Electronics AUGUST
2012
22 22 For updated information, please visit www.ibef.org
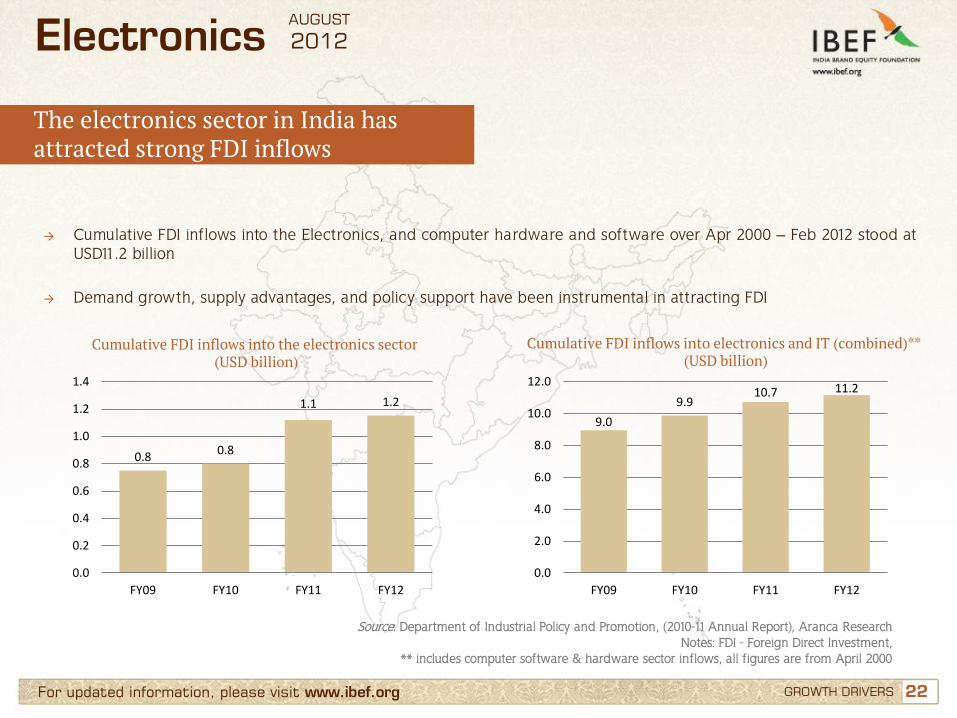
The electronics sector in India has attracted strong FDI inflows
→ Cumulative FDI inflows into the Electronics, and computer hardware and software over Apr 2000 – Feb 2012 stood at USD11.2 billion
→ Demand growth, supply advantages, and policy support have been instrumental in attracting FDI
Cumulative FDI inflows into electronics and IT (combined)** (USD billion)
Source: Department of Industrial Policy and Promotion, (2010-11 Annual Report), Aranca Research Notes: FDI - Foreign Direct Investment,
** includes computer software & hardware sector inflows, all figures are from April 2000
GROWTH DRIVERS
9.0
9.9 10.7 11.2
0.0
2.0
4.0
6.0
8.0
10.0
12.0
FY09 FY10 FY11 FY12
Cumulative FDI inflows into the electronics sector (USD billion)
0.8 0.8
1.1 1.2
0.0
0.2
0.4
0.6
0.8
1.0
1.2
1.4
FY09 FY10 FY11 FY12
Electronics AUGUST
2012
23 23 For updated information, please visit www.ibef.org
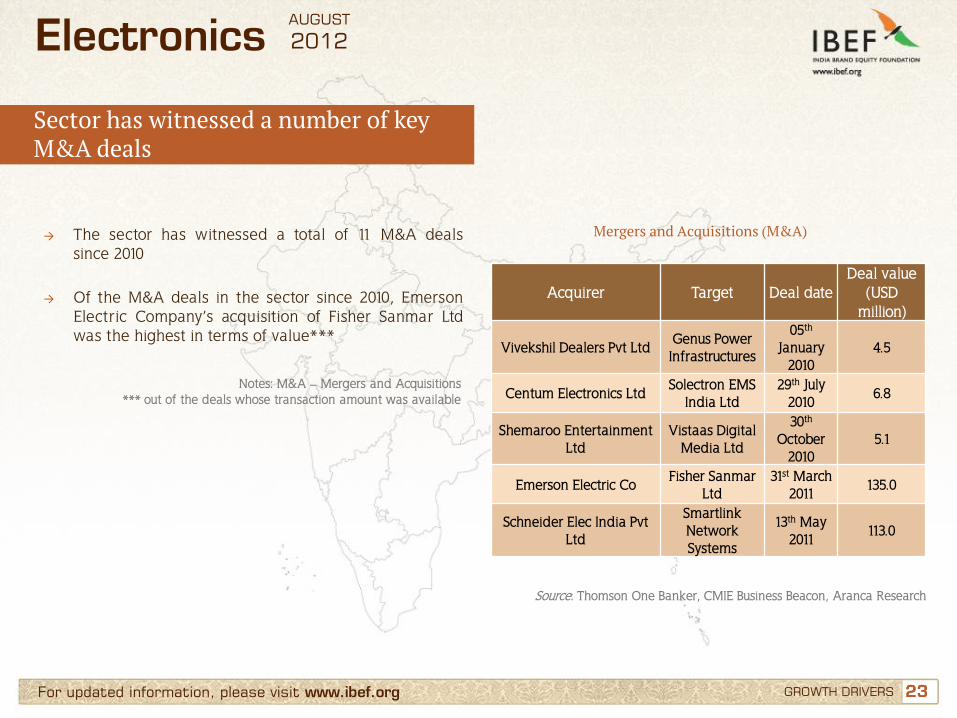
Sector has witnessed a number of key M&A deals
→ The sector has witnessed a total of 11 M&A deals since 2010
→ Of the M&A deals in the sector since 2010, Emerson Electric Company’s acquisition of Fisher Sanmar Ltd was the highest in terms of value***
Mergers and Acquisitions (M&A)
Source: Thomson One Banker, CMIE Business Beacon, Aranca Research
Notes: M&A – Mergers and Acquisitions *** out of the deals whose transaction amount was available
GROWTH DRIVERS
Acquirer Target Deal date Deal value
(USD million)
Vivekshil Dealers Pvt Ltd Genus Power Infrastructures
05th January
2010 4.5
Centum Electronics Ltd Solectron EMS
India Ltd 29th July
2010 6.8
Shemaroo Entertainment Ltd
Vistaas Digital Media Ltd
30th October
2010 5.1
Emerson Electric Co Fisher Sanmar
Ltd 31st March
2011 135.0
Schneider Elec India Pvt Ltd
Smartlink Network Systems
13th May 2011
113.0
Electronics AUGUST
2012
24 24 For updated information, please visit www.ibef.org
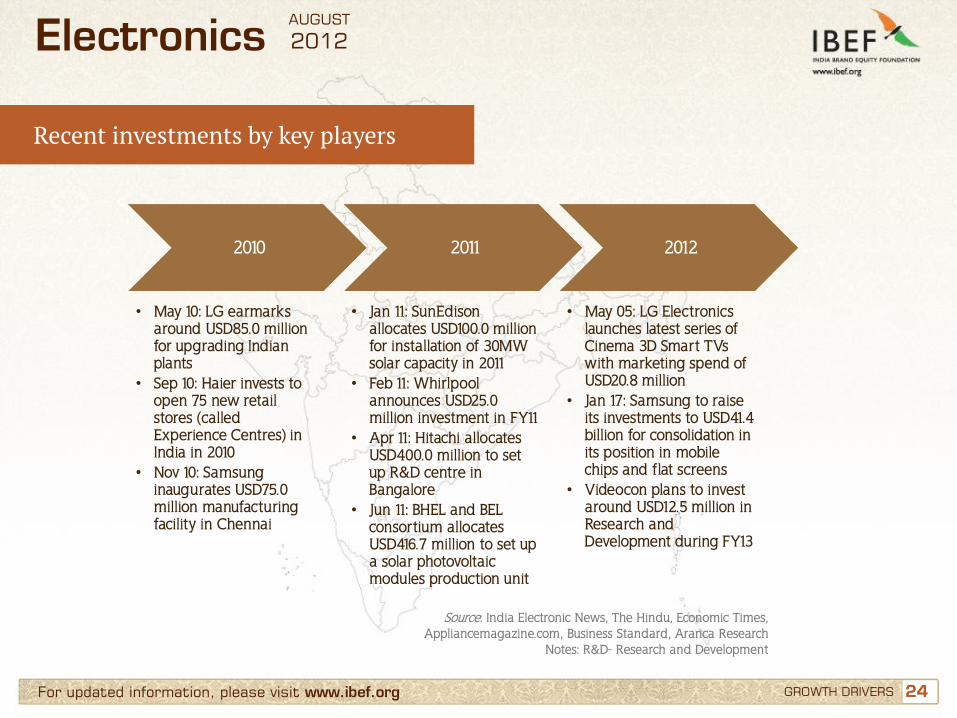
Recent investments by key players
GROWTH DRIVERS
Source: India Electronic News, The Hindu, Economic Times, Appliancemagazine.com, Business Standard, Aranca Research
Notes: R&D- Research and Development
2010 2011
• May 10: LG earmarks around USD85.0 million for upgrading Indian plants
• Sep 10: Haier invests to open 75 new retail stores (called Experience Centres) in India in 2010
• Nov 10: Samsung inaugurates USD75.0 million manufacturing facility in Chennai
2012
• Jan 11: SunEdison allocates USD100.0 million for installation of 30MW solar capacity in 2011
• Feb 11: Whirlpool announces USD25.0 million investment in FY11
• Apr 11: Hitachi allocates USD400.0 million to set up R&D centre in Bangalore
• Jun 11: BHEL and BEL consortium allocates USD416.7 million to set up a solar photovoltaic modules production unit
• May 05: LG Electronics launches latest series of Cinema 3D Smart TVs with marketing spend of USD20.8 million
• Jan 17: Samsung to raise its investments to USD41.4 billion for consolidation in its position in mobile chips and flat screens
• Videocon plans to invest around USD12.5 million in Research and Development during FY13
Electronics AUGUST
2012
25
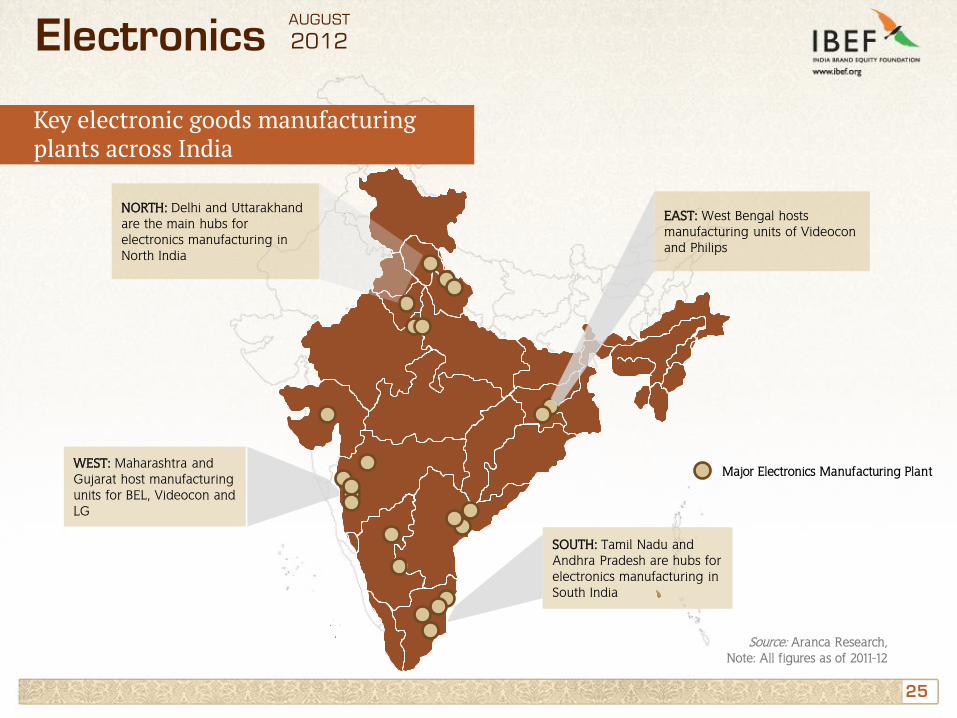
Source: Aranca Research, Note: All figures as of 2011-12
Key electronic goods manufacturing plants across India
Major Electronics Manufacturing Plant
SOUTH: Tamil Nadu and Andhra Pradesh are hubs for electronics manufacturing in South India
NORTH: Delhi and Uttarakhand are the main hubs for electronics manufacturing in North India
EAST: West Bengal hosts manufacturing units of Videocon and Philips
WEST: Maharashtra and Gujarat host manufacturing units for BEL, Videocon and LG
Electronics AUGUST
2012
26 26
Contents
Advantage India
Market overview and trends
Growth drivers
Success stories: BEL, Videocon
Opportunities
Useful information
For updated information, please visit www.ibef.org
Electronics AUGUST
2012
27 27 For updated information, please visit www.ibef.org SUCCESS STORIES: BEL, VIDEOCON
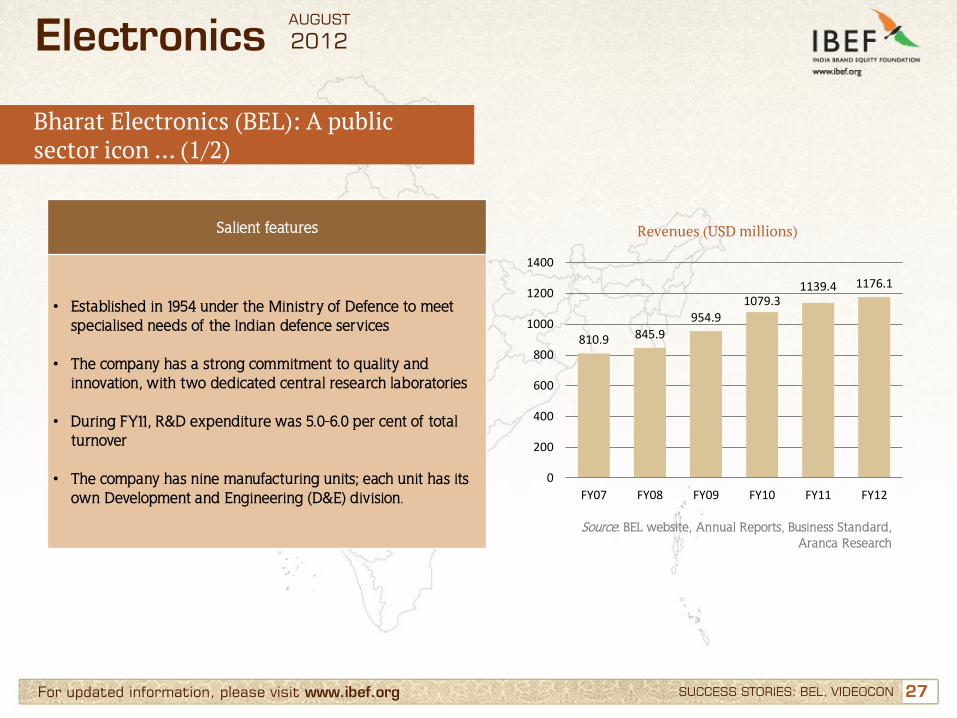
Bharat Electronics (BEL): A public sector icon … (1/2)
Revenues (USD millions)
Source: BEL website, Annual Reports, Business Standard, Aranca Research
Salient features
• Established in 1954 under the Ministry of Defence to meet specialised needs of the Indian defence services
• The company has a strong commitment to quality and innovation, with two dedicated central research laboratories
• During FY11, R&D expenditure was 5.0-6.0 per cent of total turnover
• The company has nine manufacturing units; each unit has its own Development and Engineering (D&E) division.
810.9 845.9
954.9 1079.3
1139.4 1176.1
0
200
400
600
800
1000
1200
1400
FY07 FY08 FY09 FY10 FY11 FY12
Electronics AUGUST
2012
28 28 For updated information, please visit www.ibef.org SUCCESS STORIES: BEL, VIDEOCON
Bharat Electronics (BEL): A public sector icon … (2/2)
Key success factors
• Focus on innovation and R&D
• Key technological collaborations with leading European,
American and Israeli companies
• Rising defence spending in India
• Governmental emphasis on indigenisation and reduction of
import bill
• Diversification in the civilian and export market
Financial highlights
• During FY07-12, BEL’s revenue increased at a CAGR of 7.7 per
cent (from USD810.9 million) to nearly USD1.2 billion
• During same period, BEL’s net profits increased at a CAGR of
17.7 per cent (from USD69.9 million) to USD157.6 million
Source: BEL website, Annual Reports, Aranca Research
Electronics AUGUST
2012
29 29 For updated information, please visit www.ibef.org
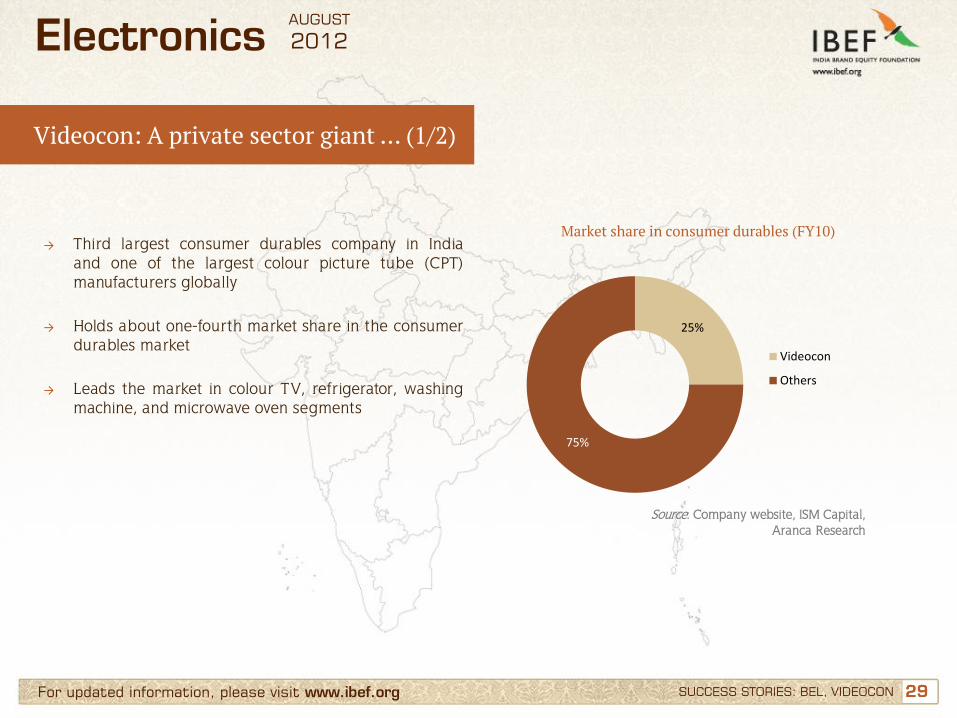
Videocon: A private sector giant … (1/2)
→ Third largest consumer durables company in India and one of the largest colour picture tube (CPT) manufacturers globally
→ Holds about one-fourth market share in the consumer
durables market
→ Leads the market in colour TV, refrigerator, washing machine, and microwave oven segments
Market share in consumer durables (FY10)
Source: Company website, ISM Capital, Aranca Research
SUCCESS STORIES: BEL, VIDEOCON
25%
75%
Videocon
Others
Electronics AUGUST
2012
30 30 For updated information, please visit www.ibef.org
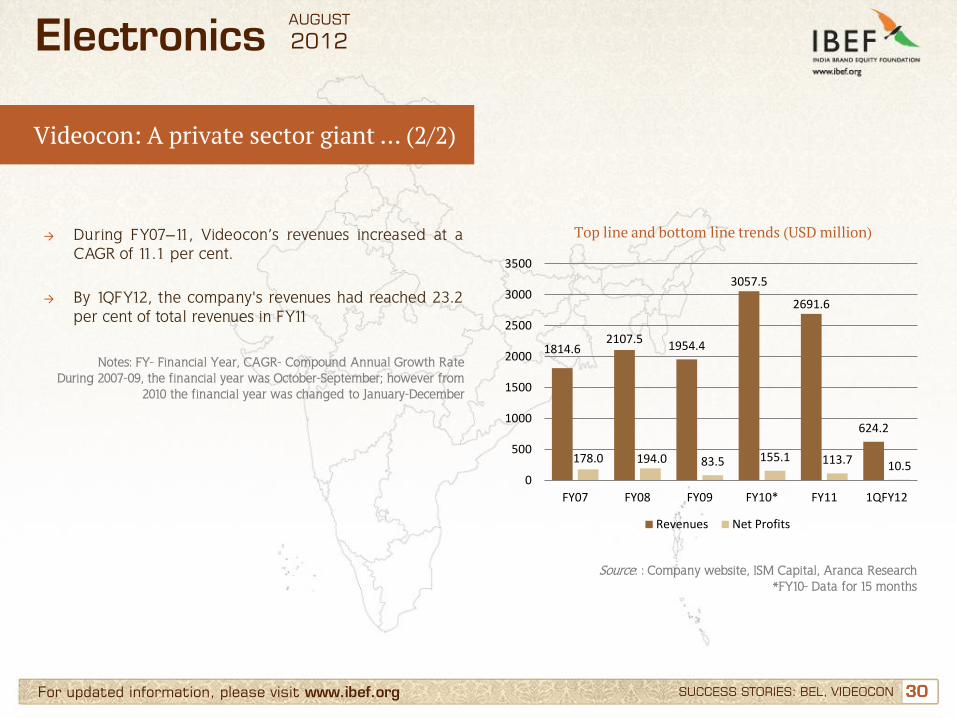
→ During FY07–11, Videocon’s revenues increased at a CAGR of 11.1 per cent.
→ By 1QFY12, the company's revenues had reached 23.2 per cent of total revenues in FY11
Top line and bottom line trends (USD million)
Source: : Company website, ISM Capital, Aranca Research *FY10- Data for 15 months
Notes: FY- Financial Year, CAGR- Compound Annual Growth Rate During 2007-09, the financial year was October-September; however from
2010 the financial year was changed to January-December
SUCCESS STORIES: BEL, VIDEOCON
Videocon: A private sector giant … (2/2)
1814.6 2107.5
1954.4
3057.5
2691.6
624.2
178.0 194.0 83.5 155.1 113.7 10.5 0
500
1000
1500
2000
2500
3000
3500
FY07 FY08 FY09 FY10* FY11 1QFY12
Revenues Net Profits
Electronics AUGUST
2012
31 31
Contents
Advantage India
Market overview and trends
Growth drivers
Success stories: BEL, Videocon
Opportunities
Useful information
For updated information, please visit www.ibef.org
Electronics AUGUST
2012

32 32 For updated information, please visit www.ibef.org OPPORTUNITIES
Multiple factors favour investment in electronics
Source: Department of Information Technology, FY10, FY11 Annual Reports, Dataquest India, Aranca Research
Growing customer base: Market for electronics is expected to grow at a CAGR of 22.0 per cent during the period 2009–2020. The demand for electronics hardware in India is projected to increase from an estimated USD68 billion in 2011 to USD125 billion by 2014 and USD400 billion by 2020
Targeted reduction in import bill: Domestic electronic production accounts for around 45.0 per cent of the total market demand. Therefore, in order to reduce the import bill, the government plans to boost the domestic manufacturing capabilities and is considering a proposal to give preference to Indian electronic products in its purchases
Increasing penetration in the consumer durables segment: Consumer durables market in India is characterised by low penetration in various product segments, viz. 1.0 percent in microwaves, 3.0 per cent in ACs, 16.0 per cent in washing machines, 18.0 per cent in refrigerators, etc. Higher disposable incomes are leading to realisation of penetration potential in various product segments, especially in rural areas
Policy and investment support: To compliment the targeted reduction in import bill, the government has proposed a minimum investment of USD555.0 million for semiconductor manufacturing plants and USD222.0 million for ecosystem units. This is considered a major step toward attracting foreign companies to set up manufacturing facilities in India
Growth in Electronics
Electronics AUGUST
2012
33 33
Contents
Advantage India
Market overview and trends
Growth drivers
Success stories: BEL, Videocon
Opportunities
Useful information
For updated information, please visit www.ibef.org
Electronics AUGUST
2012

34 34 For updated information, please visit www.ibef.org USEFUL INFORMATION
Industry associations … (1/2)
Electronics Industries Association of India (ELCINA) ELCINA House, 422 Okhla Industrial Estate, New Delhi – 110 020, India Phone: 91 11 26924597,26928053 Fax: 91 11 26923440 E-mail: [email protected] Website: www.elcina.com/ Telecom Equipment Manufacturers Association (TEMA) 4th Floor, PHD House, Opp. Asian Village, New Delhi – 110 016, India Tel: 91 11 26859621 Fax: 91 11 26859620 E-mail: [email protected] Website: http://www.tfci.com/cni/tema.htm
Electronics AUGUST
2012
35 35 For updated information, please visit www.ibef.org USEFUL INFORMATION
Industry associations … (2/2)
Manufacturers Association for Information Technology (MAIT) 4th Floor, PHD House, Opp. Asian Games Village, New Delhi 110 016, India Tel: 91 11 26855487 Fax: 91 11 26851321 E-mail: [email protected] Website: www.mait.com Consumer Electronics and Appliances Manufacturers Association (CEAMA) 5th Floor, PHD House 4/2, Siri Institutional Area, August Kranti Marg New Delhi-110 016 Telefax: 91- 11- 46070335, 46070336 e-mail: [email protected] Website: www.ceama.in
Electronics AUGUST
2012
36 36 For updated information, please visit www.ibef.org
Glossary
→ C&B: Communication and Broadcasting
→ CAGR: Compound Annual Growth Rate
→ Capex: Capital Expenditure
→ CENVAT: Central Value Added Tax
→ EHTP: Electronic Hardware Technology Park
→ EPCG: Export Promotion Capital Goods Scheme
→ FDI: Foreign Direct Investment
→ FY: Indian Financial Year (April – March); for example FY10 means April 2009 – March 2010
→ PLC: Programmable Logic Controller
→ R&D: Research and Development
→ SCADA: Supervisory Control and Data Acquisition
→ USD: US Dollar → Conversion rate used: USD1= INR 48
→ Wherever applicable, numbers have been rounded off to the nearest whole number
USEFUL INFORMATION
Electronics AUGUST
2012
37
India Brand Equity Foundation (IBEF) engaged Aranca to prepare this presentation and the same has been prepared by Aranca in consultation with IBEF. All rights reserved. All copyright in this presentation and related works is solely and exclusively owned by IBEF. The same may not be reproduced, wholly or in part in any material form (including photocopying or storing it in any medium by electronic means and whether or not transiently or incidentally to some other use of this presentation), modified or in any manner communicated to any third party except with the written approval of IBEF. This presentation is for information purposes only. While due care has been taken during the compilation of this
presentation to ensure that the information is accurate to the best of Aranca and IBEF’s knowledge and belief, the content is not to be construed in any manner whatsoever as a substitute for professional advice. Aranca and IBEF neither recommend nor endorse any specific products or services that may have been mentioned in this presentation and nor do they assume any liability or responsibility for the outcome of decisions taken as a result of any reliance placed on this presentation. Neither Aranca nor IBEF shall be liable for any direct or indirect damages that may arise due to any act or omission on the part of the user due to any reliance placed or guidance taken from any portion of this presentation.
Disclaimer
For updated information, please visit www.ibef.org DISCLAIMER
Electronics AUGUST
2012