Embed Size (px)
Citation preview

S1
Electronic Supporting Information
For
Two-Photon Sensitized Hollow Gd2O3:Eu3+ Nanocomposites for Real-Time
Dual-Mode Imaging and Monitoring of Anticancer Drug Release
Tingting Shen,a Yu Zhang,a Alexander M. Kirillov,b Huijuan Cai,a Kun Huang,a Weisheng Liu,a Yu
Tang*a
Contents
1. Experimental section
1.1. Materials and instruments
1.2. Synthesis of the nanocomposites
1.3. Experimental methods
2. Characterization section
2.1. Dynamic light scattering (DLS)
2.2. Powder X-ray diffraction (PXRD) patterns
2.3. Thermogravimetric analysis (TGA)
2.4. N2 adsorption-desorption isotherm
2.5. FTIR spectroscopy
3. Photophysical properties study
3.1. Emission, UV-vis, and low-temperature phosphorescence spectra
3.2. Variation of I615/I592 values with DOX release
3.3. Variation of the number of coordination water molecules before and after DOX
loading, as well as following DOX release.
4. Dual-mode imaging
4.1. PL imaging
4.2. MR imaging
5. Cells viability and targeting investigation
5.1. Cytotoxicity assays
5.2. Competition assays
5.3. Flow cytometry assays
6. Supporting references
Electronic Supplementary Material (ESI) for ChemComm.This journal is © The Royal Society of Chemistry 2015

S2
1 Experimental section1.1 Materials and instruments.
Reagents. Gadolinium nitrate (Gd(NO3)3∙6H2O) and europium nitrate (Eu(NO3)3∙6H2O) were
prepared by reacting Gd2O3 and Eu2O3 (99.99%, Shanghai Yuelong) with nitric acid. Glucose
monohydrate, 3-(trimethoxysilyl)propyl methacrylate (MPS), N-isopropylacrylamide (NIPAm),
methacrylic acid (MAA), diphenyl(2,4,6-trimethylbenzoyl)phosphine oxide (TPO), carbazole, 1-
bromopentane, acetylchloride, ethyl trifluoroacetate, 1-ethyl-3-[3-
dimethylaminopropyl]carbodiimide hydrochloride (EDC), N-hydroxysuccinimide (NHS),
anhydrous dimethyl sulfoxide (DMSO) were purchased from J&K Scientific Ltd. Amine-
functionalized cRGD (cyclic(Arg-Gly-Asp-D-Phe-Lys)) was obtained from GL Biochem Ltd.
Doxorubicin hydrochloride (DOX) was obtained from Beijing Huafeng United Technology Co.,
Ltd. (Beijing, China). 3-(4,5-dimethylthiazol-2-yl)-2,5-diphenyltetrazolium bromide (MTT),
4',6-diamidino-2-phenylindole (DAPI) and 4% paraformaldehyde were purchased from Solarbio
Co. Ltd. Dulbecco’s Modified Essential Medium (DMEM), fetal bovine serum (FBS) and trypsin-
EDTA solution were purchased from Gibco.
Instruments. Powder X-ray diffraction (PXRD) patterns were recorded over the 2θ range of 10-
80° using a Rigaku-Dmax 2400 diffractometer with Cu Kα radiation. The 1H NMR spectra were
measured using a Bruker 400 MHz spectrometer in CDCl3 with tetramethylsilane [Si(CH3)4] as an
internal standard. Mass spectra (ESI-MS) were obtained on a HP 5988A GC-MS spectrometer.
Transmission electron microscopy (TEM) images were taken on a Tecnai-G2-F30 (300 kV).
Fourier transform infrared (FTIR) spectra of the materials were conducted within the 4000-400
cm-1 wavenumber range by using a Nicolet 360 FTIR spectrometer with the KBr pellet technique.
The luminescent spectra of drug release were measured in PBS buffer (phosphate buffered saline)
on a Hitachi F-4500 spectrophotometer. The steady-state luminescence spectra and lifetime
measurements of the samples were measured using an Edinburgh Instrument FSL920. The steady-
state measurements used a 450W Xe arc lamp as the excitation source and the lifetime
measurements used Nd-pumped OPO lette laser as the excitation source. Three parallel
measurements were carried out for each sample, so that the presented values correspond to the
arithmetic mean values. All measurements were carried out at room temperature. The
morphological, structural, and chemical characterization of all samples were performed at the

S3
nano/atomic scale using field emission HRTEM (Tecnai™ G2 F30; FEI Company, USA) working
at 120 kV, which was equipped with EDX (AMETEK Inc., USA) and high-angle annular dark-
field scanning transmission electron microscopy (HAADF-STEM). The MR imaging experiments
in water solutions were performed on a 0.5 T clinical MRI instrument (MesoMR60).
1.2 Synthesis of the nanocomposites
Synthesis of carbon nanoparticles.
Glucose monohydrate (6 g, 0.03 mol) was dissolved in 35 mL of deionized water to form a
clear solution. The solution was then sealed in a 100 mL Teflon-lined autoclave and maintained at
180 °C for 5.3 h. After the autoclave was naturally cooled to room temperature, the resulting
black-brown precipitates were collected by centrifugation, washed several times with ethanol and
deionized water, and dried in a vacuum oven at 60 °C for 8 h.
Fabrication of hollow Gd2O3:Eu3+/Gd2O3 nanoparticles (Gd2O3:Eu3+ NPs/Gd2O3 NPs).
Gd2O3:Eu3+ NPs. Gd(NO3)36H2O (0.4288 g, 0.95 mmol) and Eu(NO3)36H2O (0.0223 g, 0.05
mmol) were dissolved in a mixture containing 10 mL of deionized water and 10 mL of ethanol to
form a clear solution. Then, urea (0.6 g, 9.9 mmol) was added into the rare earth metal (RE)
nitrate solution under vigorous stirring. After stirring for 5 min, the as-prepared dried carbon
spheres (0.10 g) were added and well dispersed into the above solution with sonication for 15 min.
The obtained mixture was heated at 90 °C for 6 h under vigorous stirring. The product was
obtained by centrifugation and washed with deionized water and ethanol three times, and then
dried at 60 °C. The final hollow Gd2O3:Eu3+ NPs were obtained through a heat treatment
(calcination) at 800 °C for 2 h with a heating rate of 2 °C/min in air atmosphere.
Gd2O3 NPs. The hollow Gd2O3 NPs were obtained by using the same method with a
stoichiometric amount of Gd(NO3)36H2O (0.4513g, 1.0 mmol) aqueous solution instead of the
mixture of Gd(NO3)36H2O and Eu(NO3)36H2O solutions at the initial stage as described above.
Preparation of poly[(N-isopropylacrylamide)-co-(methacrylic acid)] coated hollow
Gd2O3:Eu3+/Gd2O3 NPs (Gd2O3:Eu3+@P(NIPAm-co-MAA) and Gd2O3@P(NIPAm-co-MAA)).
Gd2O3:Eu3+@P(NIPAm-co-MAA). In the first stage, Gd2O3:Eu3+@MPS NPs were obtained by
suspending 100 mg of Gd2O3:Eu3+ NPs in 25 mL of toluene under addition of MPS (500 uL). The
mixture was refluxed at 120 °C for 10 h and was subsequently centrifuged, washed several times
with ethanol and dried at 50 °C overnight under vacuum. Gd2O3:Eu3+@P(NIPAm-co-MAA) NPs

S4
were finally achieved by a photo-induced polymerization. NIPAm (1.0 g), MAA (60.8 uL), and
TPO (0.024 g, photoinitiator) were dissolved in 4 mL of 1,6-dioxane to form a transparent solution
and then 80 mg of Gd2O3:Eu3+@MPS NPs powder was added. The suspension was treated under
sonication for 30 min and further stirred overnight at room temperature in the dark. After that, the
resulting monomer-contained NPs were exposed to UV light (200 Wcm−2, LAMP, PHILIPS) for
8 min to achieve the photoinitiated polymerization. After that, the prepared product was washed
with ethanol and water for several times to remove unreacted monomers and impurities, then dried
in vacuum at 50 °C to obtain final samples, denoted as Gd2O3:Eu3+@P(NIPAm-co-MAA).
Gd2O3@P(NIPAm-co-MAA). A similar process was employed for preparing
Gd2O3@P(NIPAm-co-MAA) NPs by using pure Gd2O3 NPs instead of Gd2O3:Eu3+ NPs as
described above.
Preparation of the two-photon-sensitized ligand 4,4-trifluoro-1-(9-pentylcarbazole-3-yl)-1,3- -
butanedione (HTHA).S1
9-Pentyl-carbazole: 1.67 g of carbazole (10 mmol) and 0.6 g of NaOH (15 mmol) were
dissolved in acetone (20 mL) and refluxed for 2 h. After cooling to room temperature, 1.2 mL of
1-bromopentane (1.51 g, 10 mmol) was added and the obtained mixture was refluxed for 24 h.
The solvent was then removed under reduced pressure and 20 mL of water was poured with
stirring to get an orange suspension. The solid was filtered off and recrystallized from EtOH and
water to give colorless crystalline product (ESI-MS: [M + H] m/z 238.15, Anal. Calc. for C17H19N:
C 86.03, H 8.07, N 5.90 %; found C 85.93, H 8.23, N 5.79 %).
3-Acetyl-9-pentyl-carbazole: 0.265 g of AlCl3 (2.05 mmol) was added rapidly to the solution
of 9-pentyl-carbazole (0.47 g, 1.99 mmol) in chloroform (8 mL) with stirring at 0 ºC for 5 min. In
the following step, 4 mL of solution of acetylchloride (0.156 g, 2 mmol) in chloroform was added
dropwise over 10 min under vigorous stirring at 0 ºC. Then the mixture was kept stirring at room
temperature for 48 h. The 10% aqueous solution of HCl was added into the reaction mixture and
the aqueous phase was removed. The organic phase was washed by 1 M aqueous solution of
NaHCO3 and water and dried with anhydrous MgSO4. The crude product was purified by silica
column chromatography using petroleum ether to obtain the purified compound. (ESI-MS: [M +
H] m/z 280.16. Anal. Calc. for C19H21NO: C 81.68, H 7.58, N 5.01 %; found C 81.72, H 7.78, N
4.90 %).

S5
4,4,4-Trifluoro-1-(9-pentylcarbazole-3-yl)-1,3-butanedione (HTHA): 0.9 g of 3-acetyl-9-
pentyl-carbazole (3.2 mmol) was dissolved in 4 mL of anhydrous t-BuOH and 4 mL of THF. After
cooling to 0 ºC, 2.1 g of t-BuOK (18.75 mmol) was added dropwise, and then the obtained
mixture was stirred for 15 min at 0 ºC. Next, 3.7 mL of ethyl trifluoroacetate (4.4 g, 30 mmol) was
added and kept stirring at room temperature for 24 h. Then, 3 M aqueous solution of HCl was
added to the mixture to adjust the pH to be acidic, the resulting mixture was extracted with ethyl
acetate and the organic layer was collected. The organic layer was washed with water and
NaHCO3 and dried over anhydrous MgSO4. After removal of the solvent, the residue was purified
by silica column chromatography using petroleum ether to obtain a yellowish solid. For
C21H20F3NO2. δH (400 MHz; CDCl3; Me4Si): 15.76 (s, 1H), 8.77 (s, 1H), 8.20 (d, 1H), 8.11 (d,
1H), 7.54-7.58 (m, 1H), 7.46-7.48 (m, 2H), 7.27-7.37 (t, 1H), 6.73(s, 1H), 4.35 (t, 2H), 1.92 (m,
2H), 1.29-1.39 (m, 4H), 0.89 (t, 3H). ESI-MS: [M + H] m/z 376.15.
Preparation of two-photon-sensitized luminescence emissive Gd2O3:Eu3+@ P(NIPAm-co-
MAA)@THA NPs (TPNPs).
Firstly, a solution of HTHA (9.9 mg, 0.027 mmol) and 1,10-phenanthroline (1.8 mg, 0.009
mmol) in EtOH (15 mL) was prepared and the pH was adjusted to 8-9 with triethylamine. Then,
an aqueous suspension of Gd2O3:Eu3+@ P(NIPAm-co-MAA) nanoparticles (33.1 mg) was added
dropwise. Finally, the mixture was stirred at 80 ºC for 12 h. The precipitated product was
centrifuged and washed by water. The products were dried at 60 ºC in vacuum for 12 h.
Preparation of Gd2O3@P(NIPAm-co-MAA)@THA.
The Gd2O3@P(NIPAm-co-MAA)@THA NPs were prepared using the same method for TPNPs
as above.
Preparation of targeting Gd2O3:Eu3+@P(NIPAm-co-MAA)@THA@cRGD nanospheres
(TPNPs@cRGD).S2
The material Gd2O3:Eu3+@P(NIPAm-co-MAA)@THA (9.6 mg) was dispersed in PBS, then, 15
mL of EDC (0.12 mM) and 15 mL of NHS (0.05 mM) were added, and the mixture was kept
under ultrasonic treatment for 30 min. The 1.6 mg of cRGD was dissolved in the above mixture,
stirred for 24 h, centrifuged, washed with deionized water three times, and freeze-dried to furnish
the Gd2O3:Eu3+@P(NIPAm-co-MAA)@THA@cRGD nanospheres (TPNPs@cRGD).

S6
DOX loaded nanocomposites (DOX-TPNPs@cRGD/DOX-Gd2O3:Eu3+).
DOX-TPNPs@cRGD. The 30 mg of the material TPNPs@cRGD was dispersed in 15 mL
aqueous solution of DOX (1 mg mL-1) under ultrasound treatment for 30 min, followed by stirring
for 24 h at 45 °C. The product was centrifuged, washed with cold water three times and freeze-
dried.
DOX-Gd2O3:Eu3+. For comparison, an experiment of DOX loading into the Gd2O3:Eu3+ NPs
without any modification was carried out by using the same method as above.
1.2 Experimental methods
In vitro release.
The DOX-TPNPs@cRGD (2 mg) was immersed in 4 mL of PBS buffer solution with different
pH values at 37 and 45 °C with gentle shaking. At predetermined time intervals, the DOX released
into the buffer was collected and replaced with an equal volume of fresh buffer solution. In
addition, the amounts of released DOX in the supernatant solutions were determined by
monitoring the changes of the absorbance peak at 480 nm of DOX.
Cell culture.
HeLa cell and U87-MG cell lines were provided by the Institute of Biochemistry and Cell
Biology, SIBS, CAS (China). A549 cell lines were provided by Hunan University (China). Cells
were cultured in regular growth medium consisting of DMEM supplemented with 10 % FBS at 37
°C in a humidified and 5 % CO2 incubator. The cells were routinely harvested by treatment with a
trypsin-ethylenediaminetetraacetic acid (EDTA) solution (0.25 %).
Confocal laser scanning microscopy (CLSM).
The U87-MG cells were incubated for 24 h, and then treated with DOX-TPNPs@cRGD
nanocomposites ([DOX] = 25 μg mL-1) for different time. After incubation for 0.5, 1, and 3 h, the
cells were washed with PBS (pH 7.4) three times to remove free nanocomposites, then fixed with
2.5 % formaldehyde at 37 °C for 10 min, and washed with PBS three times again. The fixed cells
finally immersed in 0.5 mL of PBS for the analysis. All images were collected by CLSM (FV1000)
under the same instrumental conditions.
Magnetic resonance imaging (MRI).
The MRI experiments were performed on a MesoMR60 0.5-T MR system (Niumag Co. Ltd.
shanghai). For the experiments to observe the MRI contrast effect of the nanocomposites within

S7
the cells, the U87-MG cells were incubated with the DOX-TPNPs@cRGD nanocomposites for 6 h,
and then placed in a 2 mL PCR tube. We added the agar to fix the cells at the bottom of tube. And
the cells at the bottom of tube were chosen as a layer section base. Each tube contained
approximately 105 cells.
Cytotoxicity assays.
To evaluate the cytotoxicity, the MTT assay was used on the HeLa and U87-MG cells. Briefly,
the HeLa and U87-MG cells were seeded in a 96-well plates at a density of 1×10⁴ cells per well,
cultured with fresh DMEM, and supplemented with 20% FBS under a humidified 5% CO2 at 37
°C for 12 h. After that, various concentrations of TPNPs, DOX-TPNPs, DOX-TPNPs@cRGD and
free DOX were added into the culture wells and the cells were further incubated for 24 h.
Subsequently, the cells were washed with culturing medium and treated with 20 μL MTT (5 mg
mL−1 in PBS) at 37 °C for 4 h in an incubator under the same conditions. Finally, the supernatant
was removed, and dimethyl sulfoxide (DMSO) was added (150 μL per well) and the wells were
shaken for 10 min to thoroughly resolve the formazan into the solvent. The optical density at 490
nm was measured by the microtiter plate reader. The untreated cancer cells were used as control
samples. The percentages of cell viabilities were calculated by using the optical densities with
respect to the control values.
Competition assay.
The U87-MG cells seeded in 35 mm glass microscopy dishes were grown overnight in complete
medium. Cells were treated with 20 μL excess cRGD in serum-free medium (10 μg mL-1) for 15
min. The cells were washed with PBS, incubated with DOX-TPNPs@cRGD and DOX-TPNPs
([DOX] = 25 μg mL-1) for 1 h at 37 °C, and then fixed in solution containing 4% cold
paraformaldehyde for 20 min. Nuclei were stained with DAPI (20 μg mL-1) for 30 min. The cell
surface distribution of the NPs was observed using a confocal microscope.
Flow cytometry.
The U87-MG cells (1 × 10⁵) were seeded in 6-well culture plates and cultured for 48 h. The
cells were then treated with DOX-TPNPs, DOX-TPNPs@cRGD or free DOX ([DOX] = 20 μg
mL−1) at 37 °C for 2 h. A single cell suspension was prepared consecutively by trypsinization and
washing with PBS, and then analyzed using a FACSVerse flow cytometer (BD Biosciences) for
DOX.

S8
2 Characterization section
2.1. Dynamic light scattering (DLS)
Figure S1. Size distribution of the hollow spheres of (A) Gd2O3:Eu3+, (B) Gd2O3:Eu3+@polymer,
(C) DOX-TPNPs@cRGD at 25 °C, and (D) DOX-TPNPs@cRGD at 45 °C by DLS.
Dynamic light scattering (DLS) analysis indicated that the Gd2O3:Eu3+, Gd2O3:Eu3+@polymer,
and DOX-TPNPs@cRGD nanoparticles were monodisperse in water with a gradually increasing
hydrodynamic diameter (HD) of 100 nm (Figure S1A), 130 nm (Figure S1B), and 135 nm (Figure
S1C) at room temperature (~25 °C), respectively. When the DOX-TPNPs@cRGD NPs were
redispersed in water at 45 °C, the HD became 105 nm (Figure S1D), confirming the shrinking
ability of polymer at a higher temperature.
In our experiment, the two-step NPs coatings were conducted in organic solvent. In the first
step of MPS modification, the Gd2O3:Eu3+ NPs are relatively hydrophilic, and MPS is
hydrophobic. Thus, the NPs were dispersed fully in toluene by ultrasonic treatment before adding
MPS, and then MPS was introduced by keeping ultrasonication in order to distribute MPS
uniformly around the NPs before reflux; however, there was an inevitable aggregation that
occurred to some extent in this step. But in the second step of copolymerization to achieve the
polymer P(NIPAm-co-MAA), the final Gd2O3:Eu3+@P(NIPAm-co-MAA) NPs are relatively
hydrophilic again. It is well known that the PNIPAm (a commonly used thermo-responsive

S9
polymer) is soluble below lower critical solution temperature (LCST), but becomes insoluble
above the LCST. Incorporating functional comonomers into the microgels changes the LCST to
higher or lower temperature. In our work, LCST of the PNIPAm homopolymer can be tuned to be
above a normal body temperature (37 °C) by incorporating comonomer units MAA. Hence, we
think that the Gd2O3:Eu3+@P(NIPAm-co-MAA) NPs are relatively hydrophilic below 37 °C.
2.2. Powder X-ray diffraction (PXRD) patterns
Figure S2. PXRD patterns of different NPs and the standard data for cubic Gd2O3 structure
(JCPDS no.12-0797).
2.3. Thermogravimetric analysis (TGA)
Figure S3. TGA curves of (A) TPNPs and TPNPs@cRGD NPs, and (B) free targeting group
cRGD.
According to TGA curves shown in Figure S3A, the weight loss values of TPNPs and

S10
TPNPs@cRGD were 15.21 and 21.77%, respectively, upon the temperature increase to 800 °C. A
higher weight loss of TPNPs@cRGD indicated that cRGD was successfully immobilized onto the
surface of the nanoparticles. For comparison, the TGA of free cRGD is also displayed (Figure
S3B), wherein we can detect a similar two-step decomposition of peptide resembling that
observed in the TGA curve of TPNP@cRGD. Meanwhile, the first maximum decomposition
temperature of cRGD shifted from 229 (Figure S3B) to 310 °C (Figure S3A), thus probably
confirming that there is a covalent interaction between cRGD and the polymer on the surface of
nanoparticles rather than a simple adhesion.
2.4. N2 adsorption-desorption isotherm
Figure S4. N2 adsorption-desorption isotherm of hollow Gd2O3:Eu3+ NPs before (black) and after
(red) coating by P(NIPAm-co-MAA) polymer. Inset: the pore size distribution curves.
The isotherms of the two samples can be classified as type IV with typical H1 hysteresis loop,
which demonstrates the presence of textual mesopores. In the Gd2O3:Eu3+ hollow structure (black
line), the BET surface area and pore volume are 20.87 m2g–1 and 0.0916 cm3g–1, respectively. The
pore size distribution shows the main size of about 15 nm. However, another wide peak at about
85 nm should be attributed to the large hollow caused by the burning of carbon layer. The
presence of diverse pores is characteristic for the hollow structure with mesoporous shell. In
contrast, in the of Gd2O3:Eu3+@P(NIPAm-co-MAA) hollow structure (red line), the BET surface
area, pore volume, and the BJH pore-size distribution are 243.15 m2g–1, 0.7074 cm3g–1, and 2.71
nm, respectively. A decreased pore size confirms that the polymer can be qualified to be the

S11
“gate” to keep the DOX cargo in the hollow structure. In addition, the higher surface area can be
due to an internal surface that is also filled with P(NIPAm-co-MAA), because monomers could
pass through the narrow pore on shell and enter the hollow core. Due to the polymer being coated
both outside and inside the materials, the modified hollow nanomaterials show a qualitative leap
both in loading and release. For this reason, this material can be considered as an excellent
candidate for drug delivery, owing to the polymer coating layer and the hollow structure. In
addition, the procedure of DOX loading can also be used to explain why drug can be loaded in the
hollow core. DOX can go into the hollow cavity from mesopores in the shell in deionized water at
45 ℃ (“gate” open) based on concentration gradient. Then, the product was centrifuged and
washed with cold water (“gate” closed); as a result, a part of DOX was retained in the cavity.
2.5. FTIR spectroscopy
Figure S5. FT-IR spectra of (A) HTC and (B) uncalcined core-shell structured precursor.
The FTIR spectra were used to identify the functional groups of the as-obtained carbon spheres
template and the core-shell structured precursor. The FTIR spectrum of the carbon spheres
template (Figure S5A) shows the characteristic absorption bands of hydrothermal carbon, which
are similar to literature data. The absorption bands at about 3423, 2927 (1394), 1712, 1620 (1512),
1215, and 1024 cm-1 are assigned to the vibrations of -OH, -CH3, -C=O, C=C, -C-OH and
glycosidic C-O-C groups, respectively. The presence of glycosidic linkage confirms the
polymerization reaction of glucose and the unsaturated C=C groups indicate that a carbonization
process has occurred during the formation of carbon spheres. The hydroxyl groups on the surface

S12
improve the stability of the carbon spheres in aqueous solution, what can be confirmed by the
TEM result. For the uncalcined core-shell structured precursor (Figure S5B), it can be seen that
the absorption band centered at 1712 cm-1 nearly disappears, which may be due to the coating of
the Gd(OH)CO3 NPs on the surface of carbon spheres. The new adsorption bands at about 3396,
1521 (1392), 1085, and 845 cm-1 can be assigned to O-H (ν), C=O (νas), C=O (νs), and C=O (δ)
vibrations (ν = stretch; νs = symmetric stretch; νas = asymmetric stretch; δ = deformation), which
support the presence of the amorphous Gd(OH)CO3 shell.S3
Figure S6. FTIR spectra of (A) hollow Gd2O3:Eu3+, (B) Gd2O3:Eu3+@MPS, and (C)
Gd2O3:Eu3+@P(NIPAm-co-MAA) NPs.
S13
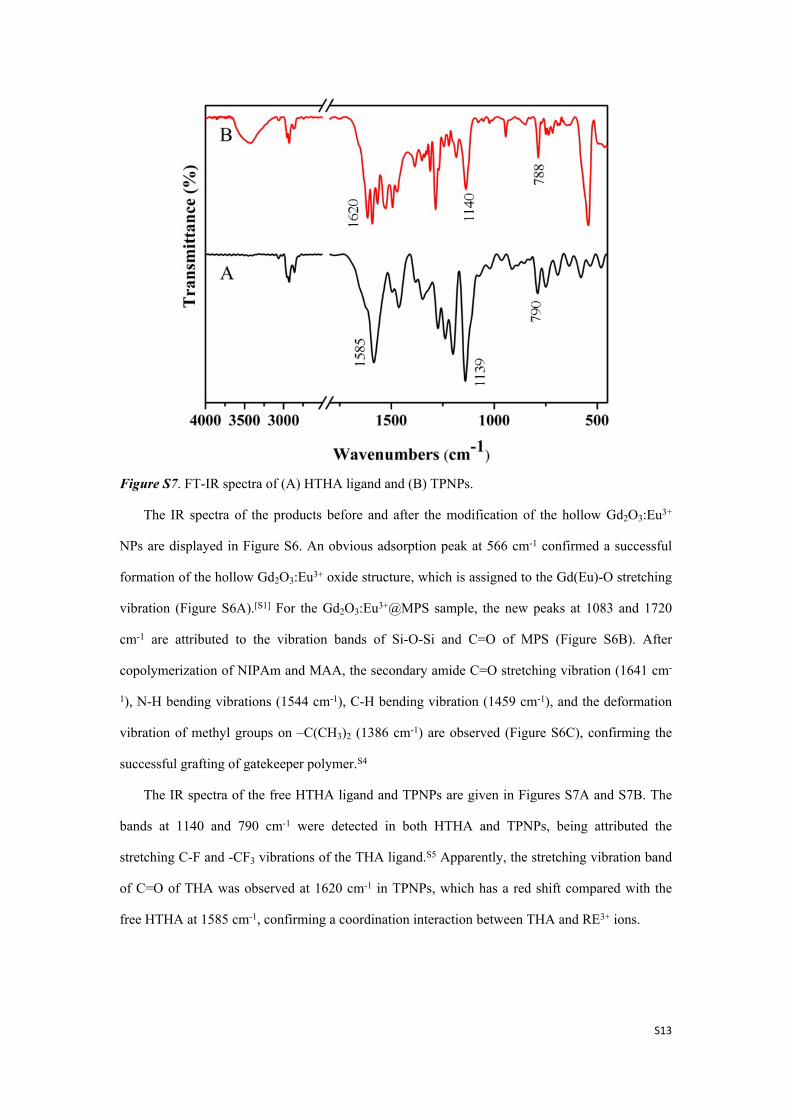
Figure S7. FT-IR spectra of (A) HTHA ligand and (B) TPNPs.
The IR spectra of the products before and after the modification of the hollow Gd2O3:Eu3+
NPs are displayed in Figure S6. An obvious adsorption peak at 566 cm-1 confirmed a successful
formation of the hollow Gd2O3:Eu3+ oxide structure, which is assigned to the Gd(Eu)-O stretching
vibration (Figure S6A).[S1] For the Gd2O3:Eu3+@MPS sample, the new peaks at 1083 and 1720
cm-1 are attributed to the vibration bands of Si-O-Si and C=O of MPS (Figure S6B). After
copolymerization of NIPAm and MAA, the secondary amide C=O stretching vibration (1641 cm-
1), N-H bending vibrations (1544 cm-1), C-H bending vibration (1459 cm-1), and the deformation
vibration of methyl groups on –C(CH3)2 (1386 cm-1) are observed (Figure S6C), confirming the
successful grafting of gatekeeper polymer.S4
The IR spectra of the free HTHA ligand and TPNPs are given in Figures S7A and S7B. The
bands at 1140 and 790 cm-1 were detected in both HTHA and TPNPs, being attributed the
stretching C-F and -CF3 vibrations of the THA ligand.S5 Apparently, the stretching vibration band
of C=O of THA was observed at 1620 cm-1 in TPNPs, which has a red shift compared with the
free HTHA at 1585 cm-1, confirming a coordination interaction between THA and RE3+ ions.

S14
Figure S8. FT-IR spectra of Gd2O3:Eu3+@P(NIPAm-co-MAA)@cRGD (blue line), cRGD (black line), and Gd2O3:Eu3+@P(NIPAm-co-MAA) (red line).
The FTIR spectrum of cRGD displays three characteristic peaks of amide bands: I (νC=O,1690-
1640 cm-1), II (νN-H, 1550-1500 cm-1), and Ш (νC-N, 1420-1400 cm-1) at 1644 and 1550, 1422 cm −1,
respectively. These bands are similar to polymer P(NIPAm-co-MAA) since the amide bond is also
present in PNIPAm. So, the cRGD-conjugated NPs and P(NIPAm-co-MAA) modified
Gd2O3:Eu3+ NPs both possess the three characteristic bands. However, if we observe carefully, the
relative intensities between the two peaks (bands I and Ⅱ) have changed in cRGD-conjugated
NPs. In addition, the bands of stretching vibration of C-O appearing at 1190 and 1140 cm−1 (red
loop) in cRGD are also present in the cRGD-conjugated NPs. At the same time, as other special
bands, the out-of-plane bending of C-H of mono-substituted benzene (green loop) (800, 830 cm −1)
and -(CH2)n- (n≥4) (720 cm −1), which belong to phenylalanine and lysine in cRGD, respectively,
also appear in the cRGD-conjugated NPs. The shifts of the two bands toward lower wavenumber
may be attributed to the susceptible bending vibration in fingerprint region. In conclusion, we
believe that the cRGD has been linked onto the NPs as supported by the zeta potential, TGA, and
FTIR data.
Meanwhile, we have used ICP-MS to identify the level of Gd3+ in the U87-MG cells. The level
of Gd3+ are 24.48% after incubating cells with cRGD conjugated NPs and 4.42% with NPs
without RGD conjugation. Hence, the increased Gd3+ level confirms that the conjugation process
won't affect the activity of cRGD.

S15
3 Photophysical properties study
3.1. Emission, UV-vis, and low-temperature phosphorescence spectra
Figure S9. (A) Emission spectra of TPNPs@cRGD and (B) DOX-TPNPs@cRGD at the
excitation wavelength of 808 nm. (C) UV-vis spectra of free DOX (red line), DOX-
TPNPs@cRGD (blue line), and released DOX (black line) in PBS. (D) Photos of: (d1) DOX-
Gd2O3:Eu3+ in PBS (pH = 7.4), (d2) DOX-TPNPs@cRGD in PBS (pH = 7.4), (d3) DOX-
TPNPs@cRGD in PBS (pH = 5.0), (d4) free DOX in PBS (pH = 7.4), (d5-d8) the samples
corresponding to d1-d4 after centrifugation. (E) Low-temperature (77 K) phosphorescence spectra
and (F) UV-vis spectra of HTHA (black curve), Gd2O3@P(NIPAm-co-MAA)@THA (red curve),
TPNPs (blue curve) (constant concentration of HTHA was maintained, 12.5 μg mL-1).

S16
As shown in Figure S9D, the coordination behavior of DOX is well-evidenced, being well-
consistent with the UV-vis spectra in Figure S9C. The solution color changed from orange to
purple after DOX loading into both the Gd2O3:Eu3+ NPs (unmodified) and TPNPs@cRGD
nanospheres. Thus, we can confirm that the DOX drug can coordinate to the RE3+ ions in the host
rather than interacting with the components on the surface of the NPs during the loading process.
3.2. Variation of I615/I592 values with DOX release
Figure S10. The values of I615/I592 versus different DOX release time (pH = 5.0, T = 45 °C) from
DOX-TPNPs@cRGD nanocomposite.
3.3. Variation of the number of coordinated water molecules before and after DOX loading, as well as following DOX release.
Table S1. Lifetimes of TPNPs@cRGD and DOX-TPNPs@cRGD with different release time of 2,
6, and 21 h (at 613 nm).
TPNPs@cRGD DOX-TPNPs@cRGD 2 h 6 h 21 h
H2O τ1 (ms) 0.121 (40.12%) 0.279 (40.68%) 0.272 (42.27%) 0.242 (36.59%) 0.184 (23.55%)
τ2 (ms) 0.357 (59.88%) 0.554 (59.32%) 0.555 (57.73%) 0.516 (63.41%) 0.455 (76.45%)
<τ> (ms) 0.262 0.442 0.434 0.415 0.391
D2O τ1 (ms) 0.191 (41.76%) 0.313 (41.45%) 0.308 (37.93%) 0.294 (36.95%) 0.232 (26.24%)
τ2 (ms) 0.531 (58.24%) 0.616 (58.55%) 0.615 (62.07%) 0.611 (63.05%) 0.543 (73.76%)
<τ> (ms) 0.389 0.490 0.499 0.494 0.461
q 1.308 0.233 0.315 0.404 0.408

S17
The number of coordinated water molecules q (per mol of RE3+ ions) was determined through
comparison of the emission lifetimes of Eu(III) in water and deuterated water, using the equation
,S6 , where A = 1.05.𝑞 = 𝐴(𝜏𝐻2𝑂
‒ 1 ‒ 𝜏𝐷2𝑂‒ 1)
4 Dual-mode imaging
4.1 PL imaging
Figure S11. Confocal microscopic images of the U87-MG cells treated with DOX-TPNPs@cRGD for different time. Images of the cells were obtained using an excitation wavelength of 405 nm, and a long-path (550-650 nm, red signal) emission filter.

S18
4.2 MR imaging
Figure S12. T1-weighted images and relaxation rate R1 (1/T1) versus various molar concentrations of Gd3+ in (A) TPNPs@cRGD and (B) DOX-TPNPs@cRGD nanocomposite in PBS buffer. (C) T1-weighted imaging of DOX-TPNPs@cRGD in the U87-MG cells at room temperature using a 0.5 T MRI scanner.

S19
5 Cells viability and targeting investigation5.1 Cytotoxicity assays
Figure S13. (A) HeLa cells and (B) U87-MG cells viability exposed to free DOX, DOX-TPNPs,
and DOX-TPNPs@cRGD (equal concentrations of DOX), and pure TPNPs (concentration was
equal to that in DOX-TPNPs@cRGD).

S20
5.2 Competition assays
Figure S14. Cellular uptake of DOX-TPNPs and DOX-TPNPs@cRGD. The incubation time was
1 h. (A-C) and (G-I) show the U87-MG cells treated without a competitive free cRGD peptide.
(D-F) and (J-L) show the U87-MG cells treated with a competitive free cRGD peptide. Blue:
DAPI-stained nuclei; red: the NPs (the excitation wavelength was 405 nm and a long-path (550-
650 nm, red signal) emission filter was applied).
Further studies were performed to verify the targeted delivery effect and also to explore the
preliminary mechanism of the drug delivery systems. Here, U87-MG cells, known to have high
expression of αvβ3 integrin on cell surface were used for the targeting uptake of NPs. As shown
in Figure S14, the cRGD-modified TPNPs exhibited a markedly higher uptake ability to αvβ3
integrin-overexpressing U87-MG cells (Figure S14G-I) than the unmodified TPNPs (Figure
S14A-C). These results demonstrated the targeting ability of cRGD to assist drug delivery systems
to αvβ3 integrin-positive brain cancer cells. Moreover, the addition of a large amount of competing

S21
cRGD significantly inhibited the DOX-TPNPs@cRGD uptake in cells (Figure S14J-L), but had
no apparent impact on that of DOX-TPNPs (Figure S14D-F). This is the typical phenomenon for
a receptor-mediated competitive inhibition.
5.3 Flow cytometry assays
Figure S15. Flow cytometry analysis of (A) the control cells and U87-MG cells incubated with (B)
DOX-TPNPs, (C) free DOX, and (D) DOX-TPNPs@cRGD for 2h.
To investigate the mechanism of higher cytotoxicity induced by the DOX-TPNPs@cRGD
nanocomposites, the flow cytometry analysis was used to quantitatively evaluate the cell uptake
degree of the nanocomposite by determining the red fluorescence of DOX (Figure S15).S7 After
incubating for 2 h, the amount of red fluorescence from DOX-TPNPs@cRGD (Figure S15D) was
much higher than that in the control cells (Figure S15A), and even higher than in the assays with
DOX-TPNPs (without cRGD) (Figure S15B) and free DOX (Figure S15C), thus indicating that
the nanocomposite, as a drug carrier, enhanced the cellular uptake of DOX. Hence, we can
attribute the enhanced cytotoxicity of DOX-TPNPs@cRGD to the efficient cellular uptake and
sustained release of drug caused by stimuli response.

S22
6. Supporting references
S1. Z. J. Hu, X. H. Tian, X. H. Zhao, P. Wang, Q. Zhang, P.-P. Sun, J. Y. Wu, J. X. Yang and Y.
P. Tian, Chem. Commun. 2011, 47, 12467-12469.
S2. Y. Y. Yuan, R. T. K. Kwok, B. Z. Tang and B. Liu, J. Am. Chem. Soc. 2014, 136, 2546-2554.
S3. P. P. Yang, S. L. Gai, Y. C. Liu, W. X. Wang, C. X. Li and J. Lin, Inorg. Chem. 2011, 50,
2182-2190.
S4. X. Zhang, P. Yang, Y. Dai, P. A. Ma, ; X. Li, Z. Cheng, Z. Hou, X. Kang, C. Li and J. Lin,
Adv. Funct. Mater. 2013, 23, 4067-4078.
S5. P. Martín-Ramos, C. Coya, Á. L. Álvarez, M. R. Silva, C. Zaldo, J. A. Paixão, P. Chamorro-
Posada and J. Martín-Gil, J. Phys. Chem. C 2013, 117, 10020-10030.
S6. A. D. Bettencourt-Dias, P. S. Barber and S. Bauer, J. Am. Chem. Soc. 2012, 134, 6987-6994.
S7. Y. Chen, K. L. Ai, Y. L. Liu and L. H. Lu, ACS Appl. Mater. Interfaces 2014, 6, 655-663.