Embed Size (px)
Citation preview
Supplementary Materials For
Bottom-up Synthesis of Fully sp2 Hybridized Three-dimensional Microporous Graphitic Frameworks as Metal-free Catalysts
Siddulu Naidu Talapaneni,a,† Jaehoon Kim,a,† Sang Hyun Je,a Onur Buyukcakir,a Jihun Oha* and Ali Coskuna,b* aGraduate School of EEWS and KAIST Institute NanoCentury, Korea Advanced Institute of Science and Technology (KAIST), 291 Daehak-ro, Yuseong-gu, Daejeon 34141, Republic of Korea bDepartment of Chemistry, Korea Advanced Institute of Science and Technology (KAIST), 291 Daehak-ro, Yuseong-gu, Daejeon 34141, Republic of Korea
Email: [email protected], [email protected]
[†] These authors contributed equally to this work.
Electronic Supplementary Information (ESI)
Electronic Supplementary Material (ESI) for Journal of Materials Chemistry A.This journal is © The Royal Society of Chemistry 2017
S2
Contents:
Section 1. Materials and characterization methods S3-S4
Section 2. Experimental procedures for the synthesis of 2D- and 3D-MGFs S4
Section 3. Synthesis and characterization of octaketotetraphenylene S5-S10
Section 4. Synthesis and characterization of hexaketotriphenylene S10-S13
Section 5. Characterization of 2D and 3D-MGFs S14-S28
Section 6. Electrochemical characterization of 2D and 3D-MGFs S29-S30
Section 7. References S30
S3
1. Materials and Characterization methods
All manipulations involving air- and/or moisture-sensitive compounds were carried out using a glove box or standard Schlenk line techniques under Ar atmosphere. Air-sensitive liquids were transferred via syringe and addition funnels and were injected into the reaction flask through rubber septa. Moisture sensitive solids were transferred in a dry glovebox under Ar atmosphere. Analytical thin-layer chromatography was performed using silica gel pre-coated on aluminum sheets. Visualization of developed chromatograms was performed by exposure to UV or iodine vapor. Flash column chromatography was carried out using 230-400 mesh silica. All chemicals and solvents were purchased from Sigma-Aldrich and used without further purification. The 1H NMR spectra were recorded on a Bruker DMX 300 MHz and 13C NMR spectra were obtained using Bruker Avance 400 MHz NMR instrument. Chemical shifts in 1H NMR spectra are reported in parts per million (ppm) from tetramethylsilane, with the solvent resonance used as an internal standard. Data are presented in the following order: chemical shift, multiplicity (s = singlet, d = doublet, t = triplet, q = quartet, qn = quintet, sx = sextet, h = heptet, o = octet, m = multiplet, and br = broad), coupling constant in Hz, and integration. Chemical shifts for 13C NMR spectra are reported in parts per million (ppm) from tetramethylsilane, using the central peak of the solvent resonance as the internal standard.
The powder X-ray diffraction (XRD) patterns of MGFs were collected on a Rigaku D/MAX-2500 (18 kW) micro area X-ray diffractometer using CuKα (k = 0.154 nm) radiation. The X-ray diffractograms were recorded in the 2θ range of 5–70o with a 2θ step size of 0.15 and a step time of 1 s. The morphology of MGFs were investigated using a field emission scanning electron microscope (FE-SEM, Sirion). High resolution transmission electron microscopy (HRTEM, TECNAI) and energy-dispersive X-ray analyses (EDAX) were used for microstructure characterization and elemental mapping, respectively. Detailed characters of various chemical bonds in each sample were characterized by Raman spectroscopy (Horiba Jobin Yvon) equipped with a 633 nm wavelength He-Ne laser as well as Fourier-transform infrared spectroscopy (FTIR, Bruker) by preparing KBr pellets. X-ray photoelectron spectroscopy (XPS) analysis was performed with a multi-purpose XPS (Sigma Probe, Thermo VG Scientific, X-ray Source: monochromatic Al K(alpha)). The carbon, nitrogen and hydrogen of NGR samples were investigated using an element analyzer (FlashEA 2000 (Series) [C, H, N] Elemental Analyzer). The Ar adsorption and desorption isotherms were measured at 87 K on a Micrometrics 3Flex Surface Characterization Analyzer. All samples were outgassed at 200oC for 6 h prior to the analysis.
Electrochemical characterization: Electrochemical properties of 2D and 3D nitrogenated microporous graphitic frameworks (MGFs) were characterized in a typical three-electrode system using an SP-150 potentiostat (Bio-Logic, USA). A Ag/AgCl (3M NaCl) and a graphite rod were used as a reference electrode (RE) and a counter electrode (CE), respectively. Pt/C catalyst (20% Pt on Vulcan XC-72) and a glassy carbon electrode (GCE, 3 mm in diameter) were used for comparison. Catalytic inks of 2D- and 3D-MGFs were prepared as following: 8 mg of the synthesized 2D and 3D-MGF was added in a mixed solution of 80 µl of 5 wt% Nafion 117 solution (Sigma-Aldrich) and 1 mL of H2O/EtOH (80% v/v), followed by sonication for 1 h for homogenous dispersion. In order to measure the electrocatalytic activities of the catalysts, 5 µL of
S4
the mixed catalytic inks were dropped onto the GCE (i.e., loading amount of 0.566 mg cm-2) and dried under ambient conditions for overnight. All experiments were conducted in 0.5 M H2SO4 purged with ultrapure Ar gas (99.999 %) for 15 min to remove dissolved oxygen before measurements. All polarization curves (J-V) were compensated by iR-correction and recorded with the scan rate of 5 mV s-1 toward cathodic direction. Every current density was normalized with respect to the apparent surface area of the GCE (ca. 0.071 cm2). In addition, all potentials were expressed as reversible hydrogen electrode (RHE) by ERHE = EWE + (0.209 + 0.059 * pH) V. The electrochemical impedance spectroscopy (EIS) was carried out, collected at the applied potential of -0.40 V (vs. RHE) from 105 to 0.1 Hz.
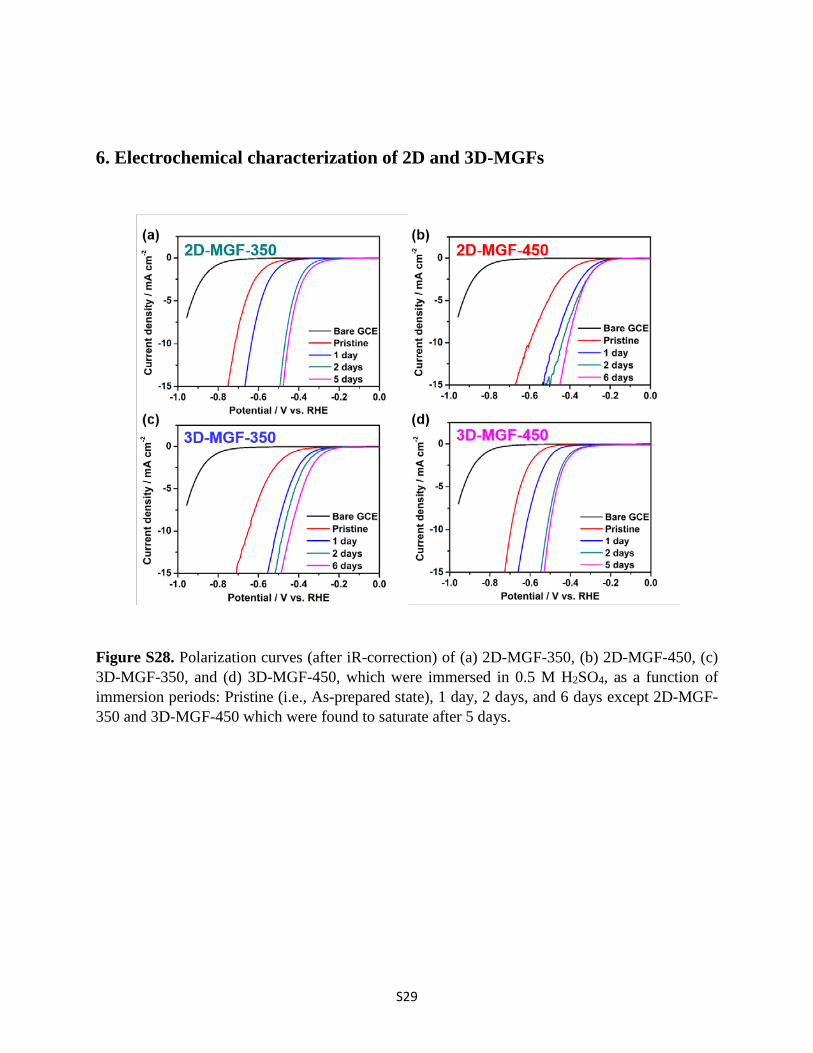
The improved electrocatalytic activity of 2D and 3D-MGFs was achieved by simply immersion into 0.5 M H2SO4 solution. We denoted such acid treated 2D and 3D-MGFs, as H+-2D-MGF and H+-3D-MGF, respectively. Meanwhile, in order to find the optimal immersion time, we have investigated the electrocatalytic activities of H+-2D-MGF and H+-3D-MGF with different immersion times using linear sweep voltammetry (LSV). As a result, we observed that the electrocatalytic activities of both 2D- and 3D-MGFs were gradually improved up to 6 days immersion, and afterwards, it became nearly saturated. Therefore, we performed all experiments with H+-2D- and H+-3D-MGFs which were immersed in 0.5 M H2SO4 solution for 6 days, unless otherwise stated.
2. Experimental procedures for the synthesis of MGFs
3D-MGF: 1,2,4,5-Benzenetetramine tetrahydrochloride (28.4 mg, 0.1 mmol), octaketotetraphenylene (21.0 mg, 0.05 mmol) and ZnCl2 (137 mg, 1.0 mmol) were mixed in a 10 mL pyrex ampoule. The ampoule was evacuated under vacuum, sealed and heated at the designated temperatures (350, 400 and 450ºC) for 15 h with 3ºC min-1 ramping. The ampule was cooled down to room temperature and the resulting black tablet was grounded in a mortar, washed thoroughly with aq. HCl solution (1 M) to remove the ZnCl2 residues, further rinsed with H2O, MeOH, and THF, filtered and dried under vacuum at room temperature for 24 h, to give 3D-MGF as a black powder with the isolated yields of 75-80%.
2D-MGF: 1,2,4,5-Benzenetetramine tetrahydrochloride (21.3 mg, 0.075 mmol), hexaketotriphenylene (16.0 mg, 0.05) and ZnCl2 (103 mg, 0.75 mmol) were mixed in a 10 mL pyrex ampoule. The ampoule was evacuated under vacuum, sealed and heated at the designated temperatures (350, 400 and 450ºC) for 15 h with 3ºC min-1 ramping. The ampule was cooled down to room temperature and the resulting black tablet was ground in a mortar, washed thoroughly with aq. HCl solution (1 M) to remove the ZnCl2 residues, further rinsed with H2O, MeOH, and THF, filtered and dried under vacuum at room temperature for 24 h, to give 2D-MGFs as black powder with the isolated yields of 81-85%.
S5
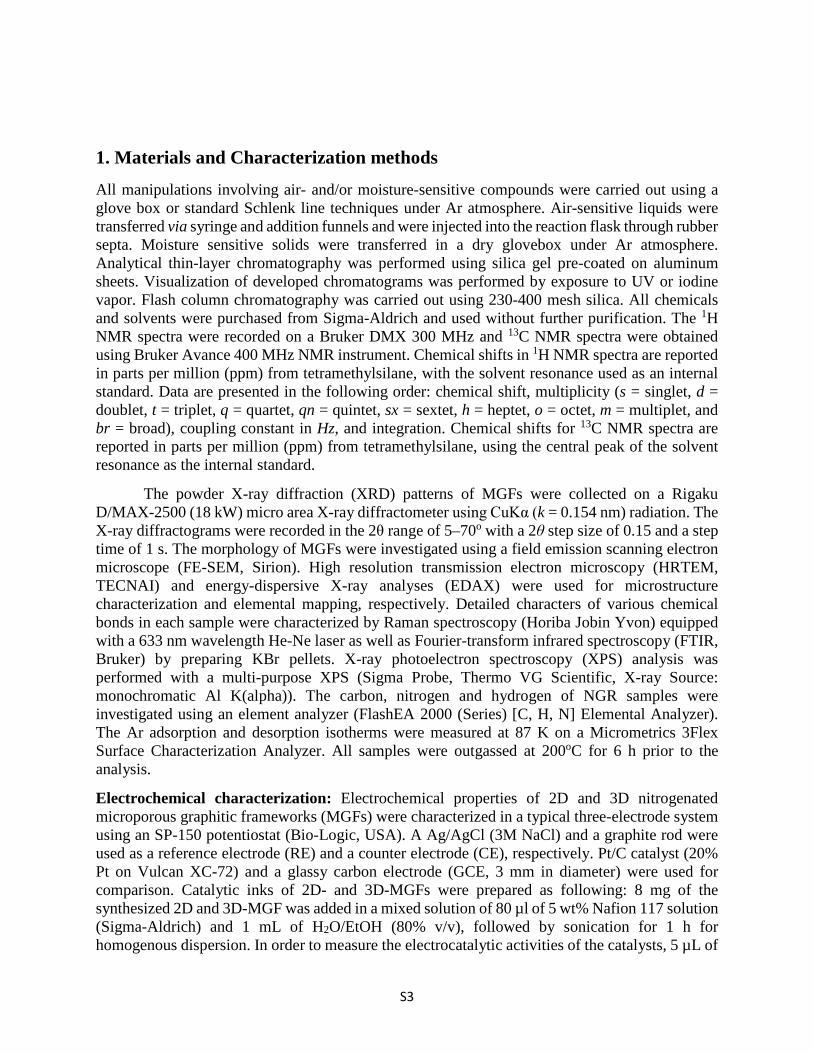
3. Synthesis and characterization of octaketotetraphenylene
Figure S1. Synthetic scheme for the preparation of octaketotetraphenylene.
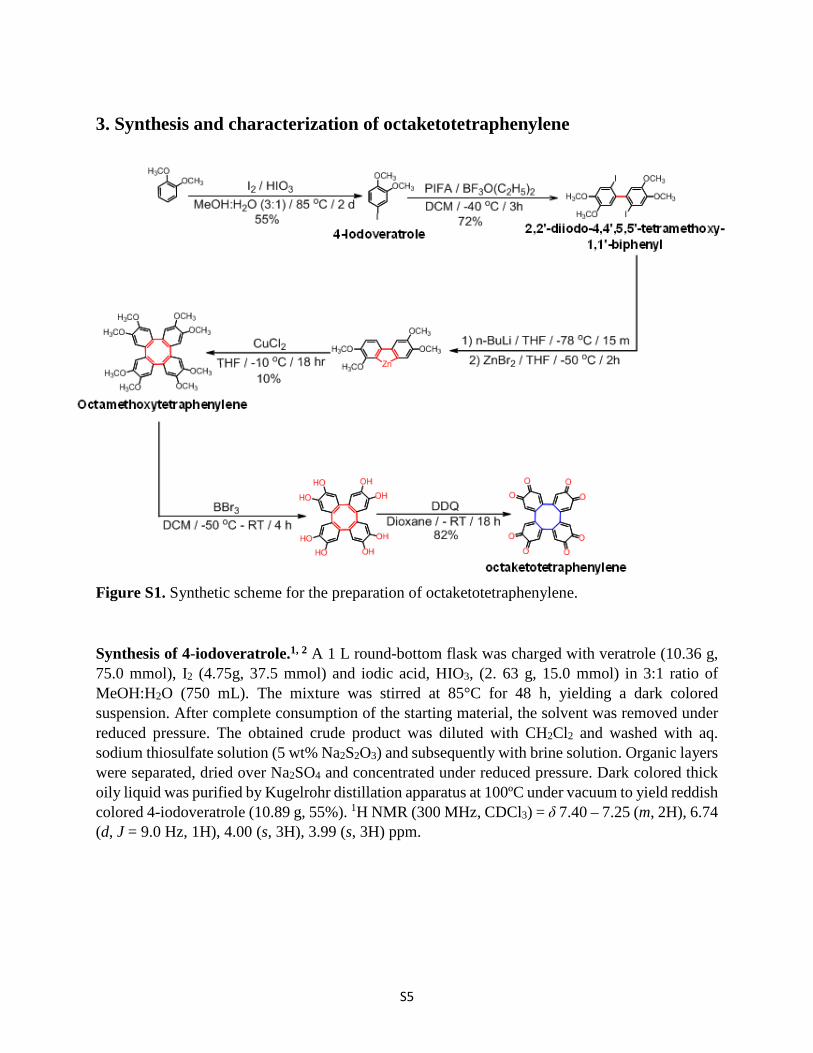
Synthesis of 4-iodoveratrole.1, 2 A 1 L round-bottom flask was charged with veratrole (10.36 g, 75.0 mmol), I2 (4.75g, 37.5 mmol) and iodic acid, HIO3, (2. 63 g, 15.0 mmol) in 3:1 ratio of MeOH:H2O (750 mL). The mixture was stirred at 85°C for 48 h, yielding a dark colored suspension. After complete consumption of the starting material, the solvent was removed under reduced pressure. The obtained crude product was diluted with CH2Cl2 and washed with aq. sodium thiosulfate solution (5 wt% Na2S2O3) and subsequently with brine solution. Organic layers were separated, dried over Na2SO4 and concentrated under reduced pressure. Dark colored thick oily liquid was purified by Kugelrohr distillation apparatus at 100ºC under vacuum to yield reddish colored 4-iodoveratrole (10.89 g, 55%). 1H NMR (300 MHz, CDCl3) = δ 7.40 – 7.25 (m, 2H), 6.74 (d, J = 9.0 Hz, 1H), 4.00 (s, 3H), 3.99 (s, 3H) ppm.
S6
Figure S2. 1H NMR (300 MHz, CDCl3, 298 K) spectrum of 4-iodoveratrole.
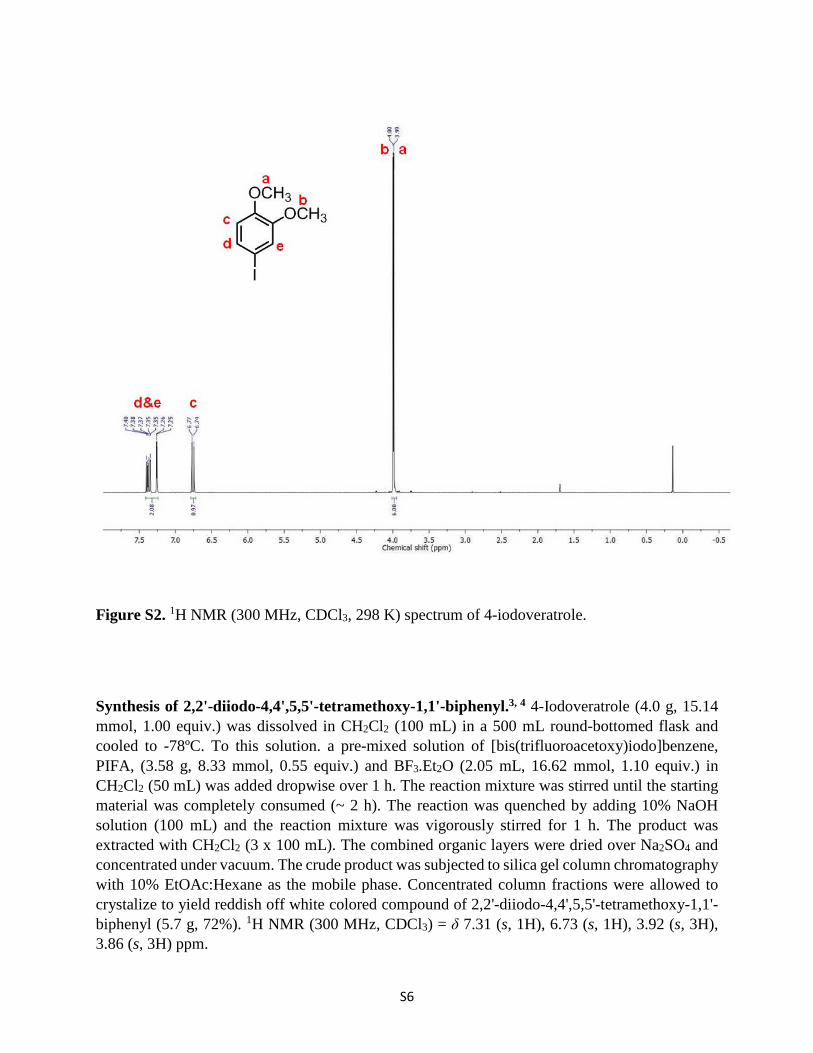
Synthesis of 2,2'-diiodo-4,4',5,5'-tetramethoxy-1,1'-biphenyl.3, 4 4-Iodoveratrole (4.0 g, 15.14 mmol, 1.00 equiv.) was dissolved in CH2Cl2 (100 mL) in a 500 mL round-bottomed flask and cooled to -78ºC. To this solution. a pre-mixed solution of [bis(trifluoroacetoxy)iodo]benzene, PIFA, (3.58 g, 8.33 mmol, 0.55 equiv.) and BF3.Et2O (2.05 mL, 16.62 mmol, 1.10 equiv.) in CH2Cl2 (50 mL) was added dropwise over 1 h. The reaction mixture was stirred until the starting material was completely consumed (~ 2 h). The reaction was quenched by adding 10% NaOH solution (100 mL) and the reaction mixture was vigorously stirred for 1 h. The product was extracted with CH2Cl2 (3 x 100 mL). The combined organic layers were dried over Na2SO4 and concentrated under vacuum. The crude product was subjected to silica gel column chromatography with 10% EtOAc:Hexane as the mobile phase. Concentrated column fractions were allowed to crystalize to yield reddish off white colored compound of 2,2'-diiodo-4,4',5,5'-tetramethoxy-1,1'-biphenyl (5.7 g, 72%). 1H NMR (300 MHz, CDCl3) = δ 7.31 (s, 1H), 6.73 (s, 1H), 3.92 (s, 3H), 3.86 (s, 3H) ppm.
S7
Figure S3. 1H NMR (300 MHz, CDCl3, 298 K) spectrum of 2,2'-diiodo-4,4',5,5'-tetramethoxy-1,1'-biphenyl.
Synthesis of Octamethoxytetraphenylene.5-7 To a cooled solution of 2,2'-diiodo-4,4',5,5'-tetramethoxy-1,1'-biphenyl (4.0 g, 7.6 mmol) in 200 mL of THF was dropwise added n-BuLi (10.4 mL, 16.73 mmol, 1.6 M in hexanes) at -78ºC for 15 min and the resulting mixture was stirred for 15 min. Then the temperature was raised to -50ºC and a solution of ZnBr2 (2.06 g, 9.13 mmol) in 50 mL THF was dropwise added over 15 min and the stirring was continued for additional 2 h at -50ºC. After cooling the reaction mixture to -78 ºC, CuCl2 (3.064 g, 22.8 mmol) was added. The resulting mixture was allowed to warm to room temperature and the stirring was continued for 18 h. The mixture was filtered over SiO2, washed with EtOAc (100 mL) and the combined organic layers were concentrated. The residue was diluted with CH2Cl2 (200 mL), washed with brine (500 mL), dried over Na2SO4 and finally evaporated under reduced pressure. The crude product was subjected to silica gel column chromatography with three phase solvent system of 25% EtOAc/CH2Cl2/Hexane as the mobile phase. Concentrated column fractions were allowed to recrystallized from iPr2O/CH2Cl2 to yield reddish colored compound of octamethoxytetraphenylene (0.4 g, 10%). 1H NMR (300 MHz, CDCl3) = 6.70 (s, 1H), 3.86 (s, 3H) ppm. 13C NMR (100 MHz, CDCl3) = δ 150.5, 136.7, 115.1, 58.6 ppm. MALDI-TOF-MS for C32H32O8 (calculated: 544.6), found: 544.3 ([M]+).
S8
Figure S4. 1H NMR (300 MHz, CDCl3, 298 K) spectrum of octamethoxytetraphenylene.
Figure S5. 13C NMR (100 MHz, CDCl3, 298 K) spectrum of octamethoxytetraphenylene.
S9
Synthesis of octaketotetraphenylene. Octamethoxytetraphenylene (0.27 g, 0.50 mmol) in 2.0 mL of CH2Cl2 was treated with 4.2 mL (4.2 mmol) BBr3 (1M solution in CH2Cl2) at -50ºC and stirred at same temperature for 1 h. The resulting mixture was stirred for additional 3 h at room temperature. The solvent was removed under vacuum and the residue was dissolved in degassed MeOH and stirred for 2 h. The solvent was removed and the residue was redissolved in 5 mL of dioxane and treated with 2,3-dichloro-5,6-dicyano-1,4-benzoquinone (DDQ: 0.115 g, 0.5 mmol) for 16 h at room temperature and filtered off, concentration of filtrate under reduced pressure afforded octaketotetraphenylene dark grey colored solid (0.17 g, 82%). 1H NMR (300 MHz, DMSO-d6) = 6.36 (s, 1H) ppm. 13C NMR (100 MHz, CDCl3) = δ 151.2, 120.5, 102.0, 72.3, 66.7 ppm ESI-HRMS calcd for m/z = 425.0292 [M − H]+, found m/z = 425.0231.
Figure S6. 1H NMR (300 MHz, DMSO-d6, 298 K) spectrum of octaketotetraphenylene.
S10
Figure S7. 13C NMR (100 MHz, DMSO-d6, 298 K) spectrum of octaketotetraphenylene.
4. Synthesis and characterization of hexaketotriphenylene
Figure S8. Synthetic scheme for the preparation of hexaketotriphenylene.
S11
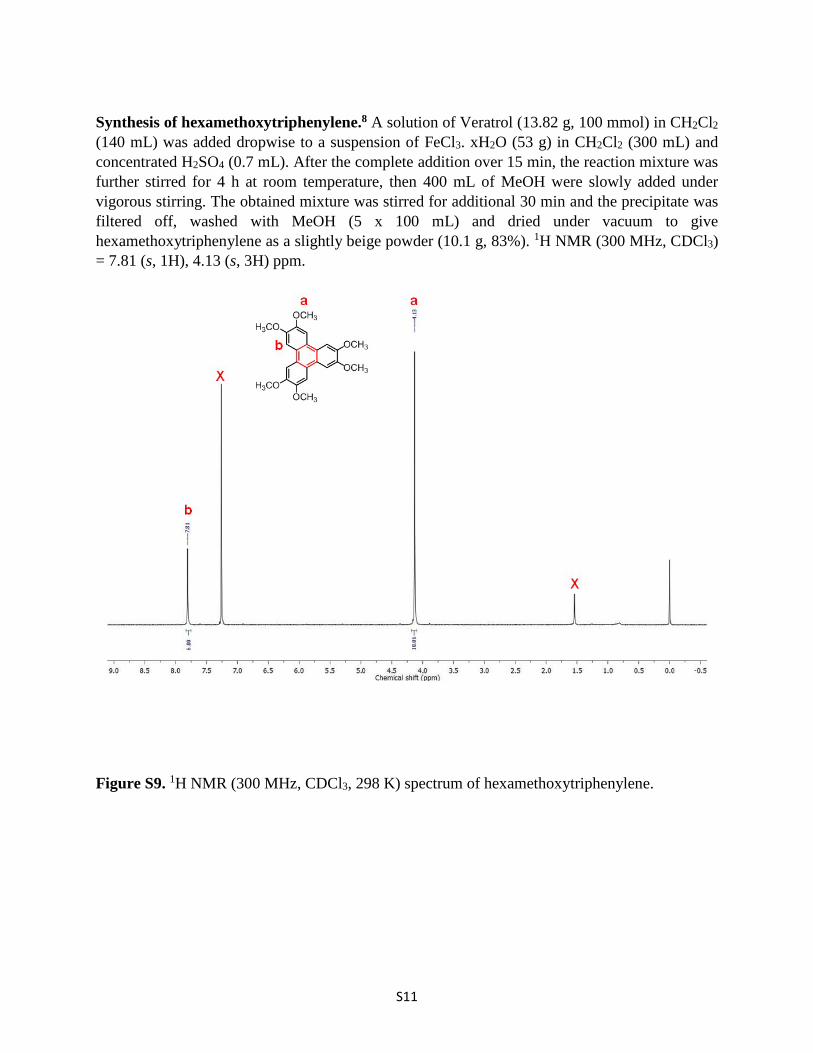
Synthesis of hexamethoxytriphenylene.8 A solution of Veratrol (13.82 g, 100 mmol) in CH2Cl2 (140 mL) was added dropwise to a suspension of FeCl3. xH2O (53 g) in CH2Cl2 (300 mL) and concentrated H2SO4 (0.7 mL). After the complete addition over 15 min, the reaction mixture was further stirred for 4 h at room temperature, then 400 mL of MeOH were slowly added under vigorous stirring. The obtained mixture was stirred for additional 30 min and the precipitate was filtered off, washed with MeOH (5 x 100 mL) and dried under vacuum to give hexamethoxytriphenylene as a slightly beige powder (10.1 g, 83%). 1H NMR (300 MHz, CDCl3) = 7.81 (s, 1H), 4.13 (s, 3H) ppm.
Figure S9. 1H NMR (300 MHz, CDCl3, 298 K) spectrum of hexamethoxytriphenylene.
S12
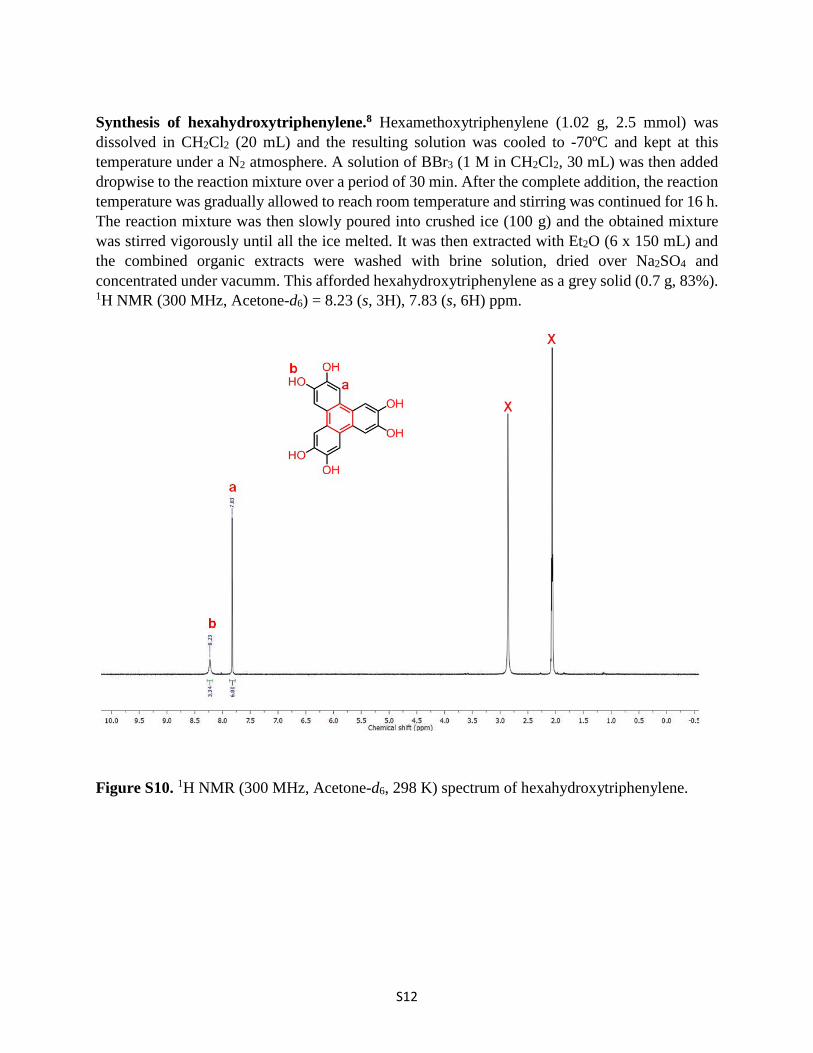
Synthesis of hexahydroxytriphenylene.8 Hexamethoxytriphenylene (1.02 g, 2.5 mmol) was dissolved in CH2Cl2 (20 mL) and the resulting solution was cooled to -70ºC and kept at this temperature under a N2 atmosphere. A solution of BBr3 (1 M in CH2Cl2, 30 mL) was then added dropwise to the reaction mixture over a period of 30 min. After the complete addition, the reaction temperature was gradually allowed to reach room temperature and stirring was continued for 16 h. The reaction mixture was then slowly poured into crushed ice (100 g) and the obtained mixture was stirred vigorously until all the ice melted. It was then extracted with Et2O (6 x 150 mL) and the combined organic extracts were washed with brine solution, dried over Na2SO4 and concentrated under vacumm. This afforded hexahydroxytriphenylene as a grey solid (0.7 g, 83%). 1H NMR (300 MHz, Acetone-d6) = 8.23 (s, 3H), 7.83 (s, 6H) ppm.
Figure S10. 1H NMR (300 MHz, Acetone-d6, 298 K) spectrum of hexahydroxytriphenylene.
S13
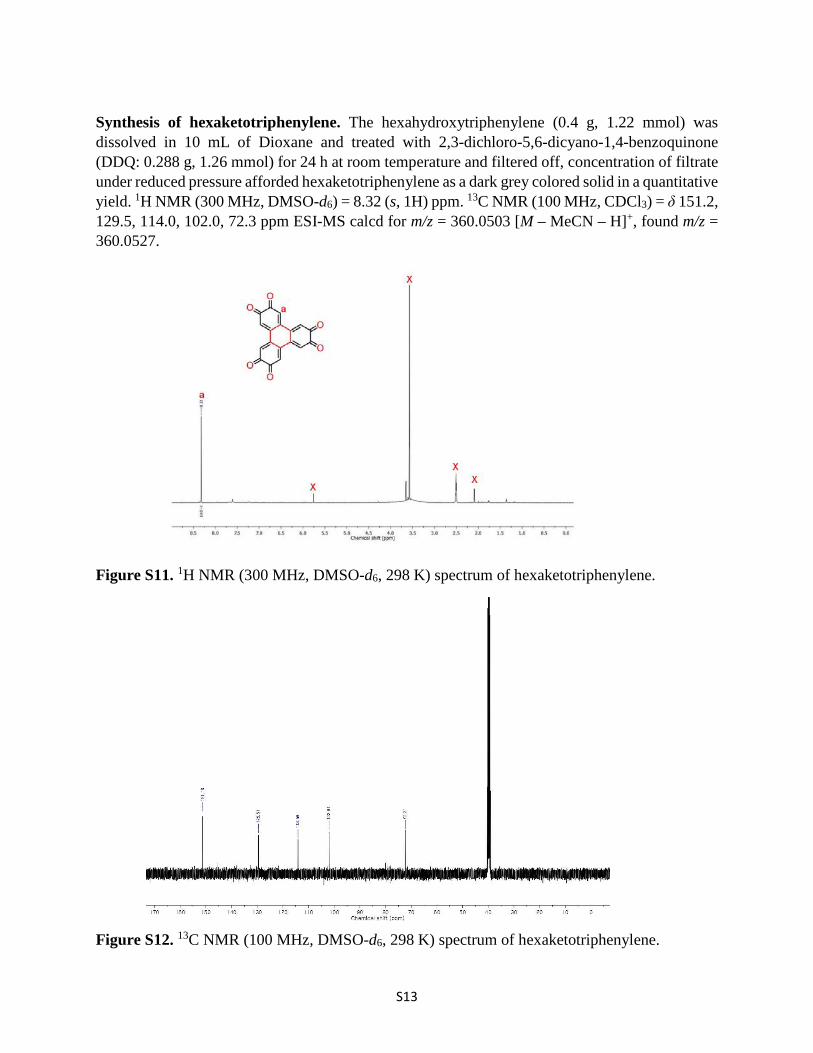
Synthesis of hexaketotriphenylene. The hexahydroxytriphenylene (0.4 g, 1.22 mmol) was dissolved in 10 mL of Dioxane and treated with 2,3-dichloro-5,6-dicyano-1,4-benzoquinone (DDQ: 0.288 g, 1.26 mmol) for 24 h at room temperature and filtered off, concentration of filtrate under reduced pressure afforded hexaketotriphenylene as a dark grey colored solid in a quantitative yield. 1H NMR (300 MHz, DMSO-d6) = 8.32 (s, 1H) ppm. 13C NMR (100 MHz, CDCl3) = δ 151.2, 129.5, 114.0, 102.0, 72.3 ppm ESI-MS calcd for m/z = 360.0503 [M – MeCN – H]+, found m/z = 360.0527.
Figure S11. 1H NMR (300 MHz, DMSO-d6, 298 K) spectrum of hexaketotriphenylene.
Figure S12. 13C NMR (100 MHz, DMSO-d6, 298 K) spectrum of hexaketotriphenylene.
S14
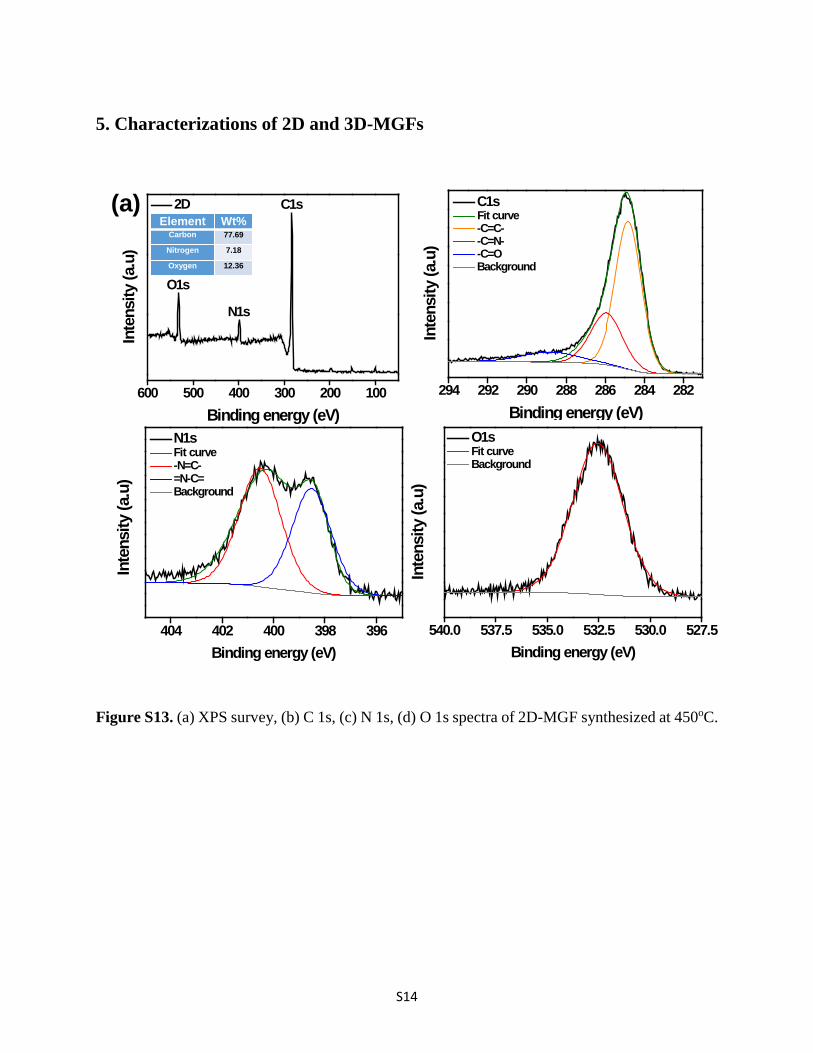
5. Characterizations of 2D and 3D-MGFs
Figure S13. (a) XPS survey, (b) C 1s, (c) N 1s, (d) O 1s spectra of 2D-MGF synthesized at 450oC.
404 402 400 398 396
Inte
nsity
(a.u
)
Binding energy (eV)
N1s Fit curve -N=C- =N-C= Background
294 292 290 288 286 284 282
C1s Fit curve -C=C- -C=N- -C=O Background
Inte
nsity
(a.u
)Binding energy (eV)
600 500 400 300 200 100
O1s
C1s 2D
Inte
nsity
(a.u
)
Binding energy (eV)
N1s
(a)Element Wt%
Carbon 77.69
Nitrogen 7.18
Oxygen 12.36
540.0 537.5 535.0 532.5 530.0 527.5
O1s Fit curve Background
Inte
nsity
(a.u
)
Binding energy (eV)
S15
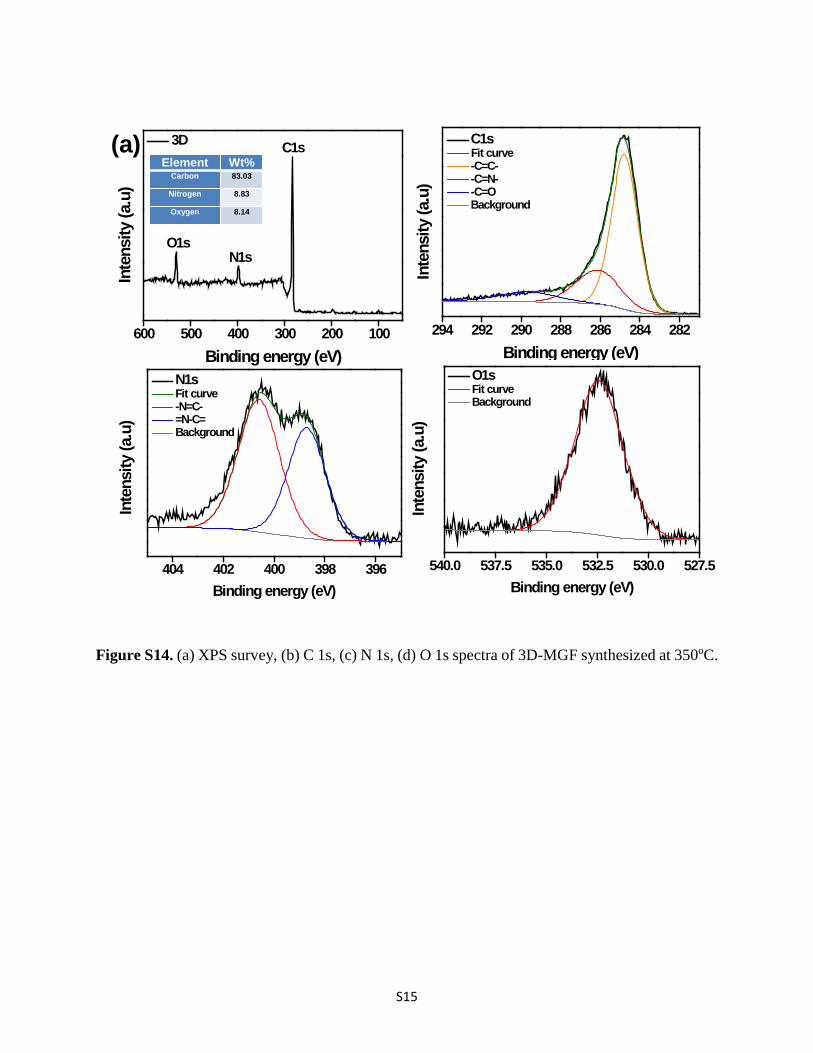
Figure S14. (a) XPS survey, (b) C 1s, (c) N 1s, (d) O 1s spectra of 3D-MGF synthesized at 350oC.
404 402 400 398 396
Inte
nsity
(a.u
)
Binding energy (eV)
N1s Fit curve -N=C- =N-C= Background
294 292 290 288 286 284 282
C1s Fit curve -C=C- -C=N- -C=O Background
Inte
nsity
(a.u
)
Binding energy (eV)600 500 400 300 200 100
O1s
C1s 3D
In
tens
ity (a
.u)
Binding energy (eV)
N1s
(a)Element Wt%
Carbon 83.03
Nitrogen 8.83
Oxygen 8.14
540.0 537.5 535.0 532.5 530.0 527.5
O1s Fit curve Background
Inte
nsity
(a.u
)
Binding energy (eV)
S16
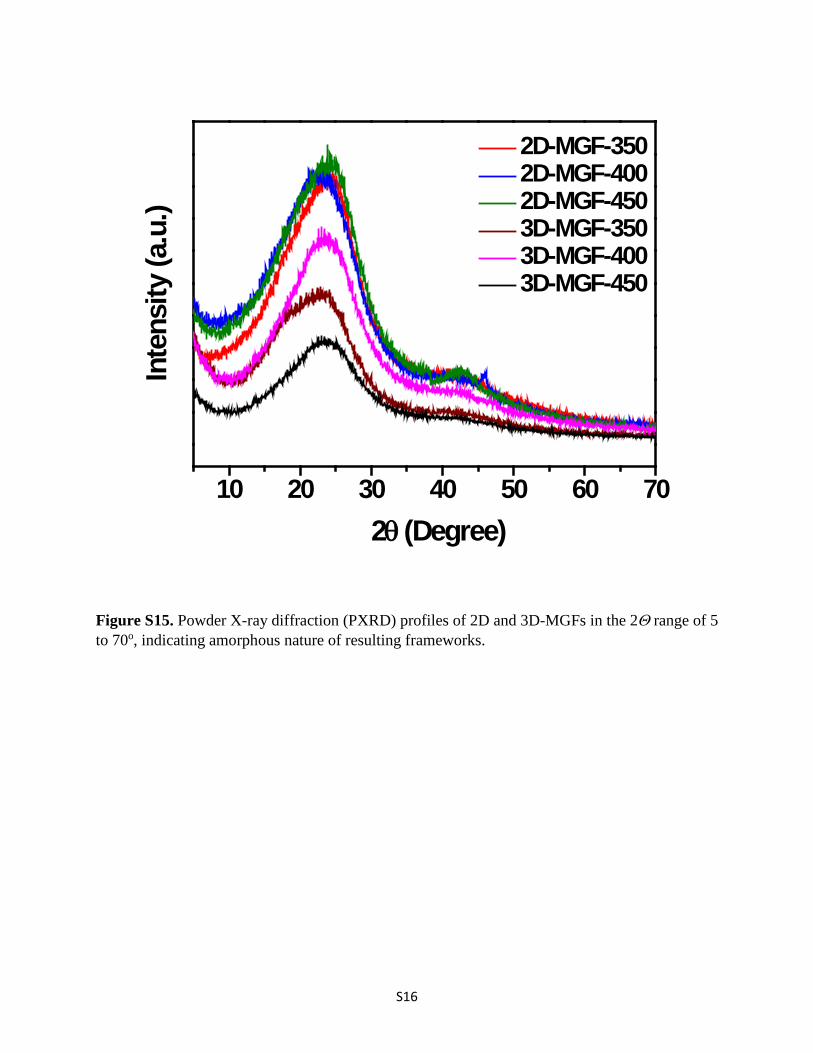
Figure S15. Powder X-ray diffraction (PXRD) profiles of 2D and 3D-MGFs in the 2Θ range of 5 to 70o, indicating amorphous nature of resulting frameworks.
10 20 30 40 50 60 70
2D-MGF-350 2D-MGF-400 2D-MGF-450 3D-MGF-350 3D-MGF-400 3D-MGF-450
Inte
nsity
(a.u
.)
2θ (Degree)
S17
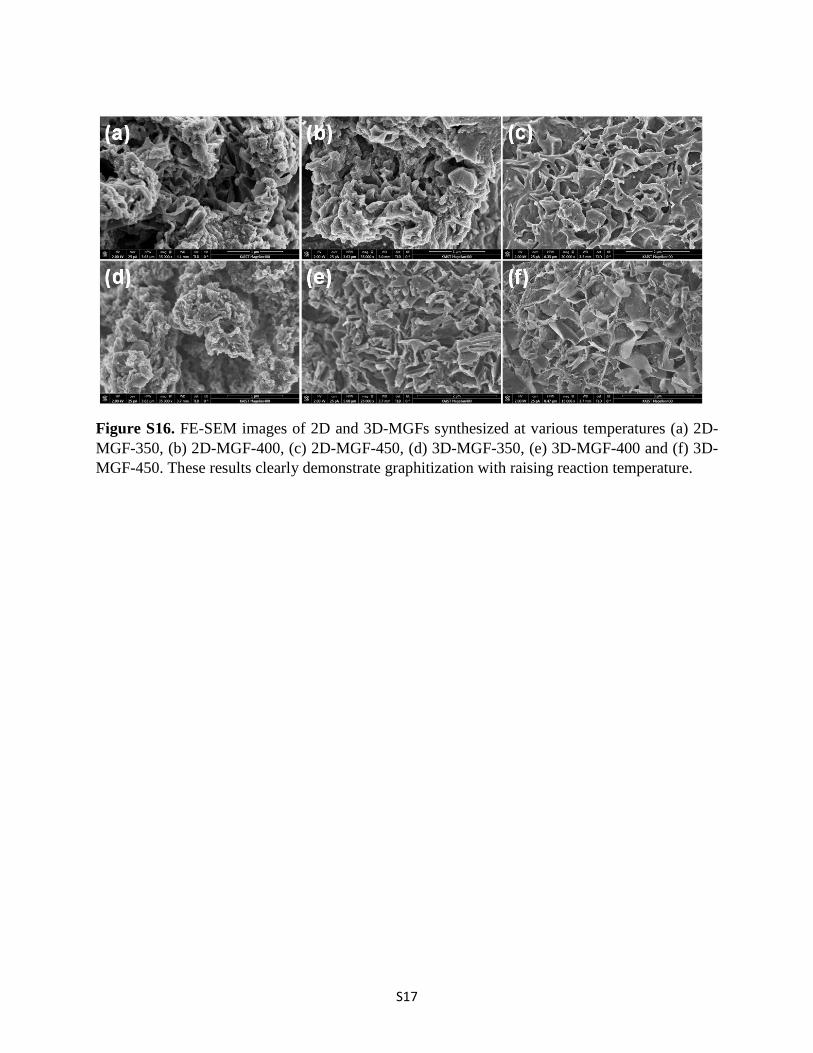
Figure S16. FE-SEM images of 2D and 3D-MGFs synthesized at various temperatures (a) 2D-MGF-350, (b) 2D-MGF-400, (c) 2D-MGF-450, (d) 3D-MGF-350, (e) 3D-MGF-400 and (f) 3D-MGF-450. These results clearly demonstrate graphitization with raising reaction temperature.
S18
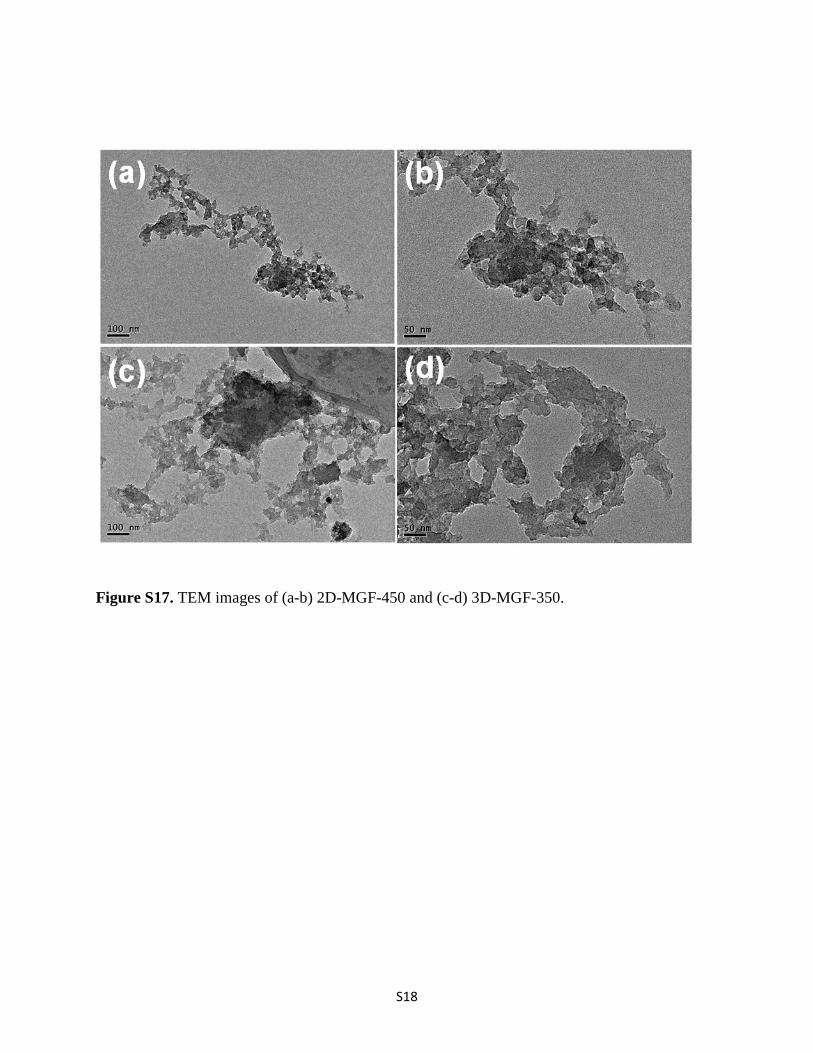
Figure S17. TEM images of (a-b) 2D-MGF-450 and (c-d) 3D-MGF-350.
S19
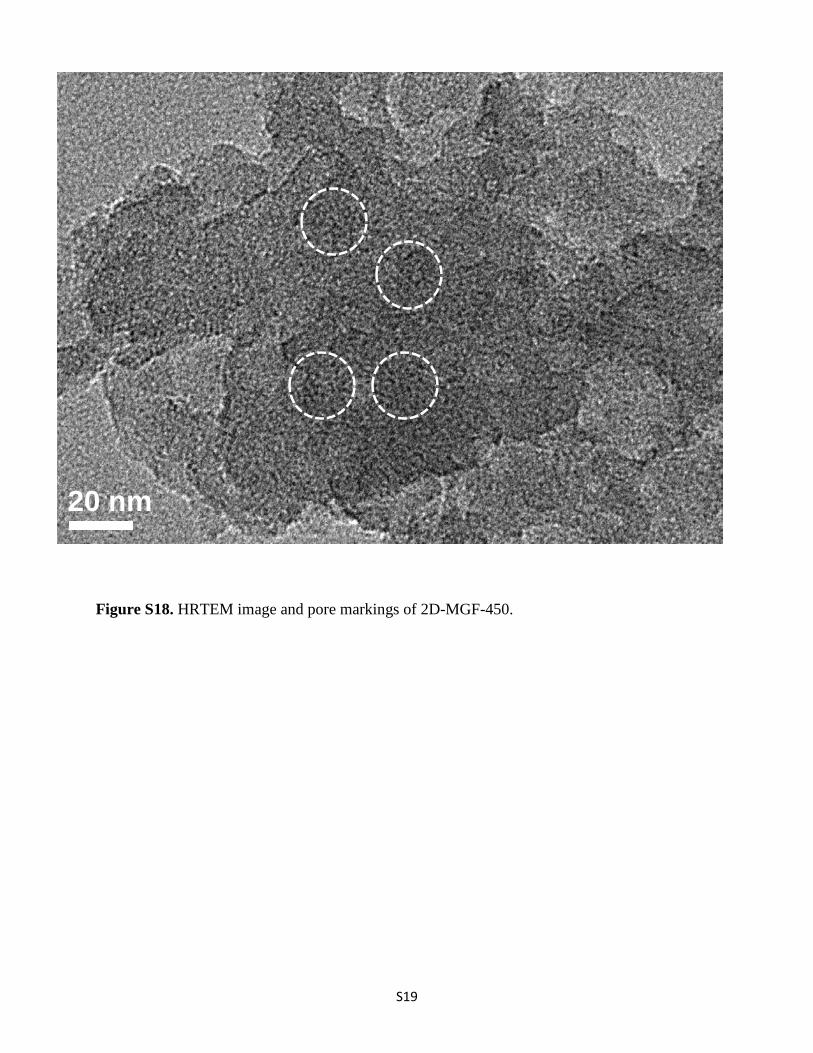
Figure S18. HRTEM image and pore markings of 2D-MGF-450.
20 nm
S20
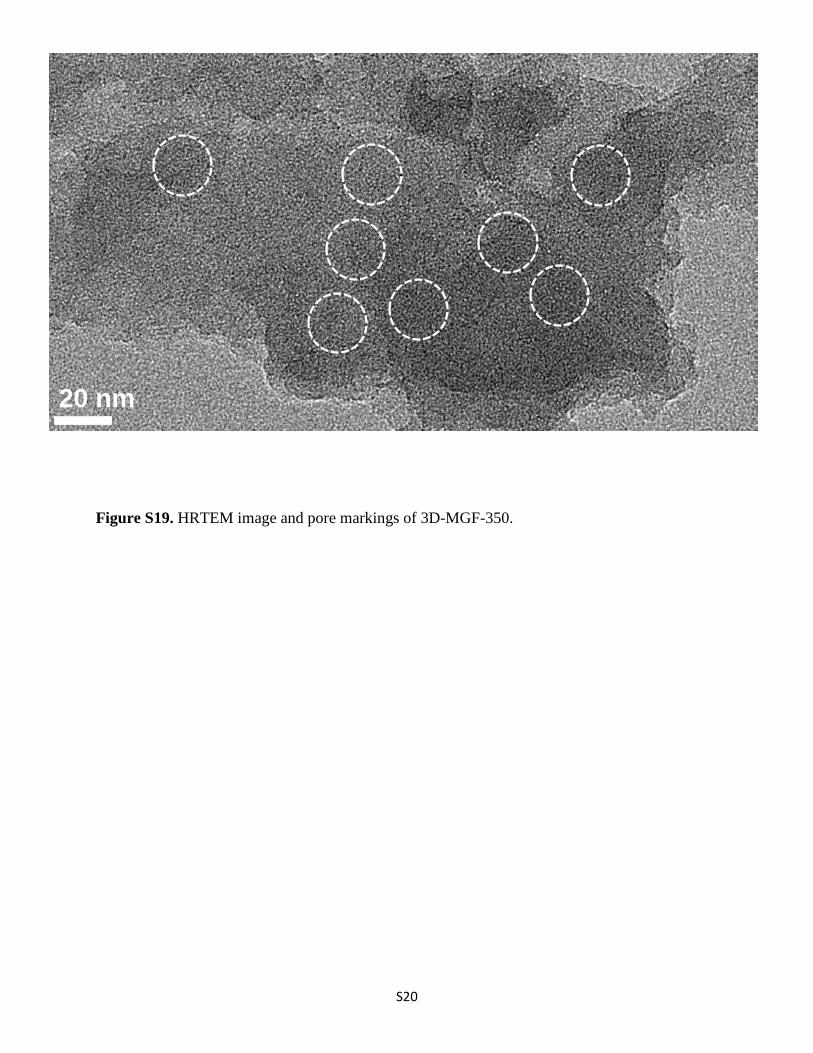
Figure S19. HRTEM image and pore markings of 3D-MGF-350.
20 nm
S21
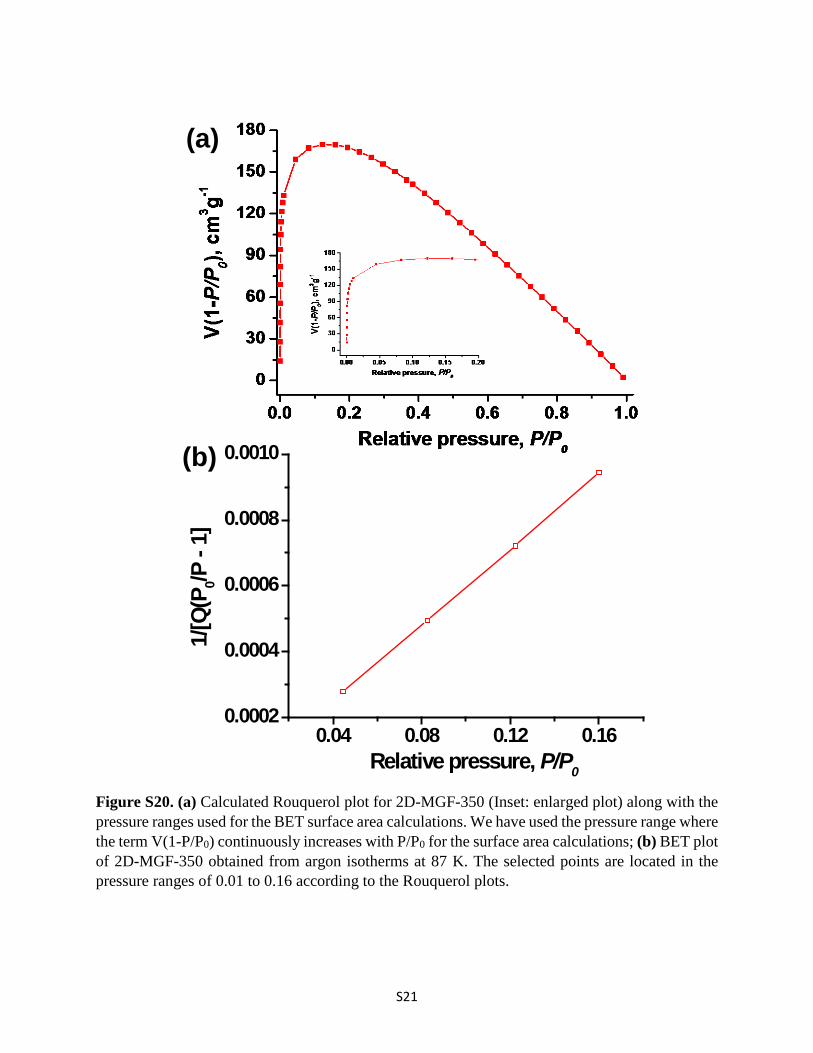
Figure S20. (a) Calculated Rouquerol plot for 2D-MGF-350 (Inset: enlarged plot) along with the pressure ranges used for the BET surface area calculations. We have used the pressure range where the term V(1-P/P0) continuously increases with P/P0 for the surface area calculations; (b) BET plot of 2D-MGF-350 obtained from argon isotherms at 87 K. The selected points are located in the pressure ranges of 0.01 to 0.16 according to the Rouquerol plots.
0.04 0.08 0.12 0.160.0002
0.0004
0.0006
0.0008
0.0010
1/[Q
(P0/P
- 1]
Relative pressure, P/P0
(a)
(b)
S22
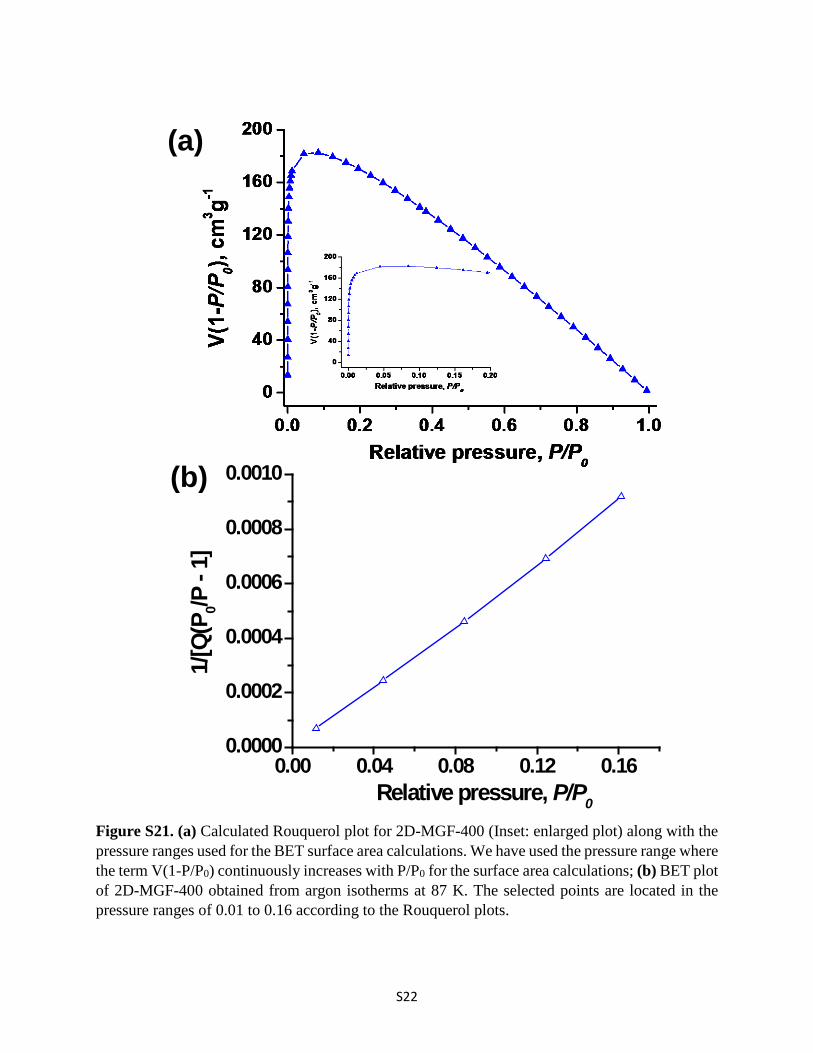
Figure S21. (a) Calculated Rouquerol plot for 2D-MGF-400 (Inset: enlarged plot) along with the pressure ranges used for the BET surface area calculations. We have used the pressure range where the term V(1-P/P0) continuously increases with P/P0 for the surface area calculations; (b) BET plot of 2D-MGF-400 obtained from argon isotherms at 87 K. The selected points are located in the pressure ranges of 0.01 to 0.16 according to the Rouquerol plots.
0.00 0.04 0.08 0.12 0.160.0000
0.0002
0.0004
0.0006
0.0008
0.0010
1/[Q
(P0/P
- 1]
Relative pressure, P/P0
(a)
(b)
S23
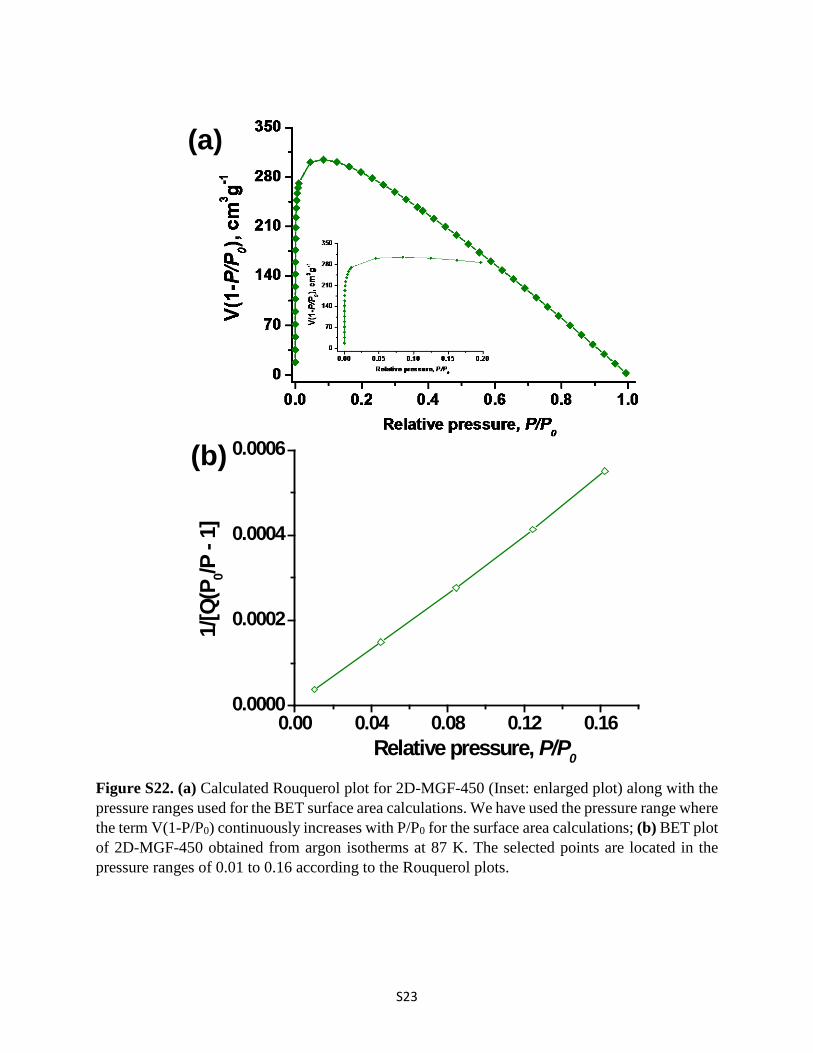
Figure S22. (a) Calculated Rouquerol plot for 2D-MGF-450 (Inset: enlarged plot) along with the pressure ranges used for the BET surface area calculations. We have used the pressure range where the term V(1-P/P0) continuously increases with P/P0 for the surface area calculations; (b) BET plot of 2D-MGF-450 obtained from argon isotherms at 87 K. The selected points are located in the pressure ranges of 0.01 to 0.16 according to the Rouquerol plots.
0.00 0.04 0.08 0.12 0.160.0000
0.0002
0.0004
0.0006
1/[Q
(P0/P
- 1]
Relative pressure, P/P0
(a)
(b)
S24
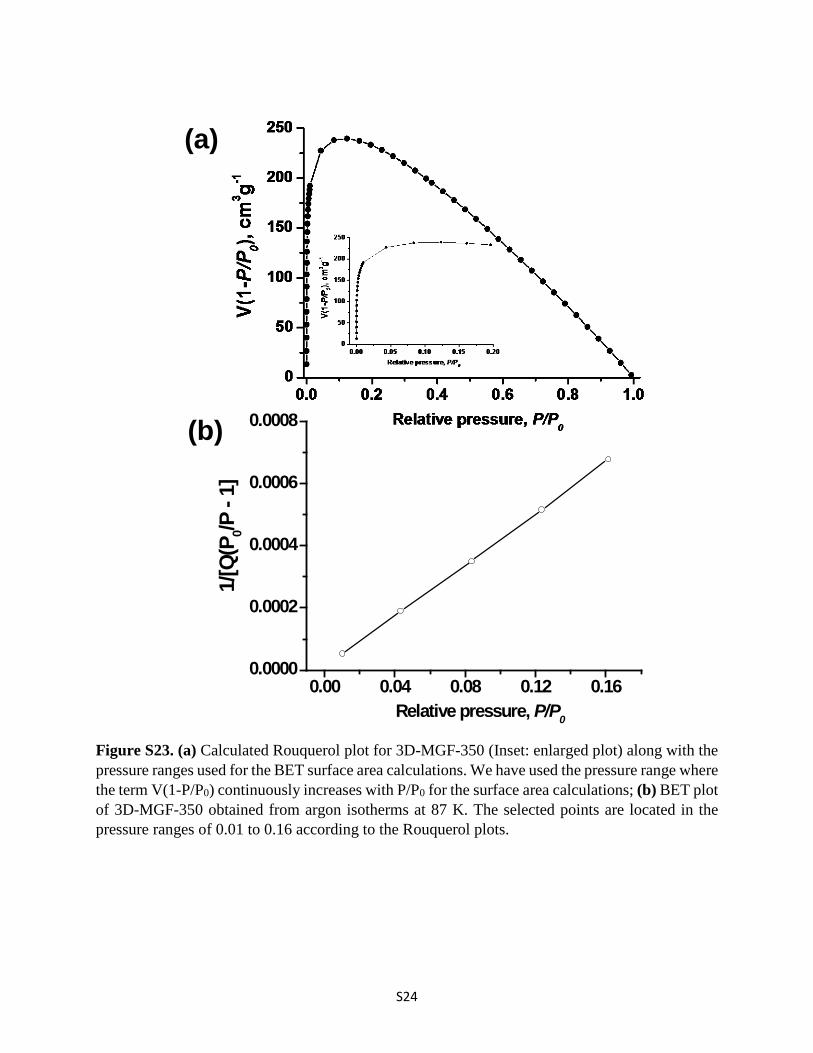
Figure S23. (a) Calculated Rouquerol plot for 3D-MGF-350 (Inset: enlarged plot) along with the pressure ranges used for the BET surface area calculations. We have used the pressure range where the term V(1-P/P0) continuously increases with P/P0 for the surface area calculations; (b) BET plot of 3D-MGF-350 obtained from argon isotherms at 87 K. The selected points are located in the pressure ranges of 0.01 to 0.16 according to the Rouquerol plots.
0.00 0.04 0.08 0.12 0.160.0000
0.0002
0.0004
0.0006
0.0008
1/[Q
(P0/P
- 1]
Relative pressure, P/P0
(a)
(b)
S25
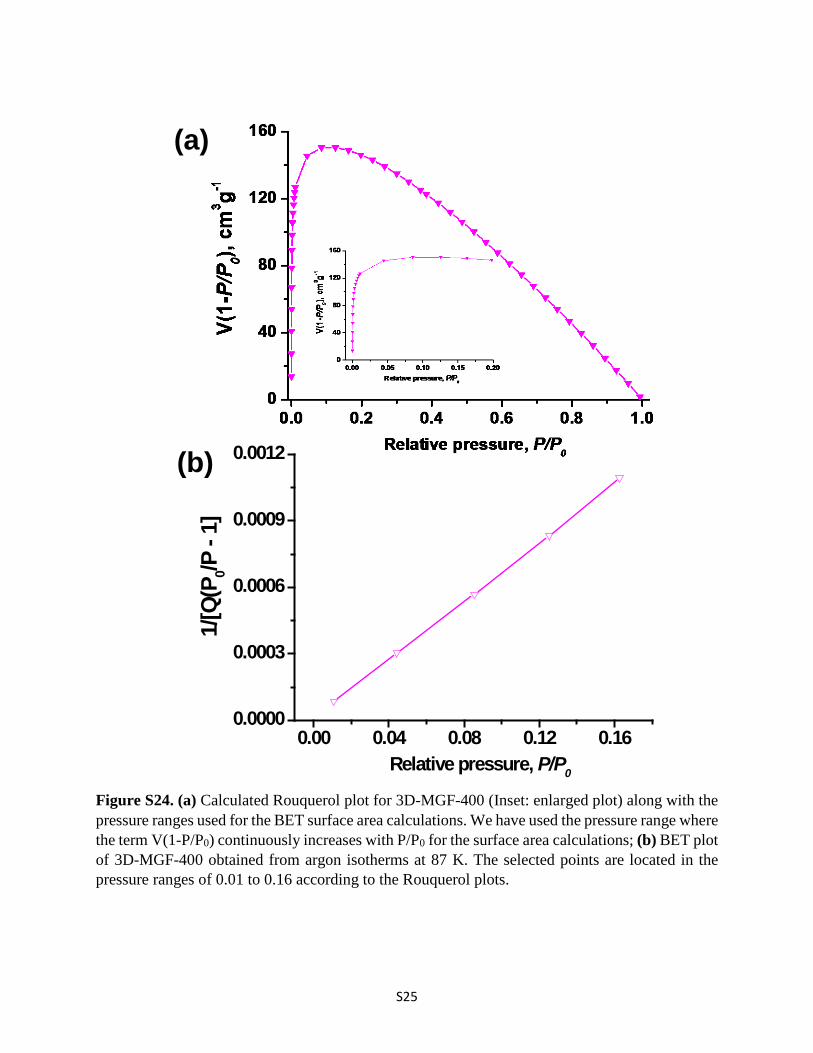
Figure S24. (a) Calculated Rouquerol plot for 3D-MGF-400 (Inset: enlarged plot) along with the pressure ranges used for the BET surface area calculations. We have used the pressure range where the term V(1-P/P0) continuously increases with P/P0 for the surface area calculations; (b) BET plot of 3D-MGF-400 obtained from argon isotherms at 87 K. The selected points are located in the pressure ranges of 0.01 to 0.16 according to the Rouquerol plots.
0.00 0.04 0.08 0.12 0.160.0000
0.0003
0.0006
0.0009
0.0012
1/[Q
(P0/P
- 1]
Relative pressure, P/P0
(a)
(b)
S26
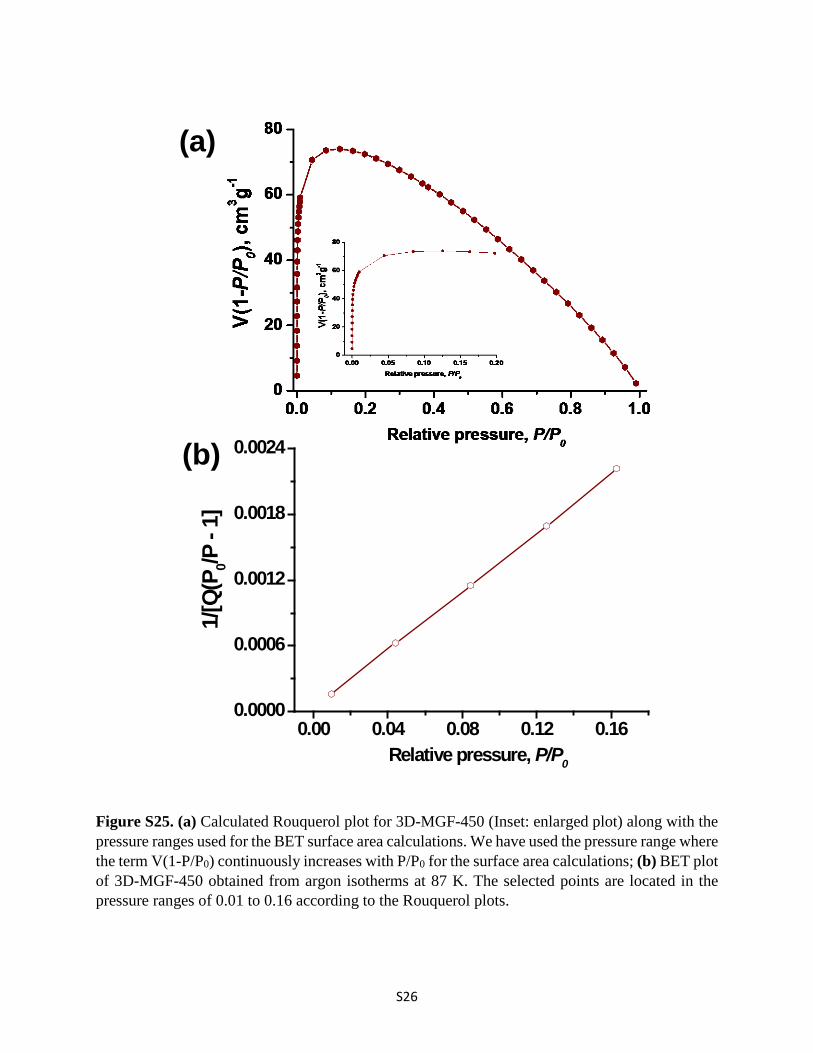
Figure S25. (a) Calculated Rouquerol plot for 3D-MGF-450 (Inset: enlarged plot) along with the pressure ranges used for the BET surface area calculations. We have used the pressure range where the term V(1-P/P0) continuously increases with P/P0 for the surface area calculations; (b) BET plot of 3D-MGF-450 obtained from argon isotherms at 87 K. The selected points are located in the pressure ranges of 0.01 to 0.16 according to the Rouquerol plots.
0.00 0.04 0.08 0.12 0.160.0000
0.0006
0.0012
0.0018
0.0024
1/[Q
(P0/P
- 1]
Relative pressure, P/P0
(a)
(b)
S25
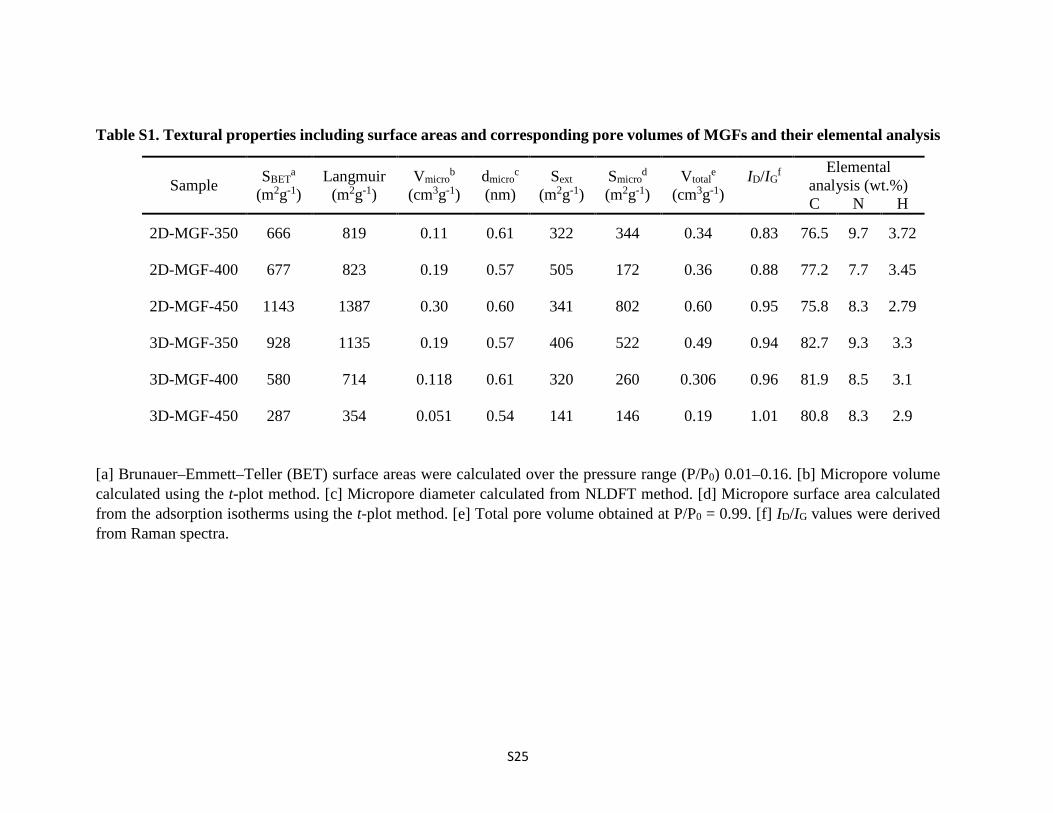
Table S1. Textural properties including surface areas and corresponding pore volumes of MGFs and their elemental analysis
Sample SBETa
(m2g-1) Langmuir
(m2g-1) Vmicro
b (cm3g-1)
dmicroc
(nm) Sext
(m2g-1) Smicro
d (m2g-1)
Vtotale
(cm3g-1) ID/IG
f
Elemental analysis (wt.%) C N H
2D-MGF-350 666 819 0.11 0.61 322 344 0.34 0.83 76.5 9.7 3.72
2D-MGF-400 677 823 0.19 0.57 505 172 0.36 0.88 77.2 7.7 3.45
2D-MGF-450 1143 1387 0.30 0.60 341 802 0.60 0.95 75.8 8.3 2.79
3D-MGF-350 928 1135 0.19 0.57 406 522 0.49 0.94 82.7 9.3 3.3
3D-MGF-400 580 714 0.118 0.61 320 260 0.306 0.96 81.9 8.5 3.1
3D-MGF-450 287 354 0.051 0.54 141 146 0.19 1.01 80.8 8.3 2.9
[a] Brunauer–Emmett–Teller (BET) surface areas were calculated over the pressure range (P/P0) 0.01–0.16. [b] Micropore volume calculated using the t-plot method. [c] Micropore diameter calculated from NLDFT method. [d] Micropore surface area calculated from the adsorption isotherms using the t-plot method. [e] Total pore volume obtained at P/P0 = 0.99. [f] ID/IG values were derived from Raman spectra.
S26
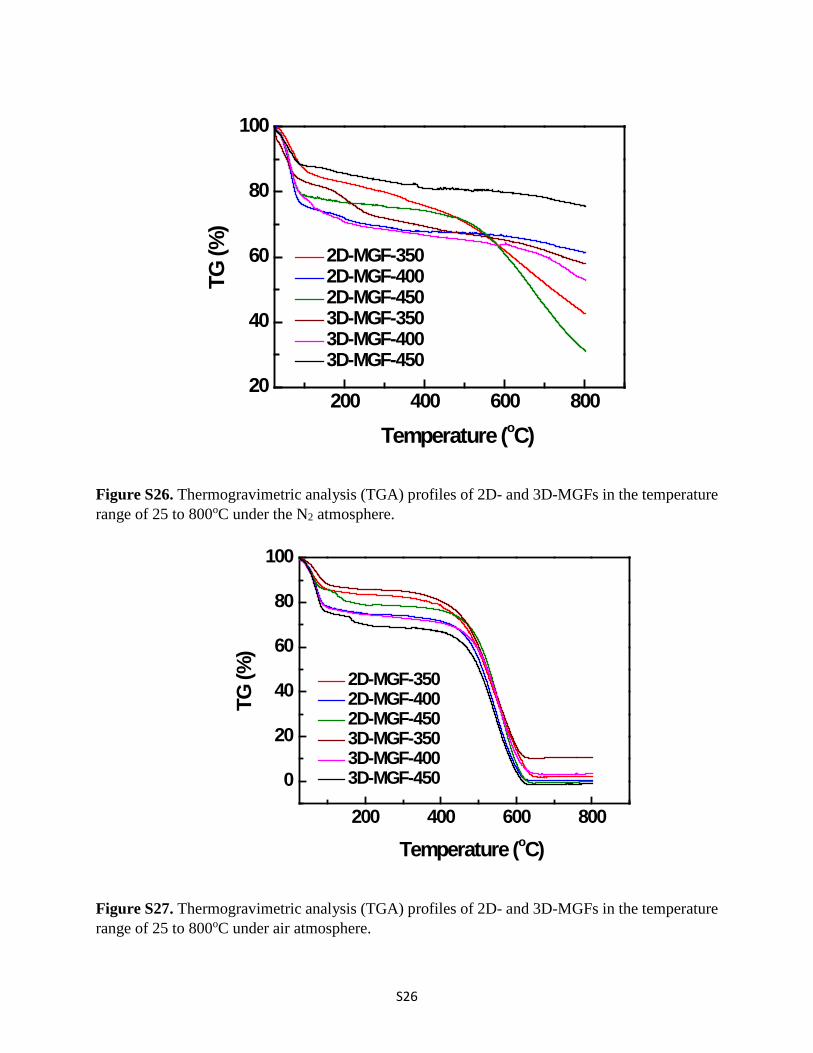
Figure S26. Thermogravimetric analysis (TGA) profiles of 2D- and 3D-MGFs in the temperature range of 25 to 800oC under the N2 atmosphere.
Figure S27. Thermogravimetric analysis (TGA) profiles of 2D- and 3D-MGFs in the temperature range of 25 to 800oC under air atmosphere.
200 400 600 800
0
20
40
60
80
100
2D-MGF-350 2D-MGF-400 2D-MGF-450 3D-MGF-350 3D-MGF-400 3D-MGF-450
TG (%
)
Temperature (oC)
200 400 600 80020
40
60
80
100
2D-MGF-350 2D-MGF-400 2D-MGF-450 3D-MGF-350 3D-MGF-400 3D-MGF-450
TG (%
)
Temperature (oC)
S29
6. Electrochemical characterization of 2D and 3D-MGFs
Figure S28. Polarization curves (after iR-correction) of (a) 2D-MGF-350, (b) 2D-MGF-450, (c) 3D-MGF-350, and (d) 3D-MGF-450, which were immersed in 0.5 M H2SO4, as a function of immersion periods: Pristine (i.e., As-prepared state), 1 day, 2 days, and 6 days except 2D-MGF-350 and 3D-MGF-450 which were found to saturate after 5 days.
S30
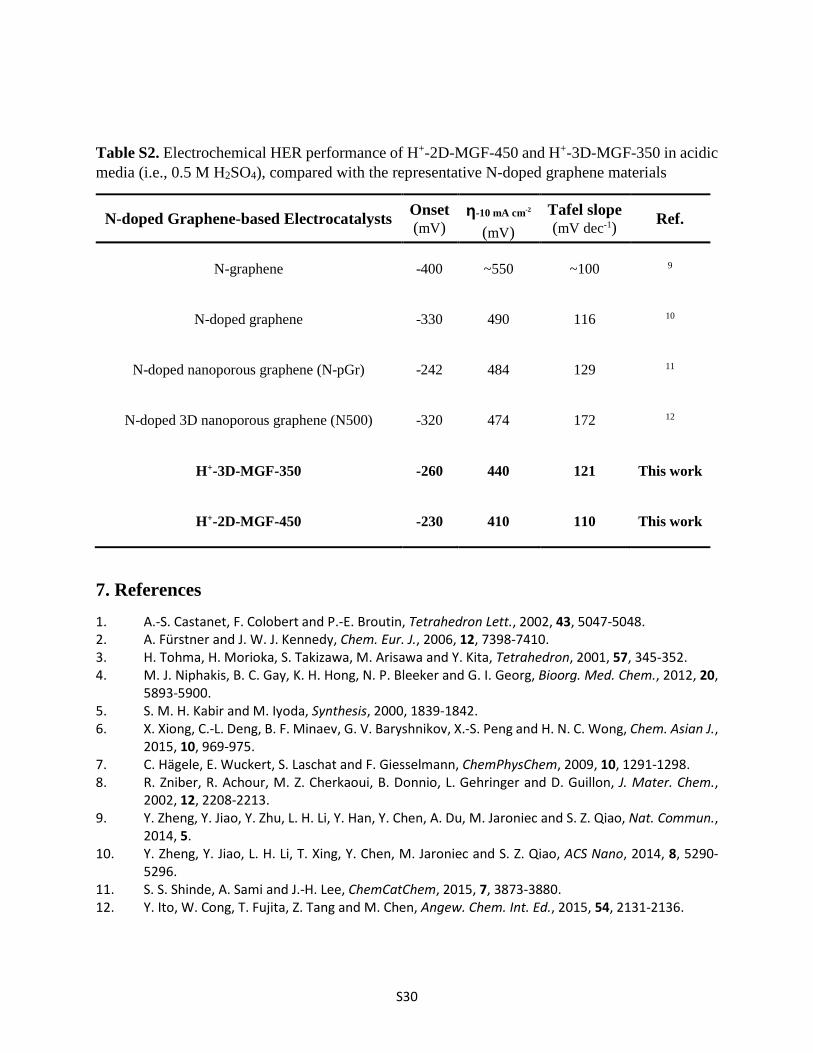
Table S2. Electrochemical HER performance of H+-2D-MGF-450 and H+-3D-MGF-350 in acidic media (i.e., 0.5 M H2SO4), compared with the representative N-doped graphene materials
N-doped Graphene-based Electrocatalysts Onset (mV)
η-10 mA cm-2 (mV)
Tafel slope (mV dec-1) Ref.
N-graphene -400 ~550 ~100 9
N-doped graphene -330 490 116 10
N-doped nanoporous graphene (N-pGr) -242 484 129 11
N-doped 3D nanoporous graphene (N500) -320 474 172 12
H+-3D-MGF-350 -260 440 121 This work
H+-2D-MGF-450 -230 410 110 This work
7. References
1. A.-S. Castanet, F. Colobert and P.-E. Broutin, Tetrahedron Lett., 2002, 43, 5047-5048. 2. A. Fürstner and J. W. J. Kennedy, Chem. Eur. J., 2006, 12, 7398-7410. 3. H. Tohma, H. Morioka, S. Takizawa, M. Arisawa and Y. Kita, Tetrahedron, 2001, 57, 345-352. 4. M. J. Niphakis, B. C. Gay, K. H. Hong, N. P. Bleeker and G. I. Georg, Bioorg. Med. Chem., 2012, 20,
5893-5900. 5. S. M. H. Kabir and M. Iyoda, Synthesis, 2000, 1839-1842. 6. X. Xiong, C.-L. Deng, B. F. Minaev, G. V. Baryshnikov, X.-S. Peng and H. N. C. Wong, Chem. Asian J.,
2015, 10, 969-975. 7. C. Hägele, E. Wuckert, S. Laschat and F. Giesselmann, ChemPhysChem, 2009, 10, 1291-1298. 8. R. Zniber, R. Achour, M. Z. Cherkaoui, B. Donnio, L. Gehringer and D. Guillon, J. Mater. Chem.,
2002, 12, 2208-2213. 9. Y. Zheng, Y. Jiao, Y. Zhu, L. H. Li, Y. Han, Y. Chen, A. Du, M. Jaroniec and S. Z. Qiao, Nat. Commun.,
2014, 5. 10. Y. Zheng, Y. Jiao, L. H. Li, T. Xing, Y. Chen, M. Jaroniec and S. Z. Qiao, ACS Nano, 2014, 8, 5290-
5296. 11. S. S. Shinde, A. Sami and J.-H. Lee, ChemCatChem, 2015, 7, 3873-3880. 12. Y. Ito, W. Cong, T. Fujita, Z. Tang and M. Chen, Angew. Chem. Int. Ed., 2015, 54, 2131-2136.


![Activity & Stability of [Emim] 2 ZnBr 2 Cl 2 & [Bu 4 N] 2 ZnBr 2 Cl 2 Catalysts due to Weight Ratio of Substrate/Catalyst & Temperature Variations Ethylene](https://img.pdfslide.us/doc/110x75/5514d39b55034640138b61d1/activity-stability-of-emim-2-znbr-2-cl-2-bu-4-n-2-znbr-2-cl-2-catalysts-due-to-weight-ratio-of-substratecatalyst-temperature-variations-ethylene.jpg)