Embed Size (px)
Citation preview

Electronic Supplementary Information (ESI)
Sensing protein antigen and microvesicle analytes using high-capacity biopolymer nano-carriers
Saroj Kumar,‡ac Gloria Milani,‡b Hideyo Takatsuki,‡a Tobia Lana,b Malin Persson,a Chiara Frasson,b Geertruy te Kronnie,b and Alf Mansson*a
a Department of Chemistry and Biomedical Sciences, Linnaeus University, SE-391 82 Kalmar, Sweden. E-mail: [email protected] b Department of Women’s and Children’s Health, University of Padova, 35128 Padova, Italy.c Present Address: Department of Biotechnology, Delhi Technological University, Delhi-110042, India‡ Authors contributed equally to this work.
Electronic Supplementary Material (ESI) for Analyst.This journal is © The Royal Society of Chemistry 2015
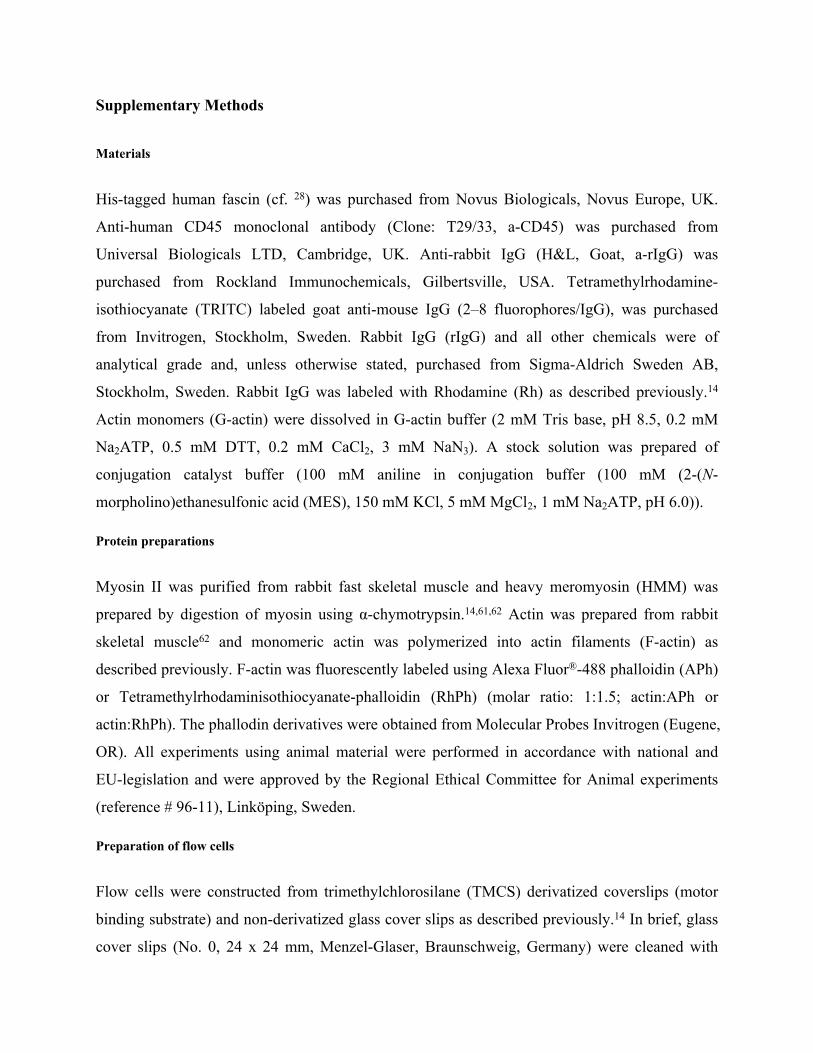
Supplementary Methods
Materials
His-tagged human fascin (cf. 28) was purchased from Novus Biologicals, Novus Europe, UK.
Anti-human CD45 monoclonal antibody (Clone: T29/33, a-CD45) was purchased from
Universal Biologicals LTD, Cambridge, UK. Anti-rabbit IgG (H&L, Goat, a-rIgG) was
purchased from Rockland Immunochemicals, Gilbertsville, USA. Tetramethylrhodamine-
isothiocyanate (TRITC) labeled goat anti-mouse IgG (2–8 fluorophores/IgG), was purchased
from Invitrogen, Stockholm, Sweden. Rabbit IgG (rIgG) and all other chemicals were of
analytical grade and, unless otherwise stated, purchased from Sigma-Aldrich Sweden AB,
Stockholm, Sweden. Rabbit IgG was labeled with Rhodamine (Rh) as described previously.14
Actin monomers (G-actin) were dissolved in G-actin buffer (2 mM Tris base, pH 8.5, 0.2 mM
Na2ATP, 0.5 mM DTT, 0.2 mM CaCl2, 3 mM NaN3). A stock solution was prepared of
conjugation catalyst buffer (100 mM aniline in conjugation buffer (100 mM (2-(N-
morpholino)ethanesulfonic acid (MES), 150 mM KCl, 5 mM MgCl2, 1 mM Na2ATP, pH 6.0)).
Protein preparations
Myosin II was purified from rabbit fast skeletal muscle and heavy meromyosin (HMM) was
prepared by digestion of myosin using α-chymotrypsin.14,61,62 Actin was prepared from rabbit
skeletal muscle62 and monomeric actin was polymerized into actin filaments (F-actin) as
described previously. F-actin was fluorescently labeled using Alexa Fluor®-488 phalloidin (APh)
or Tetramethylrhodaminisothiocyanate-phalloidin (RhPh) (molar ratio: 1:1.5; actin:APh or
actin:RhPh). The phallodin derivatives were obtained from Molecular Probes Invitrogen (Eugene,
OR). All experiments using animal material were performed in accordance with national and
EU-legislation and were approved by the Regional Ethical Committee for Animal experiments
(reference # 96-11), Linköping, Sweden.
Preparation of flow cells
Flow cells were constructed from trimethylchlorosilane (TMCS) derivatized coverslips (motor
binding substrate) and non-derivatized glass cover slips as described previously.14 In brief, glass
cover slips (No. 0, 24 x 24 mm, Menzel-Glaser, Braunschweig, Germany) were cleaned with

piranha solution (70% H2SO4 and 30% H2O2; Caution! Piranha solution is a highly corrosive
acidic solution that can react violently with organic materials. Do not store in a closed
container, and take appropriate safety precautions) at 80 °C for 5 min and washed sequentially
with deionized water (three times), methanol, dry acetone and dry chloroform (2 min each). The
slide was then dried (in N2 gas stream) and dipped in a freshly prepared TMCS solution (5%
TMCS in dry chloroform) for 2 min and washed twice with dry chloroform. Caution: TMCS is
highly flammable and reacts violently with water! TMCS derivatized substrate were kept in
deionized water for more than 30 min before they were dried and assembled into flow cells by
using double-sided adhesive tape as spacers.14 Successful TMCS derivatization was verified on
basis of advancing and receding contact angles for water droplets.14
Antibodies conjugated to F-actin
F-actin, conjugated with anti-human CD45 monoclonal antibody (a-CD45) or a-rIgG was
prepared using heterobifunctional cross-linkers.14 Briefly, the C6-succinimidyl 6-
hydrazinonicotinate acetone hydrazone (C6-SANH) modified F-actin was incubated with C6-
succinimidyl 4-formylbenzoate (C6-SFB) modified antibodies for 6 h at room temperature (21-
23 oC) using 2:1, G-actin:a-rIgG or a-CD45 molar ratio. Moreover, 10 mM catalyst buffer was
added from stock solution14 and later, after stipulated time, removed by dialysis at 4 °C against
G-actin buffer. Samples were flash frozen in liquid nitrogen and stored at -80 °C.
The conjugated G-actin monomers (actin-a-CD45 or actin-a-rIgG) were co-polymerized with
non-conjugated monomers to form filaments with 1:3 molar ratio of conjugated to non-
conjugated actin. The co-polymerization reaction was performed at 4 °C (3 h) by addition of
KCl, MgCl2 and ATP to final concentrations of 100 mM, 2 mM and 3.3 mM, respectively. The
co-polymer was fluorescence-labeled with APh or RhPh (molar ratio: 1:1.5; actin:APh or RhPh)
at 4 °C, overnight (see above).
In vitro motility assays and characterization of antibody-labeled fascin-actin bundles
In vitro motility assays were performed according to standard principles.14,29,61 All solutions
were based on buffer A: 10 mM 3-morpholinopropane-1-sulfonic acid (MOPS), 50 mM KCl, 1
mM MgCl2 and 0.1 mM K2-ethylene glycol tetraacetic acid (EGTA), pH 7.4. The flow cells were
sequentially incubated with (i) HMM (120 µg mL-1) for 5 min, (ii) 1 mg mL-1 BSA for 5 min,

(iii) wash with buffer B (10 mM MOPS, 45 mM KCl, 1 mM MgCl2, 0.1 mM K2EGTA, pH 7.4),
(iv) F-actin (10-15 nM) or fascin-arIgG-(or-aCD45)-actin bundles (60 nM) labeled with RhPh or
APh in buffer B (10 mM MOPS, 45 mM KCl, 1 mM MgCl2, pH 7.0) supplemented with an anti-
bleach system (10 mM dithiothreitol (DTT), 3 mg mL-1 glucose, 20 units mL-1 glucose oxidase
and 460 units mL-1 catalase). Then, we added antigen, either with Rh-rIgG for 1 min, or with
DND41 MVs or MG63 MVs for 5 min. The latter had been labeled with CFSE for 20 min. Flow
cells were then washed with buffer B with anti-bleach mixture, and (vi) incubated with assay
solution (1 mM Mg-ATP in buffer B with anti-bleach system). The sliding of F-actin or fascin-
actin bundles with or without a-rIgG or aCD45 was imaged using an epi-fluorescence
microscope (Eclipse TE300, Nikon, Tokyo, Japan) equipped with a temperature regulated (100x,
1.4 NA) oil immersion objective and TRITC (Ex. 540/25, DM 565, BA 605/25) as well as FITC
(Ex. 465–495, DM 505, and BA 515–555) filter sets. Image sequences were recorded using an
EMCCD camera (C9100; Hamamatsu Photonics, Hamamatsu, Japan). In some experiments we
instead used an Axio Observer DI inverted microscope, with 1.4 N.A. 63× planapochromat
objective (Zeiss, Jena, Germany), similar filter sets as for the Nikon microscope but a cooled
CCD camera (C4742-95, Orca-ER, Hamamatsu Photonics).
The filament sliding velocity was measured as described previously.63 The coefficient of
variation (CV) of the frame-to-frame velocity was similar at all Rh-rIgG incubation
concentrations except 10 nM. The CV values (mean ± SEM) were: 0.18 ± 0.10 (N=27); 0.22
±0.12 (N=31), 0.23 ±0.12 (N=30) at 0, 0.1 and 1 nM, respectively and 0.30 ± 0.09 (N=10) at 10
nM Rh-rIgG.
For fluorescence microscopy based characterization of antibody content of fascin-actin bundles,
the flow cells were pre-incubated as for in vitro motility assay: (i) HMM (120 µg mL-1) for 5
min, (ii) 1 mg mL-1 BSA for 5 min, (iii) wash with buffer B (10 mM MOPS, 50 mM KCl, 1 mM
MgCl2, 0.1 mM K2EGTA at pH 7.0). Next, however, the the following procedure followed: (iv)
fascin-a-rIgG-actin bundles (60 nM) labeled with APh in buffer C (10 mM MOPS, 45 mM KCl,
1 mM MgCl2 at pH 7.0 with an anti-bleach system), (v) wash with buffer C, (vi) 0, 0.1, 1 and 10
nM rhodamine labeled rabbit IgG in buffer D for 1 min, and (vii) wash with buffer C. The image
sequences were recorded using an EMCCD camera as described above. The number of

fluorescent antigens per bundle and the antibody/actin subunit ratio was calculated from the
corrected (Fig. S9) ratio of the background subtracted Rh-rIgG and APh fluorescence intensities.
CD45 expression: screening of cell lines and MVs isolation
Screening of CD45 expression in B and T leukemic cell lines was performed by flow cytometry
analyses (Fig. S5). DND41 cells were selected as positive control with 100% of CD45 (all cells
were positive for CD45) expression. The MG63 osteosarcoma cell line was chosen as negative
control; lack of CD45 expression was confirmed by FACS analysis (Fig. S6).
MVs isolation and preservation in MOPS buffer
MVs were isolated by centrifugation from both DND41 and MG63 cell medium, stained with
CFSE and examined by FACS to assure vesicles membrane integrity (only vesicles with an intact
membrane will retain CSFE). Isolated MVs were then labeled with CD45 antibody and CD45
expression was detected by cytometry, confirming high CD45 expression for MVs released from
DND41 cells and lack of CD45 expression for MVs of MG63 cells, as expected (Fig. S7-S8,
CD45 signal reported in gate P6). For MVs FACS analyses, 3 µm beads were used as size
reference (Fig. S7-S8, gate P3). CFSE+ events were detected (P5) after gating on MVs
morphological parameters (P2).
MVs were re-suspended in a MOPS based buffer (buffer A) and vesicle membrane integrity was
(re)checked by CFSE staining and flow cytometry analysis. PBS buffer is not ideal in a device
because high concentration of inorganic phosphate appreciably increases ionic strength and
affects ATP turnover of biomolecular motors. Therefore, MVs were re-suspended in MOPS
buffer, suitable in motility assays, and MVs preservation in MOPS buffer has been confirmed
after 2 hours (Fig. S10).
Optimization of CFSE staining
For MVs detection in the fluorescence microscope CFSE staining was optimized. To detect MVs
by flow cytometry, a final concentration of 1 µM CFSE was used. This concentration did not
allow a clear detection in fluorescence microscopy. The CFSE concentration was therefore

increased to 10 µM to better discriminate MVs from the background; moreover, another
washing/centrifugation step was added to decrease the CFSE background signal (Fig. S11).
MVs maintenance in PBS buffer
In order to use CFSE+ MVs to perform experiments some days after their isolation, we checked
MVs conservation during time. CFSE+ DND41 MVs were stored in PBS 1X at 4 °C. Their
number and integrity were checked at several points by FACS analyses and a good maintenance
was detected as reported in Fig. S12.
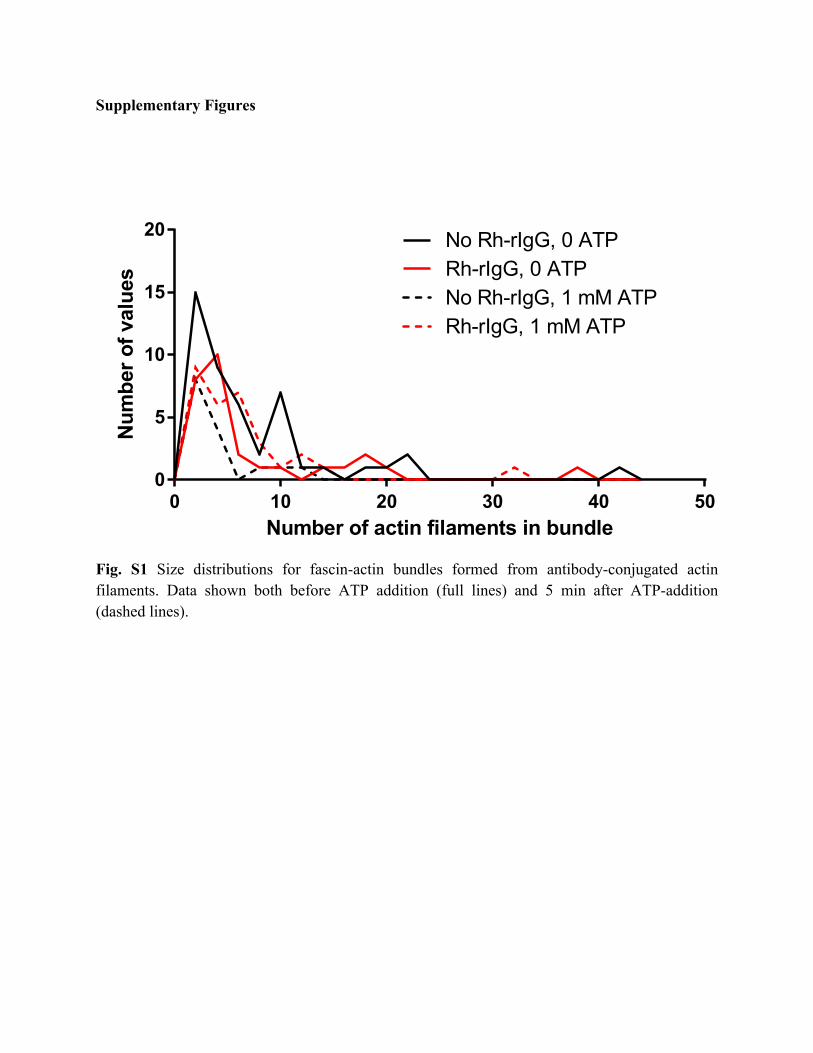
Supplementary Figures
0 10 20 30 40 500
5
10
15
20
Number of actin filaments in bundle
Num
ber o
f val
ues
No Rh-rIgG, 0 ATPRh-rIgG, 0 ATPNo Rh-rIgG, 1 mM ATPRh-rIgG, 1 mM ATP
Fig. S1 Size distributions for fascin-actin bundles formed from antibody-conjugated actin filaments. Data shown both before ATP addition (full lines) and 5 min after ATP-addition (dashed lines).

Fig. S2 Image frames from which main Fig. 2a-d was derived. For further information, see legend of main Fig. 2.

Fig. S3 Fascin actin-APh-labeled bundles and single APh-labeled actin filaments after incubation with 10 nM Rh-rIgG and 1 mM MgATP. (a) APh labeling observed using a FITC filter set in epi-fluorescence microscope. (b) Same region as in (a) a few seconds later after switch to TRITC filter set for observation of Rh-rIgG antigens captured by a-rIgG antibodies. Full length bold and thin arrows indicate non-motile bundles and single filaments, respectively. Arrow-heads indicate motile single actin filaments. Similar exposure time and gain in (a) and (b) (exposure time 0.1 s). Both images histogram stretched to the same extent to optimize brightness and contrast. The filaments and bundles are bound to a TMCS-surface coated with HMM in the presence of 1 mM MgATP. Note that all (stationary) bundles are branched to different degrees, indicating non-polar actin cross-linking presumably via a-rIgG-Rh-rIgG- a-rIgG links.
a b
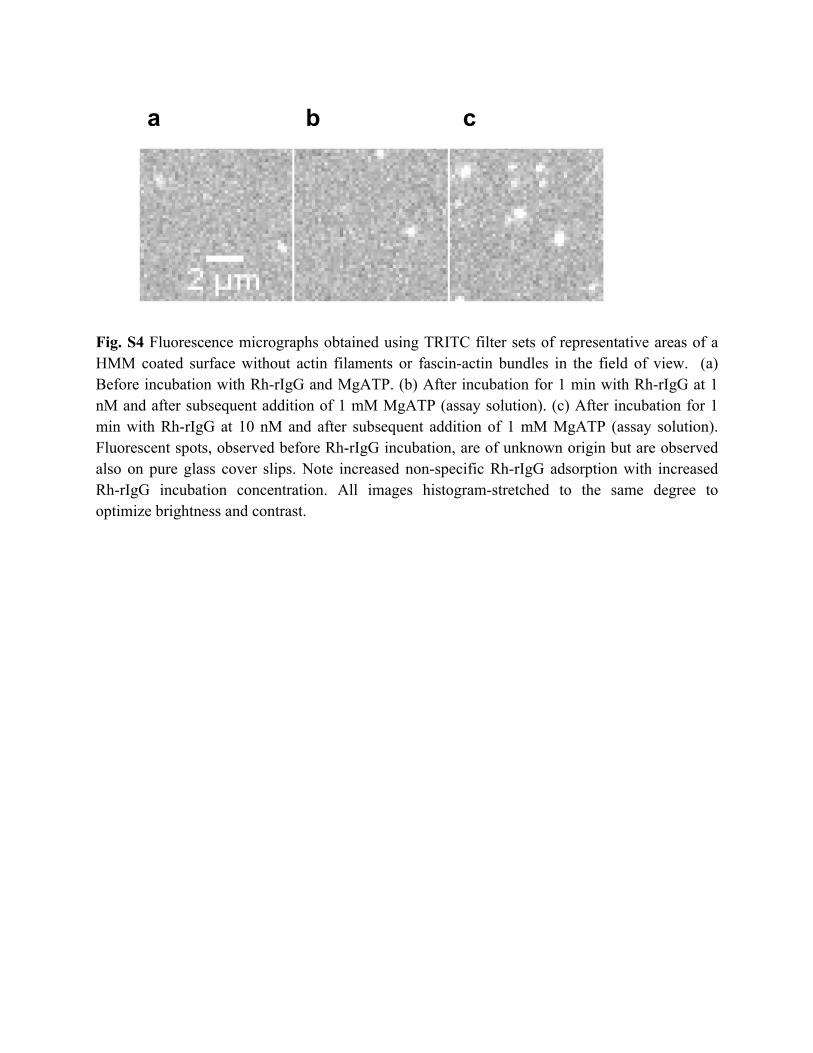
Fig. S4 Fluorescence micrographs obtained using TRITC filter sets of representative areas of a HMM coated surface without actin filaments or fascin-actin bundles in the field of view. (a) Before incubation with Rh-rIgG and MgATP. (b) After incubation for 1 min with Rh-rIgG at 1 nM and after subsequent addition of 1 mM MgATP (assay solution). (c) After incubation for 1 min with Rh-rIgG at 10 nM and after subsequent addition of 1 mM MgATP (assay solution). Fluorescent spots, observed before Rh-rIgG incubation, are of unknown origin but are observed also on pure glass cover slips. Note increased non-specific Rh-rIgG adsorption with increased Rh-rIgG incubation concentration. All images histogram-stretched to the same degree to optimize brightness and contrast.
a b c

Fig. S5 Screening of CD45 expression in B and T leukemic cell lines (labels to the right). For each cell line, the CD45 signal (horizontal axis; Texas-Red fluorescence intensity proportional to number of anti-CD45 antibodies) was detected by flow cytometry analysis, for negative controls and CD45+ stained cells.

Fig. S6 Flow cytometry CD45+ signal detection in selected in vitro models. DND41 cell line has been selected as positive control (100% of CD45 expression) and MG63 cell line has been chosen as negative control (0% of CD45 expression). The plots show the number of microvesicles vs the fluorescence intensity attributed to anti-CD45 antibodies.

Fig. S7 DND41 MVs unstained control (a) and DND41 MVs stained with CFSE and CD45 antibody (b). P2: MVs gate; P3: 3 µm beads gate; P4: CFSE+ signal; P5: CFSE+ MVs; P6: CD45+ signal; Q2-1: CFSE+/CD45+ MVs.
b
a

a
b
Fig. S8 MVs isolated from MG63 cell line. No CD45+ MVs have been detected both in unstained control (a) and in the CSFE+ CD45+ stained MVs (b). P2: MVs gate; P3: 3 µm beads gate; P4: CFSE+ signal; P5: CFSE+ MVs; P6: CD45+ signal; Q2-1: CFSE+/CD45+ MVs.

5 100
2000
4000
6000
Length of F-actin (µm)Fluo
resc
ence
inte
nsity
(uni
ts)
rhodamine-phalloidin F-actinalexa488-phalloidin F-actin
Fig. S9 Fluorescence intensity vs. filament length for several RhPh and APh labeled actin filaments in given fields of view. The ratio between the slopes gives a conversion factor to transform the fluorescence intensity per RhPh-molecule to that per APh-molecule. This factor takes into account all bases of this difference, including different extinction coefficient, different quantum yield and higher intensity of TRITC caused by higher excitation intensity (due to a spectral line in the Hg-lamp). Fluorescence microscopy data for actin filaments dually labeled by APh and Rh-rIgG then allowed estimate of the rIgG labeling density by comparing the total fluorescence intensity due to APh and Rh-rIgG on a given filament or bundle. This calculation assumed 362 APh molecules per 1 µm of an actin filament, 2 TRITC molecules per Rh-rIgG and the conversion factor between single molecule APh and Rh-rIgG fluorescence derived here.

a
b
Fig. S10 CFSE+ DND41 MVs stability in PBS (a) and in MOPS buffer (buffer A) (b). MVs stained with 1 mM of CFSE.

Fig. S11 Optimization of CFSE+ MVs staining for confocal microscopy detection. On the left, an example of MVs stained with 1 µM of CFSE. On the right, the optimized concentration of 10 µM.

MVs preservation in PBS 1X at 4°C[(N° MVs/uL)/P0]
00,20,40,60,8
11,2
day0 3days 6days 10days 13days(N° M
Vs/u
L)/N
° MVs
day
0
Fig. S12 CFSE+ DND41 MVs were storage in PBS 1X at 4 °C. Their number and integrity were checked at several points by FACS analyses and sufficient solidity of MVs was detected as reported below (number of MVs/µL divided by number of MVs at day 0). Three independent experiments have been performed.
Supplementary Movie legends
All movies shown in real time with size of movie frame, 66 x 66 µm2 in Movies S1-S4 and 53 x 53 µm2 in Movies S5-S6. The temperature was in the range 20-23 oC.
Movie S1 Motion of anti-rIgG-actin-fascin-bundles (green) and several anti-rIgG conjugated single filaments in the absence of rhodamine-rIgG on the heavy meromyosin-coated surface in the in vitro motility assay. Towards end of movie, switching from observation using FITC filter set (to visualize APh labeled filaments and bundles) to TRITC filter set.
Movie S2 Motion of anti-rIgG-actin-fascin-bundles (green) after incubation with 0.1 nM rhodamine-rIgG (red) for 1 min on the heavy meromyosin-adsorbed surface in the in vitro motility assay. Towards end of movie, switching from observation using FITC filter set (to visualize APh labeled filaments and bundles) to TRITC filter set (to visualize Rh-rIgG). Note, no unambiguously verified Rh-rIgG binding to any filament or bundle after 0.1 nM Rh-rIgG in this case.

Movie S3 Motion of anti-rIgG-actin-fascin-bundles (green) after incubation with 1 nM rhodamine-rIgG (red) on the heavy meromyosin-adsorbed surface in the in vitro motility assay. Towards end of movie, switching from observation using FITC filter set (to visualize APh labeled filaments and bundles) to TRITC filter set (to visualize Rh-rIgG).
Movie S4 Motion of anti-rIgG-actin-fascin-bundles (green) after incubation with 10 nM rhodamine-rIgG (red) on the heavy meromyosin-adsorbed surface in the in vitro motility assay. Towards end of movie, switching from observation using FITC filter set (to visualize APh labeled filaments and bundles) to TRITC filter set (to visualize Rh-rIgG).
Movie S5 Unidirectional movement of anti-CD45-actin-fascin-bundles (red) in the presence of microvesicles (green) on the heavy meromyosin-adsorbed surface in the in vitro motility assay. Towards end of movie, switching from observation using TRITC filter set (to visualize RhPh labeled filaments and bundles) to FITC filter set (to visualize CFSE labeled microvesicles).
Movie S6 Small and large aggregates of stationary anti-CD45-actin-fascin-bundles (red) in the presence of microvesicles (green) on the heavy meromyosin-adsorbed surface in the in vitro motility assay. Towards end of movie, switching from observation using TRITC filter set (to visualize RhPh labeled filaments and bundles) to FITC filter set (to visualize CFSE labeled microvesicles).