Embed Size (px)
Citation preview
S1
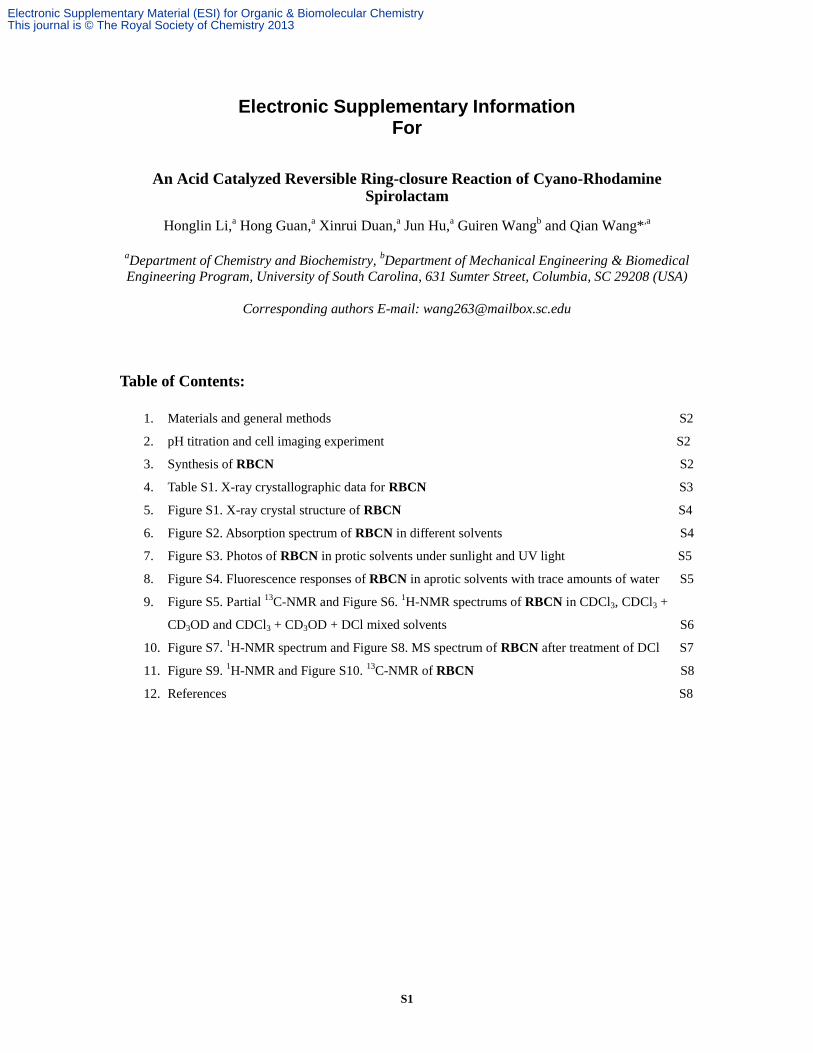
Electronic Supplementary Information For
An Acid Catalyzed Reversible Ring-closure Reaction of Cyano-Rhodamine Spirolactam
Honglin Li,a Hong Guan,
a Xinrui Duan,
a Jun Hu,
a Guiren Wang
b and Qian Wang*
,a
aDepartment of Chemistry and Biochemistry,
bDepartment of Mechanical Engineering & Biomedical
Engineering Program, University of South Carolina, 631 Sumter Street, Columbia, SC 29208 (USA)
Corresponding authors E-mail: [email protected]
Table of Contents:
1. Materials and general methods
S2
2. pH titration and cell imaging experiment S2
3. Synthesis of RBCN S2
4. Table S1. X-ray crystallographic data for RBCN S3
5. Figure S1. X-ray crystal structure of RBCN S4
6. Figure S2. Absorption spectrum of RBCN in different solvents S4
7. Figure S3. Photos of RBCN in protic solvents under sunlight and UV light S5
8. Figure S4. Fluorescence responses of RBCN in aprotic solvents with trace amounts of water S5
9. Figure S5. Partial 13
C-NMR and Figure S6. 1H-NMR spectrums of RBCN in CDCl3, CDCl3 +
CD3OD and CDCl3 + CD3OD + DCl mixed solvents S6
10. Figure S7. 1H-NMR spectrum and Figure S8. MS spectrum of RBCN after treatment of DCl S7
11. Figure S9. 1H-NMR and Figure S10.
13C-NMR of RBCN S8
12. References S8
Electronic Supplementary Material (ESI) for Organic & Biomolecular ChemistryThis journal is © The Royal Society of Chemistry 2013
S2
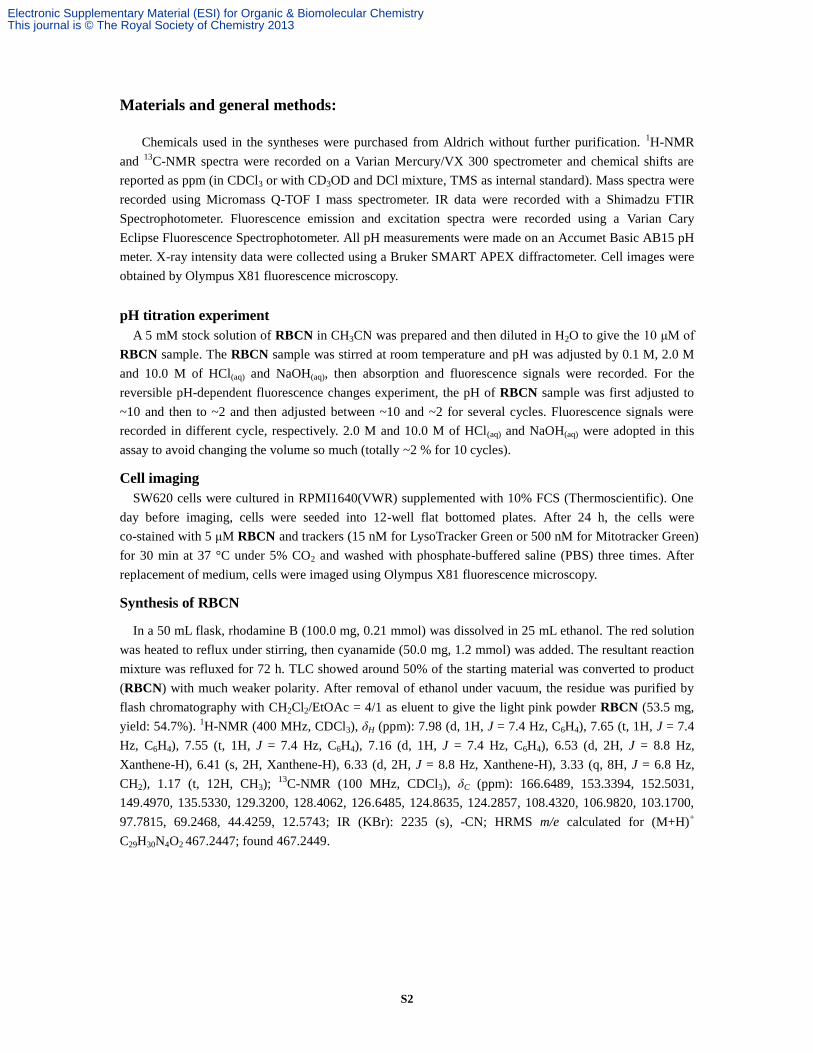
Materials and general methods:
Chemicals used in the syntheses were purchased from Aldrich without further purification. 1H-NMR
and 13
C-NMR spectra were recorded on a Varian Mercury/VX 300 spectrometer and chemical shifts are
reported as ppm (in CDCl3 or with CD3OD and DCl mixture, TMS as internal standard). Mass spectra were
recorded using Micromass Q-TOF I mass spectrometer. IR data were recorded with a Shimadzu FTIR
Spectrophotometer. Fluorescence emission and excitation spectra were recorded using a Varian Cary
Eclipse Fluorescence Spectrophotometer. All pH measurements were made on an Accumet Basic AB15 pH
meter. X-ray intensity data were collected using a Bruker SMART APEX diffractometer. Cell images were
obtained by Olympus X81 fluorescence microscopy.
pH titration experiment
A 5 mM stock solution of RBCN in CH3CN was prepared and then diluted in H2O to give the 10 μM of
RBCN sample. The RBCN sample was stirred at room temperature and pH was adjusted by 0.1 M, 2.0 M
and 10.0 M of HCl(aq) and NaOH(aq), then absorption and fluorescence signals were recorded. For the
reversible pH-dependent fluorescence changes experiment, the pH of RBCN sample was first adjusted to
~10 and then to ~2 and then adjusted between ~10 and ~2 for several cycles. Fluorescence signals were
recorded in different cycle, respectively. 2.0 M and 10.0 M of HCl(aq) and NaOH(aq) were adopted in this
assay to avoid changing the volume so much (totally ~2 % for 10 cycles).
Cell imaging
SW620 cells were cultured in RPMI1640(VWR) supplemented with 10% FCS (Thermoscientific). One
day before imaging, cells were seeded into 12-well flat bottomed plates. After 24 h, the cells were
co-stained with 5 μM RBCN and trackers (15 nM for LysoTracker Green or 500 nM for Mitotracker Green)
for 30 min at 37 °C under 5% CO2 and washed with phosphate-buffered saline (PBS) three times. After
replacement of medium, cells were imaged using Olympus X81 fluorescence microscopy.
Synthesis of RBCN
In a 50 mL flask, rhodamine B (100.0 mg, 0.21 mmol) was dissolved in 25 mL ethanol. The red solution
was heated to reflux under stirring, then cyanamide (50.0 mg, 1.2 mmol) was added. The resultant reaction
mixture was refluxed for 72 h. TLC showed around 50% of the starting material was converted to product
(RBCN) with much weaker polarity. After removal of ethanol under vacuum, the residue was purified by
flash chromatography with CH2Cl2/EtOAc = 4/1 as eluent to give the light pink powder RBCN (53.5 mg,
yield: 54.7%). 1H-NMR (400 MHz, CDCl3), δH (ppm): 7.98 (d, 1H, J = 7.4 Hz, C6H4), 7.65 (t, 1H, J = 7.4
Hz, C6H4), 7.55 (t, 1H, J = 7.4 Hz, C6H4), 7.16 (d, 1H, J = 7.4 Hz, C6H4), 6.53 (d, 2H, J = 8.8 Hz,
Xanthene-H), 6.41 (s, 2H, Xanthene-H), 6.33 (d, 2H, J = 8.8 Hz, Xanthene-H), 3.33 (q, 8H, J = 6.8 Hz,
CH2), 1.17 (t, 12H, CH3); 13
C-NMR (100 MHz, CDCl3), δC (ppm): 166.6489, 153.3394, 152.5031,
149.4970, 135.5330, 129.3200, 128.4062, 126.6485, 124.8635, 124.2857, 108.4320, 106.9820, 103.1700,
97.7815, 69.2468, 44.4259, 12.5743; IR (KBr): 2235 (s), -CN; HRMS m/e calculated for (M+H)+
C29H30N4O2 467.2447; found 467.2449.
Electronic Supplementary Material (ESI) for Organic & Biomolecular ChemistryThis journal is © The Royal Society of Chemistry 2013

S3
Crystallography
X-ray intensity data from a colorless plate like crystal were collected at 100(2) K using a Bruker
SMART APEX diffractometer (Mo Ka radiation, l = 0.71073 Å).1 The raw area detector data frames were
reduced with the SAINT+ program.1 Final unit cell parameters were determined by least-squares
refinement of 4087 reflections from the data set. Direct methods structure solution, difference Fourier
calculations and full-matrix least-squares refinement against F2 were performed with SHELXS/L
2 as
implemented in OLEX2.3
The compound crystallizes in the triclinic crystal system. The space group P-1 (No. 2) was assumed and
confirmed by the successful solution and refinement of the structure. The asymmetric unit consists of two
crystallographically independent molecules and a methanol molecule of crystallization with a population of
50%. The methanol is disordered about an inversion center, and thus only half is present per asymmetric
unit. It was further modeled as occupying two disordered sites with the asymmetric unit with occupancies
O1S-C1S/O2S-C2S = 0.263(7)/0.237(7). These occupancies were constrained to sum to 0.5. The disordered
methanol atoms were refined with C-O distances restrained to 1.45(2) Å, and were assigned a common
isotropic displacement parameter. All other non-hydrogen atoms were refined with anisotropic
displacement parameters. Hydrogen atoms were placed in geometrically idealized positions and included as
riding atoms. Hydrogen atoms were not located or calculated for the disordered methanol atoms.
-----------------------------------------------------------------------------------------------
Identification code RBCN
Empirical formula C29.25H31N4O2.25
Formula weight 474.58
Temperature/K 100(2)
Crystal system triclinic
Space group P-1
a/Å 11.2094(16)
b/Å 14.479(2)
c/Å 16.455(2)
α/° 80.674(3)
β/° 86.095(3)
γ/° 75.836(3)
Volume/Å3 2554.1(6)
Z 4
ρcalcmg/mm3 1.234
m/mm-1 0.079
F(000) 1010.0
Crystal size/mm3 0.44 × 0.32 × 0.1
2Θ range for data collection 2.5 to 50.06°
Index ranges -13 ≤ h ≤ 13, -17 ≤ k ≤ 17, -19 ≤ l ≤ 19
Reflections collected 28263
Independent reflections 9012[R(int) = 0.0653]
Data/restraints/parameters 9012/2/653
Goodness-of-fit on F2 0.855
Final R indexes [I>=2σ (I)] R1 = 0.0459, wR2 = 0.0744
Final R indexes [all data] R1 = 0.0847, wR2 = 0.0843
Largest diff. peak/hole / e Å-3 0.26/-0.19
-----------------------------------------------------------------------------------------------
Electronic Supplementary Material (ESI) for Organic & Biomolecular ChemistryThis journal is © The Royal Society of Chemistry 2013
S4
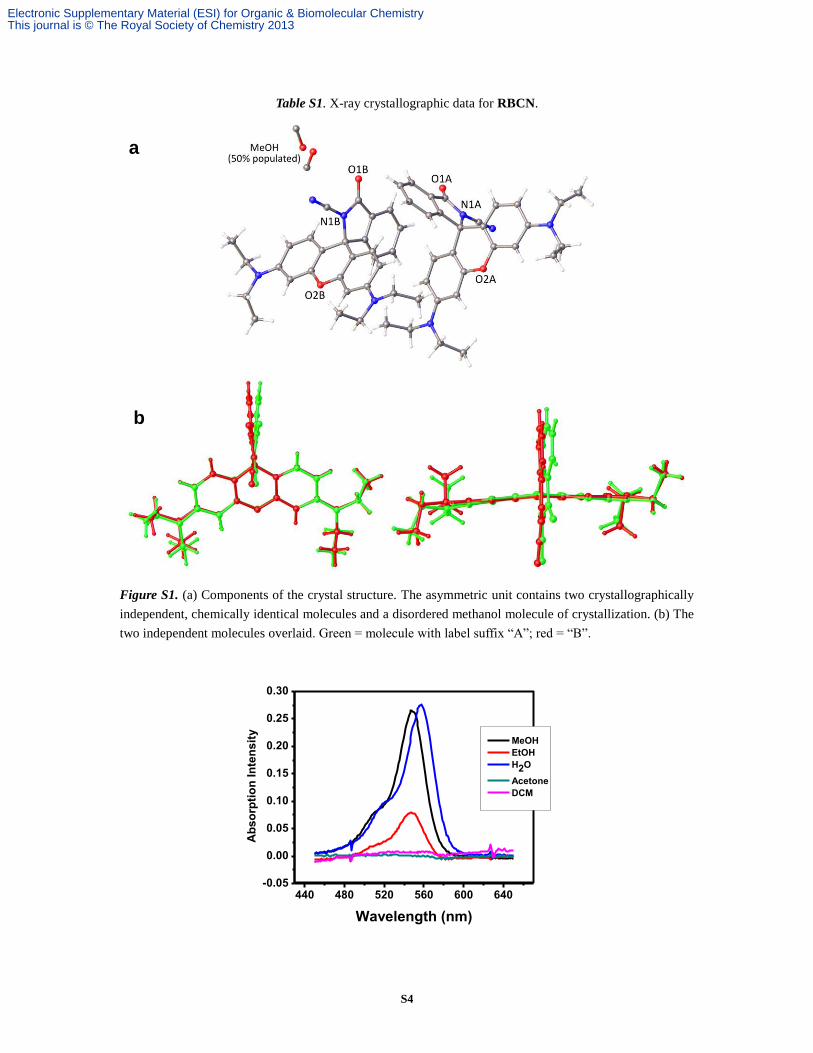
Table S1. X-ray crystallographic data for RBCN.
Figure S1. (a) Components of the crystal structure. The asymmetric unit contains two crystallographically
independent, chemically identical molecules and a disordered methanol molecule of crystallization. (b) The
two independent molecules overlaid. Green = molecule with label suffix “A”; red = “B”.
440 480 520 560 600 640-0.05
0.00
0.05
0.10
0.15
0.20
0.25
0.30
Ab
so
rpti
on
In
ten
sit
y
Wavelength (nm)
MeOH
EtOH
H2O
Acetone
DCM
a
b
Electronic Supplementary Material (ESI) for Organic & Biomolecular ChemistryThis journal is © The Royal Society of Chemistry 2013
S5
Figure S2. Absorption spectrum of RBCN (10 μM) in different solvents.
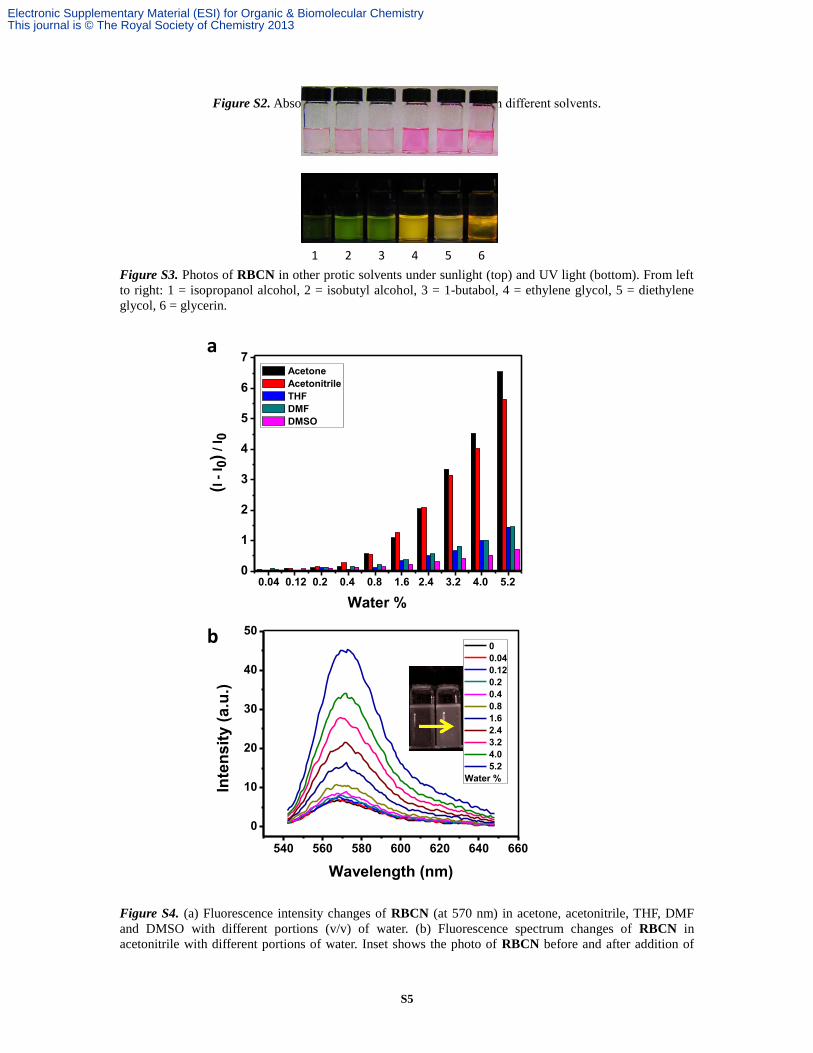
Figure S3. Photos of RBCN in other protic solvents under sunlight (top) and UV light (bottom). From left
to right: 1 = isopropanol alcohol, 2 = isobutyl alcohol, 3 = 1-butabol, 4 = ethylene glycol, 5 = diethylene
glycol, 6 = glycerin.
Figure S4. (a) Fluorescence intensity changes of RBCN (at 570 nm) in acetone, acetonitrile, THF, DMF
and DMSO with different portions (v/v) of water. (b) Fluorescence spectrum changes of RBCN in
acetonitrile with different portions of water. Inset shows the photo of RBCN before and after addition of
0
1
2
3
4
5
6
7
(I -
I0)
/ I 0
0.04 0.12 0.2 0.4 0.8 1.6 2.4 3.2 4.0 5.2
Acetone
Acetonitrile
THF
DMF
DMSO
Water %
540 560 580 600 620 640 660
0
10
20
30
40
50
Inte
ns
ity
(a
.u.)
Wavelength (nm)
0
0.04
0.12
0.2
0.4
0.8
1.6
2.4
3.2
4.0
5.2
Water %
a
b
1 2 3 4 5 6
Electronic Supplementary Material (ESI) for Organic & Biomolecular ChemistryThis journal is © The Royal Society of Chemistry 2013
S6
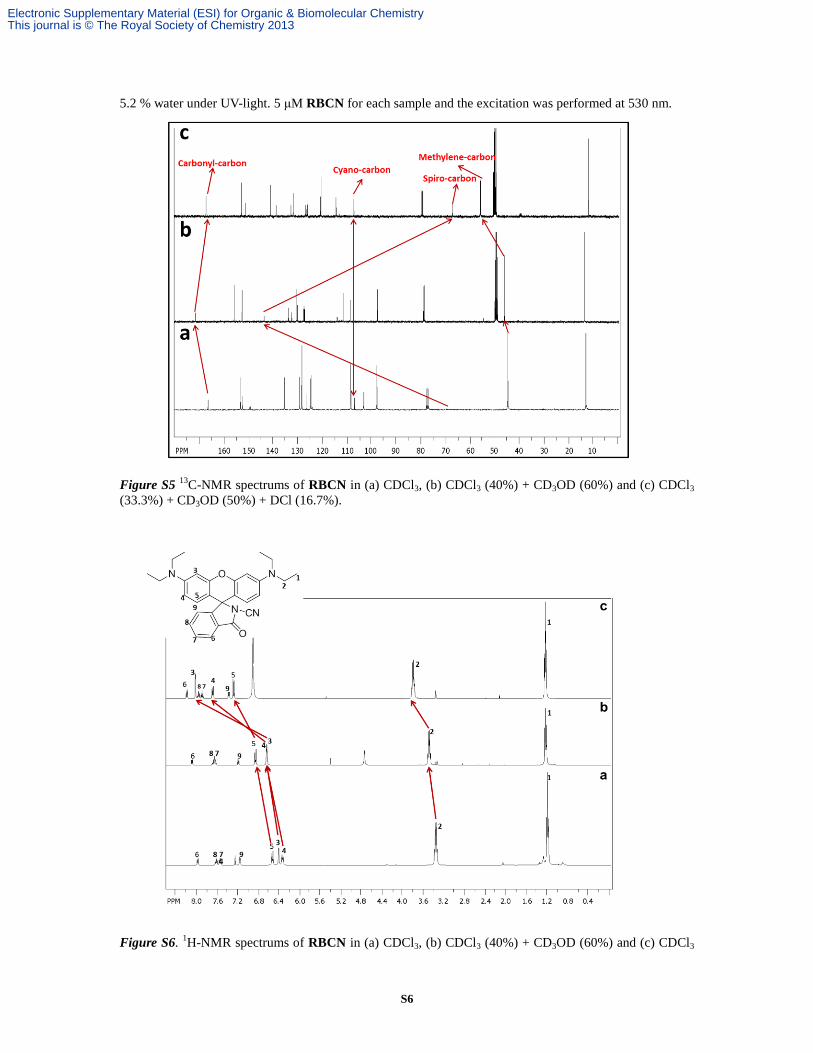
5.2 % water under UV-light. 5 μM RBCN for each sample and the excitation was performed at 530 nm.
Figure S5
13C-NMR spectrums of RBCN in (a) CDCl3, (b) CDCl3 (40%) + CD3OD (60%) and (c) CDCl3
(33.3%) + CD3OD (50%) + DCl (16.7%).
Figure S6. 1H-NMR spectrums of RBCN in (a) CDCl3, (b) CDCl3 (40%) + CD3OD (60%) and (c) CDCl3
Electronic Supplementary Material (ESI) for Organic & Biomolecular ChemistryThis journal is © The Royal Society of Chemistry 2013
S7
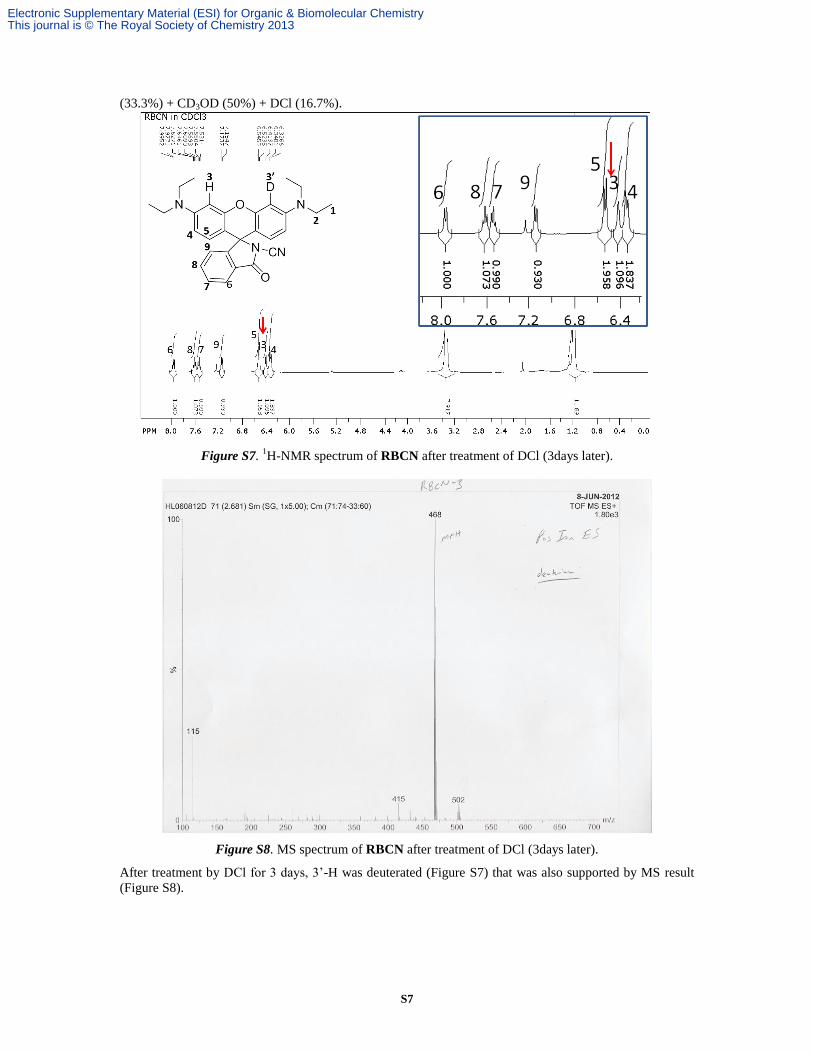
(33.3%) + CD3OD (50%) + DCl (16.7%).
Figure S7. 1H-NMR spectrum of RBCN after treatment of DCl (3days later).
Figure S8. MS spectrum of RBCN after treatment of DCl (3days later).
After treatment by DCl for 3 days, 3’-H was deuterated (Figure S7) that was also supported by MS result
(Figure S8).
Electronic Supplementary Material (ESI) for Organic & Biomolecular ChemistryThis journal is © The Royal Society of Chemistry 2013
S8
Figure S9. 1H-NMR of RBCN (in CDCl3).
Figure S10. 13
C-NMR of RBCN (in CDCl3).
References:
(1) SMART Version 5.630, SAINT+ Version 6.45. Bruker Analytical X-ray Systems, Inc., Madison,
Wisconsin, USA, 2003.
(2) Sheldrick, G.M. Acta Cryst. 2008, A64, 112-122.
(3) Dolomanov, O. V.; Bourhis, L. J.; Gildea, R. J.; Howard J. A. K.; Puschmann, H. J. Appl. Cryst. 2009,
42, 339-341.
Electronic Supplementary Material (ESI) for Organic & Biomolecular ChemistryThis journal is © The Royal Society of Chemistry 2013