Embed Size (px)
Citation preview
Electronic Supplementary Information
Chromium Nitride and Carbide Containing Fibers: from Composites to Mesostructures
Alfonso García-Márquez*, David Portehaut, Cristina Giordano
Max Planck Institute for Colloids and Interfaces, Am Muehlenberg 1, 14476 Golm, Germany.
Index:
Figure S1. Schematization of the electrospinning device.
Figure S2. Schematic representation of the cell employed for resistivity measurements.
Figure S3. XRD pattern of the product obtained after pyrolysis of calcined fibers.
Figure S4. SEM images of samples calcined after brief exposition to high humidity conditions.
Figure S5. NLDFT plots of pore size distribution for PUF containing samples.
Table S1. Nitrogen sorption data from PUF containing fibers calcined at different temperatures:
BET specific surface area (SSA) and pore size obtained from NLDFT.
Figure S6. Nitrogen sorption isotherms of fibers calcined at 1400°C.
Figure S7. NLDFT Plots of the pore distributions from PAN-Cr and PAN-PUF-Cr at 1400°C.
Figure S8. SEM images of fiber cross section after conductivity measurements.
Table S2. Resistivity of thermally treated fibers.
Figure S9. Cyclic voltammograms of the PUF containing composite in nitrogen saturated
solution (black) and oxygen saturated solution (red).
Supplementary Material (ESI) for Journal of Materials ChemistryThis journal is (c) The Royal Society of Chemistry 2011

Figure S1. Schematization of the electrospinning device.
Potentiostat
Locking structure
Pt electrodes
Hollow cell body
Contact stems
Potentiostat
Locking structure
Pt electrodes
Hollow cell body
Contact stems
Figure S2: Schematic representation of the cell employed for resistivity measurements.
Supplementary Material (ESI) for Journal of Materials ChemistryThis journal is (c) The Royal Society of Chemistry 2011

20 30 40 50 60 700
500
1000
1500
2000
Cou
nts
(A.U
.)
2 theta (degrees)
04-003-7150
Pyrolyzed sample
Figure S3. XRD Pattern of the pyrolyzed carbon composite fiber residue.
Supplementary Material (ESI) for Journal of Materials ChemistryThis journal is (c) The Royal Society of Chemistry 2011

Figure S4. Images of samples calcined after brief exposition to high humidity conditions.
Supplementary Material (ESI) for Journal of Materials ChemistryThis journal is (c) The Royal Society of Chemistry 2011
10 20 30 40 50 60 70 80 90 1000,000
0,002
0,004
0,006
0,008
0,010
0,012
0,014
0,016
0,018
Por
e V
olum
e (c
m3 Å
-1 g
-1)
Witdth (Å)
900°C 1200°C 1400°C
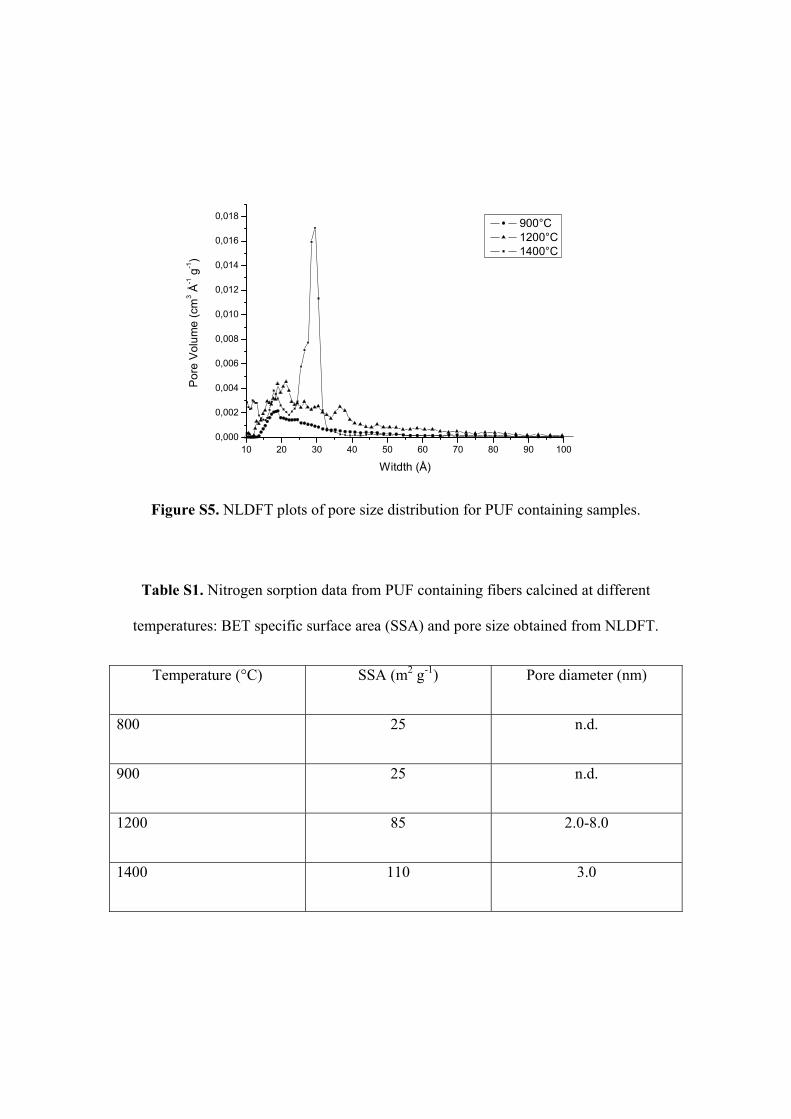
Figure S5. NLDFT plots of pore size distribution for PUF containing samples.
Table S1. Nitrogen sorption data from PUF containing fibers calcined at different
temperatures: BET specific surface area (SSA) and pore size obtained from NLDFT.
Temperature (°C) SSA (m2 g-1) Pore diameter (nm)
800 25 n.d.
900 25 n.d.
1200 85 2.0-8.0
1400 110 3.0
Supplementary Material (ESI) for Journal of Materials ChemistryThis journal is (c) The Royal Society of Chemistry 2011

0,0 0,2 0,4 0,6 0,8 1,00
10
20
30
40
50
60
70
80
PUF freeVad
s (c
m3 g
-1)
P/Po
PUF-containing
Figure S6. Nitrogen sorption isotherms of fibers calcined at 1400°C.
10 20 30 40 50 60 70 80 90 1000,000
0,005
0,010
0,015
0,020
0,025
0,030
Por
e V
olum
e (c
m3 Å
-1 g
-1)
Width (Å)
PAN-CrCl3 PAN-PUF-CrCl3
Figure S7: NLDFT Plots of the pore distributions from PAN-Cr and PAN-PUF-Cr at
1400°C.
Supplementary Material (ESI) for Journal of Materials ChemistryThis journal is (c) The Royal Society of Chemistry 2011

Figure S8. SEM images of the cross section of fibers treated at 1400°C after conductivity
measurements.
Table S2. Resistivity of thermally treated fibers.
Product Resistivity (Ω·cm)
PAN-Cr @ 800°C 5.82 · 103
PAN-PUF-Cr @ 800°C 1.71
PAN-Cr @ 1400°C 3.18
PAN-PUF-Cr @ 1400°C 2.77
PAN-PUF@1400°C 1.44
PAN@1400°C 0.43
Supplementary Material (ESI) for Journal of Materials ChemistryThis journal is (c) The Royal Society of Chemistry 2011