Embed Size (px)
Citation preview
1
Electronic Supplementary Information
for the manuscript "Controlled Nitrene Transfer from a Tyrosinase-Like Arylnitroso-Copper Complex"
by
Mohammad S. Askari, Maylis Orio and Xavier Ottenwaelder* * [email protected]
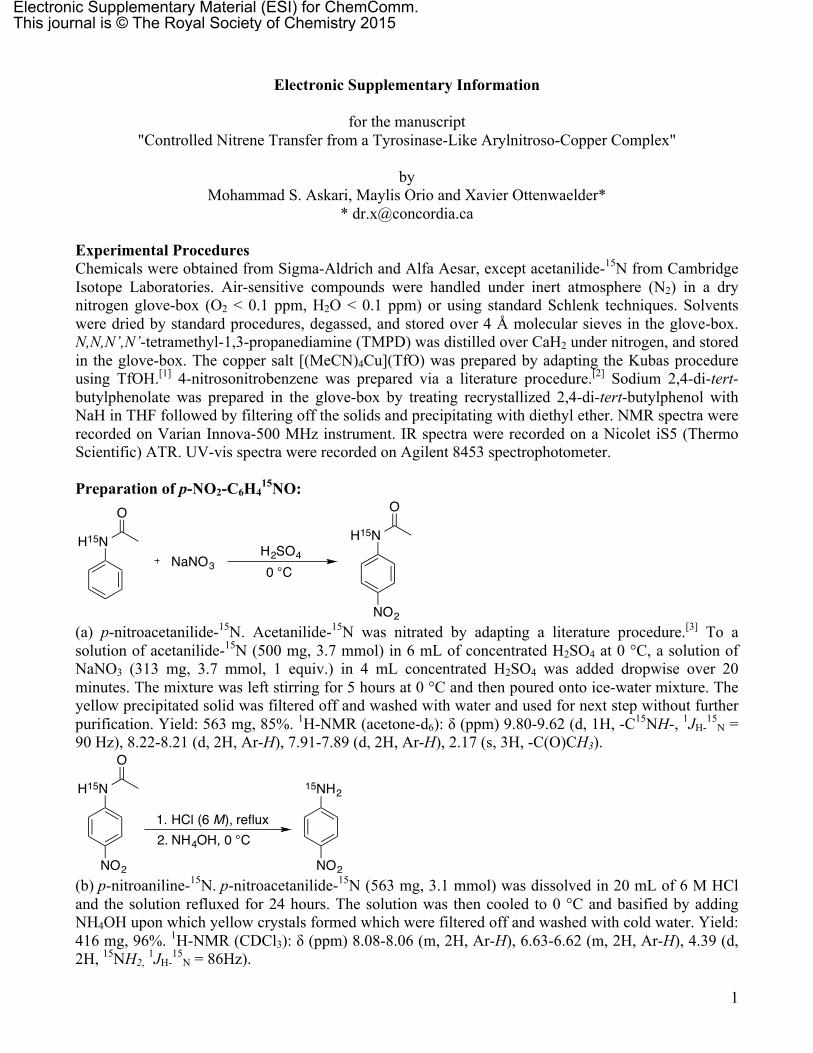
Experimental Procedures Chemicals were obtained from Sigma-Aldrich and Alfa Aesar, except acetanilide-15N from Cambridge Isotope Laboratories. Air-sensitive compounds were handled under inert atmosphere (N2) in a dry nitrogen glove-box (O2 < 0.1 ppm, H2O < 0.1 ppm) or using standard Schlenk techniques. Solvents were dried by standard procedures, degassed, and stored over 4 Å molecular sieves in the glove-box. N,N,N’,N’-tetramethyl-1,3-propanediamine (TMPD) was distilled over CaH2 under nitrogen, and stored in the glove-box. The copper salt [(MeCN)4Cu](TfO) was prepared by adapting the Kubas procedure using TfOH.[1] 4-nitrosonitrobenzene was prepared via a literature procedure.[2] Sodium 2,4-di-tert-butylphenolate was prepared in the glove-box by treating recrystallized 2,4-di-tert-butylphenol with NaH in THF followed by filtering off the solids and precipitating with diethyl ether. NMR spectra were recorded on Varian Innova-500 MHz instrument. IR spectra were recorded on a Nicolet iS5 (Thermo Scientific) ATR. UV-vis spectra were recorded on Agilent 8453 spectrophotometer. Preparation of p-NO2-C6H4
15NO:
(a) p-nitroacetanilide-15N. Acetanilide-15N was nitrated by adapting a literature procedure.[3] To a solution of acetanilide-15N (500 mg, 3.7 mmol) in 6 mL of concentrated H2SO4 at 0 °C, a solution of NaNO3 (313 mg, 3.7 mmol, 1 equiv.) in 4 mL concentrated H2SO4 was added dropwise over 20 minutes. The mixture was left stirring for 5 hours at 0 °C and then poured onto ice-water mixture. The yellow precipitated solid was filtered off and washed with water and used for next step without further purification. Yield: 563 mg, 85%. 1H-NMR (acetone-d6): δ (ppm) 9.80-9.62 (d, 1H, -C15NH-, 1JH-
15N =
90 Hz), 8.22-8.21 (d, 2H, Ar-H), 7.91-7.89 (d, 2H, Ar-H), 2.17 (s, 3H, -C(O)CH3).
(b) p-nitroaniline-15N. p-nitroacetanilide-15N (563 mg, 3.1 mmol) was dissolved in 20 mL of 6 M HCl and the solution refluxed for 24 hours. The solution was then cooled to 0 °C and basified by adding NH4OH upon which yellow crystals formed which were filtered off and washed with cold water. Yield: 416 mg, 96%. 1H-NMR (CDCl3): δ (ppm) 8.08-8.06 (m, 2H, Ar-H), 6.63-6.62 (m, 2H, Ar-H), 4.39 (d, 2H, 15NH2, 1JH-
15N = 86Hz).
H15N
O
NaNO3H2SO40 °C
H15N
O
NO2
H15N
O
NO2
1. HCl (6 M), reflux2. NH4OH, 0 °C
15NH2
NO2
Electronic Supplementary Material (ESI) for ChemComm.This journal is © The Royal Society of Chemistry 2015
2
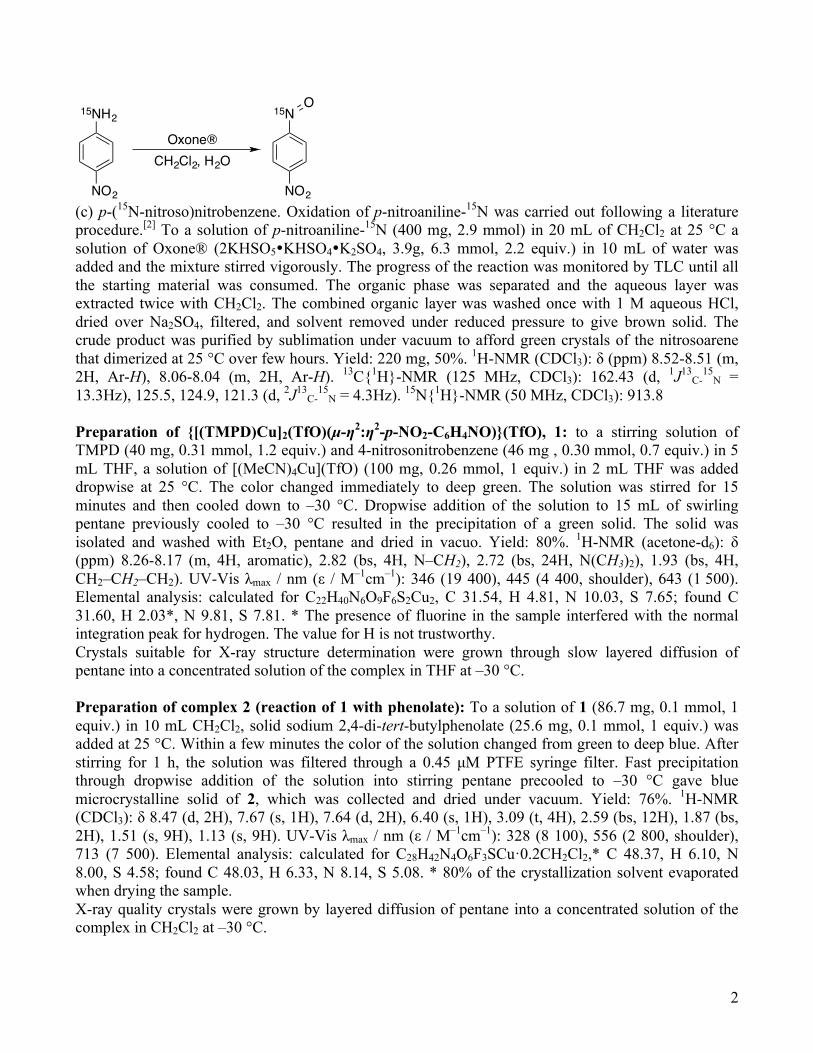
(c) p-(15N-nitroso)nitrobenzene. Oxidation of p-nitroaniline-15N was carried out following a literature procedure.[2] To a solution of p-nitroaniline-15N (400 mg, 2.9 mmol) in 20 mL of CH2Cl2 at 25 °C a solution of Oxone® (2KHSO5�KHSO4�K2SO4, 3.9g, 6.3 mmol, 2.2 equiv.) in 10 mL of water was added and the mixture stirred vigorously. The progress of the reaction was monitored by TLC until all the starting material was consumed. The organic phase was separated and the aqueous layer was extracted twice with CH2Cl2. The combined organic layer was washed once with 1 M aqueous HCl, dried over Na2SO4, filtered, and solvent removed under reduced pressure to give brown solid. The crude product was purified by sublimation under vacuum to afford green crystals of the nitrosoarene that dimerized at 25 °C over few hours. Yield: 220 mg, 50%. 1H-NMR (CDCl3): δ (ppm) 8.52-8.51 (m, 2H, Ar-H), 8.06-8.04 (m, 2H, Ar-H). 13C{1H}-NMR (125 MHz, CDCl3): 162.43 (d, 1J13
C-15
N = 13.3Hz), 125.5, 124.9, 121.3 (d, 2J13
C-15
N = 4.3Hz). 15N{1H}-NMR (50 MHz, CDCl3): 913.8 Preparation of {[(TMPD)Cu]2(TfO)(µ-η2:η2-p-NO2-C6H4NO)}(TfO), 1: to a stirring solution of TMPD (40 mg, 0.31 mmol, 1.2 equiv.) and 4-nitrosonitrobenzene (46 mg , 0.30 mmol, 0.7 equiv.) in 5 mL THF, a solution of [(MeCN)4Cu](TfO) (100 mg, 0.26 mmol, 1 equiv.) in 2 mL THF was added dropwise at 25 °C. The color changed immediately to deep green. The solution was stirred for 15 minutes and then cooled down to –30 °C. Dropwise addition of the solution to 15 mL of swirling pentane previously cooled to –30 °C resulted in the precipitation of a green solid. The solid was isolated and washed with Et2O, pentane and dried in vacuo. Yield: 80%. 1H-NMR (acetone-d6): δ (ppm) 8.26-8.17 (m, 4H, aromatic), 2.82 (bs, 4H, N–CH2), 2.72 (bs, 24H, N(CH3)2), 1.93 (bs, 4H, CH2–CH2–CH2). UV-Vis λmax / nm (ε / M–1cm–1): 346 (19 400), 445 (4 400, shoulder), 643 (1 500). Elemental analysis: calculated for C22H40N6O9F6S2Cu2, C 31.54, H 4.81, N 10.03, S 7.65; found C 31.60, H 2.03*, N 9.81, S 7.81. * The presence of fluorine in the sample interfered with the normal integration peak for hydrogen. The value for H is not trustworthy. Crystals suitable for X-ray structure determination were grown through slow layered diffusion of pentane into a concentrated solution of the complex in THF at –30 °C. Preparation of complex 2 (reaction of 1 with phenolate): To a solution of 1 (86.7 mg, 0.1 mmol, 1 equiv.) in 10 mL CH2Cl2, solid sodium 2,4-di-tert-butylphenolate (25.6 mg, 0.1 mmol, 1 equiv.) was added at 25 °C. Within a few minutes the color of the solution changed from green to deep blue. After stirring for 1 h, the solution was filtered through a 0.45 µM PTFE syringe filter. Fast precipitation through dropwise addition of the solution into stirring pentane precooled to –30 °C gave blue microcrystalline solid of 2, which was collected and dried under vacuum. Yield: 76%. 1H-NMR (CDCl3): δ 8.47 (d, 2H), 7.67 (s, 1H), 7.64 (d, 2H), 6.40 (s, 1H), 3.09 (t, 4H), 2.59 (bs, 12H), 1.87 (bs, 2H), 1.51 (s, 9H), 1.13 (s, 9H). UV-Vis λmax / nm (ε / M–1cm–1): 328 (8 100), 556 (2 800, shoulder), 713 (7 500). Elemental analysis: calculated for C28H42N4O6F3SCu·0.2CH2Cl2,* C 48.37, H 6.10, N 8.00, S 4.58; found C 48.03, H 6.33, N 8.14, S 5.08. * 80% of the crystallization solvent evaporated when drying the sample. X-ray quality crystals were grown by layered diffusion of pentane into a concentrated solution of the complex in CH2Cl2 at –30 °C.
15NH2
NO2
Oxone®CH2Cl2, H2O
15N
NO2
O
3
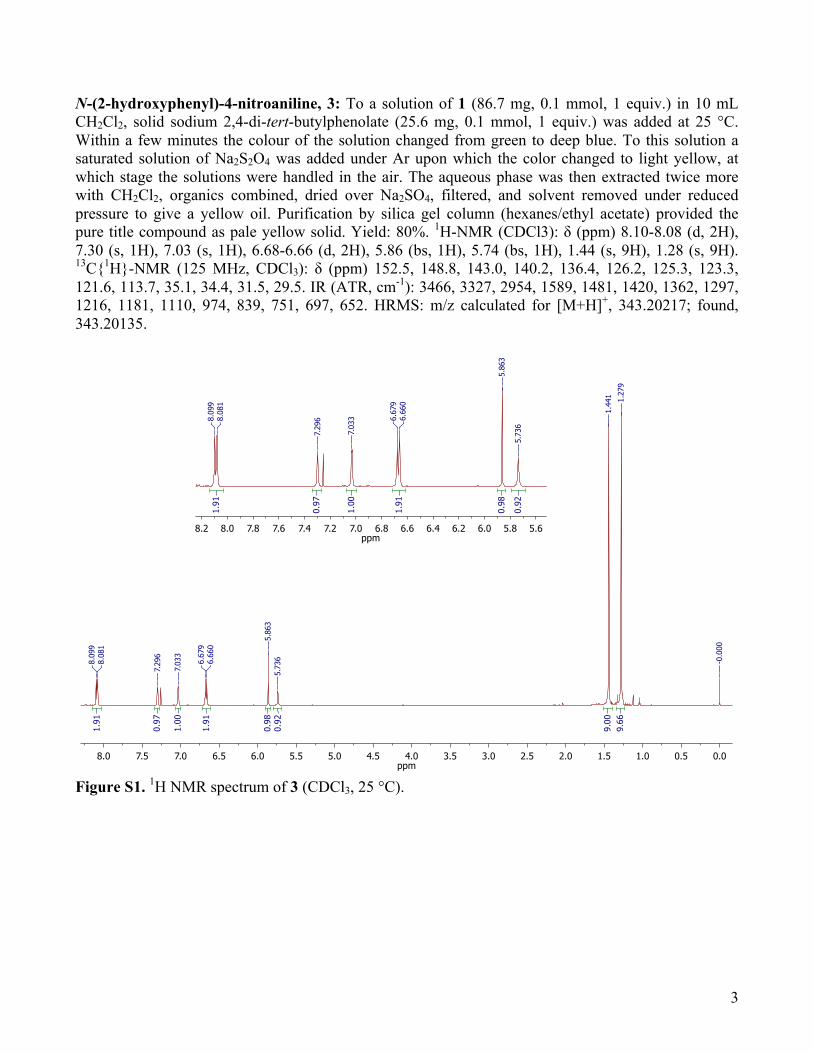
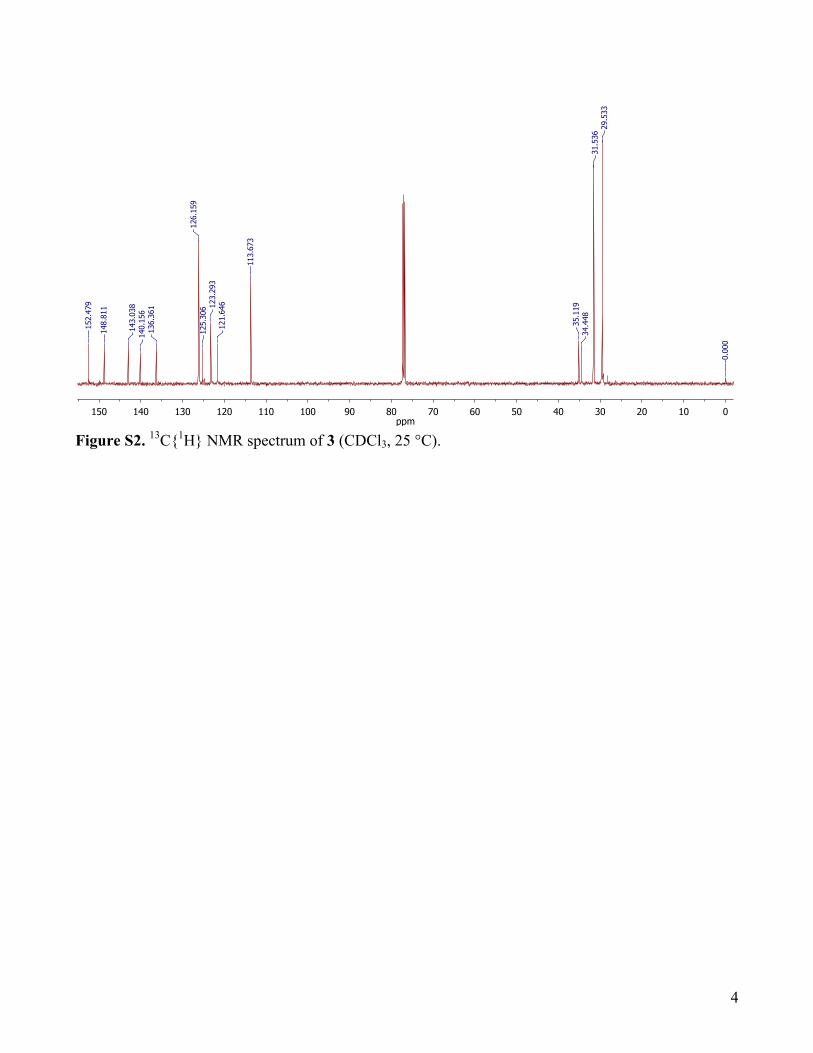
N-(2-hydroxyphenyl)-4-nitroaniline, 3: To a solution of 1 (86.7 mg, 0.1 mmol, 1 equiv.) in 10 mL CH2Cl2, solid sodium 2,4-di-tert-butylphenolate (25.6 mg, 0.1 mmol, 1 equiv.) was added at 25 °C. Within a few minutes the colour of the solution changed from green to deep blue. To this solution a saturated solution of Na2S2O4 was added under Ar upon which the color changed to light yellow, at which stage the solutions were handled in the air. The aqueous phase was then extracted twice more with CH2Cl2, organics combined, dried over Na2SO4, filtered, and solvent removed under reduced pressure to give a yellow oil. Purification by silica gel column (hexanes/ethyl acetate) provided the pure title compound as pale yellow solid. Yield: 80%. 1H-NMR (CDCl3): δ (ppm) 8.10-8.08 (d, 2H), 7.30 (s, 1H), 7.03 (s, 1H), 6.68-6.66 (d, 2H), 5.86 (bs, 1H), 5.74 (bs, 1H), 1.44 (s, 9H), 1.28 (s, 9H). 13C{1H}-NMR (125 MHz, CDCl3): δ (ppm) 152.5, 148.8, 143.0, 140.2, 136.4, 126.2, 125.3, 123.3, 121.6, 113.7, 35.1, 34.4, 31.5, 29.5. IR (ATR, cm-1): 3466, 3327, 2954, 1589, 1481, 1420, 1362, 1297, 1216, 1181, 1110, 974, 839, 751, 697, 652. HRMS: m/z calculated for [M+H]+, 343.20217; found, 343.20135.
Figure S1. 1H NMR spectrum of 3 (CDCl3, 25 °C).
0.00.51.01.52.02.53.03.54.04.55.05.56.06.57.07.58.0ppm
9.66
9.00
0.92
0.98
1.91
1.00
0.97
1.91
-0.000
1.279
1.441
5.736
5.863
6.660
6.679
7.033
7.296
8.081
8.099
5.65.86.06.26.46.66.87.07.27.47.67.88.08.2ppm
0.92
0.98
1.91
1.00
0.97
1.91
5.736
5.863
6.660
6.679
7.033
7.2968.081
8.099
4
Figure S2. 13C{1H} NMR spectrum of 3 (CDCl3, 25 °C).
0102030405060708090100110120130140150ppm
-0.000
29.533
31.536
34.448
35.119
113.673
121.646123.293
125.306
126.159
136.361
140.156
143.038
148.811
152.479
5
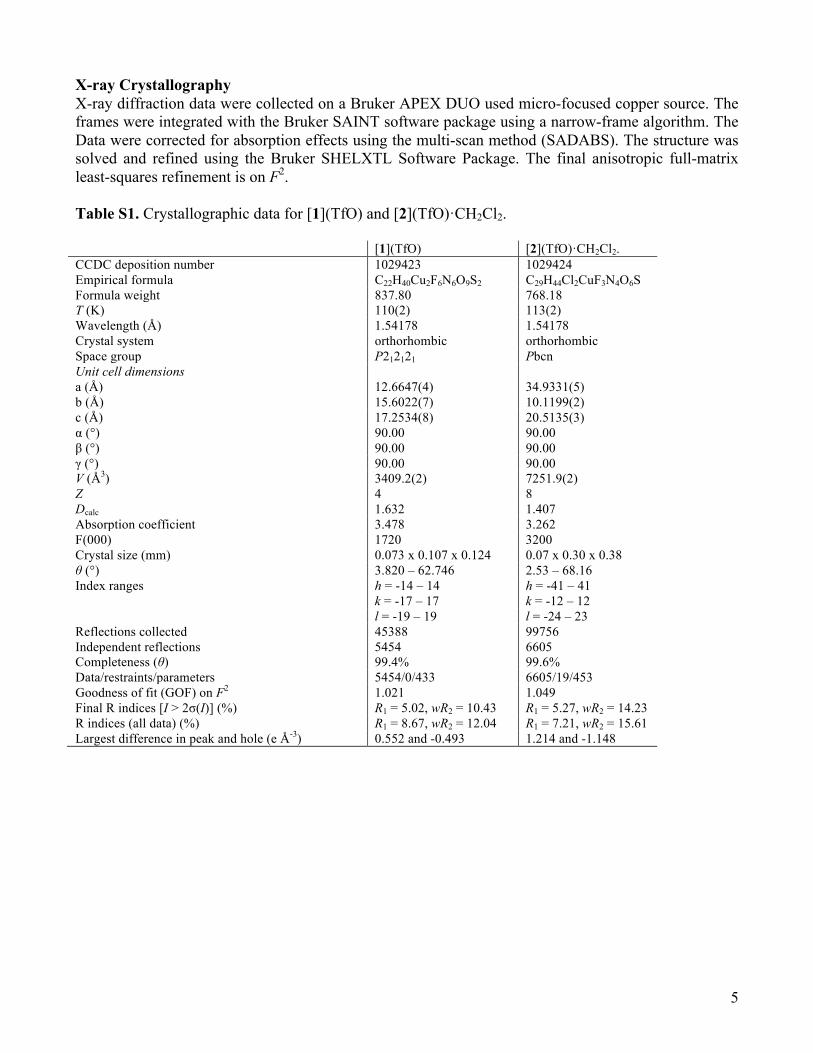
X-ray Crystallography X-ray diffraction data were collected on a Bruker APEX DUO used micro-focused copper source. The frames were integrated with the Bruker SAINT software package using a narrow-frame algorithm. The Data were corrected for absorption effects using the multi-scan method (SADABS). The structure was solved and refined using the Bruker SHELXTL Software Package. The final anisotropic full-matrix least-squares refinement is on F2. Table S1. Crystallographic data for [1](TfO) and [2](TfO)·CH2Cl2. [1](TfO) [2](TfO)·CH2Cl2. CCDC deposition number 1029423 1029424 Empirical formula C22H40Cu2F6N6O9S2 C29H44Cl2CuF3N4O6S Formula weight 837.80 768.18 T (K) 110(2) 113(2) Wavelength (Å) 1.54178 1.54178 Crystal system orthorhombic orthorhombic Space group P212121 Pbcn Unit cell dimensions a (Å) 12.6647(4) 34.9331(5) b (Å) 15.6022(7) 10.1199(2) c (Å) 17.2534(8) 20.5135(3) α (°) 90.00 90.00 β (°) 90.00 90.00 γ (°) 90.00 90.00 V (Å3) 3409.2(2) 7251.9(2) Z 4 8 Dcalc 1.632 1.407 Absorption coefficient 3.478 3.262 F(000) 1720 3200 Crystal size (mm) 0.073 x 0.107 x 0.124 0.07 x 0.30 x 0.38 θ (°) 3.820 – 62.746 2.53 – 68.16 Index ranges h = -14 – 14 h = -41 – 41 k = -17 – 17 k = -12 – 12 l = -19 – 19 l = -24 – 23 Reflections collected 45388 99756 Independent reflections 5454 6605 Completeness (θ) 99.4% 99.6% Data/restraints/parameters 5454/0/433 6605/19/453 Goodness of fit (GOF) on F2 1.021 1.049 Final R indices [I > 2σ(I)] (%) R1 = 5.02, wR2 = 10.43 R1 = 5.27, wR2 = 14.23 R indices (all data) (%) R1 = 8.67, wR2 = 12.04 R1 = 7.21, wR2 = 15.61 Largest difference in peak and hole (e Å-3) 0.552 and -0.493 1.214 and -1.148
6
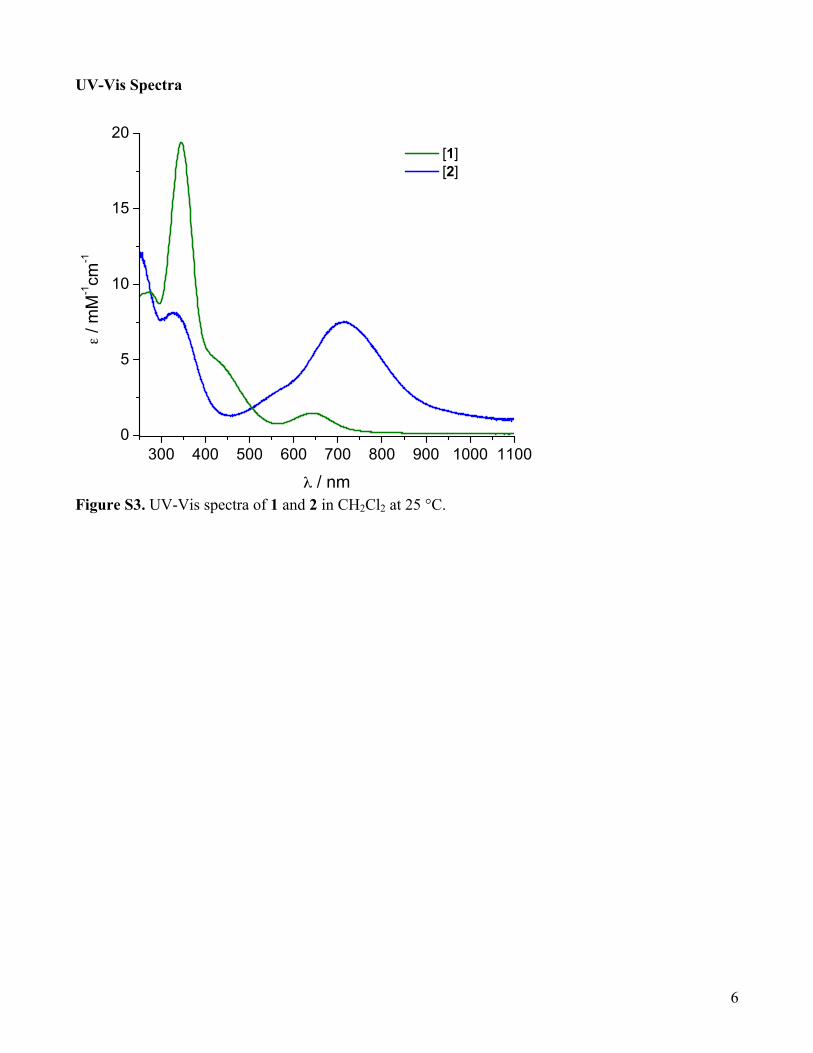
UV-Vis Spectra
Figure S3. UV-Vis spectra of 1 and 2 in CH2Cl2 at 25 °C.
300 400 500 600 700 800 900 1000 11000
5
10
15
20 [1] [2]
ε / m
M-1cm
-1
λ / nm
7
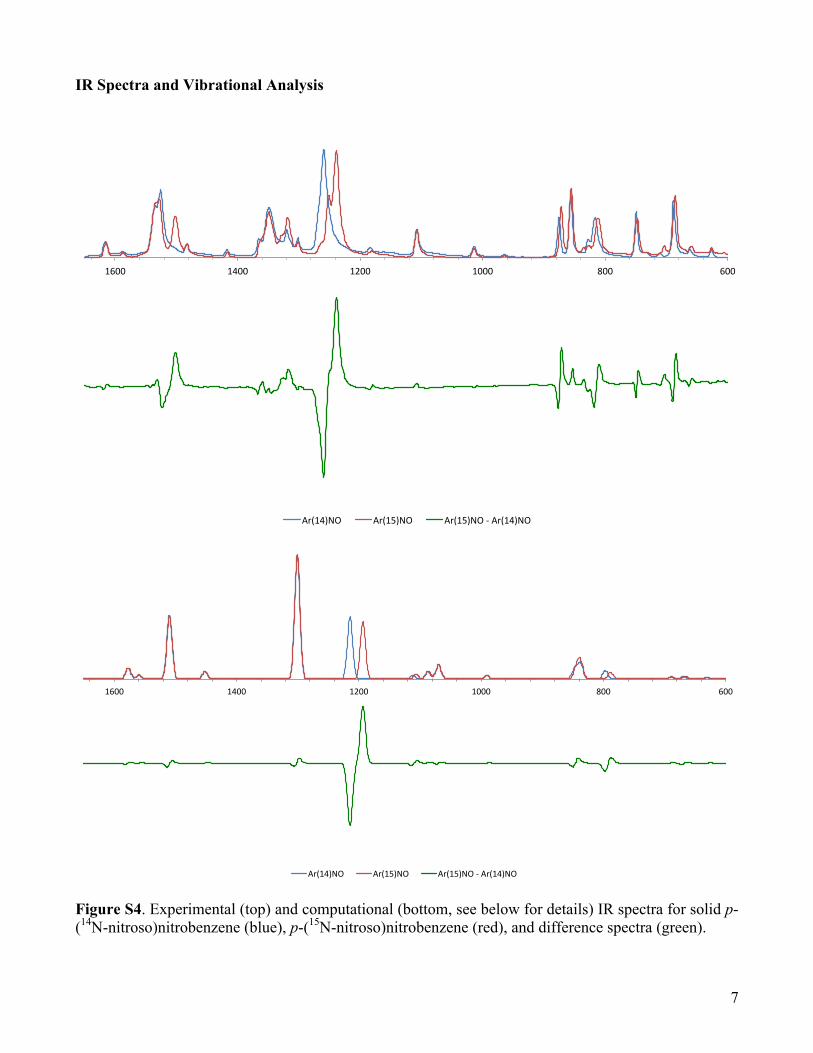
IR Spectra and Vibrational Analysis
Figure S4. Experimental (top) and computational (bottom, see below for details) IR spectra for solid p-(14N-nitroso)nitrobenzene (blue), p-(15N-nitroso)nitrobenzene (red), and difference spectra (green).
600#800#1000#1200#1400#1600#
Ar(14)NO# Ar(15)NO# Ar(15)NO#/#Ar(14)NO#
600#800#1000#1200#1400#1600#
Ar(14)NO# Ar(15)NO# Ar(15)NO#/#Ar(14)NO#
8
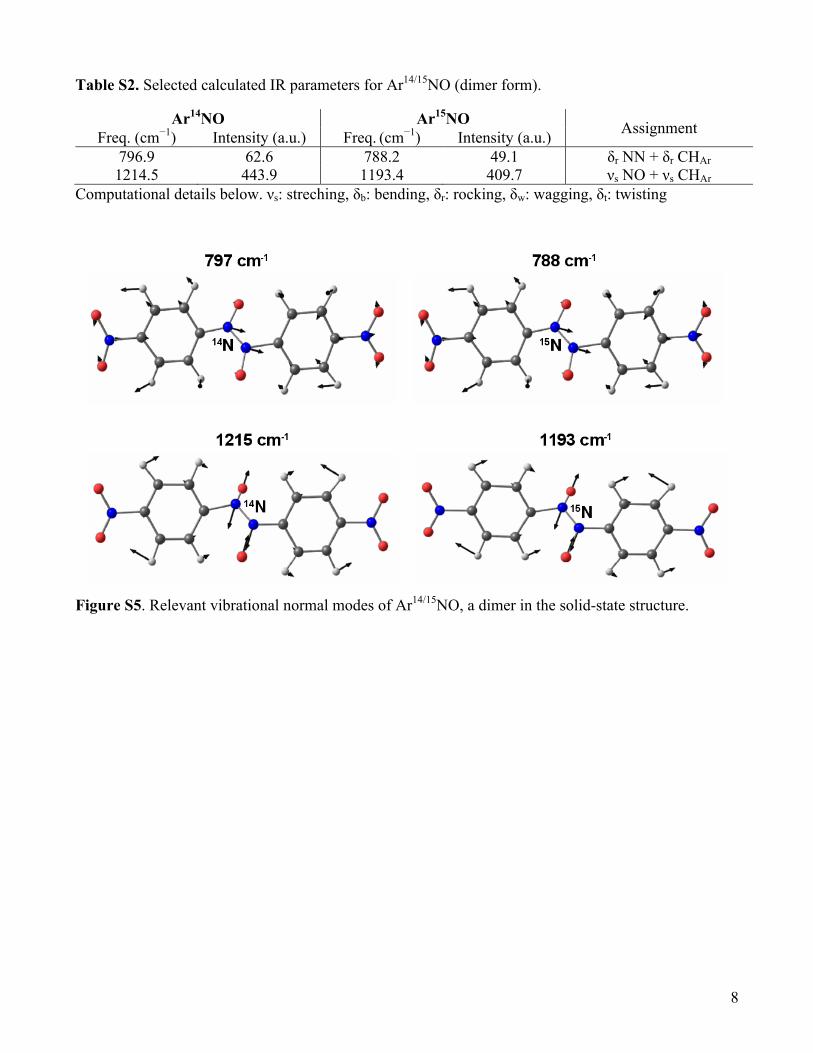
Table S2. Selected calculated IR parameters for Ar14/15NO (dimer form).
Ar14NO Ar15NO Assignment Freq. (cm−1) Intensity (a.u.) Freq. (cm−1) Intensity (a.u.) 796.9 62.6 788.2 49.1 δr NN + δr CHAr 1214.5 443.9 1193.4 409.7 νs NO + νs CHAr
Computational details below. νs: streching, δb: bending, δr: rocking, δw: wagging, δt: twisting
Figure S5. Relevant vibrational normal modes of Ar14/15NO, a dimer in the solid-state structure.
9
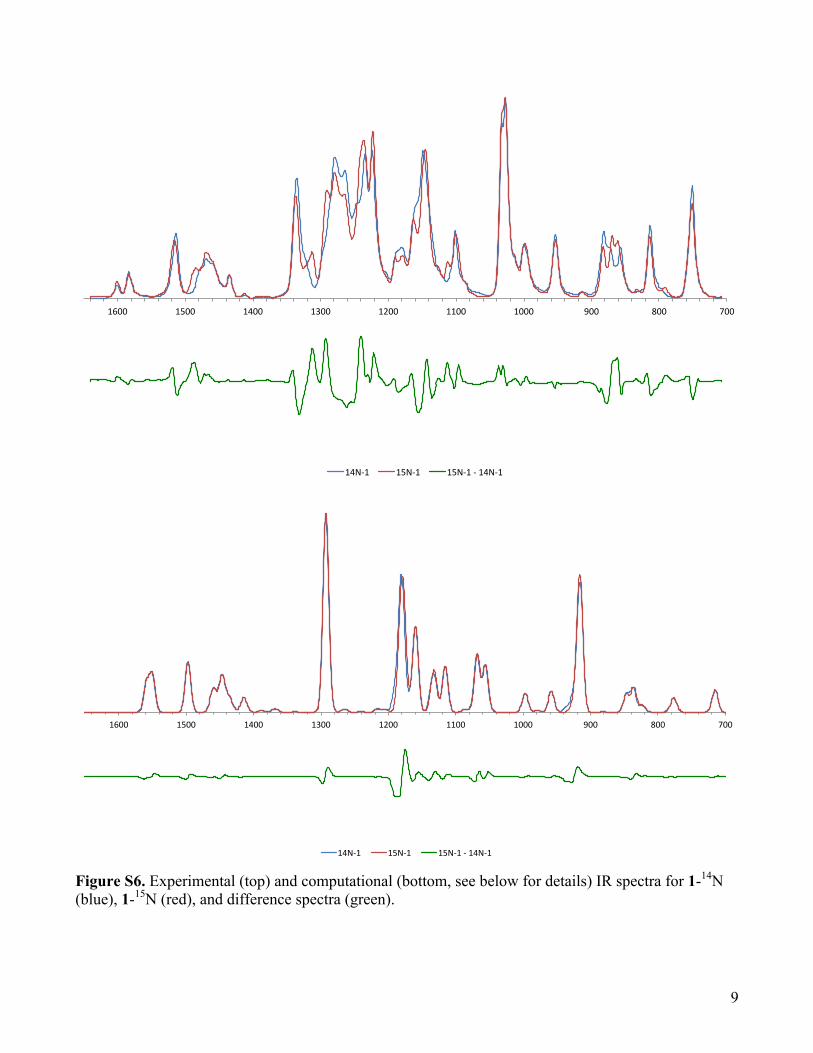
Figure S6. Experimental (top) and computational (bottom, see below for details) IR spectra for 1-14N (blue), 1-15N (red), and difference spectra (green).
700#800#900#1000#1100#1200#1300#1400#1500#1600#
14N-1# 15N-1# 15N-1#-#14N-1#
700#800#900#1000#1100#1200#1300#1400#1500#1600#
14N-1# 15N-1# 15N-1#-#14N-1#
10
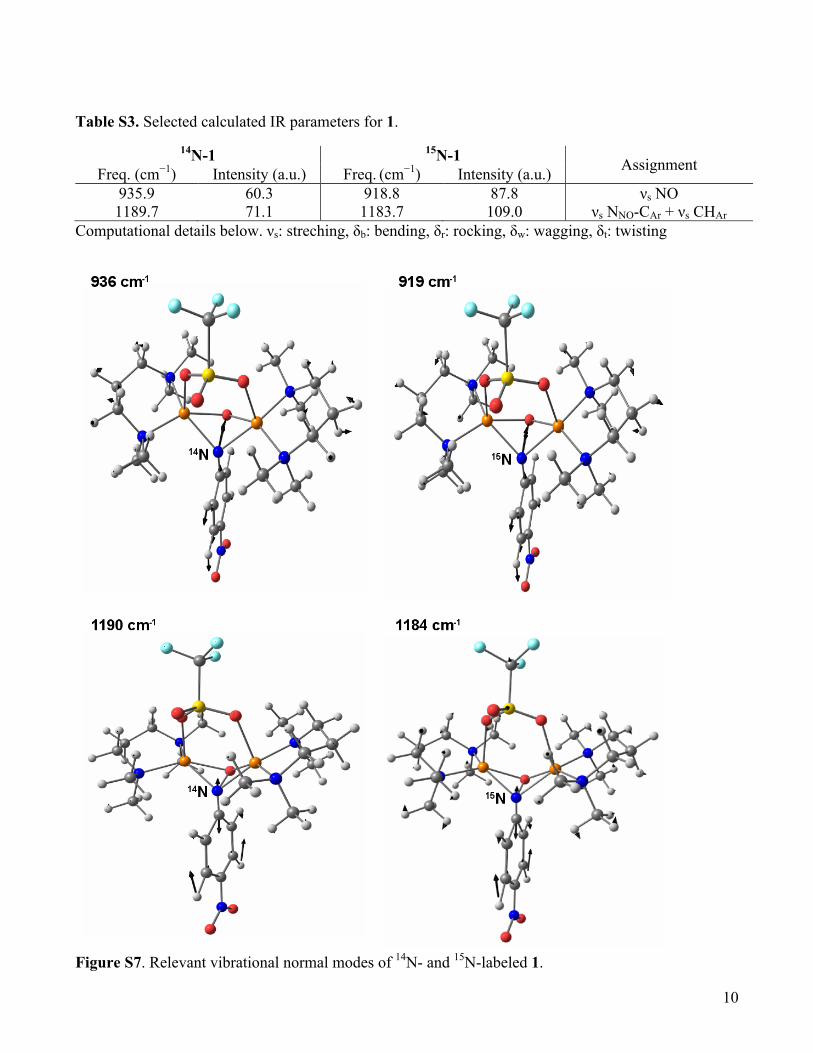
Table S3. Selected calculated IR parameters for 1.
14N-1 15N-1 Assignment Freq. (cm−1) Intensity (a.u.) Freq. (cm−1) Intensity (a.u.)
935.9 60.3 918.8 87.8 νs NO 1189.7 71.1 1183.7 109.0 νs NNO-CAr + νs CHAr
Computational details below. νs: streching, δb: bending, δr: rocking, δw: wagging, δt: twisting
Figure S7. Relevant vibrational normal modes of 14N- and 15N-labeled 1.
11
DFT calculations
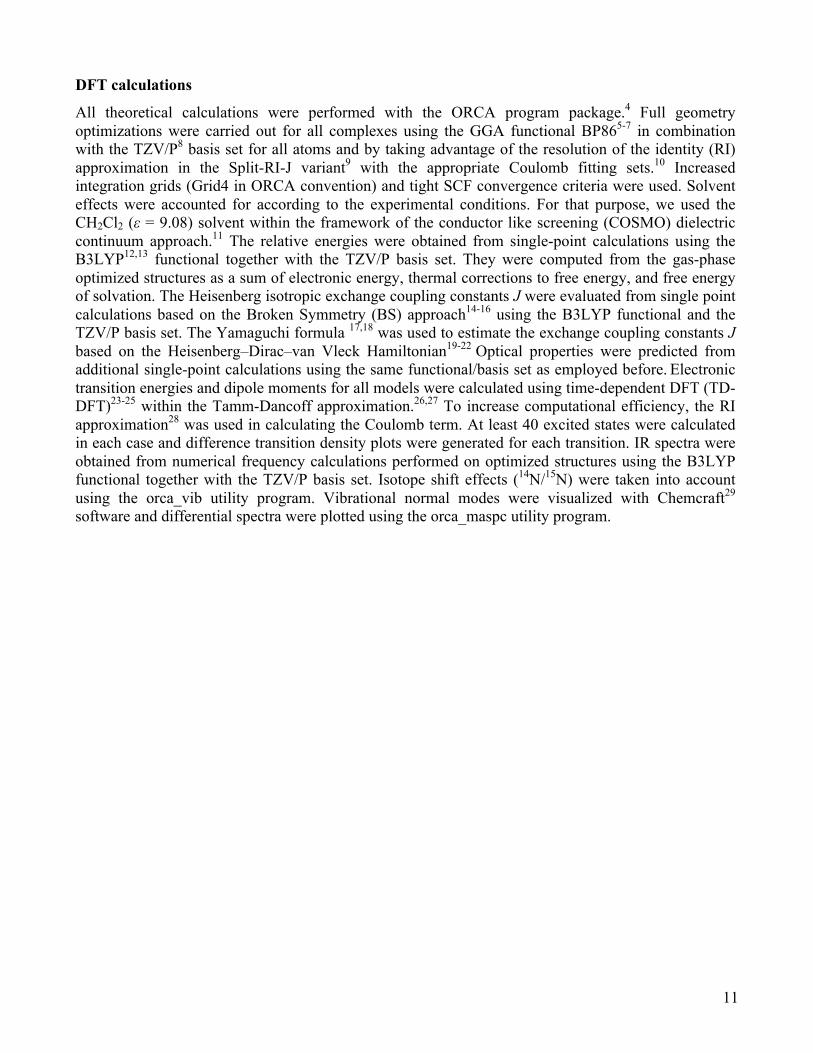
All theoretical calculations were performed with the ORCA program package.4 Full geometry optimizations were carried out for all complexes using the GGA functional BP865-7 in combination with the TZV/P8 basis set for all atoms and by taking advantage of the resolution of the identity (RI) approximation in the Split-RI-J variant9 with the appropriate Coulomb fitting sets.10 Increased integration grids (Grid4 in ORCA convention) and tight SCF convergence criteria were used. Solvent effects were accounted for according to the experimental conditions. For that purpose, we used the CH2Cl2 (ε = 9.08) solvent within the framework of the conductor like screening (COSMO) dielectric continuum approach.11 The relative energies were obtained from single-point calculations using the B3LYP12,13 functional together with the TZV/P basis set. They were computed from the gas-phase optimized structures as a sum of electronic energy, thermal corrections to free energy, and free energy of solvation. The Heisenberg isotropic exchange coupling constants J were evaluated from single point calculations based on the Broken Symmetry (BS) approach14-16 using the B3LYP functional and the TZV/P basis set. The Yamaguchi formula 17,18 was used to estimate the exchange coupling constants J based on the Heisenberg–Dirac–van Vleck Hamiltonian19-22 Optical properties were predicted from additional single-point calculations using the same functional/basis set as employed before. Electronic transition energies and dipole moments for all models were calculated using time-dependent DFT (TD-DFT)23-25 within the Tamm-Dancoff approximation.26,27 To increase computational efficiency, the RI approximation28 was used in calculating the Coulomb term. At least 40 excited states were calculated in each case and difference transition density plots were generated for each transition. IR spectra were obtained from numerical frequency calculations performed on optimized structures using the B3LYP functional together with the TZV/P basis set. Isotope shift effects (14N/15N) were taken into account using the orca_vib utility program. Vibrational normal modes were visualized with Chemcraft29 software and differential spectra were plotted using the orca_maspc utility program.
12
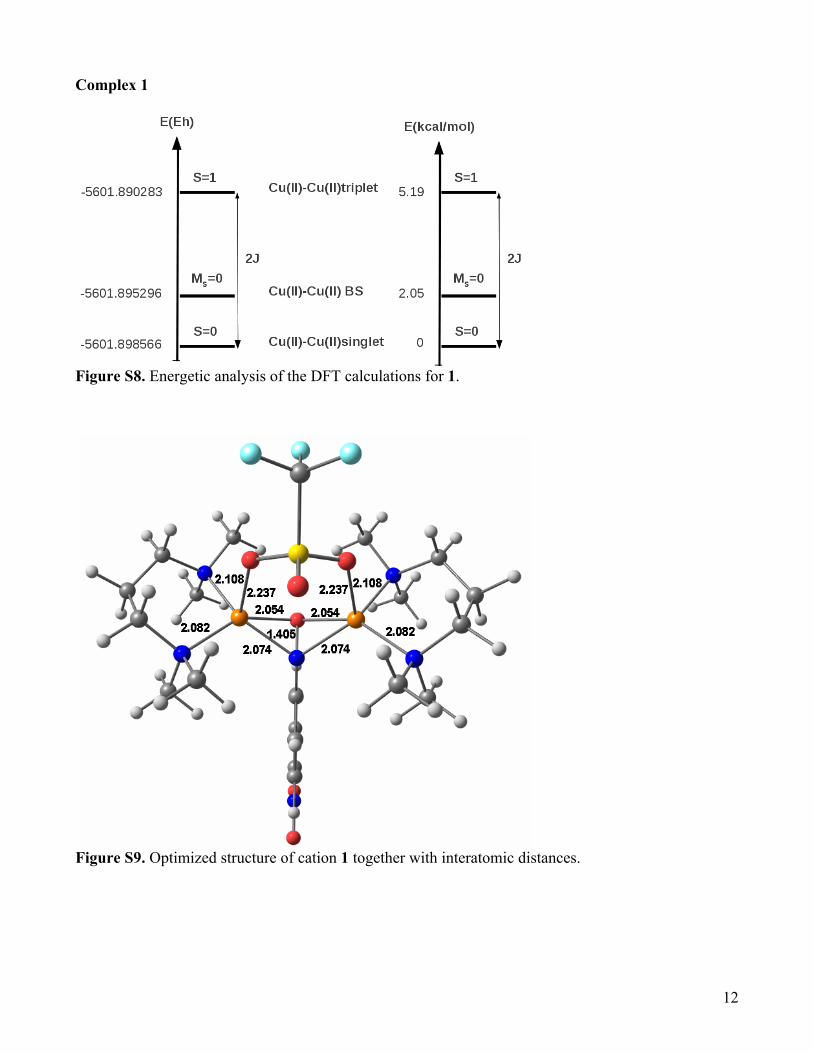
Complex 1
Figure S8. Energetic analysis of the DFT calculations for 1.
Figure S9. Optimized structure of cation 1 together with interatomic distances.
13
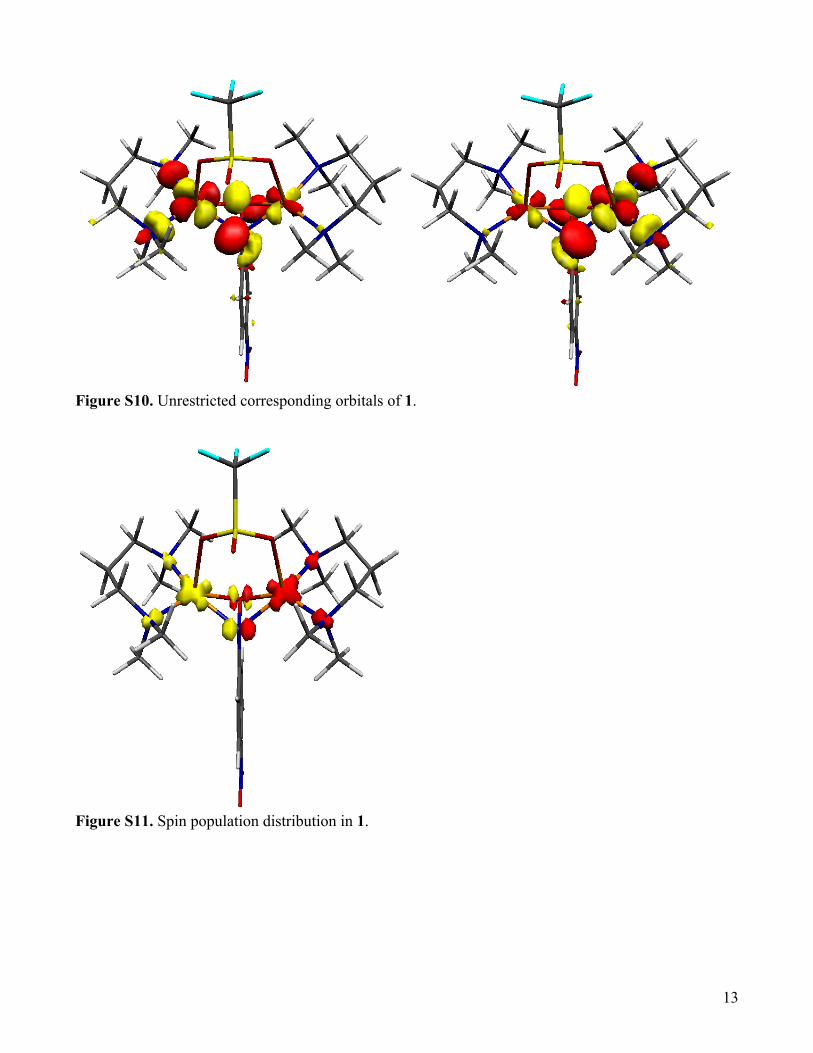
Figure S10. Unrestricted corresponding orbitals of 1.
Figure S11. Spin population distribution in 1.
14
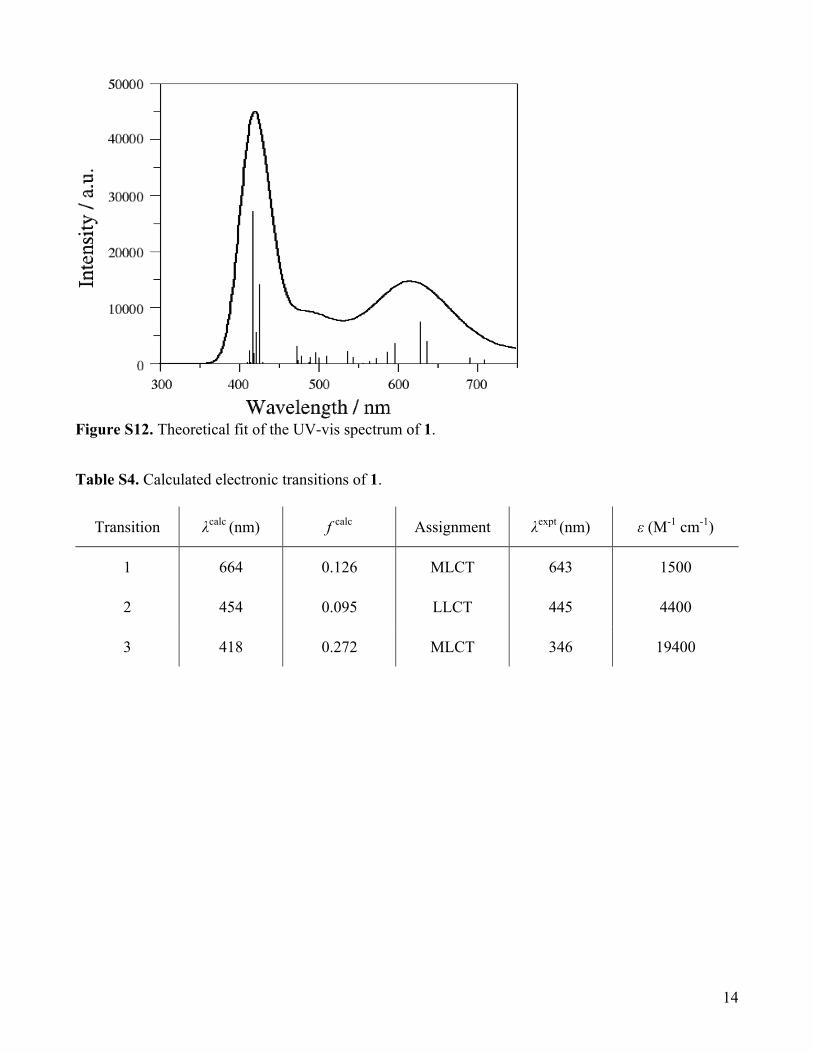
Figure S12. Theoretical fit of the UV-vis spectrum of 1.
Table S4. Calculated electronic transitions of 1.
Transition λcalc (nm) f calc Assignment λexpt (nm) ε (M-1 cm-1)
1 664 0.126 MLCT 643 1500
2 454 0.095 LLCT 445 4400
3 418 0.272 MLCT 346 19400
15
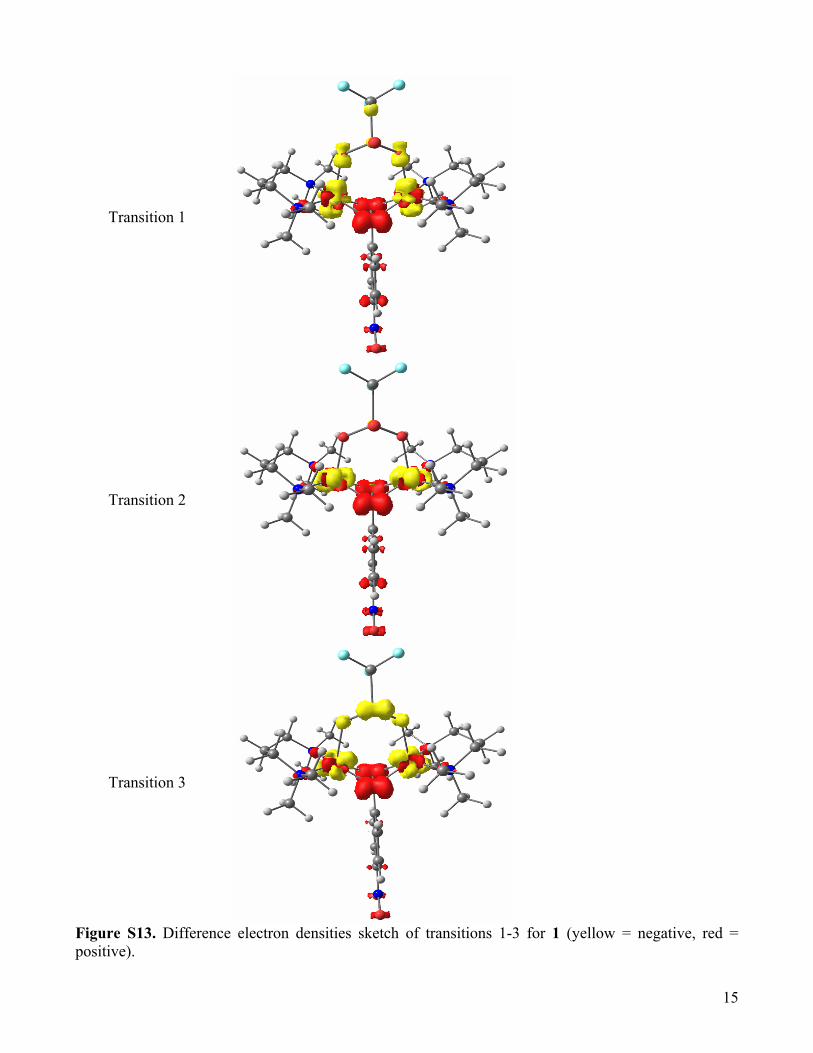
Transition 1
Transition 2
Transition 3
Figure S13. Difference electron densities sketch of transitions 1-3 for 1 (yellow = negative, red = positive).
16
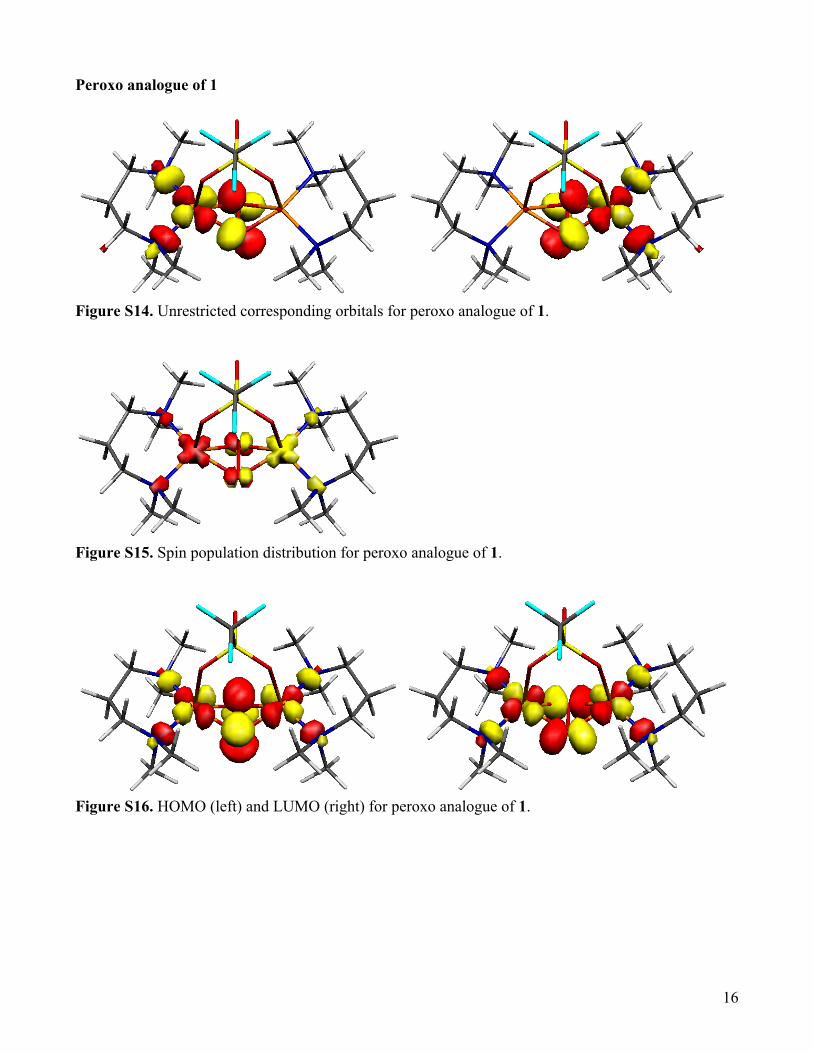
Peroxo analogue of 1
Figure S14. Unrestricted corresponding orbitals for peroxo analogue of 1.
Figure S15. Spin population distribution for peroxo analogue of 1.
Figure S16. HOMO (left) and LUMO (right) for peroxo analogue of 1.
17
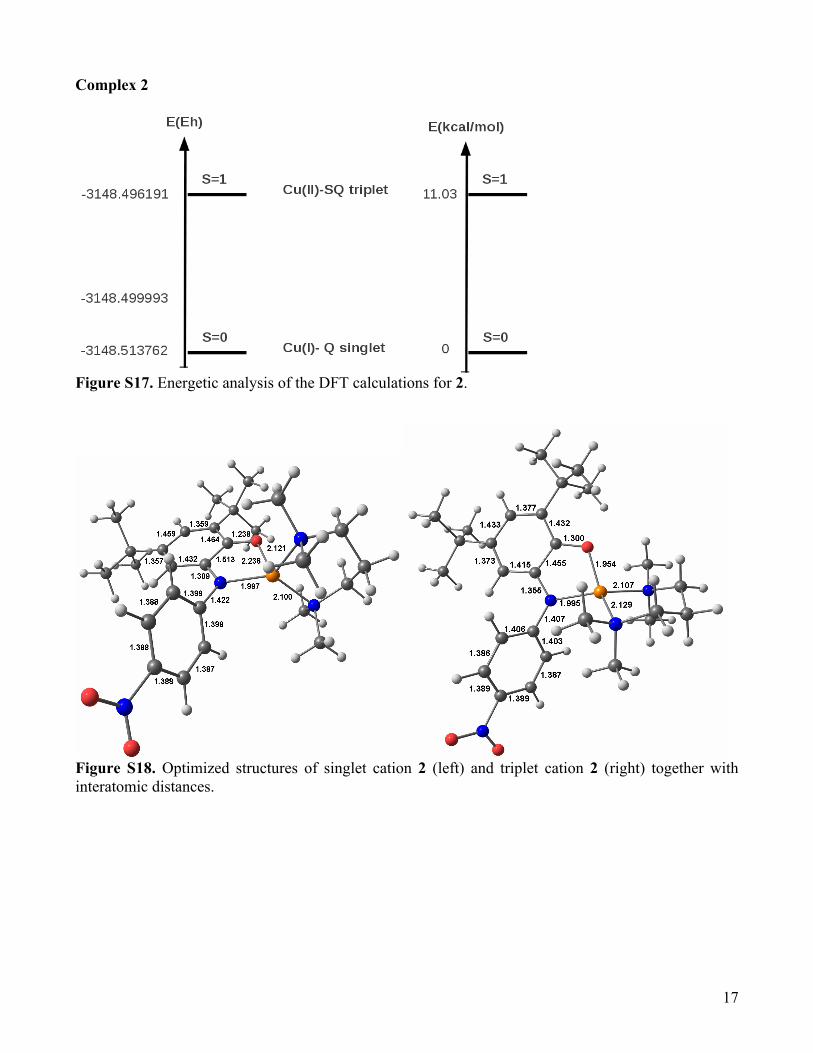
Complex 2
Figure S17. Energetic analysis of the DFT calculations for 2.
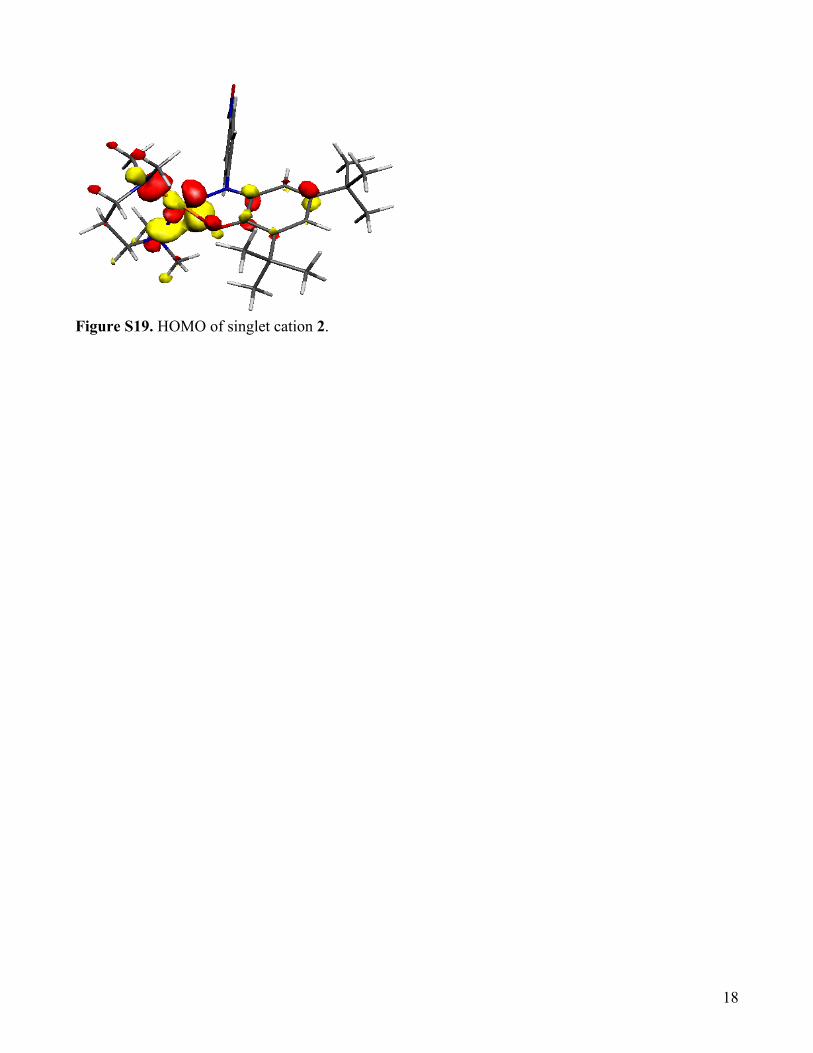
Figure S18. Optimized structures of singlet cation 2 (left) and triplet cation 2 (right) together with interatomic distances.
18
Figure S19. HOMO of singlet cation 2.
19
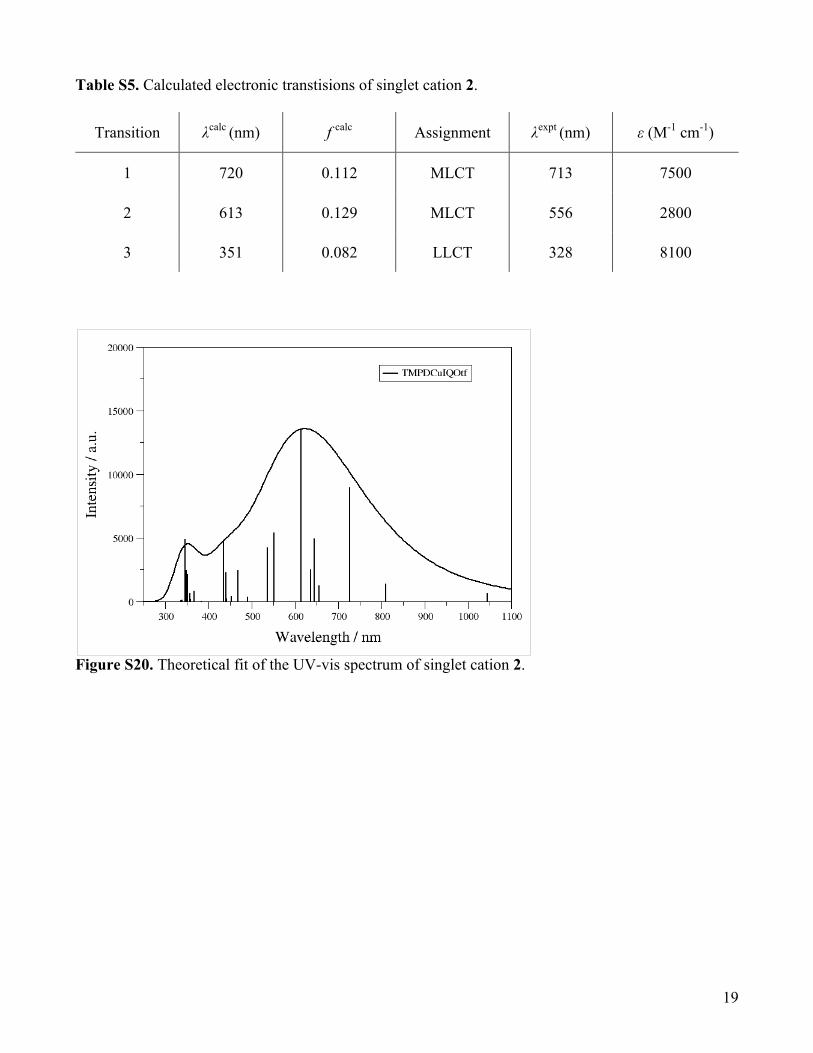
Table S5. Calculated electronic transtisions of singlet cation 2.
Transition λcalc (nm) f calc Assignment λexpt (nm) ε (M-1 cm-1)
1 720 0.112 MLCT 713 7500
2 613 0.129 MLCT 556 2800
3 351 0.082 LLCT 328 8100
Figure S20. Theoretical fit of the UV-vis spectrum of singlet cation 2.
20
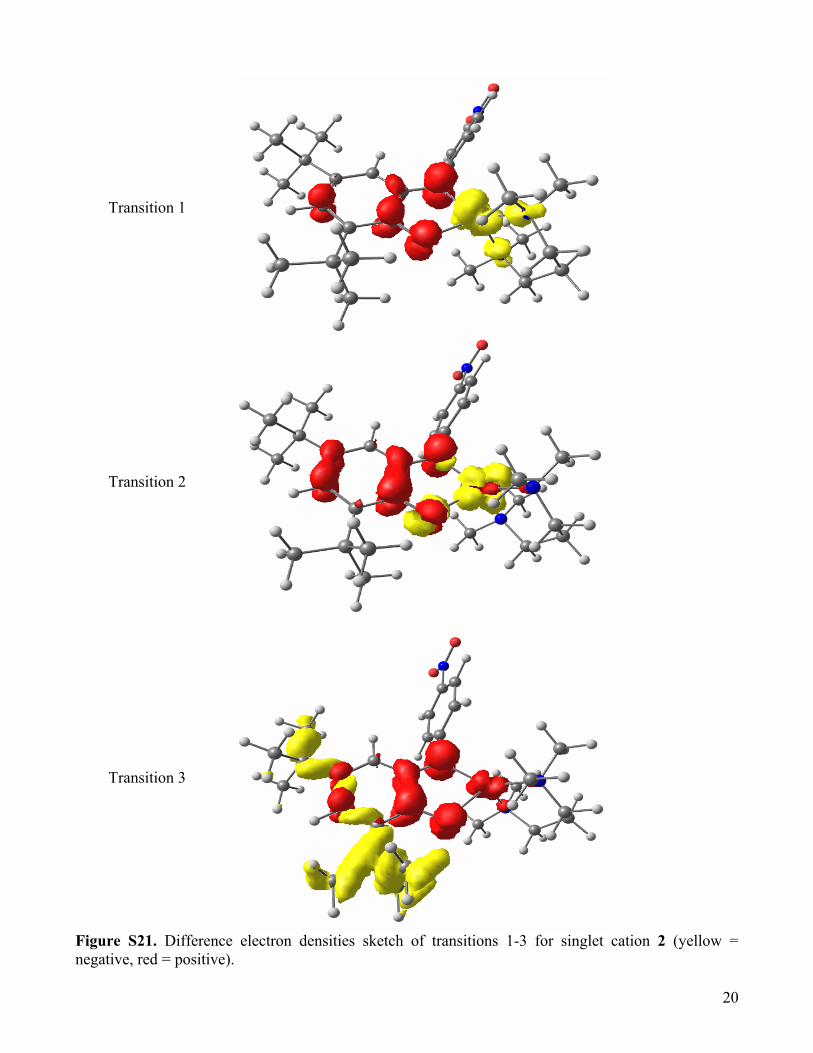
Transition 1
Transition 2
Transition 3
Figure S21. Difference electron densities sketch of transitions 1-3 for singlet cation 2 (yellow = negative, red = positive).
21
References [1] G. J. Kubas, Inorg. Synth. 1990, 28, 68-70. [2] I. Halasz, I. Biljan, P. Novak, E. Meštrović, J. Plavec, G. Mali, V. Smrečki, H. Vančik, J. Mol.
Struct. 2009, 918, 19-25. [3] J. Rosevear, J. Wilshire, Aust. J. Chem. 1985, 38, 723-733. [4] Neese, F. Wiley; Interdiscip. Rev. Comput. Mol. Sci. 2012, 2, 73. [5] Perdew, J. P. Phys. Rev. B; 1986, 33, 8822. [6] Perdew, J. P. Phys. Rev. B; 1986, 34, 7406. [7] Becke, A. D. Phys. Rev. A; 1988, 38, 3098. [8] Schäfer, A.; Huber, C.; Ahlrichs, R.; J. Chem. Phys. 1994, 100, 5829. [9] Neese, F. J.; Comput. Chem. 2003, 24, 1740. [10] Weigend, F.; Phys. Chem. Chem. Phys. 2006, 8, 1057. [11] Klamt, A.; Schürmann, G. J.; Chem. Soc., Perkin Trans. 2, 1993, 799. [12] Becke, A. D.; J. Chem. Phys. 1993, 98, 1372. [13] Lee, C. T.; Yang, W. T.; Parr, R. G.; Phys. Rev. B, 1988, 37, 785. [14] L. Noodleman; J. Chem. Phys.; 1981, 74, 5737. [15] L. Noodleman, D. A. Case; Adv. Inorg. Chem. 1992, 38, 423. [16] L. Noodleman, E. R. Davidson; Chem. Phys. 1986, 109, 131. [17] T. Soda, Y. Kitagawa, T. Onishi, Y. Takano, Y. Shigeta, H. Nagao, Y. Yoshika, K. Yamaguchi;
Chem. Phys. Lett. 2000, 223. [18] K. Yamaguchi, Y. Takahara, T. Fueno, In Applied Quantum Chemistry, V, V. H. Smith, Ed.
Reidel: Dordrecht, 1986. [19] W. Heisenberg; Z. Physik 1926, 38, 411. [20] W. Heisenberg; Z. Physik 1928, 49, 619. [21] P. A. M. Dirac; Proc. Roy. Soc. 1929, A123, 714. [22] J. H. Van Vleck; The Theory of Electronic and Magnetic Susceptibilities. Oxford University:
London 1932. [23] Casida, M. E., In Recent Advances in Density Functional Methods, Chong, D.P. Ed. World
Scientific: Singapore, 1995. [24] Stratmann, R. E.; Scuseria, G. E.; Frisch, M. J.; J. Chem. Phys. 1998, 109, 8218-8224. [25] Bauernschmitt, R.; Ahlrichs, R.; Chem. Phys. Lett. 1996, 454-464. [26] Hirata, S.; Head-Gordon, M.; Chem. Phys. Lett. 1999, 314, 291-299. [27] Hirata, S.; Head-Gordon, M.; Chem. Phys. Lett. 1999, 302, 375-382. [28] Neese, F.; J. Chem. Phys. 2001, 115, 11080. [29] chemcraft http://chemcraftprog.com.


![Simultaneous and absolute quantification of nucleoside ......9]UTP, 10 μM [15N 5, 13C 10]dATP, 10 μM[15N 5, 13C 10]dGTP, 10 μM [15N 3, 13C 9]dCTP, and 10 μM[15N 2, 13C 10]dTTP)](https://img.pdfslide.us/doc/110x75/6110c5cfc90cfe531510e3b4/simultaneous-and-absolute-quantification-of-nucleoside-9utp-10-m-15n.jpg)


![Solid-state [13C-15N] NMR resonance assignment of](https://img.pdfslide.us/doc/110x75/61c067b54e5f2831a445ab1b/solid-state-13c-15n-nmr-resonance-assignment-of-.jpg)