Embed Size (px)
Citation preview
HAL Id: hal-01325342https://hal.archives-ouvertes.fr/hal-01325342
Submitted on 15 Oct 2020
HAL is a multi-disciplinary open accessarchive for the deposit and dissemination of sci-entific research documents, whether they are pub-lished or not. The documents may come fromteaching and research institutions in France orabroad, or from public or private research centers.
L’archive ouverte pluridisciplinaire HAL, estdestinée au dépôt et à la diffusion de documentsscientifiques de niveau recherche, publiés ou non,émanant des établissements d’enseignement et derecherche français ou étrangers, des laboratoirespublics ou privés.
Electronic structure, low-temperature transport andthermodynamic properties of polymorphic b-As2Te3
Jean-Baptiste Vaney, Jean-Claude Crivello, Cédric Morin, Gaëlle Delaizir,Julie Carreaud, Andrea Piarristeguy, Judith Monnier, Eric Alleno, Annie
Pradel, Elsa B. Lopes, et al.
To cite this version:Jean-Baptiste Vaney, Jean-Claude Crivello, Cédric Morin, Gaëlle Delaizir, Julie Carreaud, et al.. Elec-tronic structure, low-temperature transport and thermodynamic properties of polymorphic b-As2Te3.RSC Advances, Royal Society of Chemistry, 2016, 6 (57), pp.52048-52057. �10.1039/c6ra01770c�.�hal-01325342�
RSC Advances
PAPER
Publ
ishe
d on
23
May
201
6. D
ownl
oade
d by
Uni
vers
ity o
f M
ontp
ellie
r on
01/
06/2
016
12:0
6:10
.
View Article OnlineView Journal | View Issue
Electronic struct
aInstitut Jean Lamour, UMR 7198 CNRS –
E-mail: [email protected] de Chimie et des Materiaux Paris E
Paris-Est Creteil, Thiais, FrancecScience des Procedes Ceramiques et de Tra
7315-Universite de Limoges, FrancedInstitut Charles Gerhardt (ICG), UMR 5253eC2TN, Instituto Superior Tecnico, Universid
† Electronic supplementary informa10.1039/c6ra01770c
Cite this: RSC Adv., 2016, 6, 52048
Received 20th January 2016Accepted 20th May 2016
DOI: 10.1039/c6ra01770c
www.rsc.org/advances
52048 | RSC Adv., 2016, 6, 52048–520
ure, low-temperature transportand thermodynamic properties of polymorphicb-As2Te3†
J.-B. Vaney,a J.-C. Crivello,b C. Morin,b G. Delaizir,c J. Carreaud,c A. Piarristeguy,d
J. Monnier,b E. Alleno,b A. Pradel,d E. B. Lopes,e A. P. Gonçalves,e A. Dauscher,a
C. Candolfia and B. Lenoir*a
b-As2Te3 belongs to the prominent family of Bi2Te3-based materials, which show excellent thermoelectric
properties near room temperature. In this study, we report a joint theoretical and experimental investigation
of its electronic and thermal properties at low temperatures (5–300 K). These results are complemented by
specific heat measurements (1.8–300 K) that provide further experimental evidence of the first order lattice
distortion undergone by b-As2Te3 near 190 K. Data taken on cooling and heating across this transition show
that the lattice distortion has little influence on the electronic properties and further evidence a weak
hysteretic behavior. Although first-principles calculations predict a semiconducting ground state, these
measurements show that b-As2Te3 behaves as a degenerate p-type semiconductor with a high carrier
concentration of 1020 cm�3 at 300 K likely due to intrinsic defects. Calculations of the vibrational
properties indicate that the extremely low lattice thermal conductivity values (0.8 W m�1 K�1 at 300 K)
mainly originate from low-energy Te optical modes that limit the energy window of the acoustic
branches. This limited ability to transport heat combined with a relatively large band gap suggest that
high thermoelectric efficiency could be achieved in this compound when appropriately doped.
Introduction
Thermoelectric materials, that directly convert either heat intoelectricity or electricity into a thermal gradient, are used insolid-state devices that enable waste-heat harvesting or power-ing of deep space probes and rovers.1,2 The efficiency of a ther-moelectric device, should it be used as a generator or solid-statecooler, is governed by the dimensionless gure of merit ZTdened at the operating temperature T as ZT ¼ a2 T/r(ke + kL).1
High thermoelectric performances require the design of high-ZT materials in which a ne balance between the thermopowera, the electrical resistivity r and the electronic and latticethermal conductivities ke and kL, respectively, must be achieved.Among frequently used strategies for optimizing the thermo-electric properties, the search for materials that are poorthermal conductors proved to be a fruitful way of research. This
Universite de Lorraine, Nancy, France.
st (ICMPE), UMR 7182 CNRS-Universite
itements de Surface (SPCTS), UMR CNRS
CNRS-Universite de Montpellier, France
ade de Lisboa, Lisboa, Portugal
tion (ESI) available. See DOI:
57
approach led to the identication of many families ofcompounds, such as Zintl phases,3–7 cluster compounds,8–10
chalcogenides,11–16 or natural minerals,17–22 that all exhibit thedesirable features of good thermoelectric materials: a complexcrystal structure to limit the heat conduction combined withsemiconducting-like electronic properties that can be engi-neered through doping.
Despite strong efforts devoted to the search for materialsable to operate at ambient temperature, the semiconducting(Bi,Sb)2X3-based alloys (X ¼ Se, Te) still remain to date the mostprominent class of thermoelectric materials for room-temperature thermoelectric applications.1,2 These compoundscrystallize in a rhombohedral unit cell leading to isotropictransport properties in both single-crystalline and in somepolycrystalline samples depending on the synthesis process. Alarge number of substituting elements can be used to alter theirtransport properties resulting in a wide variety of physicalphenomena,23,24 in addition to their Dirac-like conductingsurface states classifying these compounds as 3D topologicalinsulators.25–27
Recently, our initial investigation on the high-temperaturethermoelectric properties of a new member of this family,namely b-As2Te3, evidenced extremely low lattice thermalconductivity approaching the amorphous limit (0.5 W m�1 K�1
at 423 K).28 This property, combined with enhanced powerfactors due to Sn doping, resulted in a peak ZT of 0.65 at 423 K.
This journal is © The Royal Society of Chemistry 2016
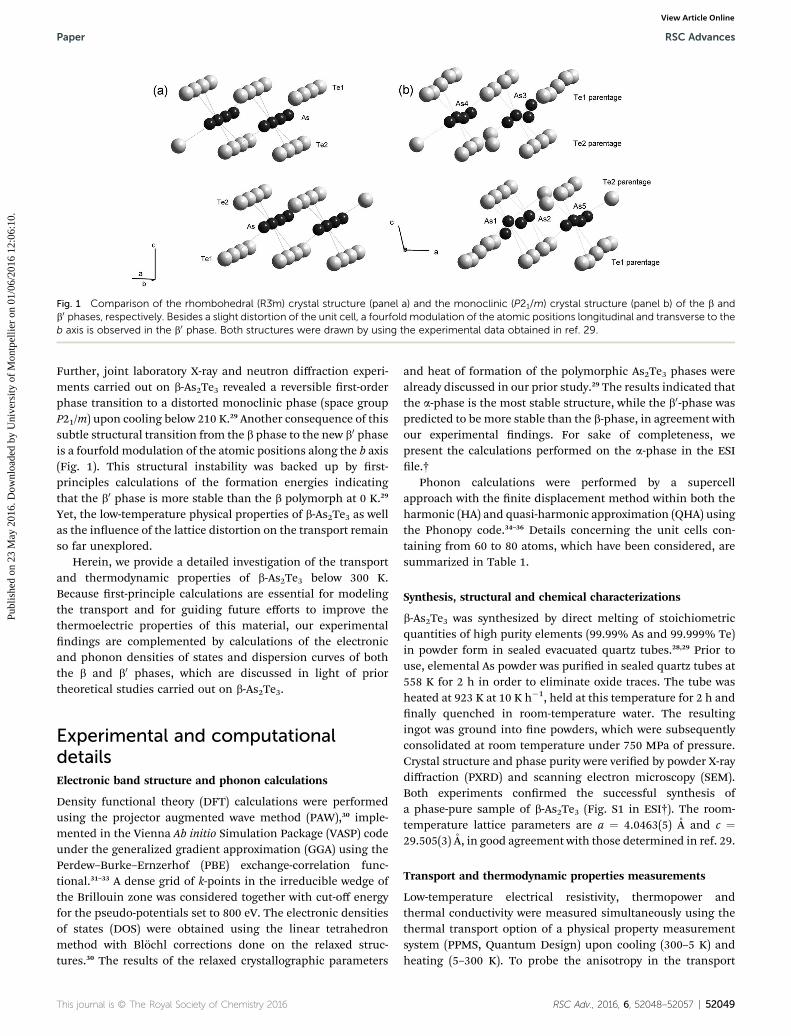
Fig. 1 Comparison of the rhombohedral (R3�m) crystal structure (panel a) and the monoclinic (P21/m) crystal structure (panel b) of the b andb0 phases, respectively. Besides a slight distortion of the unit cell, a fourfold modulation of the atomic positions longitudinal and transverse to theb axis is observed in the b0 phase. Both structures were drawn by using the experimental data obtained in ref. 29.
Paper RSC Advances
Publ
ishe
d on
23
May
201
6. D
ownl
oade
d by
Uni
vers
ity o
f M
ontp
ellie
r on
01/
06/2
016
12:0
6:10
. View Article Online
Further, joint laboratory X-ray and neutron diffraction experi-ments carried out on b-As2Te3 revealed a reversible rst-orderphase transition to a distorted monoclinic phase (space groupP21/m) upon cooling below 210 K.29 Another consequence of thissubtle structural transition from the b phase to the new b0 phaseis a fourfold modulation of the atomic positions along the b axis(Fig. 1). This structural instability was backed up by rst-principles calculations of the formation energies indicatingthat the b0 phase is more stable than the b polymorph at 0 K.29
Yet, the low-temperature physical properties of b-As2Te3 as wellas the inuence of the lattice distortion on the transport remainso far unexplored.
Herein, we provide a detailed investigation of the transportand thermodynamic properties of b-As2Te3 below 300 K.Because rst-principle calculations are essential for modelingthe transport and for guiding future efforts to improve thethermoelectric properties of this material, our experimentalndings are complemented by calculations of the electronicand phonon densities of states and dispersion curves of boththe b and b0 phases, which are discussed in light of priortheoretical studies carried out on b-As2Te3.
Experimental and computationaldetailsElectronic band structure and phonon calculations
Density functional theory (DFT) calculations were performedusing the projector augmented wave method (PAW),30 imple-mented in the Vienna Ab initio Simulation Package (VASP) codeunder the generalized gradient approximation (GGA) using thePerdew–Burke–Ernzerhof (PBE) exchange-correlation func-tional.31–33 A dense grid of k-points in the irreducible wedge ofthe Brillouin zone was considered together with cut-off energyfor the pseudo-potentials set to 800 eV. The electronic densitiesof states (DOS) were obtained using the linear tetrahedronmethod with Blochl corrections done on the relaxed struc-tures.30 The results of the relaxed crystallographic parameters
This journal is © The Royal Society of Chemistry 2016
and heat of formation of the polymorphic As2Te3 phases werealready discussed in our prior study.29 The results indicated thatthe a-phase is the most stable structure, while the b0-phase waspredicted to be more stable than the b-phase, in agreement withour experimental ndings. For sake of completeness, wepresent the calculations performed on the a-phase in the ESIle.†
Phonon calculations were performed by a supercellapproach with the nite displacement method within both theharmonic (HA) and quasi-harmonic approximation (QHA) usingthe Phonopy code.34–36 Details concerning the unit cells con-taining from 60 to 80 atoms, which have been considered, aresummarized in Table 1.
Synthesis, structural and chemical characterizations
b-As2Te3 was synthesized by direct melting of stoichiometricquantities of high purity elements (99.99% As and 99.999% Te)in powder form in sealed evacuated quartz tubes.28,29 Prior touse, elemental As powder was puried in sealed quartz tubes at558 K for 2 h in order to eliminate oxide traces. The tube washeated at 923 K at 10 K h�1, held at this temperature for 2 h andnally quenched in room-temperature water. The resultingingot was ground into ne powders, which were subsequentlyconsolidated at room temperature under 750 MPa of pressure.Crystal structure and phase purity were veried by powder X-raydiffraction (PXRD) and scanning electron microscopy (SEM).Both experiments conrmed the successful synthesis ofa phase-pure sample of b-As2Te3 (Fig. S1 in ESI†). The room-temperature lattice parameters are a ¼ 4.0463(5) A and c ¼29.505(3) A, in good agreement with those determined in ref. 29.
Transport and thermodynamic properties measurements
Low-temperature electrical resistivity, thermopower andthermal conductivity were measured simultaneously using thethermal transport option of a physical property measurementsystem (PPMS, Quantum Design) upon cooling (300–5 K) andheating (5–300 K). To probe the anisotropy in the transport
RSC Adv., 2016, 6, 52048–52057 | 52049

Table 1 Crystallographic parameters, electronic band gap, phonon supercell details and heats of formation (gross and ZPE corrected) of thepolymorphic As2Te3 phases obtained after the full DFT relaxation. For sake of completeness, the parameters of the a phase are also added. Theexperimental data obtained at 300 K on the a and b phase in ref. 29 are mentioned in parenthesis. The crystallographic data of the b0 phase (ref.29) were determined at 20 K. When available, the experimental band gap is also mentioned
a C2/m (12) b R�3m (166) b0 P21/m (11) b0 C2/m (12)
a (A) 14.962 (14.337) 4.102 (4.047) 7.087 (6.99) 7.088b (A) 4.071 (4.015) — 16.366 (16.24) 4.092c (A) 10.130 (9.887) 29.745 (29.498) 10.475 (10.25) 10.463b (�) 95.579 (95.06) — 103.016 (103.4) 103.044Volume (A3 atom�1) 30.701 (28.456) 28.893 (27.893) 29.592 (28.297) 29.560Theoretical band gap (eV) 0.46 0.30 0.39 0.39Experimental band gap (eV) 0.43 (ref. 42) — — —Phonon supercell 2 � 2 � 2 (80 at) 2 � 2 � 1 (60 at) 1 � 1 � 1 (80 at) 2 � 2 � 2 (80 at)
RSC Advances Paper
Publ
ishe
d on
23
May
201
6. D
ownl
oade
d by
Uni
vers
ity o
f M
ontp
ellie
r on
01/
06/2
016
12:0
6:10
. View Article Online
properties, bar-shaped samples of well-dened geometry (�2.5� 3 � 8 mm3) were cut in the consolidated ingots both paralleland perpendicular to the pressing direction with a diamond-wire saw. To ensure good electrical and thermal contacts, fourcopper tabs were soldered with a low melting point braze. Thetemperature gradient was established by applying heat at oneend of the specimen while holding the other end at a constanttemperature by maintaining a good thermal contact to a heatsink. Calibrated cernox thermometers were attached to thesample between 2.5 and 3.5 mm apart. The temperaturedifference was monitored to amount to 2% of the temperatureat which the measurement was done. The voltage and temper-ature difference were measured at the same positions along thesample. The data collected were corrected for thermal radia-tions by a model implemented in the TTO option soware byQuantum Design that uses an accurate estimate of the bathtemperature around the sample.
The Hall resistivity was determined from measurements ofthe transverse electrical resistivity rxy under magnetic elds m0Hranging between�1 and +1 T. The data were corrected for slightmisalignment of the contacts by applying the formula rH ¼[rxy(m0H) � rxy(�m0H)]/2. The Hall coefficient RH was deter-mined from the slope of the rH(m0H) data in the limit m0H / 0.The Hall carrier concentration p andmobility mH were estimatedwithin a single-band model with a Hall factor rH equal to 1 thatyields the relations p ¼ rH/RHe ¼ 1/RHe and mH ¼ RH/r. Specicheat measurements were carried out on cooling and heatingbetween 1.8 and 300 K using the dedicated option of the PPMS.A sample of approximately 20 mg was glued on the sampleholder with a tiny amount of Apiezon N grease. The experi-mental uncertainty on the transport, Hall effect and specicheat measurements is estimated to be 5%, 5% and 3%,respectively.
Results and discussionElectronic band structure
Fig. 2a shows the electronic band structure and the integrateddensity of states (DOS) of the b0-As2Te3 phase calculated in theP21/m symmetry. Because of the strong similarities between thecrystal structure of the b0 and b phases, the electronic propertiesare very similar. The electronic structure of the b polymorph, in
52050 | RSC Adv., 2016, 6, 52048–52057
agreement with those reported in prior studies, shares simi-larities with that of Bi2Te3, notably the presence of six-folddegenerate band edges.37 In the b0 phase, the low-energydispersive bands located between �13.5 and �7.5 eV belowthe Fermi level originates from the interaction between the non-localized 4s-As and the 5s-Te states. Compared to b-As2Te3, thisstructure is less broad owing to a stronger localization of s-electrons due to the reduced unit cell volume of the b0 phase.The region between the bonding and anti-bonding 4s-As statesis highly dense and corresponds to localized bands of 5s-Testates that lead to high peaks in the partial DOS (Fig. 2b andS4 in ESI†).
The valence bands, extending over �5.5 eV, are separatedfrom this region by a gap of about 2 eV. The valence bands areat and mainly dominated by the 4p-As and the 5p-Te states. Asshown in the magnied Fig. 2c, the valence bandmaximum andconduction band minimum are located along the D–E directionresulting in a slightly indirect band gap of 0.39 eV (Dk ¼ 0.05 �2pa* where a* is the reciprocal lattice vector). The directionaleffective mass of holes along the D–E direction m*
D–E is esti-mated to 0.31m0 where m0 is the free electron mass. The Fermilevel has been conventionally set at the top of the valence bands.The magnitude of the band gap in the b0 phase is slightly higherthan that obtained in the b phase which features a direct bandgap of 0.30 eV (Fig. S6 and S8 in ESI†). This value is higher thanthat calculated in ref. 38 where a direct band gap of 0.24 eV wasfound at the G point. A comparison of these ndings with theliterature indicates a rather large discrepancy among the resultsreported for the b phase. While our value agrees with that ob-tained by Pal et al.39 who found a band gap of 0.35 eV withcalculation based on all-electron full potential linearizedaugmented plane wave (FP-LAPW) technique, prior valuesderived theoretically (0.12 eV in ref. 37 and 0.22 eV in ref. 40) aresignicantly lower. These differences in the computed bandgaps are most likely due to the different methodologies used,both the direct or indirect nature of the band gap and its valuebeing strongly sensitive to details of the calculations.
In the prior study of Pal et al.,39 a compressive strain appliedalong the c-axis of the crystal structure was used to predict thetransition from a trivial band insulator to a topological insu-lating state in b-As2Te3. Following this approach, we comparedthe evolution of the band gap under an isotropic stress for
This journal is © The Royal Society of Chemistry 2016
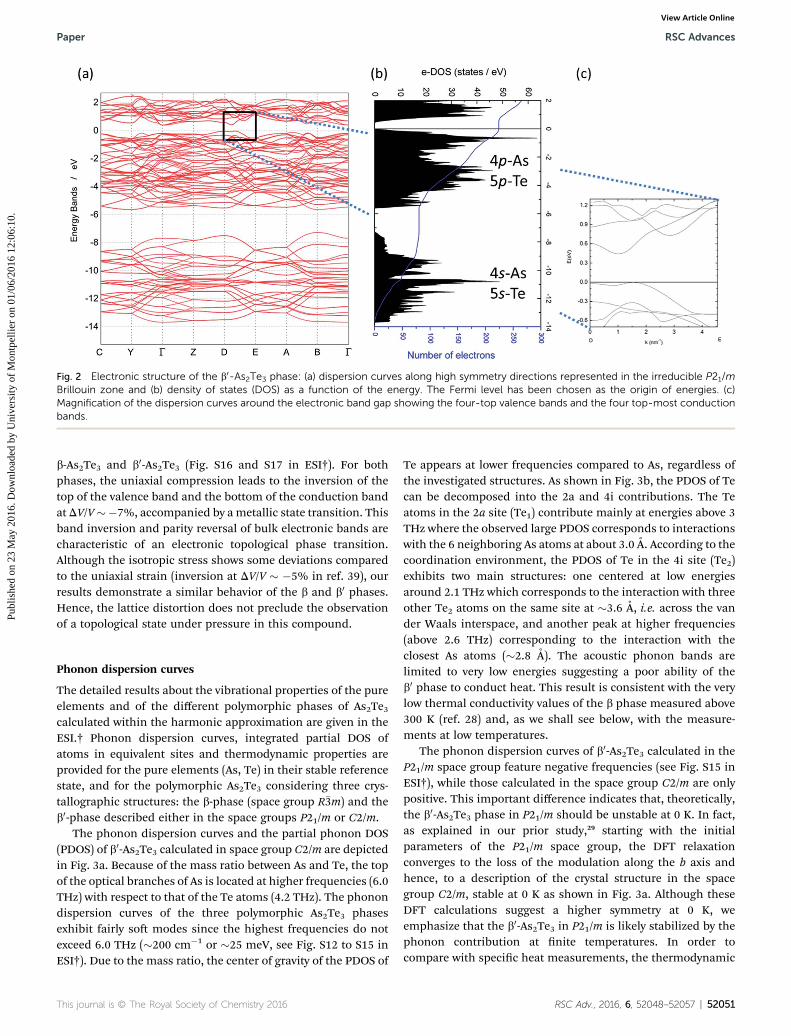
Fig. 2 Electronic structure of the b0-As2Te3 phase: (a) dispersion curves along high symmetry directions represented in the irreducible P21/mBrillouin zone and (b) density of states (DOS) as a function of the energy. The Fermi level has been chosen as the origin of energies. (c)Magnification of the dispersion curves around the electronic band gap showing the four-top valence bands and the four top-most conductionbands.
Paper RSC Advances
Publ
ishe
d on
23
May
201
6. D
ownl
oade
d by
Uni
vers
ity o
f M
ontp
ellie
r on
01/
06/2
016
12:0
6:10
. View Article Online
b-As2Te3 and b0-As2Te3 (Fig. S16 and S17 in ESI†). For bothphases, the uniaxial compression leads to the inversion of thetop of the valence band and the bottom of the conduction bandatDV/V��7%, accompanied by ametallic state transition. Thisband inversion and parity reversal of bulk electronic bands arecharacteristic of an electronic topological phase transition.Although the isotropic stress shows some deviations comparedto the uniaxial strain (inversion at DV/V � �5% in ref. 39), ourresults demonstrate a similar behavior of the b and b0 phases.Hence, the lattice distortion does not preclude the observationof a topological state under pressure in this compound.
Phonon dispersion curves
The detailed results about the vibrational properties of the pureelements and of the different polymorphic phases of As2Te3calculated within the harmonic approximation are given in theESI.† Phonon dispersion curves, integrated partial DOS ofatoms in equivalent sites and thermodynamic properties areprovided for the pure elements (As, Te) in their stable referencestate, and for the polymorphic As2Te3 considering three crys-tallographic structures: the b-phase (space group R�3m) and theb0-phase described either in the space groups P21/m or C2/m.
The phonon dispersion curves and the partial phonon DOS(PDOS) of b0-As2Te3 calculated in space group C2/m are depictedin Fig. 3a. Because of the mass ratio between As and Te, the topof the optical branches of As is located at higher frequencies (6.0THz) with respect to that of the Te atoms (4.2 THz). The phonondispersion curves of the three polymorphic As2Te3 phasesexhibit fairly so modes since the highest frequencies do notexceed 6.0 THz (�200 cm�1 or �25 meV, see Fig. S12 to S15 inESI†). Due to the mass ratio, the center of gravity of the PDOS of
This journal is © The Royal Society of Chemistry 2016
Te appears at lower frequencies compared to As, regardless ofthe investigated structures. As shown in Fig. 3b, the PDOS of Tecan be decomposed into the 2a and 4i contributions. The Teatoms in the 2a site (Te1) contribute mainly at energies above 3THz where the observed large PDOS corresponds to interactionswith the 6 neighboring As atoms at about 3.0 A. According to thecoordination environment, the PDOS of Te in the 4i site (Te2)exhibits two main structures: one centered at low energiesaround 2.1 THz which corresponds to the interaction with threeother Te2 atoms on the same site at �3.6 A, i.e. across the vander Waals interspace, and another peak at higher frequencies(above 2.6 THz) corresponding to the interaction with theclosest As atoms (�2.8 A). The acoustic phonon bands arelimited to very low energies suggesting a poor ability of theb0 phase to conduct heat. This result is consistent with the verylow thermal conductivity values of the b phase measured above300 K (ref. 28) and, as we shall see below, with the measure-ments at low temperatures.
The phonon dispersion curves of b0-As2Te3 calculated in theP21/m space group feature negative frequencies (see Fig. S15 inESI†), while those calculated in the space group C2/m are onlypositive. This important difference indicates that, theoretically,the b0-As2Te3 phase in P21/m should be unstable at 0 K. In fact,as explained in our prior study,29 starting with the initialparameters of the P21/m space group, the DFT relaxationconverges to the loss of the modulation along the b axis andhence, to a description of the crystal structure in the spacegroup C2/m, stable at 0 K as shown in Fig. 3a. Although theseDFT calculations suggest a higher symmetry at 0 K, weemphasize that the b0-As2Te3 in P21/m is likely stabilized by thephonon contribution at nite temperatures. In order tocompare with specic heat measurements, the thermodynamic
RSC Adv., 2016, 6, 52048–52057 | 52051
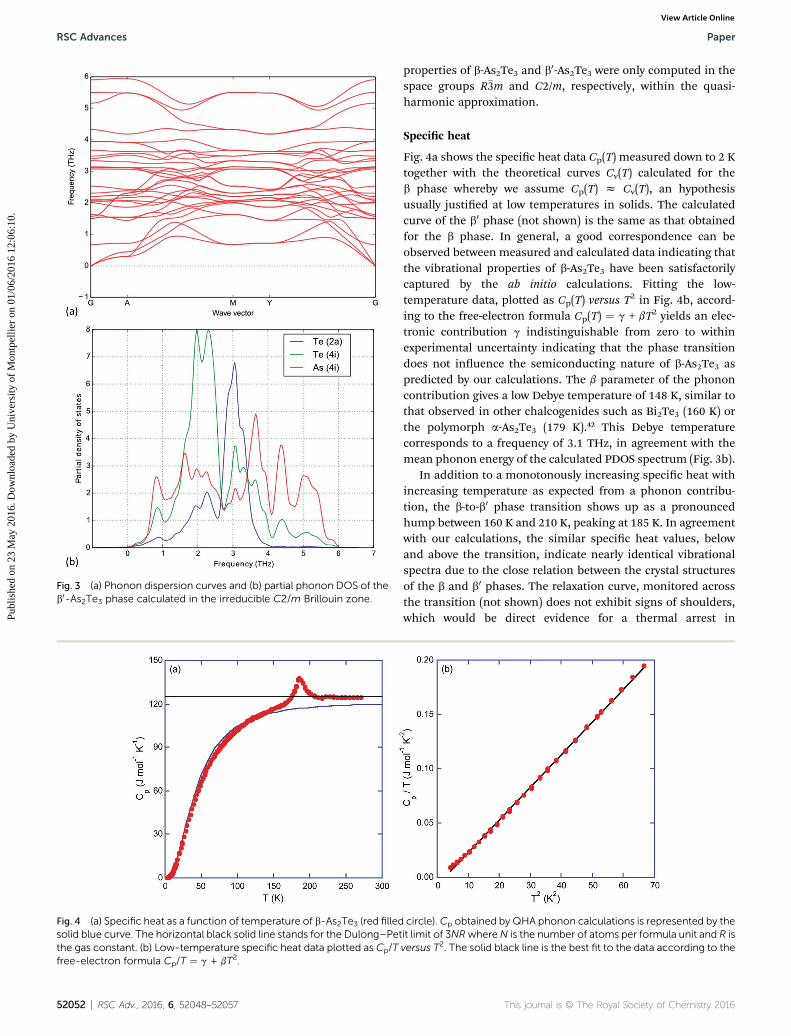
Fig. 3 (a) Phonon dispersion curves and (b) partial phonon DOS of theb0-As2Te3 phase calculated in the irreducible C2/m Brillouin zone.
Fig. 4 (a) Specific heat as a function of temperature of b-As2Te3 (red filledsolid blue curve. The horizontal black solid line stands for the Dulong–Petthe gas constant. (b) Low-temperature specific heat data plotted as Cp/Tfree-electron formula Cp/T ¼ g + bT2.
52052 | RSC Adv., 2016, 6, 52048–52057
RSC Advances Paper
Publ
ishe
d on
23
May
201
6. D
ownl
oade
d by
Uni
vers
ity o
f M
ontp
ellie
r on
01/
06/2
016
12:0
6:10
. View Article Online
properties of b-As2Te3 and b0-As2Te3 were only computed in thespace groups R�3m and C2/m, respectively, within the quasi-harmonic approximation.
Specic heat
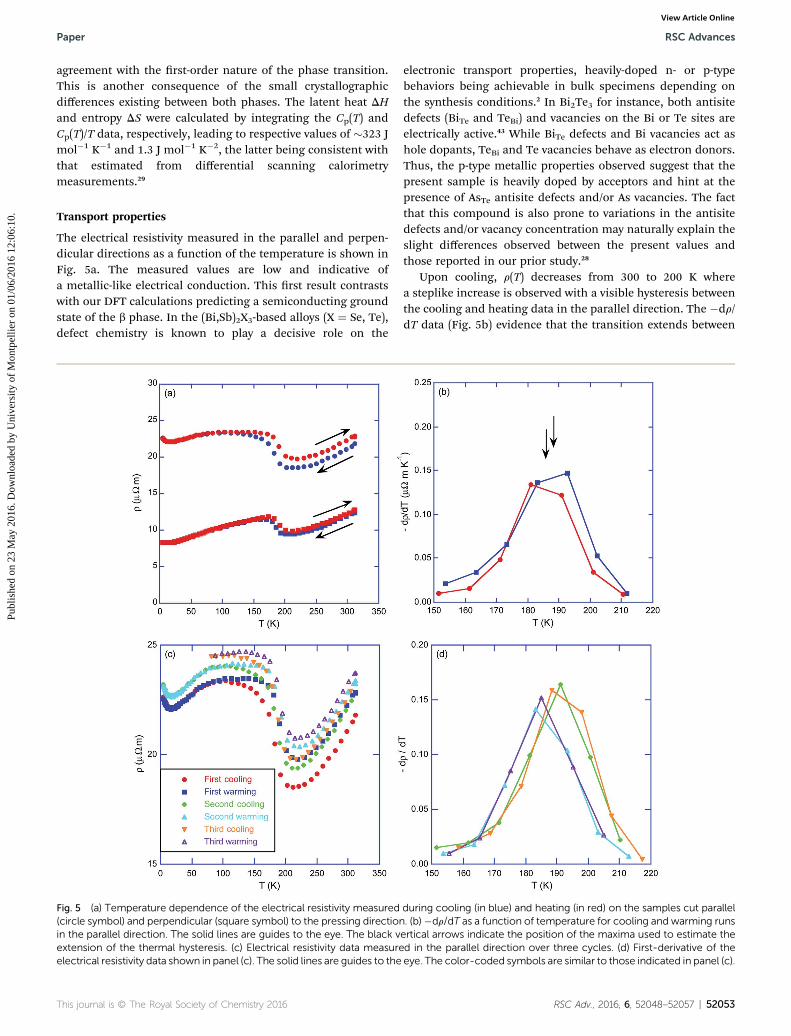
Fig. 4a shows the specic heat data Cp(T) measured down to 2 Ktogether with the theoretical curves Cv(T) calculated for theb phase whereby we assume Cp(T) z Cv(T), an hypothesisusually justied at low temperatures in solids. The calculatedcurve of the b0 phase (not shown) is the same as that obtainedfor the b phase. In general, a good correspondence can beobserved between measured and calculated data indicating thatthe vibrational properties of b-As2Te3 have been satisfactorilycaptured by the ab initio calculations. Fitting the low-temperature data, plotted as Cp(T) versus T
2 in Fig. 4b, accord-ing to the free-electron formula Cp(T) ¼ g + bT2 yields an elec-tronic contribution g indistinguishable from zero to withinexperimental uncertainty indicating that the phase transitiondoes not inuence the semiconducting nature of b-As2Te3 aspredicted by our calculations. The b parameter of the phononcontribution gives a low Debye temperature of 148 K, similar tothat observed in other chalcogenides such as Bi2Te3 (160 K) orthe polymorph a-As2Te3 (179 K).42 This Debye temperaturecorresponds to a frequency of 3.1 THz, in agreement with themean phonon energy of the calculated PDOS spectrum (Fig. 3b).
In addition to a monotonously increasing specic heat withincreasing temperature as expected from a phonon contribu-tion, the b-to-b0 phase transition shows up as a pronouncedhump between 160 K and 210 K, peaking at 185 K. In agreementwith our calculations, the similar specic heat values, belowand above the transition, indicate nearly identical vibrationalspectra due to the close relation between the crystal structuresof the b and b0 phases. The relaxation curve, monitored acrossthe transition (not shown) does not exhibit signs of shoulders,which would be direct evidence for a thermal arrest in
circle).Cp obtained by QHA phonon calculations is represented by theit limit of 3NRwhereN is the number of atoms per formula unit and R isversus T2. The solid black line is the best fit to the data according to the
This journal is © The Royal Society of Chemistry 2016
Paper RSC Advances
Publ
ishe
d on
23
May
201
6. D
ownl
oade
d by
Uni
vers
ity o
f M
ontp
ellie
r on
01/
06/2
016
12:0
6:10
. View Article Online
agreement with the rst-order nature of the phase transition.This is another consequence of the small crystallographicdifferences existing between both phases. The latent heat DHand entropy DS were calculated by integrating the Cp(T) andCp(T)/T data, respectively, leading to respective values of �323 Jmol�1 K�1 and 1.3 J mol�1 K�2, the latter being consistent withthat estimated from differential scanning calorimetrymeasurements.29
Transport properties
The electrical resistivity measured in the parallel and perpen-dicular directions as a function of the temperature is shown inFig. 5a. The measured values are low and indicative ofa metallic-like electrical conduction. This rst result contrastswith our DFT calculations predicting a semiconducting groundstate of the b phase. In the (Bi,Sb)2X3-based alloys (X ¼ Se, Te),defect chemistry is known to play a decisive role on the
Fig. 5 (a) Temperature dependence of the electrical resistivity measured(circle symbol) and perpendicular (square symbol) to the pressing directionin the parallel direction. The solid lines are guides to the eye. The black vextension of the thermal hysteresis. (c) Electrical resistivity data measureelectrical resistivity data shown in panel (c). The solid lines are guides to the
This journal is © The Royal Society of Chemistry 2016
electronic transport properties, heavily-doped n- or p-typebehaviors being achievable in bulk specimens depending onthe synthesis conditions.2 In Bi2Te3 for instance, both antisitedefects (BiTe and TeBi) and vacancies on the Bi or Te sites areelectrically active.43 While BiTe defects and Bi vacancies act ashole dopants, TeBi and Te vacancies behave as electron donors.Thus, the p-type metallic properties observed suggest that thepresent sample is heavily doped by acceptors and hint at thepresence of AsTe antisite defects and/or As vacancies. The factthat this compound is also prone to variations in the antisitedefects and/or vacancy concentration may naturally explain theslight differences observed between the present values andthose reported in our prior study.28
Upon cooling, r(T) decreases from 300 to 200 K wherea steplike increase is observed with a visible hysteresis betweenthe cooling and heating data in the parallel direction. The �dr/dT data (Fig. 5b) evidence that the transition extends between
during cooling (in blue) and heating (in red) on the samples cut parallel. (b)�dr/dT as a function of temperature for cooling and warming runsertical arrows indicate the position of the maxima used to estimate thed in the parallel direction over three cycles. (d) First-derivative of theeye. The color-coded symbols are similar to those indicated in panel (c).
RSC Adv., 2016, 6, 52048–52057 | 52053
RSC Advances Paper
Publ
ishe
d on
23
May
201
6. D
ownl
oade
d by
Uni
vers
ity o
f M
ontp
ellie
r on
01/
06/2
016
12:0
6:10
. View Article Online
210 K and 160 K with maxima at 186 and 188 K for the coolingand heating runs, respectively. This anomaly is consistent withthe rst-order phase transition revealed in our prior study.29 r(T)remains nearly constant from 160 K down to 2 K with a shallowminimum visible near 15 K in the parallel direction while in theperpendicular direction, r(T) smoothly decreases down to 25 Kwhere it tends to level off. Upon warming, the r values measuredin the parallel direction are higher than those taken duringcooling with no sign of merging up to 300 K. This effect ishowever less discernable in the perpendicular direction towithin experimental uncertainty. Similar behaviors have alreadybeen observed in other systems such as in Gd5(Si/Ge)4 wherea rst-order martensitic transition develops between 250 and300 K.44 The slight difference in r(T) during the thermal cyclehad not only been attributed to the transition itself but also tomicrocracks in the sample volume that form in the course of thetransformation. Although the present transition does not showa martensitic character, internal stresses that appear during thetransition may be responsible for the observed increase in r.This possibility seems corroborated by the data collected overthree thermal cycles on the sample cut parallel to the pressingdirection. As shown in Fig. 5c, a systematic change in theelectrical resistivity ratio r300K/r5K is observed during cycles.The 2 K hysteresis observed during the rst cycle remains nearlyunchanged during the following cycles (Fig. 5d).
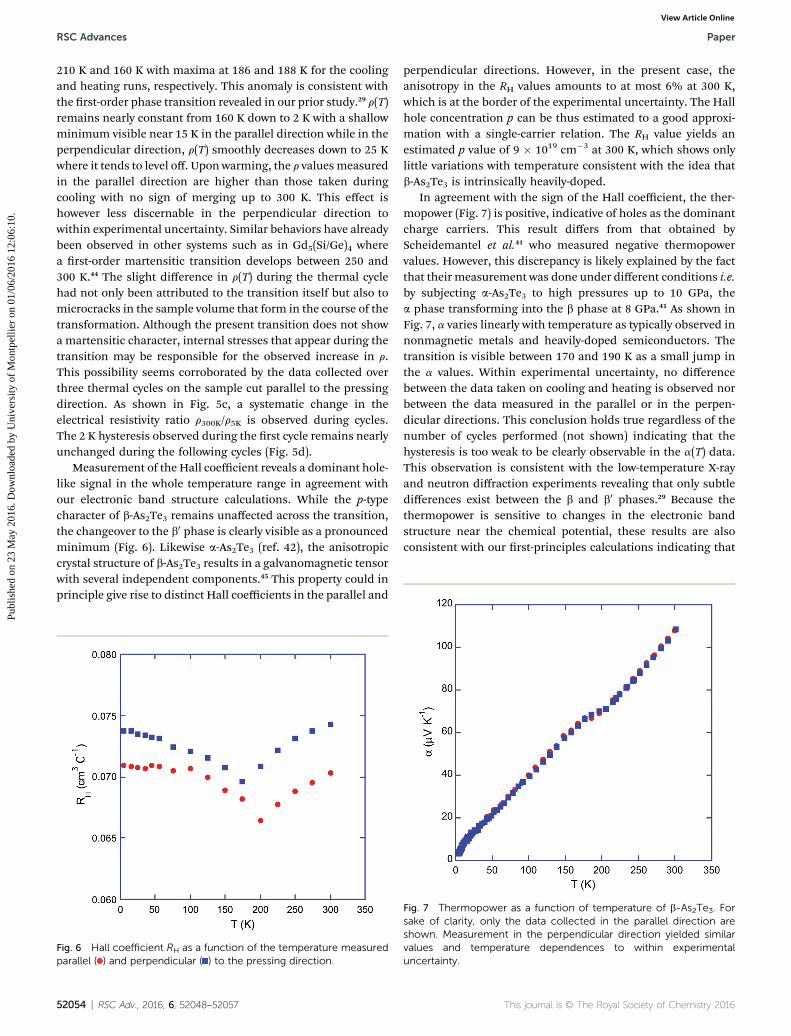
Measurement of the Hall coefficient reveals a dominant hole-like signal in the whole temperature range in agreement withour electronic band structure calculations. While the p-typecharacter of b-As2Te3 remains unaffected across the transition,the changeover to the b0 phase is clearly visible as a pronouncedminimum (Fig. 6). Likewise a-As2Te3 (ref. 42), the anisotropiccrystal structure of b-As2Te3 results in a galvanomagnetic tensorwith several independent components.45 This property could inprinciple give rise to distinct Hall coefficients in the parallel and
Fig. 6 Hall coefficient RH as a function of the temperature measuredparallel ( ) and perpendicular ( ) to the pressing direction.
52054 | RSC Adv., 2016, 6, 52048–52057
perpendicular directions. However, in the present case, theanisotropy in the RH values amounts to at most 6% at 300 K,which is at the border of the experimental uncertainty. The Hallhole concentration p can be thus estimated to a good approxi-mation with a single-carrier relation. The RH value yields anestimated p value of 9 � 1019 cm�3 at 300 K, which shows onlylittle variations with temperature consistent with the idea thatb-As2Te3 is intrinsically heavily-doped.
In agreement with the sign of the Hall coefficient, the ther-mopower (Fig. 7) is positive, indicative of holes as the dominantcharge carriers. This result differs from that obtained byScheidemantel et al.41 who measured negative thermopowervalues. However, this discrepancy is likely explained by the factthat their measurement was done under different conditions i.e.by subjecting a-As2Te3 to high pressures up to 10 GPa, thea phase transforming into the b phase at 8 GPa.41 As shown inFig. 7, a varies linearly with temperature as typically observed innonmagnetic metals and heavily-doped semiconductors. Thetransition is visible between 170 and 190 K as a small jump inthe a values. Within experimental uncertainty, no differencebetween the data taken on cooling and heating is observed norbetween the data measured in the parallel or in the perpen-dicular directions. This conclusion holds true regardless of thenumber of cycles performed (not shown) indicating that thehysteresis is too weak to be clearly observable in the a(T) data.This observation is consistent with the low-temperature X-rayand neutron diffraction experiments revealing that only subtledifferences exist between the b and b0 phases.29 Because thethermopower is sensitive to changes in the electronic bandstructure near the chemical potential, these results are alsoconsistent with our rst-principles calculations indicating that
Fig. 7 Thermopower as a function of temperature of b-As2Te3. Forsake of clarity, only the data collected in the parallel direction areshown. Measurement in the perpendicular direction yielded similarvalues and temperature dependences to within experimentaluncertainty.
This journal is © The Royal Society of Chemistry 2016
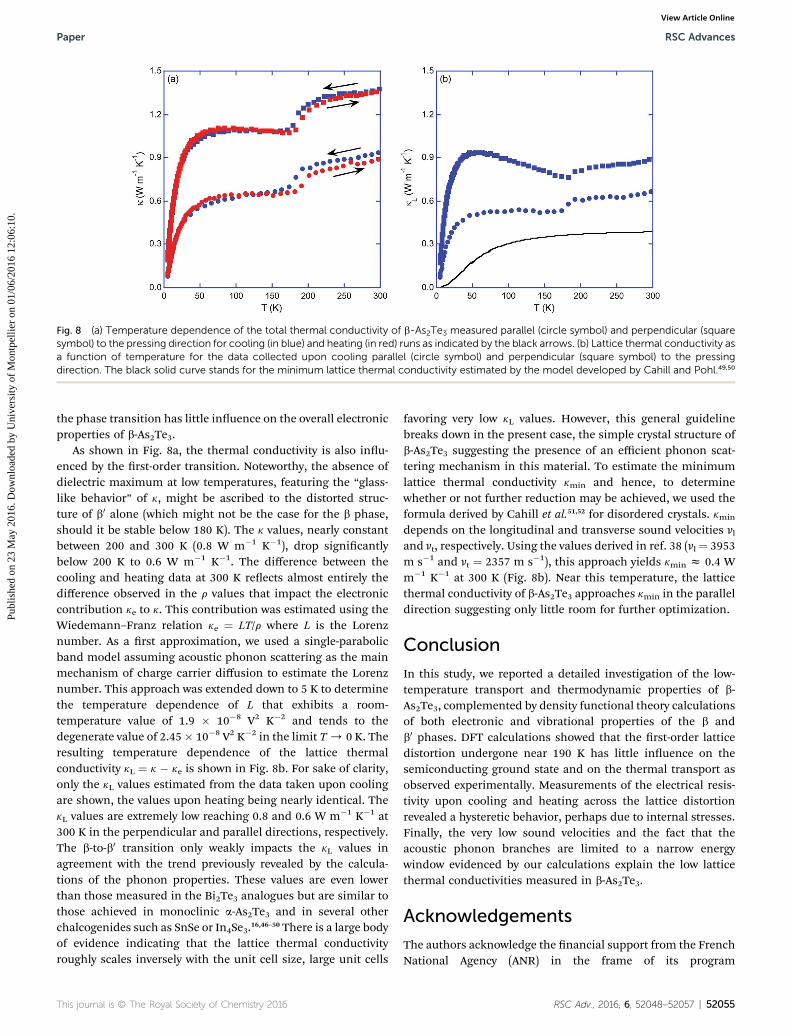
Fig. 8 (a) Temperature dependence of the total thermal conductivity of b-As2Te3 measured parallel (circle symbol) and perpendicular (squaresymbol) to the pressing direction for cooling (in blue) and heating (in red) runs as indicated by the black arrows. (b) Lattice thermal conductivity asa function of temperature for the data collected upon cooling parallel (circle symbol) and perpendicular (square symbol) to the pressingdirection. The black solid curve stands for the minimum lattice thermal conductivity estimated by the model developed by Cahill and Pohl.49,50
Paper RSC Advances
Publ
ishe
d on
23
May
201
6. D
ownl
oade
d by
Uni
vers
ity o
f M
ontp
ellie
r on
01/
06/2
016
12:0
6:10
. View Article Online
the phase transition has little inuence on the overall electronicproperties of b-As2Te3.
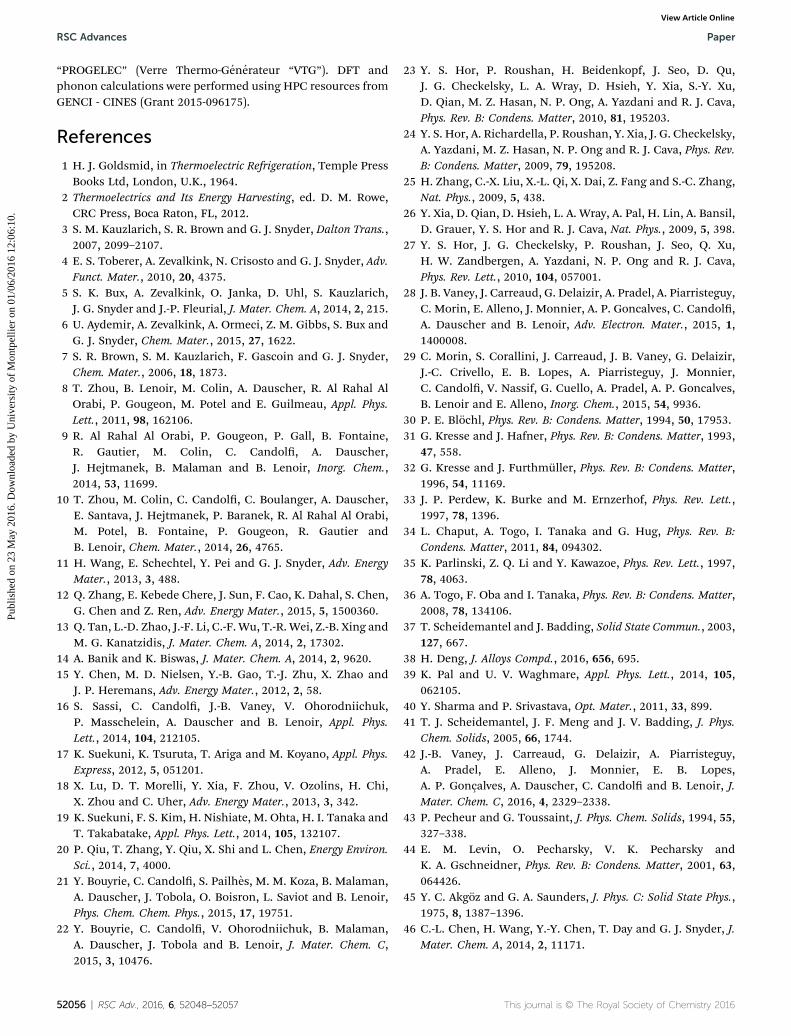
As shown in Fig. 8a, the thermal conductivity is also inu-enced by the rst-order transition. Noteworthy, the absence ofdielectric maximum at low temperatures, featuring the “glass-like behavior” of k, might be ascribed to the distorted struc-ture of b0 alone (which might not be the case for the b phase,should it be stable below 180 K). The k values, nearly constantbetween 200 and 300 K (0.8 W m�1 K�1), drop signicantlybelow 200 K to 0.6 W m�1 K�1. The difference between thecooling and heating data at 300 K reects almost entirely thedifference observed in the r values that impact the electroniccontribution ke to k. This contribution was estimated using theWiedemann–Franz relation ke ¼ LT/r where L is the Lorenznumber. As a rst approximation, we used a single-parabolicband model assuming acoustic phonon scattering as the mainmechanism of charge carrier diffusion to estimate the Lorenznumber. This approach was extended down to 5 K to determinethe temperature dependence of L that exhibits a room-temperature value of 1.9 � 10�8 V2 K�2 and tends to thedegenerate value of 2.45� 10�8 V2 K�2 in the limit T/ 0 K. Theresulting temperature dependence of the lattice thermalconductivity kL ¼ k � ke is shown in Fig. 8b. For sake of clarity,only the kL values estimated from the data taken upon coolingare shown, the values upon heating being nearly identical. ThekL values are extremely low reaching 0.8 and 0.6 W m�1 K�1 at300 K in the perpendicular and parallel directions, respectively.The b-to-b0 transition only weakly impacts the kL values inagreement with the trend previously revealed by the calcula-tions of the phonon properties. These values are even lowerthan those measured in the Bi2Te3 analogues but are similar tothose achieved in monoclinic a-As2Te3 and in several otherchalcogenides such as SnSe or In4Se3.16,46–50 There is a large bodyof evidence indicating that the lattice thermal conductivityroughly scales inversely with the unit cell size, large unit cells
This journal is © The Royal Society of Chemistry 2016
favoring very low kL values. However, this general guidelinebreaks down in the present case, the simple crystal structure ofb-As2Te3 suggesting the presence of an efficient phonon scat-tering mechanism in this material. To estimate the minimumlattice thermal conductivity kmin and hence, to determinewhether or not further reduction may be achieved, we used theformula derived by Cahill et al.51,52 for disordered crystals. kmin
depends on the longitudinal and transverse sound velocities vland vt, respectively. Using the values derived in ref. 38 (vl¼ 3953m s�1 and vt ¼ 2357 m s�1), this approach yields kmin z 0.4 Wm�1 K�1 at 300 K (Fig. 8b). Near this temperature, the latticethermal conductivity of b-As2Te3 approaches kmin in the paralleldirection suggesting only little room for further optimization.
Conclusion
In this study, we reported a detailed investigation of the low-temperature transport and thermodynamic properties of b-As2Te3, complemented by density functional theory calculationsof both electronic and vibrational properties of the b andb0 phases. DFT calculations showed that the rst-order latticedistortion undergone near 190 K has little inuence on thesemiconducting ground state and on the thermal transport asobserved experimentally. Measurements of the electrical resis-tivity upon cooling and heating across the lattice distortionrevealed a hysteretic behavior, perhaps due to internal stresses.Finally, the very low sound velocities and the fact that theacoustic phonon branches are limited to a narrow energywindow evidenced by our calculations explain the low latticethermal conductivities measured in b-As2Te3.
Acknowledgements
The authors acknowledge the nancial support from the FrenchNational Agency (ANR) in the frame of its program
RSC Adv., 2016, 6, 52048–52057 | 52055
RSC Advances Paper
Publ
ishe
d on
23
May
201
6. D
ownl
oade
d by
Uni
vers
ity o
f M
ontp
ellie
r on
01/
06/2
016
12:0
6:10
. View Article Online
“PROGELEC” (Verre Thermo-Generateur “VTG”). DFT andphonon calculations were performed using HPC resources fromGENCI - CINES (Grant 2015-096175).
References
1 H. J. Goldsmid, in Thermoelectric Refrigeration, Temple PressBooks Ltd, London, U.K., 1964.
2 Thermoelectrics and Its Energy Harvesting, ed. D. M. Rowe,CRC Press, Boca Raton, FL, 2012.
3 S. M. Kauzlarich, S. R. Brown and G. J. Snyder, Dalton Trans.,2007, 2099–2107.
4 E. S. Toberer, A. Zevalkink, N. Crisosto and G. J. Snyder, Adv.Funct. Mater., 2010, 20, 4375.
5 S. K. Bux, A. Zevalkink, O. Janka, D. Uhl, S. Kauzlarich,J. G. Snyder and J.-P. Fleurial, J. Mater. Chem. A, 2014, 2, 215.
6 U. Aydemir, A. Zevalkink, A. Ormeci, Z. M. Gibbs, S. Bux andG. J. Snyder, Chem. Mater., 2015, 27, 1622.
7 S. R. Brown, S. M. Kauzlarich, F. Gascoin and G. J. Snyder,Chem. Mater., 2006, 18, 1873.
8 T. Zhou, B. Lenoir, M. Colin, A. Dauscher, R. Al Rahal AlOrabi, P. Gougeon, M. Potel and E. Guilmeau, Appl. Phys.Lett., 2011, 98, 162106.
9 R. Al Rahal Al Orabi, P. Gougeon, P. Gall, B. Fontaine,R. Gautier, M. Colin, C. Candol, A. Dauscher,J. Hejtmanek, B. Malaman and B. Lenoir, Inorg. Chem.,2014, 53, 11699.
10 T. Zhou, M. Colin, C. Candol, C. Boulanger, A. Dauscher,E. Santava, J. Hejtmanek, P. Baranek, R. Al Rahal Al Orabi,M. Potel, B. Fontaine, P. Gougeon, R. Gautier andB. Lenoir, Chem. Mater., 2014, 26, 4765.
11 H. Wang, E. Schechtel, Y. Pei and G. J. Snyder, Adv. EnergyMater., 2013, 3, 488.
12 Q. Zhang, E. Kebede Chere, J. Sun, F. Cao, K. Dahal, S. Chen,G. Chen and Z. Ren, Adv. Energy Mater., 2015, 5, 1500360.
13 Q. Tan, L.-D. Zhao, J.-F. Li, C.-F. Wu, T.-R. Wei, Z.-B. Xing andM. G. Kanatzidis, J. Mater. Chem. A, 2014, 2, 17302.
14 A. Banik and K. Biswas, J. Mater. Chem. A, 2014, 2, 9620.15 Y. Chen, M. D. Nielsen, Y.-B. Gao, T.-J. Zhu, X. Zhao and
J. P. Heremans, Adv. Energy Mater., 2012, 2, 58.16 S. Sassi, C. Candol, J.-B. Vaney, V. Ohorodniichuk,
P. Masschelein, A. Dauscher and B. Lenoir, Appl. Phys.Lett., 2014, 104, 212105.
17 K. Suekuni, K. Tsuruta, T. Ariga and M. Koyano, Appl. Phys.Express, 2012, 5, 051201.
18 X. Lu, D. T. Morelli, Y. Xia, F. Zhou, V. Ozolins, H. Chi,X. Zhou and C. Uher, Adv. Energy Mater., 2013, 3, 342.
19 K. Suekuni, F. S. Kim, H. Nishiate, M. Ohta, H. I. Tanaka andT. Takabatake, Appl. Phys. Lett., 2014, 105, 132107.
20 P. Qiu, T. Zhang, Y. Qiu, X. Shi and L. Chen, Energy Environ.Sci., 2014, 7, 4000.
21 Y. Bouyrie, C. Candol, S. Pailhes, M. M. Koza, B. Malaman,A. Dauscher, J. Tobola, O. Boisron, L. Saviot and B. Lenoir,Phys. Chem. Chem. Phys., 2015, 17, 19751.
22 Y. Bouyrie, C. Candol, V. Ohorodniichuk, B. Malaman,A. Dauscher, J. Tobola and B. Lenoir, J. Mater. Chem. C,2015, 3, 10476.
52056 | RSC Adv., 2016, 6, 52048–52057
23 Y. S. Hor, P. Roushan, H. Beidenkopf, J. Seo, D. Qu,J. G. Checkelsky, L. A. Wray, D. Hsieh, Y. Xia, S.-Y. Xu,D. Qian, M. Z. Hasan, N. P. Ong, A. Yazdani and R. J. Cava,Phys. Rev. B: Condens. Matter, 2010, 81, 195203.
24 Y. S. Hor, A. Richardella, P. Roushan, Y. Xia, J. G. Checkelsky,A. Yazdani, M. Z. Hasan, N. P. Ong and R. J. Cava, Phys. Rev.B: Condens. Matter, 2009, 79, 195208.
25 H. Zhang, C.-X. Liu, X.-L. Qi, X. Dai, Z. Fang and S.-C. Zhang,Nat. Phys., 2009, 5, 438.
26 Y. Xia, D. Qian, D. Hsieh, L. A. Wray, A. Pal, H. Lin, A. Bansil,D. Grauer, Y. S. Hor and R. J. Cava, Nat. Phys., 2009, 5, 398.
27 Y. S. Hor, J. G. Checkelsky, P. Roushan, J. Seo, Q. Xu,H. W. Zandbergen, A. Yazdani, N. P. Ong and R. J. Cava,Phys. Rev. Lett., 2010, 104, 057001.
28 J. B. Vaney, J. Carreaud, G. Delaizir, A. Pradel, A. Piarristeguy,C. Morin, E. Alleno, J. Monnier, A. P. Goncalves, C. Candol,A. Dauscher and B. Lenoir, Adv. Electron. Mater., 2015, 1,1400008.
29 C. Morin, S. Corallini, J. Carreaud, J. B. Vaney, G. Delaizir,J.-C. Crivello, E. B. Lopes, A. Piarristeguy, J. Monnier,C. Candol, V. Nassif, G. Cuello, A. Pradel, A. P. Goncalves,B. Lenoir and E. Alleno, Inorg. Chem., 2015, 54, 9936.
30 P. E. Blochl, Phys. Rev. B: Condens. Matter, 1994, 50, 17953.31 G. Kresse and J. Hafner, Phys. Rev. B: Condens. Matter, 1993,
47, 558.32 G. Kresse and J. Furthmuller, Phys. Rev. B: Condens. Matter,
1996, 54, 11169.33 J. P. Perdew, K. Burke and M. Ernzerhof, Phys. Rev. Lett.,
1997, 78, 1396.34 L. Chaput, A. Togo, I. Tanaka and G. Hug, Phys. Rev. B:
Condens. Matter, 2011, 84, 094302.35 K. Parlinski, Z. Q. Li and Y. Kawazoe, Phys. Rev. Lett., 1997,
78, 4063.36 A. Togo, F. Oba and I. Tanaka, Phys. Rev. B: Condens. Matter,
2008, 78, 134106.37 T. Scheidemantel and J. Badding, Solid State Commun., 2003,
127, 667.38 H. Deng, J. Alloys Compd., 2016, 656, 695.39 K. Pal and U. V. Waghmare, Appl. Phys. Lett., 2014, 105,
062105.40 Y. Sharma and P. Srivastava, Opt. Mater., 2011, 33, 899.41 T. J. Scheidemantel, J. F. Meng and J. V. Badding, J. Phys.
Chem. Solids, 2005, 66, 1744.42 J.-B. Vaney, J. Carreaud, G. Delaizir, A. Piarristeguy,
A. Pradel, E. Alleno, J. Monnier, E. B. Lopes,A. P. Gonçalves, A. Dauscher, C. Candol and B. Lenoir, J.Mater. Chem. C, 2016, 4, 2329–2338.
43 P. Pecheur and G. Toussaint, J. Phys. Chem. Solids, 1994, 55,327–338.
44 E. M. Levin, O. Pecharsky, V. K. Pecharsky andK. A. Gschneidner, Phys. Rev. B: Condens. Matter, 2001, 63,064426.
45 Y. C. Akgoz and G. A. Saunders, J. Phys. C: Solid State Phys.,1975, 8, 1387–1396.
46 C.-L. Chen, H. Wang, Y.-Y. Chen, T. Day and G. J. Snyder, J.Mater. Chem. A, 2014, 2, 11171.
This journal is © The Royal Society of Chemistry 2016
Paper RSC Advances
Publ
ishe
d on
23
May
201
6. D
ownl
oade
d by
Uni
vers
ity o
f M
ontp
ellie
r on
01/
06/2
016
12:0
6:10
. View Article Online
47 Q. Zhang, E. Kedebe Chere, J. Sun, F. Cao, K. Dahal, S. Chen,G. Chen and Z. Ren, Adv. Energy Mater., 2015, 5, 1500360.
48 J.-S. Rhyee, K. H. Lee, S. M. Lee, E. Cho, S. Kim, E. Lee,Y. S. Kwon, J. H. Shim and G. Kotliar, Nature, 2009, 459, 965.
49 J. H. Kim, M. J. Kim, S. Oh, J.-S. Rhyee, S.-D. Park and D. Ahn,Dalton Trans., 2015, 44, 3185.
This journal is © The Royal Society of Chemistry 2016
50 Z.-S. Lin, L. Chen, L.-M. Wang, J.-T. Zhao and L.-M. Wu, Adv.Energy Mater., 2013, 25, 4800.
51 D. G. Cahill, S. K. Watson and R. O. Pohl, Phys. Rev. B:Condens. Matter, 1992, 46, 6131.
52 D. G. Cahill and R. O. Pohl, Annu. Rev. Phys. Chem., 1988, 39,93.
RSC Adv., 2016, 6, 52048–52057 | 52057
![Electronic and transport properties of kinked graphene · outstanding electronic transport properties of graphene [1]. However, it is crucial to modify the semimetallic electronic](https://img.pdfslide.us/doc/110x75/5fd887529019ff628275f4c6/electronic-and-transport-properties-of-kinked-graphene-outstanding-electronic-transport.jpg)