Embed Size (px)
Citation preview
JO URNAL OF RESEARCH of the Na tional Bureau of Standa rds-C. Engineering and Instrumenta tion Vol. 65C, No. I , January- March 1961
Electronic Scanning Microscope for a Spectrographic Plate Comparator
M. L. Kuder
(October 6, 1960)
A. scan nin g n~ ~croden s i tomete r has b een co nst ru cted fo r t he pUI-pOSC of a nalyz in g specL ro-graphI c p lates. [he lLl st rurn ellt facJlitates read ing Lhe daLa a nd in crcnscci l he speed a nd a ccuracy o ,'er other m et hods.
A small section of the pla te is sca nn ed a t on e t ime and co n ' "erLed Lo a magni fi ed .\"- Y p lot of de n ~ i t., " ' "ersus \\" a velength disp layed on the scrce n of a c:L Lhod e ray oscill oscope. T he d isplay includ es an elect ron ical ly produced fid ucial line \\"hich is ufi ed as a refe rcll ce poin L fo r mC:1SlIl"cments of l.in c p os iLion . An a lt er nate t y pe of d isplay may be u ~cd which includes Lhe supe rpoSit io n of Lhe mirro r image Lrace on Lhe origin al Imce . T his is p rcfnr cd in some cases for scttin g on 1IllSYlil metr ica ll ines.
R esolutio n to bette r lilan 0.00 J milli mete r on t he pi<lte is consistently ob lain ccl , a nd t ir e fidu cia l line rema in s stable to this preci sio n fo r ~e vc ral 110lirS. !:' rov ision is mad e fo r obse n ' i ll g up to fi ve ad jacent sp ect rograms 011 a sin gle p late.
1. Introduction
,Vavelength m easuremenLs or speeLml lill es m ay be m ade by accurately eompa,r in g th e rcla Live posiLions of the images r ecorded on a specLrogmph pla,te. rr Lhe lines ar e sharp a nd dis tinct Lhey lllay b e scaled by a n operator using a visual microscope h aving a suita ble arran gem ent of cross hairs a.nd a calibrated lead screw for adva ncing Lhe spec Lrograph pla,te. However , if . the lines ar c fain t , unsymm etrical or superimposed on other lin es, visuttl r eadin g is cI ifficul t.
Greater accuracy a nd cO llveni ence is obLain ed by the use of a scantlin g microscope used as a mi crodensi tometer to conver t the image densiti es in to analog values, these being presented as a display 0 11 a ca thode ray oscillograph. Tile use of such <t clispLty of density versus wavelength in analyzing spectrog raph pla tes is no t new.l However, an elec tronic sct1l1n in g microscope (figs . 1 and 2) has been devised ,,·h ich incorporates cer tain r efinements in the principles of opera tion of a device of this type. The insLrument shown was engineered to rapidly scan spectr al lines (on a plate) and convert thelll into a magnified X - Y coordin a te plot , which is displayed Oil a cathode r ay scr een. Tbis device produces a.n unusually stable and s llarply defined display of th e X - Y plo t of cl e nsities versus wavelength .
An elecLronically ge nera ted fiducial index has been in LegmLed in to the sytem in such a way th a. t unusu al stabili Ly has r esulted in r espect to the waveleng th posiLion which i t indicates. This fiducial index appears on the cathode rf\,y screen display superimposed upo n the X- Y plo t o r Lhe spectral pattern . The
1 A pho toelectric set t in g device fo r a spect rum plate comparator, by l' . S. Tom pkins and 1\1 . l' red , J . Opt. Soc. 41 , p. &11 (Se pt. 1951) .
57:j() 60- 6 1--1 1
in Legrated ge neraLion of a fidu ci<ll index mnkes it possible to m a nipula Le any of the Ilorm al con trois of the oscilloscope wiLh out enge nderin g a llY relative mo Lion beLwee n Lh e fid ucial index and t he X - Y plo t.
The overall sLa biliLy of t il e display toge Lher wi th t he r eht Live sLa biliLy of LiJ e fidu ci,1.1 index lin e is sufftcien t to in sure . wavelength posi t ion r eadings wiLhin a ll accuracy of 0.001 mm or bet ter wh en in terpolaLin g these \vavelength p osiLions from spectral lin es o f a parallel track on t he sam e plate . In order to ob t<tin absoluLe m easureme nLs of wa velength it is custom ary to r ecord tbe spectrum of a stand ard source on an a.djacen t Lrn ek on Lhe S,lme spec trograph pla te. This makes i t more con ve nien t a nd more accura te to obtain a m eas urement or the r elative positions of unknown spectral lines Jor acc un1te in terpolation of their absolute waveleng th .
The photographic density of the spectral lin es as recorded on the pla te m ay be read directly from the oscilloscope since d- c a.mplification oJ Lb e sC<l.l1 ll ed signal is employed throughout . The determin a ti on of ordinate deflection versus density cttlibratioll of the oscilloscope is not difficult, sin ce Lhe instrum en t yields the same deflections for sLa tic densitoll1eLer r eadings . Thus, with or wi thou t scannin g, a stand ard densi ty step wedge may b e inser Lecl in place of the spectrograph pla te when calibra tin g LIte ordinate deflection rcpresentin g densities. Th e instrum en t as presen tly designed yields a linear rcl a tion sllip between ligh t in tensities and ordin ate deflections. This will ordinarily m ak e i t difficult to r ead pho tographic densities much above 2.2 with any degree of accuracy. For clensiLies below 2.2 i t is possible to obtain density r eadin gs with an accuracy of approxim a tely 5 percen t .
ELEC TRON I C
AM PL IFIER, OSCILLATOR, AND TIMIN G CIRCUITS
o 0 0 0
OSCI L LOSCOPE
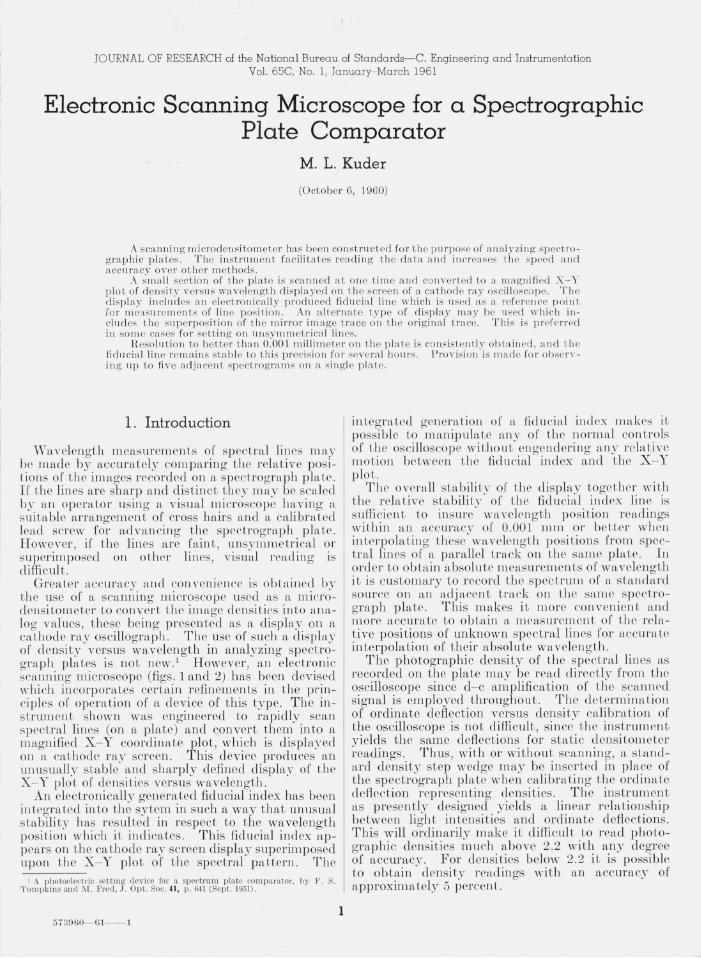
FlGliRE 1. Optical system,
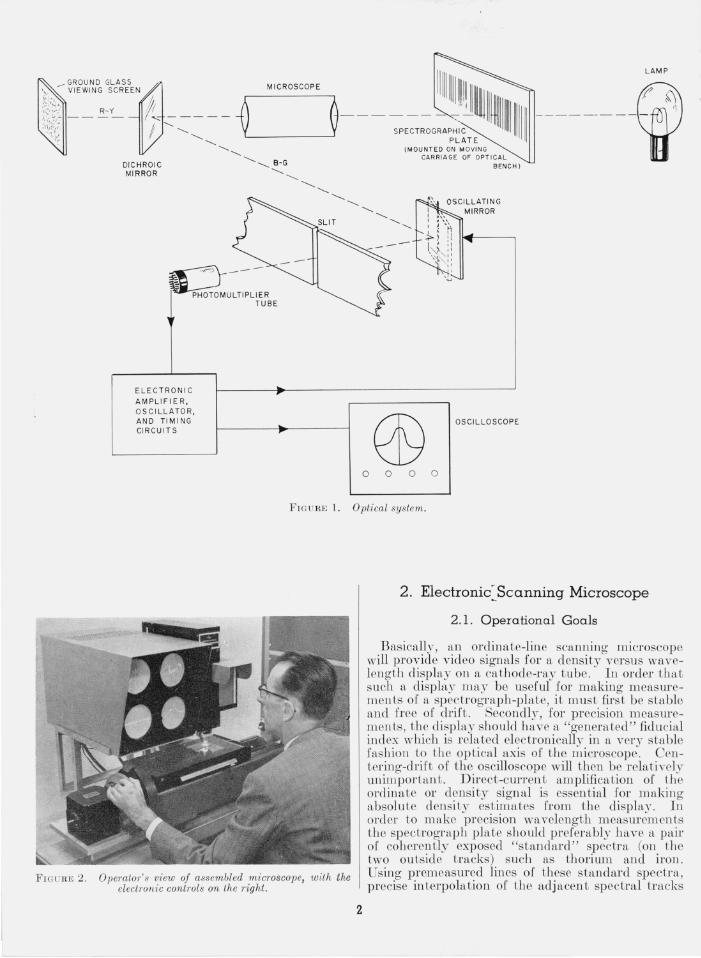
FlGLJRE 2 . Operator's view of assembled microscope, with the electronic controls on the right.
2
2 , Electronic~ Sc nnning Microscope
2.1 . Operational Goals
Basicall)~ , an ordinate-line scanning microscope will provide video signals for a density versus wavelength display on a cathode-ray tube . In order that such a display may be useful for making measurements of a spectrograph-plate, it must first be stable and free of drift. Secondly, [or precision measurements , the display should h ave a "generated" fiducial index which is related electronically in a very stable fashion to the optical axis of the microscope. Oentering-drift of the oscilloscope will then be rela tively unimpor tant. Direct-current amplification of the ordinate or density signal is essential for making absolute density estimates [rom the display. In order to make precision wavelength measurements the spectrograph plate should preferably have a pair of coherently exposed "standard" spectra (Oll the two outside tracks) such as thorium and iron. Using premeasured lin es of these standard spectra, precise interpolation of the adjacent spectral tracks
mIL)' be accomplisbed . In this procedure the eleetroI optical fiducial-index is used in con junction with the
micrometer lead screw for making precise settings on elected lines of the parallel spectral tracks. In ter
polation be tween the unknown and the s tandard is t hen accomplished by calculations from the m icrome Ler lead-scr ew readings used to advance the spectrogrllph plate under th e microscope. If the oscilloscope d isplays a highly m agnified un age (of the plate) w hi ch is very stable aneL free of noise, i t is possible to resolve the settings mor e acuLely, more rapid ly, and with less eye str ain than is possible with the conven tional optical microscope.
2.2. O ptical Scanner
The optical scanning portion of the in s tr umellt (figs. 1 a nd 2) consists of a special low-power microscope with amagnifica tion o[ approxim ately 10 diam etNS . Immediately bebind the objective lens a dichroic mirror is inserted which splits t he image beam in to essentially equal p arts or the visible spectrum. The red-yellow portion of tb e spectrum is delivered v ia benL optics to a viewin g ground glass sereen . Th e blue-green portion of th e microscope beam is r eflected from a vibrating mirror which is p art of an electr omechanical-optical tmnsducer . Th ence the oscilh,tin g beam impin ges upon ,t sliL of approximately 0.125 mm width a nd 13 cm length . Behind this sli t five end-on photomultipliers a re moun ted, each of whieh receives t he ligh t from tite lin es of adj acent spectra on t he same spectrograph plate.
Amin i" t ure DuMon t 5355, end-on p hotom ultiplier was selected for this application because its sm all size peI"lni ts close stackin g b ehin g the common sli t a nd also because t he 5365 yields a beLter signal to noise ratio than some other older Lypes that were tried. Also the "dark noise" is probably red uce d by k eepin g t he unilluminatecl portion of Lhe photoC<l thode to a minimum . Th e ideal photocathode mig ht be one which was only a little wiel er than the sli t ap er ture in fron t of it. Individual separation adjustm ent of the pbotomultiplier t ubes is provided along t he sli t aperture to com pensate for differences in ep aration of the parallel spectr al tracks.
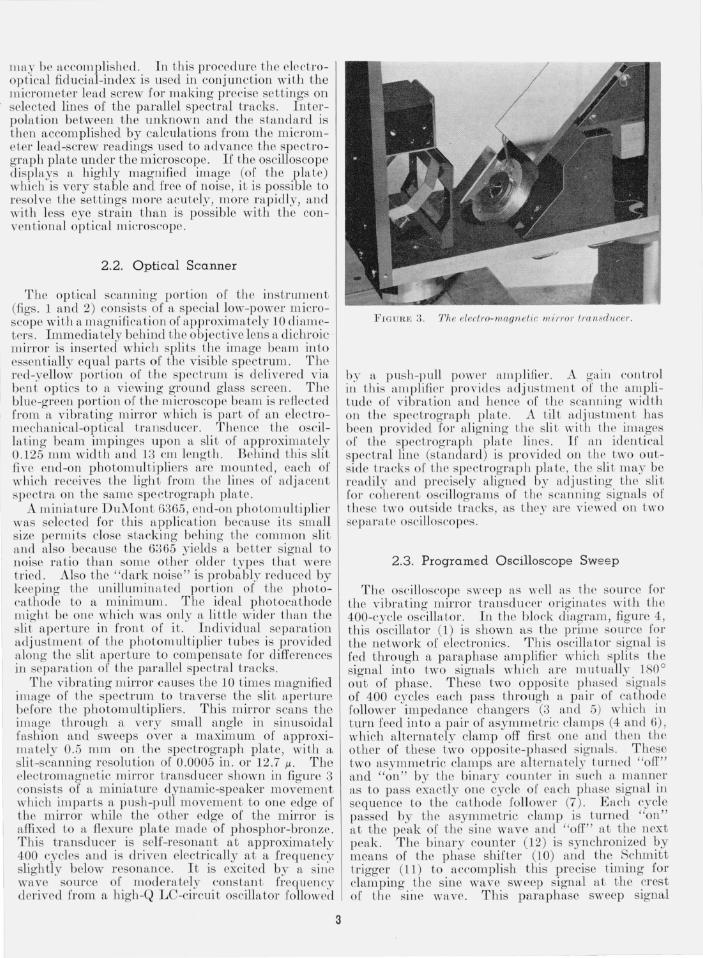
The vibrating mirror causes the 10 tUll es magnified inh,ge of the spectrum to traverse the sli t aperture bc[ore the photomultipliers. This mirror scans the imflge through a very sm all angle in sinusoidal fa sbion a nd sweep s over a maXlln ml1 of approximately 0 .5 mm on the spectrograph plate, with a slit-scannin g resolu tion of 0.0005 in. or 12.7}J.. Th e electromagnetic minor transducer shown in figure 3 consists of a m iniatme dynamic-speaker movement which impm-Ls a push-pull movemen t to one edge of the mu-ror w hile the other edge of the m irror is affixed to a flexure plate made of phosphor-bronze. This transdu cer is seH-re onant at approximately 400 cycles and is driven electrically at a frequency sligh tly b elovr r esonan ce. It is excited by a sine wave source of moderfltely cons tant frequ ency de rived from a high-Q L C-circui t oscillator fo llowed
3
FrG UH E 3 . Th e elect1"o-magn el i r; IILirror transduce?".
by It p us h-pull pOWN lunphfi el". A gllin co ntrol in t hi s a mplifier provides adjus tme ll t of t li e amplitude or vibratio n a lld hence of the scannin g width on the spectr ograph plate . A LilL adjus tmellt has been p rovid ed for aligning Lhe sli t wit h tl H' images of th e p ectrograph . ph, te Jin es. If an identical spectr al line (s L,tndard) is provid ed on the two outside Lmcks o f the spec trograp h pla te, Lhe sli t m ay be re,tdily a nd pr ecisely alig ned b y adj us ting t he sli t [or co her en t oscillograms of t he scann ing s ignals of Lhese two outside tracks, ,lS t hey are viewed on two sep,ull te oscilloscopes.
2.3. Programed Oscilloscope Sweep
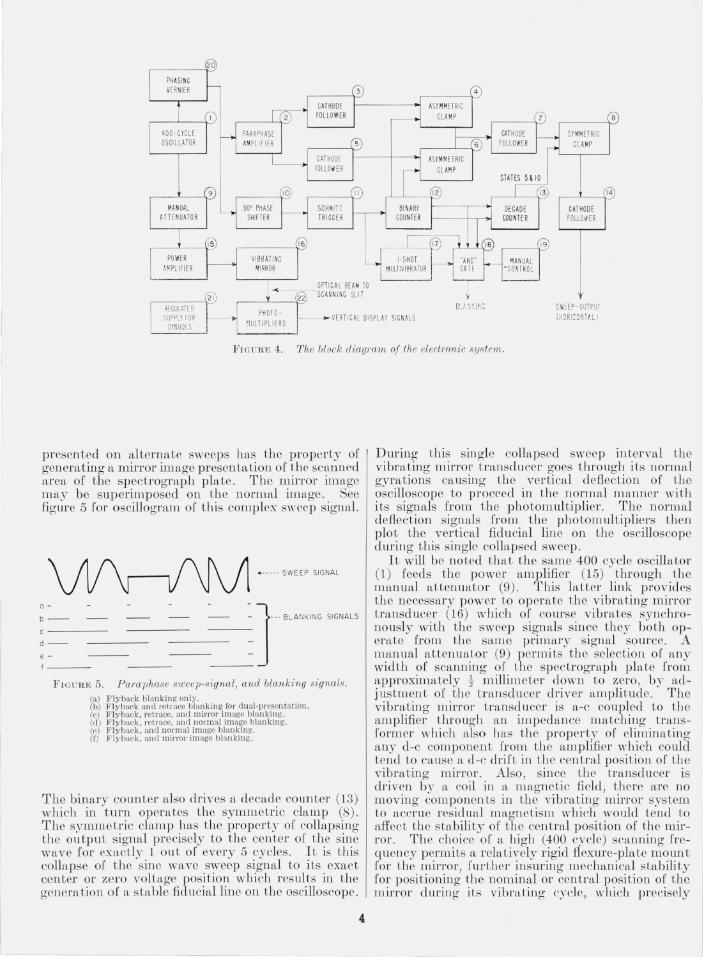
Th e oscilloscope sweep a,s well ,lS til e sou rce [or the vibrating mirror transdu ce r origillates with the 400-cycle oscillator. In the block diagram , figure 4 , t his oscillator (1) is shown as the prime source for the network of electronics. T his oscillator signal is fed through a paraph ase amplifier which spliLs Lhe signal into two signals which ar e mutually 1800
out of phase . These two opposite phased signals of 400 cycles each pass through a pail' of cathode follower impedan ee ch anger s (3 and 5) which in turn feed into a p au· of asymmetric clamps (4 and 6) , which al ternately clamp off first one a nd the n the other of t hese two opposite-phased sigmtls. T hese two asymmetric clamps are a lterntltely LUriled "off" and " on" by the binar y CO Lll1.ter in such a m anner as to pass exactly one cycle o[ each pb ase ignal in sequence Lo t he caLhode followe r (7). E ach cycle passed by the asymmetric clmnp is turn ed "on" flt the peak or t be sine wave and "off" at the next peak. The b inary counter (12) is syn chronized by means of t he phase shifter (10) and th e Schmitt trigger (11) to accomplish t his precise timing for clamping the sine wave sweep signal at the crest o[ t he sii,e Wflve. This paraph ase sweep signal
FIGURB 4. The block diagram of lhe electronic system .
presented on alternate sweeps has the property of generating a mirror image presentation of the scanned area of the spectrograph pla te. The mirror image may be superimposed on the normal image. See figw-e 5 for oscillogram of this complex sweep signal.
. ----- SWEE P SIGNAL
0 - ; 1 "''''"' ""'" ----
b --
d--
e -
FlGURlc 5. Pam phase sweep-signal, and blankil1g signals. (a) Fly back blanking on Iy. (b) Fly back and retrace blanking for dnal-presentation. (c) Flyback, retrace, ancl mirror image blanking. (d ) Fly back , retrace, and normal image blankin g. (e) Fly back, and normal image blanking. (f) Fly back, and mirror im age blanking.
The binary counter also drives a decade counter (13) which in turn operates th e symmetric clamp (8) . The symmetric clamp has the property of collapsing the outpu t s ign al precisely to the center of the sine wave for exactly lout of every 5 cycles. It is this collapse of t he sine wave sweep signal to its exact center or zero voltage position which results in the generation of a stable fiducial line on the oscilloscope .
4
Dw-ing this single colhtpsed sweep interval the vibrating mirror transducer goes through its nornml gyrations causing the vertical deflection of the oscilloscope to proceed in the normal manner with its signals from t he photomultiplier. The normal deflection signals from the photomultipliers then plot the vertical fiducial line on the oscilloscope during this single collapsed sweep.
It will be noted that the same 400 cycle oscillator (1) feeds the power ttmplifier (15) t hrough the manual attenuator (9). This latter link provides the necessary power to operate the vibrating mirror transducer (16) which of course vibrates synchronously with t he sweep signals since they both operate from the same primary signal source. A manual attenuator (9) permits the selection of any width of scanning of the spectrograph plate from. approximately t millimeter down to zero , by adjustment of the transducer driver amplitude. The vibrating mirror transducer is a-c coupled to the amplifier through an impedance matching trans- I
former which also has the proper ty of eliminating any d-c component from the amplifier which could tend to cause a d -c drift in the cen tral position of the vibrating mirror. Also, since the transducer is driven by a coil in a magnetic field , there are no moving components in the vibrating mirror system to accrue residual magnetism which would tend to affect thc stability of the cen tral position of the mirror . The choice of a high (400 cyele) scanning frequency permits a relaLively rigid flexure-pla te mount for the mirror, further insming mechanici1.1 stability for positioning the nominal or ccntml position of the mirror during its vibrating cycle, which precisely
----_ .... -------------
corresponds to Lhe static position of the m irror when the lml1sducer is at rest. The sYlnmetric clamp (8) titUS plots a stable fiducial line r epresen ting the rest position 01 the vibrating mirror. Since the symmeLric clamp (8) is a high-impedance circuit which i ensitive to loading it is followed by the cathode-101l0wer (14) to prevent any disturbance of this 'h1ll1ping circuit .
2.4. Selective Blanking
With t he 400 cycle oscillator so urce (1), coming t hrough (2), (3), (4), (7), (8), a nd (14) used directly for the oscilloscope sweep , a single pattern is traced during one-half of t he cycle going from a peak to a trough of t he 400 cycle so urce, while anoth er (b ackwHrd) retrace of the same pattern results from the other half of t he 400 cycle signal w hich cor responds to t be returning traverse of t he m irror to its starting poin t. This retracing o f the pa,ttern durin g the last haIf cycle of tbe sine wave corresponding to t he ret urn sweep of the miTrOl" is useful 1'01' checkin g pllftse s hir t in the system but is generally undersira ble for m easurement observations, sin ce it tends to broad en t he trace and reduce [\'cuity . Any change in sep ar at ion of the retrace pattern with respect to the norillal trace is a sensitive indica,tion of relrttive pha,se shift beLween the motion of t he vibrating mirror alld the oscilloscope electrical sweep. Any such p h ~1.se s hi rt can be m a nu ally nulled (eolllpens(tted) r endering Lhe retrace coinciden t with t he nomin al tn1.ce by ad justment of the phas ing vernier (20).
During the 1I ormal "readin g" opemtio n o( t he in sLrurncn t it is usually desirable to el im in ate t he r etr£1.Ce pattern . This is accomplished by the one-sho t m ul tivibrator (17) providing a bla,nk:ing s ignal to the oscilloscope during one-llalf of the sine wave sweep. TJl e result is a steady-state "single" sweep 01' uoilateral display of the densiLy VCl'SUS wavelength in t he scanned zo ne. However, (\, du al 01' bilateml display of the same X-Y plot m a:v b e prese nted in s uperimposed fas hion , while maintainin g blanking of the retraces. The use of the parap hase s inusoidal sweep makes such a dual display possible wi t il coh eren t uperimposition. Subsequently when the spectrograph plate micr ometer screw is moved, the mirror image presentation moves in the opposite direction with respect to t he normal presen tation . This provides another convenient mode o r matching selected components of the pattern as they merge togeth er at the center of the sweep . This metbod of matching the "mirror" image with the "normal" image is particularly useful when trying to "set" on an unsymmetrical line. With this method it is possible to estimate an equal energy (spectral) distribution on either side of the fidu cial line with mu ch betLer visual discretion than with a single presentat ion .
Control signals takell directly from the binary counter (12) are used to operate the "AND " gate (18) tbl'ough manual selection provided by (19), permi tting the opemtor to select either th e norm al or t be mirror image presentation or bo th . An ON-
5
OFF control for t he one-shot mul tivibJ'ator (17) permits the operator Lo selecL or reject the retmce pattern for both of the Lwo pfU'aphflse sweeps. Whenever the one-sho t m ulLivibrator (17) is in th e OFF position permi tting viewing of Lhe reLrace it is not turned completely off bu t rather i r eLurned to a minimum t ime interval (see fig . 5a) which is just sufficient to blank the fiyback which occurs during t he transition between the alternate sweeps.
2.5. Typical Spectrum Patterns
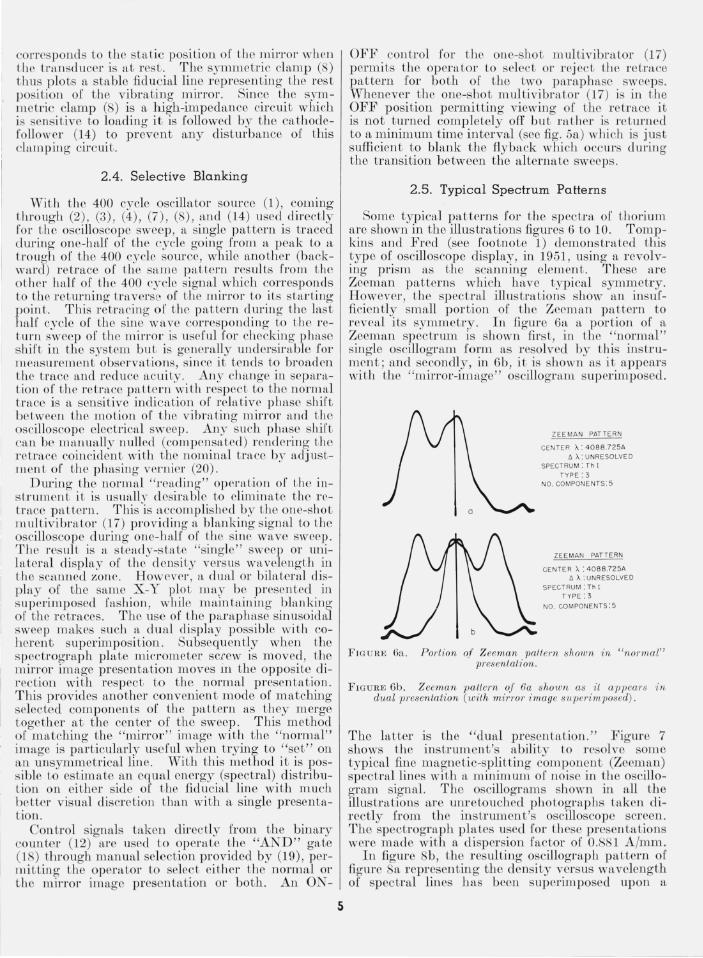
Some typical patterns for the spectr a of thorium are shown in the illustrations figures 6 to 10 . TompI;;:ins and Fred (see footnote 1) demonstrated this type of oscilloscope display, in 1951 , using a revolving prism as t he scannin g clement. These are Zeeman patterns which h ave typical symmetry . . However, the spectral illustrations show an insu(ficiently small portion of the Zeeman pattern to reveal i ts symm etr y. In figure 6a a portion of a Zeem an spectr um is shown fn'st, in th e "normal" single oscillogmm form as resolvcd by this instrument ; a nd secondly, in 6b, it is shown as i t appears wi th the "mirror-image" oscillogram superimposed.
ZEE MAN PATTERN
CE NT ER ~:4088~25A ~ ~: UNRESOLVED
SPECTRUM: Th [ TYPE:3
NO. COMPONENTS :5
ZEEMAN PATTERN
CE NTER ~ : 4 08B.725A ~ ~ :UNRESOLVED
SPECTRUM: Th l TYPE:3
NO. COMPONENTS: 5
FlGu m,; 6a. Portion of Zeeman pattern ~hown in " normal" presentation.
FIGU RE 6b. Zeeman pattern of 6a shown as i t appears in dual presentation (with mirror ima ge s11perimposed).
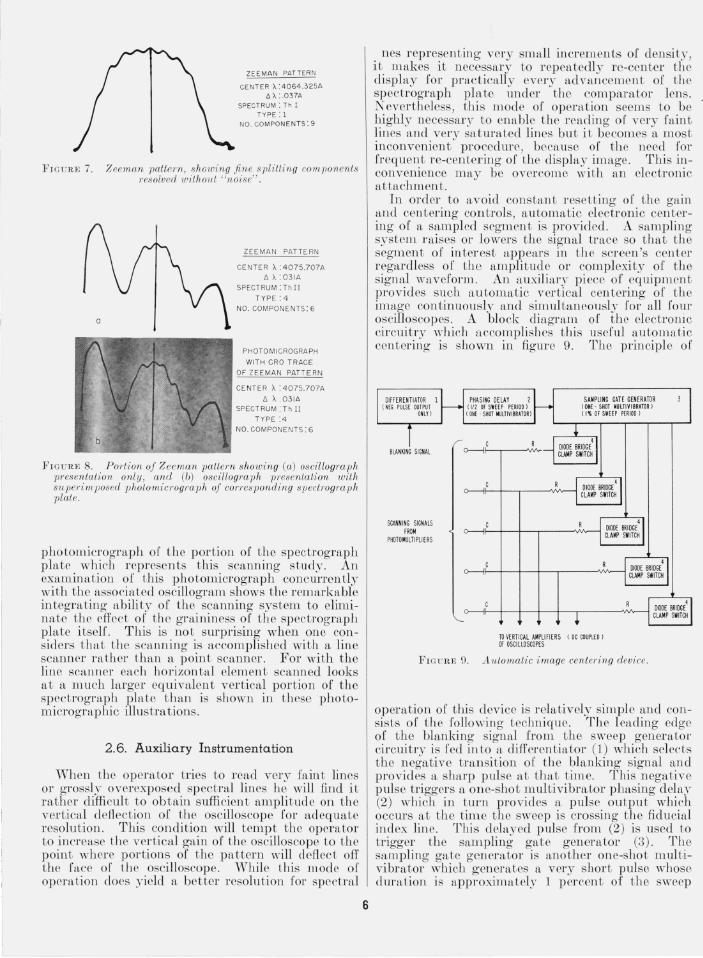
The latter is the " dual presentation." Figure 7 shows the instrumen t's ability to resolve some typical fine magnetic-splitting componen t (Zeeman) spectral lines with a minimmn of noise in t he oscillogram signal. The oscillograms shown in all the illustrations are unretouched photographs taken directly :from th e instrml1ent's oscilloscope screen. The spectrograph plates used for thcse prcsentations were made with a d ispersion factor of 0.881 A/mm.
In figme 8b, the resul tin g oscillograph pattern of figure 8a representing the density versus wavelength of spectral lines bas b een superimposed upon a
ZEEMAN PATTERN
CENTER A :4064.325A ~A:.037A
SPECTRUM: Th I TYPE.l
NO. CO MPONENT5: 9
FIGUR E 7. Z eeman pattern, showing fine splitting components l'esolved with out "noise" .
ZEEMAN PATTERN
CENTER A: 4075.707A {', A :03IA
SPECTRUM : Th 1I
TYP E '4
NO.COMPONENTS :6
PHOTOMICROGRAPH
WITH CRO TRACE
OF ZEEMAN PATTERN
CE NTER A: 4075.707A
{', A .03IA SPECTRUM : Th II
TYPE :4
NO. COMPONENTS: 6
FIGURE 8. Pm·tion of Zeeman pattern showing (a) oscillograph presentation only, and (b) osc'il/ogra ph presentation with SU1Jerim posed photomicrograph of correspondin g spectrogra ph plate.
photomicrograph of t he portion of the spectrograph plate which represents this scanning study. An examina tion of this photomicrograph concurrently with the assoc iated oscillogram shows the remarkable integrating ability of the scanning system to eliminate the effect of the graininess of the spectrograph platc itself . This is not surprising when one considers that the scanning is accomplished with a line scanner ra ther than a poin t scanner. For with the line scan !leI' each Jl orizon tal element scanned looks at a mu ch larger equivalen t ver tical portion of the spectrograph plate t han is shown in these photomicrograph ic illustrations.
2.6. Auxiliary Instrumentation
When the operator tries to read very faint lines or grossly overexposed spectral lines he will find it rather difficul t to obtain sufficient amplitude on t he ver tical deAection of the oscilloscope for adequate resolution . This condition will tempt the operator to increase the vertical gain of the oscilloscope to the point where portions of the pattern will deflect off the race of the oscilloscope . 'While t his mode of openLtion does y ield a better resolution 1'01' spectral
6
nes representing very small increments of density, it m akes it necessary to repeatedly re-center the display for pn.ctically every advancement of the spectrograph plate under the comparator lens. Nevertheless, this mode of operation seems to be highly necessary to enable t lte read ing of very fain t lines and very saturated lines bu t it becomes a most inco nvenient procedure, because of the need for frequent re-centering of the display image. This inconvenience may be overCOlue with an electronic attachment.
In order to avoid constan t resetting of the gain and centering controls, automatic electronic cen tering of a sampled segment is provided. A sampling system r aises or lowers the signal trace so that the segmen t of interest appears in the screen 's center regardless of t he amplitude or complexi ty of the signal waveform. An auxiliar~T piece of equipment provides such a u tomatic verti cal cen tering of the image cO ll t inuously and simul taneously for all four oscillosco pes. A block diagram of t be electronic circuitry which accomplishes this useful au tomatic centering is shown in figure 9. The prin ciple of
SCAJlNING SIGNA LS fRO~
PII{)TOMULTIPLI ERS
SAMPLING Gm GENERATOR 10HI - SHOT 'ULlIVIBRATORI 11% Of SWEEP PER IOD I
· ~I~C~ __ +--. ____ ~~
TOVERIiCAL AMPLIF IE RS E OC COUPLED I OF OSCILLOSCOPES
FIG1.:HE 9. A lltomatic image centering device .
operatioll of this device is relativel.'T simple and consists of the followin g techniqu e. The leading edge of the blanking signal from the sweep gener ator circuitry is fed illtO a diffel'en tiator (1) which selects t he negative tran sition of the blanking signal and provides a sharp pulse at that time. This negative pulse triggers a one-shot multivibrator phasing del a." (2) which in turn provides a pulse output whi ch occurs at the tiJne the sweep is crossing the fiducial index line. Tbi s delayed pulse from (2) is used to trigger the sam.pling gate generator (3). The sampling gate gener ator is another one-sho t ll1ultivibrator which generates a very short pulse whose duration is approximately 1 percen t of the sweep
period 01' sweep length. This sampling gate pulse operates a multiplicity of . diode-bridge. clamp" switches (4). The diode-bridge clamp-sIVltches In
Lurn provide for momentary grounding of t he d-e reLurn end of the a- c coupling resistor (R ) only during Lhe time of the sampling gfLte. The five a- c couplings shown are conveying the output. of the fi ITe p hotomul tiplier signals to t h e d- e amplIfier s of Lite correspon ding oscilloscopes. Grounding the d- c r eL urn r esistance of these a- c couplings only when Lhe sweep is crossing the fiducial line causes that part of Lhe display image to always come to grou nd potential. This makes it possible to initially set the verti cal centering of the oscilloscope so that the beam is verLically centered for a zero voltage or grounded inp ut. The resultant displays obtain ed with th is attachment under t hese conditions will alwnys produce a trace wh ich crosses t he fiducial lin e at the cen ter of the ORO Lube, regardless of the mag llL t ucle or position or Lhe balance of Lhe d ispla:\r. The diodehr ido'e clamp cffectivcl.I' provides a d- c )"e Lurn for the ~-c couplin g at on1.,- one point ill a rej)eLit i~e p~lttern or an asymmetr ic signal. Smce the SIg nal IS repetitive, t ll e grounding [or a brief in sLant eL t t he s,une repetitive phase t ime will resul t in t lte generaLion of a bias on the load end or the a- c couplmg co ndenser. After a time of about 5RC/d (d deno tes dut? cycle) a steady s tate bi,Ls vol tage is es ta,blishecl 0 11 t he 10,Ld end of t bo coupling co ndell se l', a ll d the pulse e lJLTe n ~ ~ Iuu "~" faUs Lo zer o. Thus on s ~lbseque ll t r epetItlOn s 01 the Lrace, t he ve r tical s l ~n al p ,) sses t hru a zero vol tage pom L as 1 L crosses L h e ftd ueia.1 Li ne during tJ le g '1.te-pulse in Le rvrtl. The Linw required for r eaching a steady-s taL.e display. after aclvfLne ing the sp ec trogn1.ph plate IS cOll velllently made abo ut 0.2 sec.
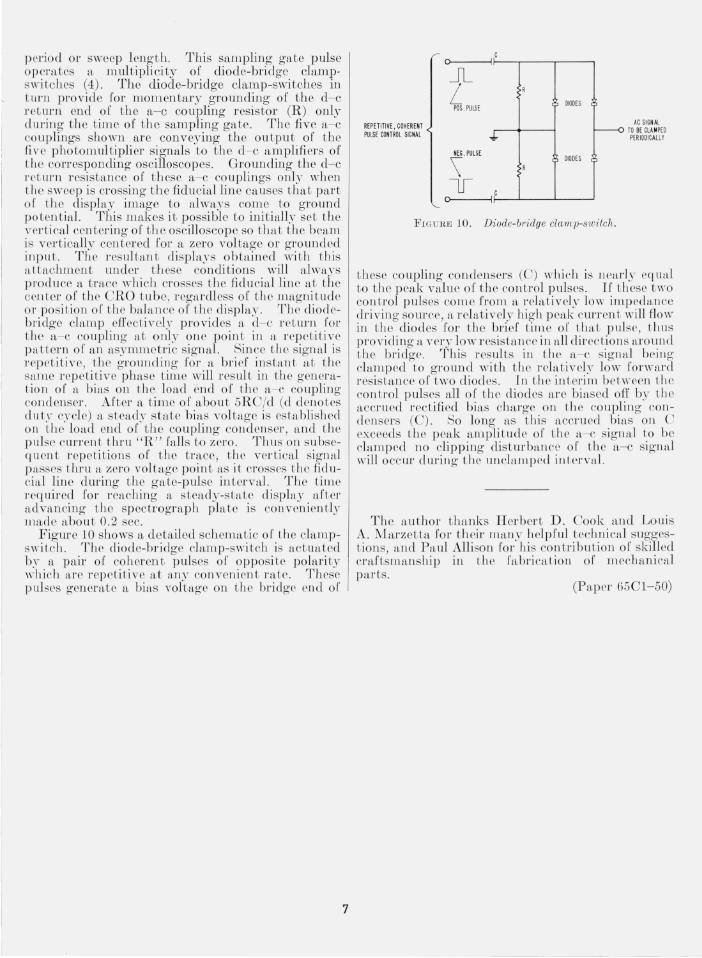
F io'me 10 shows a detailed sch emaLi c of [lI e clamps wit(~k The diode-bridge clamp-switch is actuated bv a pail' of coh erent pulses of opposi te polarity \vlIi ch are r epeLitive at n,ny convenienL n~te. Thes~ pulses gen erate a bia s voltage 011 t he bridge end 01
7
REPETITIVE, COHER ENT PULSE CDNTROL SIGNAL
o
JL L
POS .PULSE
NEG. PULSE
'\ U
o
I
.J,.
IC
R
~OOES
DIODES R
f----<l AC SIGNAL
TO BE CLAMPEO PERIODICALLY
F IGURE 10, Diode-bridge clamp-switch.
these coupling co ndensers (C) which is ])e.,uly eq ual to Lhe peak v,tlue of the control p ulses. II t hese t \\"O control pulses co me from "rPlativcl,\r low impedance dri vi no' source, a l'elaLively b ig h peak curren L will flow in Lheb diod es Jor t he brief Lime or thaL pulse, t hus pro vicling a ve ry low r es is Lance in ,,11 directioll s ,l.roullcl Lhe bridge. Tl,is re~ulLs ill LII e . a- c s l g n H~ belli g clamp ed to g round W I t It t h e rclatIvcl~- 10\\" 10f\l"l trd resistance of Lwo diodes. III LIte inLerilll beLween tlI e cont rol pulses all of Lbe di odes ar e biased off by the aecrued recti fi ed b ias ch'1.rge on the couplIng COII
de nsel's (0). 80 long as this accrued bias 011 . C exceeds t he peak ampliLude of Llle a- e signal to be clamped no clipping clist urbHII C'e o r t lI e a- c sig ll ~1.l will occur du rill g th e uncl:unped in[erv,l l.
The ,wtllO r tha nks H el'berL D . Cook and Loui s A. MarzeLLa for the ir man:" help[ul teehnical suggestions Rnd Paul Allison [or his contribution of skilled craft~manship in t he fabr ication o[ mechanical par ts.
(P aper 6501-50)