Embed Size (px)
Citation preview

Electronic Report to the Board
Mid-year 2015 Corporate KPI Results & 2016 Targets GF/B34/ER03
For Board Decision
PURPOSE: This report presents two items: (i) the additional information on the Corporate Key Performance Indicators (“KPIs”)
requested by the Board during its 34th Meeting held in November 2015, for Board information, and (ii) the proposed 2016
performance targets for the 2014-2016 KPI Framework for 10 indicators, for Board decision.
1. GF/B34/EDP04: Approval of 2016 Targets for the 2014 – 2016 Corporate Key Performance Indicator Framework

GF/B34/ER03
Electronic Report to the Board Page 2
I. Decision Point
1. Based on the rationale described below, the following electronic decision point is recommended to
the Board:
II. Relevant Past Decisions
1. Pursuant to the Governance Plan for Impact as approved at the Thirty-Second Board Meeting,1 the following summary of relevant past decision points is submitted to contextualize the decision point proposed in Section I above.
Relevant past Decision Point Summary and Impact
GF/B33/DP07: Remaining Targets for the 2014-2016 Corporate Key Performance Indicator Framework2. March 2015
The Board noted the additional analysis required to finalize the performance targets for the updated Global Fund Corporate Key Performance Indicator Framework for 2014-2016, and accordingly the Board approved the updated 2015 performance targets for Key Performance Indicators 6, 12, and 16, presented in GF/B33/04B.
GF/B32/DP10: Approval of the Global Fund Corporate KPI
The Board approved the updated Global Fund KPI Framework for 2014-2016, acknowledging the methodological work required to finalize certain
1 GF/B32/DP05: Approval of the Governance Plan for Impact as set forth in document GF/B32/08 Revision 2. 2 http://theglobalfund.org/Knowledge/Decisions/GF/B33/DP07/
Decision Point: GF/B34/EDP04: Approval of 2016 Targets for the 2014 –
2016 Corporate Key Performance Indicator Framework
1. The Board:
a. Acknowledges the Secretariat’s presentation of the mid-2015
performance assessments for the 2014-2016 Corporate Key
Performance Indicator Framework, as set forth in GF/B34/08;
and
b. Notes the Secretariat’s response to requests by the Board at its November 2015 meeting for additional analysis on certain indicators, including proposed management actions to improve performance, as set forth in GF/B34/ER03 – Annex 1.
2. Accordingly, the Board:
a. Approves the 2016 performance targets presented in GF/B34/ER03 – Annex 1; noting the revisions to the 2016 performance targets for KPI 7 (Access to Funding) and KPI 10 (Value for Money); and
b. Directs the Secretariat to implement its proposed management actions, continue to identify lessons that can inform the next Corporate Key Performance Indicator Framework, and update the committees and the Board at their first meetings in 2016.
This decision does not have material budgetary implications.

GF/B34/ER03
Electronic Report to the Board Page 3
Relevant past Decision Point Summary and Impact
Framework 2014-20163. November 2014
indicators. The Board also approved the available performance targets for 2015, as well as the plan to present the remaining 2015 performance targets for approval at the 33rd Board Meeting, as set forth in document GF/B32/24.a – Revision 2.
GF/B30/DP7: The Global Fund Corporate Key Performance Indicator Framework for 2014-20164. November 2013
The Board approved the Global Fund KPI Framework for 2014-2016 as set forth in document GF/B31/7 – Revision 1. The Board asked for annual reports on these indicators, and where available, for interim results to be made available through the Financial Dashboard.
III. Action Required
2. Approval of the 2016 Key Performance Indicator targets will allow the Secretariat to continue
monitoring the performance of the Global Fund against the current 2014-2016 KPI Framework, and to
provide adequate oversight information to the Board and its Committees. Work is currently ongoing to
develop the new Key Performance Indicator framework aligned with the 2017-2022 Global Fund
Strategy. These proposals will be presented along with the Strategy to the Board for approval in April
2015.
IV. Background
3. The 2014-2016 Key Performance Indicator Framework was initially approved at the 30th Board
Meeting in November 2013. The Board then received updates on the 2014-2016 KPI Framework, as well
as proposed annual performance targets for 2015 which were approved by the Board at its 32nd and 33rd
Meetings in November 2014 and March 2015, respectively.
4. To facilitate the oversight work of the Board and its Committee, the Secretariat provides
performance reports on the Corporate KPIs twice per year. Performance targets for such KPIs for the
following fiscal year are reviewed by the Committees and then presented to the Board for approval once
per year.
Additional requested information by the Board on KPIs
5. At the 34th Board Meeting held in November 2015, the Secretariat presented mid-year results
for 2015 for information, along with proposed performance targets for 2016 for Board approval.
Background materials were shared ahead of the Board Meeting in November 2015 and are available to
all constituencies in the password protected platform called Board Effect as document GF/B34/08.
6. In that document, mid-year performance assessments for 2015 were made available for 13
indicators. Eight indicators illustrated strong performance, one indicator was performing below
expectation, and four indicators were presented as at risk of not meeting performance targets in 2015
or 2016.
7. As follow up to the Secretariat’s presentation on the 2015 performance assessments at the
November 2015 Board Meeting, during the discussion on KPIs Board Members requested additional
3 http://www.theglobalfund.org/Knowledge/Decisions/GF/B32/DP10/ 4 http://www.theglobalfund.org/Knowledge/Decisions/GF/B30/DP07/
GF/B34/ER03
Electronic Report to the Board Page 4
information on the indicators illustrating potential under performance. Specifically, additional
information was requested on the following indicators:
a) KPI 3: Strategic service delivery
b) KPI 5: Health Systems Strengthening
c) KPI 7: Access to Funding
d) KPI 10: Value for Money
e) KPI 11: Grant expense forecast
f) KPI 12: Human Rights protection
8. Annex 1 to this report provides the information and analysis requested by the Board on KPIs prior
to its approval of the 2016 targets. It also outlines 2016 performance targets for 10 indicators for Board
approval.
9. Recent analysis conducted by the Secretariat has led to revision of the performance targets for two
indicators, namely, KPI 4: Access to Funding, and KPI 10: Value for Money, from those presented at the
Board Meeting in November 2015.
V. Recommendation
10. The Board is requested to review and approve the proposed 2016 performance targets for 10 KPIs
as outlined in Annex 1 to this report.

34th Board Meeting
Mid-year 2015 Corporate KPI Results & 2016 Targets: Board request for
additional information
GF/B34/ER03 – Annex 1
18 December 2015

• Board request for additional information on six KPIs (page 3)
• Summary response (pages 4-23)
• 2016 performance targets & draft Electronic Decision Point (pages 24-26)
• Detailed response (pages 27-69)
Overview
2

Request from the Board for additional information
KPI Request Due Date
KPI 3 Strategic service
delivery
• Estimate size of the inconsistent attribution effect on projected results
• Analysis of projections and underperformance by country
• Reasons for underperformance and proposed actions
Dec 2015
KPI 5 Health Systems
Strengthening
• HSS portfolio overview and proposals for ‘tracking indicators’ to be used to reported
for the remaining period of the Strategy
Dec 2015
KPI 7 Access to Funding • Written version of explanation given during Q&A session Dec 2015
KPI 10 Value for Money • Additional data on savings by product and forecast
• Further explanation of reasons and impact of underperformance
Dec 2015
KPI 11 Grant expense
forecast
• Request for year to date reporting by quarter Dec 2015
KPI 12 Human Rights
protection
• Report on investments in key populations, gender and human rights activities
• Preliminary report will be submitted to the 17th SIIC Meeting
• Full report will be submitted to the 35th Board Meeting
• Note on plans for system development to allow real time investment tracking
Mar 2016
Apr 2016
Dec 2015
3

4
Summary

Response Summary
KPI 3
5
Further information requested by Board
Request
• Estimate size of the inconsistent attribution effect on projected results
• Analysis of projections and underperformance by country
• Reasons for underperformance and proposed actions
• Secretariat has updated and deepened analysis used for July 2015 projection
• Analysis has been undertaken in collaboration with targeted Country Teams, and projections are updated
where possible with finalized grant targets rather than Concept Note targets
• Updated projections for all service targets now exceed 90% of expectation
• Key role for ITP project and partners in supporting implementation to strengthen performance
• Reasons for under performance: overestimation of grant targets, inconsistent attribution of results, and
weak supply chains. Underreporting of PMTCT not found to be major issue in countries analyzed
• Proposed actions: strengthen oversight of target setting, categorization of indicators and guidance on
attribution; re-estimation of targets; and close monitoring and corrective action for performance concerns
Summary

6
Results for KPI 3 shared with Board based on data available in July 2015
3 service targets were projected to be less than 100% achieved
Summary

Grant targets
July projection was based on performance
frameworks available in July 2015. Included a
number of provisional grant targets (Targets are
finalized after GAC2). Targets validated by CTs
Secretariat has updated and deepened analysis used for July 2015
projection
1
Initial projection of results
Adjustment for national targets, from which
expected GF results were derived based on 2013
or 2014 GF share of national results (country
specific)
Adjustments were made based on historical
performance (average of performance on indicator
over 2012 to 2014, across all grants in country)
7
Notes: In July 2015 exercise, Performance Frameworks or latest version of all submitted CNs by end July 2015 (HIV: 41, HIV/TB: 37, TB: 37, Malaria: 60).
Forecast of performance has been adjusted by country-specific forecasts for countries contributing most to the ‘gap’ in each service.
For this deeper analysis, finalized grant
targets have been used where available.
Methodology used for first KPI projection
(mid-year 2015)Updates for this analysis
For a subset of countries, analysis has
been undertaken with Country Teams to
refine the initial performance adjustment
taking into account country contextual
factors
Corrective
actions
including
through ITP
project will
support key
countries in
implementation
Potentially,
further
refinement of
projection
methodology
3 Actions
Summary
2 23

Detailed methodology for December 2015 Projections
8
1. Calculation of projected performance based on average performance for grants containing service
indicator 2012-4
2. Ranking of countries by contribution to share of the target
3. Determination of key countries contributing to ‘gap’ in indicator performance
4. Analysis / discussions with country team to validate targets and / or refine performance
adjustments for key countries
5. Revised projections generated
Summary

Projections for 2015-6 all service targets exceed 90%
Lower bound:
Performance-adjusted
projection
Upper bound:
Grant targets
Strategy target
2012 to 2016
Legend
100%
150%
PMTCT
(2.4m, 92%)(2.6m, 99%)
KPI
Target
2.7m
KPI
Target
15.45m
(15.3m, 99%)(14.7m, 95%)
DOTS
KPI
Target
390m
(393m, 102%)(378m, 98%)
LLINs (SSA)
50%
Notes: projection based on average of performance on indicator over 2012 to 2014, across all grants including the service, adjusted by country specific forecasts for countries
contributing most to the ‘gap’ in each service. DOTS indicator includes results not available in GF systems in July 2015.
9
Key role for ITP project and partners in supporting implementation to strengthen performance
Summary

Analysis of performance on KPI 3
10
PMTCT
Contributing factors Further actions
DOTS
LLINs
• Overestimation of need in one high burden
country contributes to ‘gap’ to target
• Underreporting not found to be major issue in
countries analyzed
• Re-estimation of targets in certain countries
• Close monitoring and corrective action for
performance concerns, particularly through ITP
• National programs achieving targets
• Inconsistent attribution of results to Global
Fund
• Strengthen oversight of targets, categorization of
indicators and guidance on attribution
• Close monitoring of performance by country teams
for key countries
• Global Fund will move to a consistent contributive
model for the Strategy 2017 to 2021/22 period
• Ambitious targets set for continuous distribution
through ANC/EPI however, weak supply chains /
health systems result in performance gaps
• Investments being made in stronger and
innovative BCC to improve service uptake
• Close monitoring and corrective action for
performance concerns, particularly through
ITP
• Monitoring of potential delays and corrective
action where possible
92%
99%
95%
99%
98%
102%
Projection
Summary
Min
Max
Min
Max
Min Max

Implementation Through Partnership (ITP) project is key vehicle for
strengthening implementation
11
Objective: In collaboration with partners, to increase the effectiveness and efficiency of implementation in 20 countries
through shared ownership and mutual accountability
Expected Outcomes: Improved use of funds in key countries; implementation bottlenecks addressed with a diverse group
of partners through transparent, results oriented actions in country
Summary

12
ITP leverages resources and partnership collaboration with
processes/focus/outcomes to benefit beyond top 20 countries
• Countries and partners aligned to achieve aggressive targets across
disease programs and in strengthening systems for health
• Collective resources are used and used well – from absorption to scale
• Shared, prioritized programmatic bottlenecks are proactively addressed
through data use throughout the process (e.g. NSP development, GAC,
etc.) with increased accountability, coordination and a focus on quality
Summary

KPI 5
13
Further information requested by Board
Request
• HSS portfolio overview and proposals for ‘tracking indicators’ to be used for the remaining period of the Strategy
• Provide data on key HSS programmatic areas supported by the GF and proportionality to the whole of the HSS budget or expenditures
• Provide options for sampling in a spectrum of countries across the three diseases. Create a standard portfolio for performance
monitoring that could potentially be used in the ITP process
Response Summary
Portfolio review highlights:
• Current M&E investments make up ~5% of the portfolio
• RSSH investments increased to 40% under NFM – Cross-cutting interventions have doubled
Tracking going forward:
• First programmatic reports of NFM HSS grants are expected in 2016
• Potential list of tracking indicators has been developed
• Additionally at the end of the funding cycle, a segment of portfolio will be selected for in-depth evaluation using a
newly developed HSS evaluation tool, which has been designed to be used in conjunction with national disease
program reviews
Summary

HSS investments increased to 40% under NFMCross-cutting interventions have doubled under NFM
14
Cross-cutting
HSS interventions
Source: 104
GAC-2 approved
grants
Pre-NFM 38% of portfolio
Cost inputs
related to HSS
Source: 165
GAC-2 approved
grants
NFM 40% of portfolio
12%6%
32%
28%
Pre-NFM
HCW
13%
PSCM
22%
HMIS
51%
Breakdown of NFM
RSSH investments
Healthcare Financing
0.2%
Financial management
2%
Policy and Governance
2%
Service Delivery
9%
NFM
Legend
Summary

HSS measurement approach and reporting timelines
15
Illustrative list of HSS indicators that can be tracked
Health Management Information Systems/M&E % of HMIS or other routine reporting units submitting timely reports according to national guidelines
Procurement & Supply Chain Management% of health facilities reporting no stock outs of essential drugs
FinancingGovernment expenditure on health as percentage of general government expenditure
Health and Community WorkforceNumber of health workers per 10,000 population
HSS Indicators
• Impact and Outcome Indicators are measured in 3-5
year intervals. Output/Coverage indicators reported
annually or bi-annually.
• Secretariat intends to measure performance of HSS
output/coverage indicators, for priority health system
components.
• Implementation of most NFM grants started in 2015 -
the first programmatic reports are expected
throughout 2016.
• First measurement of HSS indicators will be done by
end of 2016. Additionally, at the end of the funding cycle, a sub-
set of countries will be selected based on agreed set
of criteria, where in-depth evaluation will be carried
out, by applying a newly developed HSS evaluation
tool, which has been designed to be used in
conjunction with national disease program reviews
+
Summary

16
HSS
Performance monitoring on HSS
Summary
2016 Reporting on HSS
Beyond KPI5, performance monitoring for HSS, will focus on:
• HSS investments
• HSS indicators
• HSS in-country evaluation
Information to be released as data become available
Future strategic directions
• The Global Fund’s strategic role in supporting
resilient & sustainable systems for health has
recently been set out (Supporting Countries to Build
Resilient and Sustainable Systems for Health: The
Role of the Global Fund)
• Considerable work is currently being conducted to
develop the RSSH indicators for the KPI framework
for the 2017-2022 Strategy
• Of the indicators proposed on the previous slide, only
the PSCM indicator is under consideration for
inclusion in the new KPI framework
• KPI proposals for the new strategy will be shared
with Board Constituencies in the coming weeks for
input, followed by Committee review in March, and
Board approval in April 2016

KPI 7
17
Further information requested by Board
Request
1. Summary of delays in stages as outlined verbally by Mark Edington
2. Summary of key countries with delays in access to funding and causes for delays with
proposed management actions
Response Summary
• There are wide extremes in time from submission to disbursement (9.9 months or 10.2 for key countries,
on average)
• Grant extensions and sufficient cash in-country have ensured this timeline has no program impact
• Submissions to date would need to lose ~3.5 months to reach an 8 month target, or 1.5 months to reach
10 months. However, proposed management actions estimate saving ~6 weeks from process
• Recommendation to revise proposed KPI7 target for 2016:
• From: 75% grants submitted in 2015/16 take 8 months or less from submission to first disbursement
• To: 75% grants submitted in 2015/16 take 10 months or less from submission to first disbursement
• Intention is to use 8 months as stretch target - but more time will be needed to achieve this
Summary

Overall status windows 1-4:• Average time of submission to disbursement is 9.9 months or 10.2 for key countries; wide
extremes in length of funding cycle
• Below analysis shows certain stages to focus on (no breakdown available for 10 month target)
18
Average for
all countries88 days 24 days40 days120 days 30 days
Submission to GAC1
Grant-making: GAC1 to GAC2
GAC2 to Board approval
Board approval to grant signing
Grant signing to disbursement
Key
Countries*96 days 24 days45 days117 days 31 days
90 days 90 days 30 days 21 days 7 days
8 month
expected
(applies to
2015 windows
only) Note: A country is classified as a key country if it falls in any one of the following categories: High Impact countries, ITP countries, top 20 countries by funding
(including allocation + incentive funding)
Summary

Implications of KPI7 Performance
No impact on programs: there are no anticipated or perceived disruptions or
gaps in interventions
• Country teams try to anticipate delays in grant-making by processing grant
extensions (with additional funding or not) to ensure no program disruption
• Where ADMFs were not processed immediately, there were sufficient cash
in-country and disbursements were not needed urgently
19
Summary

Recommendation
• Submissions to date would need to lose ~3.5 months to reach an 8 month
target, or 1.5 months to reach 10 months
• Proposed management actions estimate saving ~6 weeks from the process
Recommendation to revise KPI7 target for 2016
• Keep target of 10 months for 75% of submissions
• Use 8 months as stretch target - need more time to achieve this
20
Summary

KPI 10Further information requested by Board
21
Request
1. Additional data on savings by product and forecast
2. Further explanation of reasons and impact of underperformance
Response Summary
Summary
• H1 2015 performance on KPI 10 is driven by timing of tenders and specific orders, as well as slightly lower demand
than expected for ARVs
• Based on new information since the H1 results were reported in July:
• full year performance for 2015 is expected to improve to 7%, driven by lower raw material costs for LLINs
and faster-than-expected achievement of price targets for ARVs
• New information from the recent tender on future LLIN prices indicates 2016 savings may reach 7%
• Global Fund compares favorably to international reference prices (additional analysis in Annex 2)
• Recommendation to revise proposed KPI10 target for 2016:
• From: 4% reduced spend on equivalent commodities at equivalent quality and volume
• To: 7% reduced spend on equivalent commodities at equivalent quality and volume

KPI 11
22
Further information requested by Board
Request
Request for year to date reporting by quarter
Response Summary
Forecast year-end result will be presented with year-to-date result going forward
Q3 Update:
F3 2015 forecast grant expenses were approximately equal to 2015 budget
However, 83% of year-to-date budget was committed as grant expenses as of September
These shifts in grant expenses from original budget are resulting from delays in grant signing, as well as low
absorption levels
Summary

KPI 12
23
Further information requested by Board
Request
1. Report on investments in key populations, gender and human rights activities
a) Preliminary report to SIIC (March 2016)
b) Full report to the Board (April 2016)
2. Note on plans for system development to allow real time investment tracking
• The Secretariat is working to enhance capabilities for tracking investments in key populations, gender, and
human rights
• Under current funding model, grant budgets and performance frameworks include relevant information
organized under modules, interventions, cost groupings and inputs
• A framework approach is under development to organize the available data to enhance existing capabilities to
track the investments in the respective areas and enable regular routine reporting
• It is important to note that data provision on the impact of investments in these areas is still highly dependent on
the readiness of country and implementer level systems
• Further, a review of the existing modules and interventions related to human rights will be undertaken and
further enhancements to track progress in the human rights area will be pursued
Response Summary
Summary

24
2016 Targets for Approval

Corporate KPIs: 2016 Targets for approvalCorporate KPIs 2015 Q2 Performance 2016 Target
2 (g) Number of countries with
validated population size
estimates for key populations
37 countries to date have validated population size estimates for
Female Sex Workers, Men who have Sex with Men, and where
applicable, Injecting Drug Users
55 countries
4 Efficiency of Global Fund
investment decisions
0.56 (15% improvement) to date in alignment between investment
decisions and country "need“
0.52 (20% improvement over 2014-2016)
6 Alignment with national
reporting systems
94% investments in countries where Global Fund support is reported
on National Disease Strategy budgets to date
94% investments in countries where Global Fund support is
reported on National Disease Strategy budgets to date
7 Access to funding 54% NFM grants to date took 10 months or less from
submission to first disbursement
75% grants submitted in 2015-2016 take 10 months or less
from submission to first disbursement
9 Effective operational risk
management
1.9 Risk Rating based on grants updating QUART during calendar
year
Within range 1.7 to 2.1
10% of 2013 baseline (1.9)
10 Value for money 4% reduced spend on equivalent commodities at equivalent
quality and volume
7% reduced spend on equivalent commodities at equivalent
quality and volume
11 Grant expenses forecast 1.0 (F2 2015 Grant Expense / Grant Expense Corporate Budget) Within a range of 0.9 - 1.1
12 Human rights protection 30% human rights complaints resolved and identified through risk
assessment tools to date
Year on year improvement with a 100% aspiration
14 Domestic financing for AIDS,
TB & Malaria
93% of programs accessing funding are meeting minimum
counterpart financing thresholds
90% programs meeting minimum counterpart financing thresholds
15 Efficiency of grant
management operations
2.4% operating expenses as a percentage of grants under
management (using F2 reforecast)
Below a maximum of 2.75%
25

PROPOSED DRAFT ELECTRONIC DECISION POINT
GF/B34/EDP04: Approval of 2016 Targets for the 2014 – 2016 Corporate Key Performance Indicator Framework
1. The Board:a) Acknowledges the Secretariat’s presentation of the mid-2015 performance assessments for the 2014-2016 Corporate
Key Performance Indicator Framework, as set forth in GF/B34/08; andb) Notes the Secretariat’s response to requests by the Board at its November 2015 meeting for additional analysis on
certain indicators, including proposed management actions to improve performance, as set forth in GF/B34/ER03 -Annex 1.
2. Accordingly, the Board: a) Approves the 2016 performance targets presented in GF/B34/ER03 - Annex 1; noting the revisions to the 2016
performance targets for KPI7 (Access to funding) and KPI 10 (Value for money); andb) Directs the Secretariat to implement its proposed management actions, continue to identify lessons that can inform
the next Corporate Key Performance Indicator Framework, and update the committees and the Board at their first meetings in 2016.
This decision does not have material budgetary implications.
26

27
KPI by KPI: Additional Detail Requested

28
KPI 3

KPI 3 Service delivery HIVFurther information requested by Board
29
PMTCT
Provide details on 10 countries with lagging results and include:
o Percent of results from these 10 countries in relation to all PMTCT results
o Percent under-performance by country
o Reasons for under-performance including details of reporting and/or program
issues and proposed action for course correction. If reporting issues, course of
action is requested for improvement and change. If programmatic, is there a
broader trend of under-performance in the countries.
Include plans for improvement beyond the ITP work.

KPI 3 Service delivery TBFurther information requested by Board
30
TB treatment
Summary of the issues of attribution/contribution and/or programmatic performance as it relates to reporting on
TB cases treatment according to DOTS. Include:
o Attribution issue substantiated by data (provided by STOP TB). Provide date by which the attribution issue
will be concluded and the systematic way forward on data reporting across all GF supported countries.
o If programmatic performance issues, provide data from under-performing countries and provide description
of issues faced. Provide details of proposed management actions including technical.

KPI 3 Service delivery MalariaFurther information requested by Board
31
Board request
Provide details on 10 countries with lagging results and include:
o Percent of results from these 10 countries in relation to all LLIN results
o Percent under-performance by country
o Reasons for under-performance and if not related to delays (unplanned or
planned) for net procurement, details of program issues and proposed action for
course correction.

Way forward for
PMTCTIllustrative actions
through ITP
Section 1: PMTCT
32
Summary
Performance
analysis of Top 20
countries
1 2 3 4
PMTCT

PMTCT projected achievement ranges from 92%-99%
33
• 85% of projected 2015-16 shortfall in PMTCT services comes from 10
countries. Illustrative actions are listed from the ITP project to address
performance.
• To date no systematic evidence of underreporting due to uptake of
Option B+
• Concern that the target for one high burden country overestimates
need, making current target unrealistic.
• Secretariat is working with partners to improve the quality of data and
metrics. Improvements will be incorporated into the next update of
partner reporting guidance
PMTCT
100%
150%
PMTCT
KPI
Target
2.7m
(2.4m, 92%)(2.6m, 99%)
Notes: projection based on average of performance on indicator over 2012 to 2014, across all grants including the service, adjusted by country specific
forecasts for countries contributing most to the ‘gap’ in each service.
1

PMTCT performance for top 20 countries – comprising 98% of target
34
PMTCT target –
national (2015-2016),
thousands
Share of
PMTCT target (2015-6)
Rating on PMTCT Indicator
(2012-14)
Country a 255 15% C Unacceptable
Country b 213 13% B1 Adequate
Country c 179 11% B2 Inadequate
Country d 172 10% A2 Meeting expectations
Country e 146 9% A2 Meeting expectations
Country f 134 8% A2 Meeting expectations
Country g 134 8% A2 Meeting expectations
Country h 71 4% A2 Meeting expectations
Country i 63 4% B1 Adequate
Country j 59 4% B2 Inadequate
Country k 50 3% B1 Adequate
Country l 32 2% B1 Adequate
Country m 23 1% B1 Adequate
Country n 22 1% A2 Meeting expectations
Country o 21 1% B1 Adequate
Country p 19 1% A2 Meeting expectations
Country q 16 1% C Unacceptable
Country r 14 1% A2 Meeting expectations
Country s 10 1% B1 Adequate
Country t 8 1% B1 Adequate
PMTCT
Indicator
Rating
No. of
countries
Average
Achievement
(Result/Targe
t) (%)
A1Exceeding
expectations- >100%
A2Meeting
expectations8 90-100%
B1 Adequate 8 60-89%
B2
Inadequate but
potential
demonstrated
2 30-59%
C Unacceptable 2 <30%
2
Note: unweighted average performance of country on specific indicator during period 2012-4. Global Fund Grant Indicator rating bands applied to PMTCT indicator only. Percentages capped at 100%

35
PMTCT
Country Target Associated Actions to Address Bottlenecks with
Partners
42% scale-up of HIV testing from 372,139 in Dec
2016 to 530,196 by Dec 2017 (reaching 55%
coverage of all pregnant women) and ARV
coverage from 38% in Dec 2014 to 65% by Dec
2017
Develop detailed operational plan for PMTCT scale-up, including for
EID and transition to option B+. TA to be requested during partnership
December visit
Establish operational committee to follow ongoing implementation of
PMTCT scale-up
84,251 HIV positive pregnant women receive
ARVs to reduce risk of MTCT by 2017
Work with National Lab TWG, WHO CO, NACA, NASCP and USG
(PEPFAR/CDC/DOD) to improve the mapping and document public lab
network and referral system (to VCT, PMTCT and ART centers) to
improve early infant diagnosis
Reduce the number of new youth and adult
infections by 70% and the number of new
pediatric HIV infections by 95% by 2020
Operational Support for patient monitoring system, building on existing
system for PMTCT
3 Relevant Actions from ITPSamples from Accountability Framework

Findings and way forwardDrawing on analysis with Country Teams
36
Quality of
PMTCT need
estimates
Under-
reporting
PMTCT
• One high burden country accounts for 15% of the total PMTCT target – its national
target for PMTCT for 2015/2016 - 254,994
• Concerns that need may be overestimated in country, making targets impossible to
achieve
• Revision of estimated number of women eligible for PMTCT – resulting in potential
revision of targets
• Limited evidence to date of increased underreporting with the uptake of Option B+,
where HIV positive pregnant women are prescribed ART for life - several large
countries currently transitioning to B+ so monitoring important
4

Section 2: TB
37
Summary Attribution and
contribution
Performance
analysis of Top 20
countries
DOTS
1 2 3
Illustrative actions
through ITP
4
Way forward on
DOTS
5

National results expected to reach 22.6 million cases for 2014-6
Global Fund projected achievement ranges from 95%-99%
38
• Initial projections based on non-finalized performance
frameworks, have been updated with finalized grant
targets
• Comparing national targets with national achievement
in Global Fund-eligible countries, supported programs
are well on route to achieving anticipated targets
• Global Fund results are projected to reach 95% of
strategy target by end 2016, factoring in performance
• Performance on DOTS 2012-14 among Top 20
countries for DOTS treatment exceeds B1 levels
DOTS
100%
150%
DOTS
KPI
Target
15.45m
(15.3m, 99%)(14.7m, 95%)
100%
Notes: projection based on average of performance on indicator over 2012 to 2014, across all grants in country. Projection includes some results not
available in GF systems in July 2015.
1

National DOTS targets are being met and may be overachieved
39
DOTS
Note: Targets applied to Global Fund eligible countries only National level: people with TB placed on DOTS. Projections adjusted for performance.
13.77m
Target setting
4.46
4.47
4.84
4.18
4.67
2012
2013
2014
2015
2016
Projected
Projected National Results imply
overachievement of Global Fund share of targets
8.85m
Global Fund DOTS target set based on 68% share
of Global Plan targets for 2012-6
Global Target
22.63m22.57m
National
Results
National
Projections
Global Fund
target
15.45m
68% of
global
target
1

Inconsistency in attribution to Global Fund
2014
67%
2013
59%
2012
65% 64%
Strategy
Target
Share
2012-14
Average
68%
Share of national results attributed to Global Fund
varies from year to year
Global Fund Share of TB results, eligible countries
• Global Fund reporting cycle not aligned to all
countries – may result in corrective increases or
decreases for results to account for lagging results
• Country may change from reporting national results
to sub-national results or vice versa
• Indicators in performance frameworks (esp. pre
NFM) may not be clear, resulting in adjustments to
results once clarified
Factors contributing to fluctuation in Global Fund share
2
DOTS
40

Performance of Top 20 DOTS countries all at least B120 Countries accounting for ~90% of Global TB Targets
41
DOTS target --
national
(2015-2016), million
Share of
DOTS target (2015-
2016)
Rating on DOTS Indicator (2012-14)
Country a 2.7 27% A2 Meeting expectations
Country b 1.0 10% A2 Meeting expectations
Country c 0.7 7% A2 Meeting expectations
Country d 0.7 7% A2 Meeting expectations
Country e 0.5 6% B1 Adequate
Country f 0.4 4% B1 Adequate
Country g 0.4 4% A2 Meeting expectations
Country h 0.3 4% A2 Meeting expectations
Country i 0.3 3% B1 Adequate
Country j 0.3 3% B1 Adequate
Country k 0.2 2% A2 Meeting expectations
Country l 0.2 2% A2 Meeting expectations
Country m 0.2 2% B1 Adequate
Country n 0.1 1% A2 Meeting expectations
Country o 0.1 1% A2 Meeting expectations
Country p 0.1 1% A2 Meeting expectations
Country q 0.1 1% B1 Adequate
Country r 0.1 1% A2 Meeting expectations
Country s 0.1 1% B1 Adequate
Country t 0.1 1% B1 Adequate
DOTS
Note: unweighted average performance of country on specific indicator during period 2012-4. Global Fund Grant Indicator rating bands applied to DOTS indicator only. Percentages capped at 100%
Indicator
Rating
No. of
countries
Average
Achievement
(Result/Targ
et) (%)
A1Exceeding
expectations- >100%
A2 Meet expectations 12 90-100%
B1 Adequate 8 60-89%
B2
Inadequate but
potential
demonstrated
0 30-59%
C Unacceptable 0 <30%
3

42
DOTS
4 Relevant Actions to further enhance treatment coverage from ITP
Samples from Accountability Framework
Country Target Associated Actions to Address Bottlenecks with Partners
Scale up TB coverage from 90 to
213 districts by 2018
Address bottlenecks with procurement and secure additional funding for
ambitious scale up of active case finding in all 213 districts in response to TB
prevalence survey results (to be coordinated through TB Situation Room)
33% increase in TB case notification
(all forms) from 58,261 in December
2014 to 77,685 by Dec 2017
Short and long term: TB program implementation support at central and
provincial levels (to be coordinated with TB situation room)
Technical assistance for prevalence survey implementation

Findings and way forward
43
• Efforts are underway with partners and implementers to improve consistency of how
tuberculosis treatment is attributed to Global Fund resources
• Global Fund will move to a consistent contributive model for the Strategy 2017 to 2021/22
period
DOTS
• Need to strengthen categorization of indicators within performance framework to improve
attribution to Global Fund
• Strengthen the process of review and supervision of target setting within performance
framework to ensure targets correctly entered, and aligned with overall strategy targets
5
Short term
actions
Longer
term
actions

Way forward on
LLINs
Performance
analysis of Top 20
countries
Section 3: Malaria
44
Summary Revised
Projections
1 2 3 4
LLINS
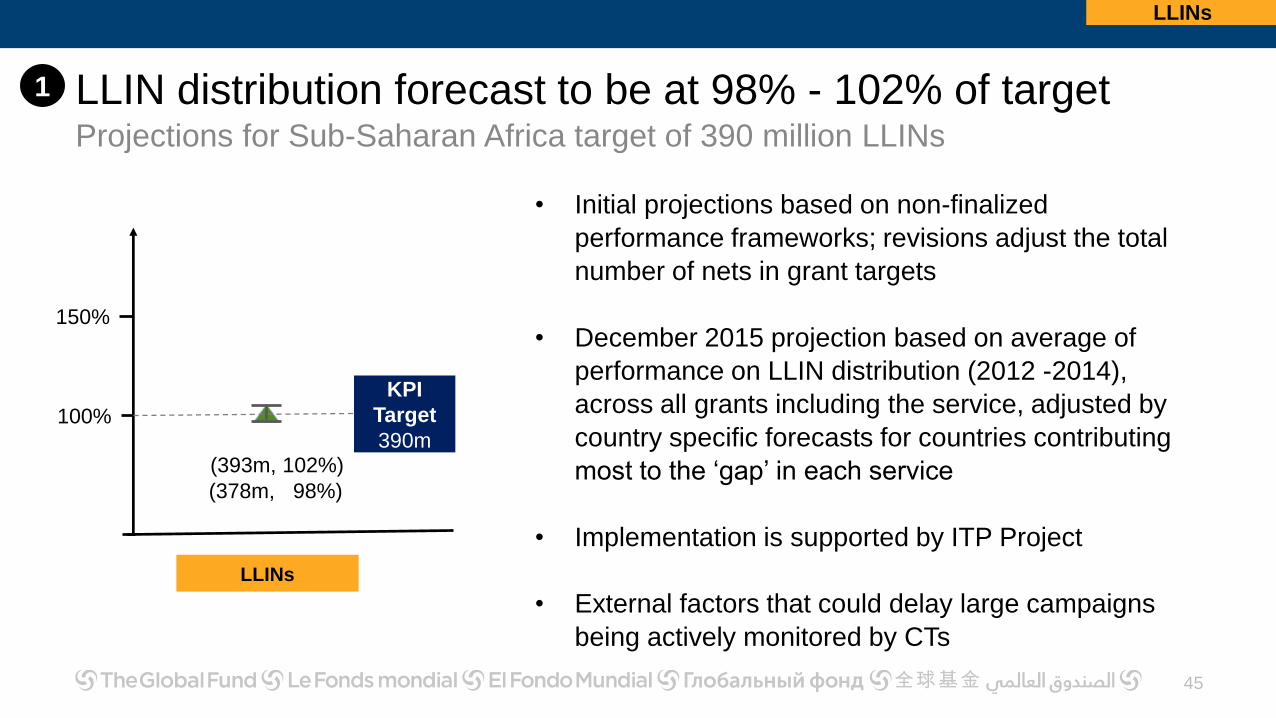
LLIN distribution forecast to be at 98% - 102% of targetProjections for Sub-Saharan Africa target of 390 million LLINs
45
• Initial projections based on non-finalized
performance frameworks; revisions adjust the total
number of nets in grant targets
• December 2015 projection based on average of
performance on LLIN distribution (2012 -2014),
across all grants including the service, adjusted by
country specific forecasts for countries contributing
most to the ‘gap’ in each service
• Implementation is supported by ITP Project
• External factors that could delay large campaigns
being actively monitored by CTs
LLINs
100%
150%
LLINs
KPI
Target
390m(393m, 102%)
(378m, 98%)
1

Recent performance of Top 20 LLIN Countries covering >95% of
target
46
LLIN distribution target –
national (2015-2016),
million
Share of
LLINS
target (2015-2016)
Rating on LLIN distribution
Indicator (2012-14)
Country a 34.5 16% B1 Adequate
Country b 32.7 16% A2 Meeting expectations
Country c 29.1 14% B1 Adequate
Country d 16.9 8% B2 Inadequate
Country e 12.7 6% B2 Inadequate
Country f 10.7 5% B1 Adequate
Country g 10.1 5% B1 Adequate
Country h 9.1 4% B1 Adequate
Country i 8.6 4% A2 Meeting expectations
Country j 8.2 4% B2 Inadequate
Country k 8 3% B1 Adequate
Country l 4.7 2% B2 Inadequate
Country m 4.0 2% B1 Adequate
Country n 3.4 2% A2 Meeting expectations
Country o 2.9 1% C Unacceptable
Country p 2.7 1% A2 Meeting expectations
Country q 2.3 1% B1 Adequate
Country r 2.1 1% A2 Meeting expectations
Country s 1.7 1% A2 Meeting expectations
Country t 1.6 1% A2 Meeting expectations
LLINs
Indicator
Rating
No. of
countries
Average
Achievement
(Result/Targe
t) (%)
A1Exceeding
expectations- >100%
A2 Meet expectations 7 90-100%
B1 Adequate 8 60-89%
B2
Inadequate but
potential
demonstrated
4 30-59%
C Unacceptable 1 <30%
Note: unweighted average performance of country on specific indicator during period 2012-4. Global Fund Grant Indicator rating bands applied to LLINs indicator only. Percentages capped at 100%
2

47
LLINs
Relevant Actions from ITP
Country Target Associated Actions to Address Bottlenecks with Partners
LLIN universal campaign to
distribute ~7M LLINs in 2016
Accelerate LLIN mass campaign planning to 1) support technical assistance
needs identified through the process and 2) contingency plan depending on
delivery dates of bed-nets
First national LLIN universal
campaign to distribute 15.7m nets
between Q3 2016 to Q4 2017
Strengthen entomological capacity at MOH to implement new vector control
strategy (including LLIN distribution) with immediate technical support to
increase training in medium term
LLIN mass campaign to reach
universal coverage (80%) for 33.4
million people and key populations.
Embed long-term advisors for technical support and capacity building into
NMCP
3
Samples from Accountability Framework

Findings and way forwardDrawing on analysis with Country Teams
48
LLINs
Continuous
distribution
• Historical challenges to performance – weak supply chain/systems for health
• Ambitious targets through ANC/EPI distributions result in performance gaps due to
constraints to accessing these services investments in supply mechanisms being given
greater priority
• Investments being made in stronger and innovative BCC to improve service uptake
Mass
campaigns
• Suboptimal quantification:
• First campaign quantifications mostly based on population projections resulting in
over/under-quantification; affected strategy and performance
• Majority of countries now with experience and validated population figures to
accurately quantify
• Campaigns extend beyond performance period in some countries
External
factors
• Political instability and insecurity in excess of levels foreseen
• Countries may not meet grant conditions (e.g incentive funding conditional on matching
funding)
4

49
KPI 5

KPI 5Further information requested by Board
50
Further information requested
1. Provide data on key HSS programmatic areas supported by the GF and proportionality to the
whole of the HSS budget or expenditures.
2. Provide options for indicators directly related to the core HSS programmatic areas that could be
utilized for the remaining period of the current strategy.
3. Provide options for sampling in a spectrum of countries across the three diseases.
4. Create a standard portfolio for performance monitoring that could potential be used in the ITP
process.
HSS

HSS
51
Current RSSH
Investments
Assessment of
HSS-related
indicators
1 2
HSS
RSSH measurement
approach and
timelines
3
ITP Performance
Monitoring for HSS /
RSSH Actions
4

RSSH investments increased to 40% under NFMCross-cutting interventions have doubled under NFM
52
HSS
Cross-cutting
HSS interventions
Source: 104
GAC-2 approved
grants
Pre-NFM 38% of portfolio
Cost inputs
related to RSSH
Source: 165
GAC-2 approved
grants
NFM 40% of portfolio
12%6%
32%
28%
Pre-NFM Breakdown of NFM
RSSH investments
PSCM
22%
HMIS
51%
Healthcare Financing
0.2%
Financial management
2%
Policy and Governance
2%
Service Delivery
9%
HCW
13%
NFM
Legend
1

Assessment of HSS-related indicators in CAT tool
19 High Impact Countries
53
M&E PSCMFinancial
Management
Governance &
Project Management
At or above
the
performance
benchmark
(75%)
Below the
Performance
benchmark
(75%)
At or above
the
performance
benchmark
(75%)
Below the
Performance
benchmark
(75%)
At or above
the
Performance
Benchmark
(75%)
Below the
Performance
benchmark
(75%)
At or above
the
Performance
Benchmark
(75%)
Below the
Performance
benchmark
(75%)
CT Verified
results 37.5% 62.5% 37.5% 62.5% 57.14% 42.86% 81.25% 18.75%
Note: based on 42 PRs in 19 high impact countries. Analysis focused on Government PRs in those countries where they were available. Where the
Government PRs were not available, non-government PRs were randomly selected. In case of multiple PRs per country, data was averaged. The overall
performance of each country is the average score of all the Principal Recipients per component of the Health System considered, out of the total attainable
score of 100%. The benchmark of performance is 75% which corresponds to the rating of “Minor Issues” by the Country Team. Performance below this
benchmark is considered underperformance for the country in the corresponding HSS components.
2
New tool introduced in NFM, provides baseline for tracking progress in future
HSS

RSSH measurement approach and reporting timelines
54
Illustrative list of RSSH indicators that can be tracked
HMIS/M&E % of HMIS or other routine reporting units submitting timely reports according to national guidelines
PSCM% of health facilities reporting no stock outs of essential drugs
FinancingGovernment expenditure on health as percentage of general government expenditure
Health and Community WorkforceNumber of health workers per 10,000 population
HSS Indicators
• Impact and Outcome Indicators are measured in 3-5
year intervals. Output/Coverage indicators reported
annually or bi-annually.
• Secretariat intends to measure performance of HSS
output/coverage indicators, for priority health system
components.
• Implementation of most NFM grants started in 2015 -
the first programmatic reports are expected
throughout 2016.
• First measurement of HSS indicators will be done by
end of 2016. Additionally, at the end of the funding cycle, a sub-
set of countries will be selected based on agreed set
of criteria, where in-depth evaluation will be carried
out, by applying a newly developed HSS evaluation
tool, which has been designed to be used in
conjunction with national disease program reviews
+
3
HSS

ITP Performance Monitoring for HSS /RSSH Actions – Beyond KPI 510 indicators identified for HSS, monitoring associated actions and partnership support
55
• SD: # & distribution of health facilities per 10,000 population
• SD: # of outpatients visits per 10,000 population
• HCW: # of health workers per 10,000 population
• HCW: Distribution of health workers
• HCW: # of health workers newly recruited at primary health care facilities in the past 12
months, expressed as a percentage of planned recruitment target
• HCW: Annual rate of retention of service providers at primary health care facilities
• PSM: % of health facilities reporting no stock-outs of essential drugs
• ME: % of HMIS or other routine reporting units submitting timely reports according to
national guidelines
• ME: % of deaths registered
• HCF: Government expenditure on health as a percentage of general government
expenditure
Country
target
related to
HSS
Action to
address
bottleneck
Analysis with Partners
& Countries
Identified HSS Indicator (as at
December 2015)
HSS
3

56
KPI 7

Strategic Objective 1
Invest more
strategically
Strategic Objective 2
Evolve the funding
model
Strategic Objective 3
Actively support grant
implementation success
Strategic Objective 4
Promote and protect
human rights
Strategic Objective 5
Sustain the gains,
mobilize resources
Strategic Enablers
Enhance partnerships &
Improve operations
Strategic Goals &
Targets
Performance
Access to FundingKPI 7
Measure
2015 – 2016 Target:• For grants submitted in 2014, 75% take 10 months or less
• For grants submitted in 2015-2016, 75% take 8 months or less
2015 Q2 result: 54% NFM to date
Time from final Concept Note submission to first
disbursement
Board approved KPI definition includes the following clause:
Special dispensation will be given to grants where first
disbursement is delayed to align with parliamentary approval
processes, national cycles, or for legal requirements
• At Q2 2015, 63 grants became eligible for KPI assessment
• 34 of them had a first disbursement within the 10 month target
(54%)
• Achieving the 10 month target for 2014 submissions looks
increasingly challenging, and the 8 month target for 2015
submissions unlikely
57
Interpretation
KPI 7

Management actions
Strategic Objective 1
Invest more
strategically
Strategic Objective 2
Evolve the funding
model
Strategic Objective 3
Actively support grant
implementation success
Strategic Objective 4
Promote and protect
human rights
Strategic Objective 5
Sustain the gains,
mobilize resources
Strategic Enablers
Enhance partnerships &
Improve operations
Strategic Goals &
Targets
Additional input
Access to FundingKPI 7
8 16 14 450%
10%
20%
30%
40%
50%
60%
70%
80%
90%
100%
Window 1 Window 2 Window 3 Window 4
Less than 10 months
• Performance improved to 63% including Q3 data
• 10 month target has not been met for 2014 submissions
• Poor performance in Window 3 was the main factor in missing the 10
month target
• Submissions to date would need to lose ~3.5 months to reach an 8
month target, or 1.5 months to reach 10 months
• Management actions estimate saving 6-8 weeks from the
process, but a limited share of the portfolio is expected to see
the full 8 week gain
• Grant extensions have been implemented to avoid service
disruptions
2015 Q3 Performance Update
% and Number of submissions meeting 10 month target
• Implement already-identified improvements to data, processes and systems by end 2015
• Differentiate approaches to sign-off for small and low risk grants
• The Implementation Through Partnership project will focus partner engagement to accelerate grant making & to improve targeted
technical assistance
• Project AIM is undertaking a review of grant-making processes, identifying pain points and potential solutions
58
KPI 7

Overall status windows 1-4:• Average time of submission to disbursement is 9.9 months or 10.2 for key countries; wide
extremes in length of funding cycle
• Below analysis shows certain stages to focus on (no breakdown available for 10 month target)
59
Average for
all countries88 days 24 days40 days120 days 30 days
Submission to GAC1
Grant-making: GAC1 to GAC2
GAC2 to Board approval
Board approval to grant signing
Grant signing to disbursement
Key
Countries*96 days 24 days45 days117 days 31 days
90 days 90 days 30 days 21 days 7 days
8 month
expected
(applies to
2015 windows
only) Note: A country is classified as a key country if it falls in any one of the following categories: High Impact countries, ITP countries, top 20 countries by funding
(including allocation + incentive funding)
KPI 7

Submission to GAC1
60
Findings:
• Clarifications, screening of eligibility requirements 1+2 and translations take ~45 days
• TRP review, GAC review and the development of the review and recommendation form
take between 30-45 days, depending on the complexity of the issues.
Management actions:
• Continue to improve and streamline TRP review process: differentiated (simplified)
review approach already agreed for sub-set of applications
• Continue quicker turn-around of review and recommendation forms to enable grant-
making to start earlier
KPI 7

Grant-making: GAC1 to GAC2
61
Findings:
• Low capacity within countries has played a key role in extending the duration of grant-
making
• Challenges with new tools, templates, systems and processes caused delays
• Other causes include: changing circumstances in-country, identifying new Principal
Recipients after concept note submission, and lengthy corporate negotiations (for
example, policy indicates 7% overhead; some PRs were trying to negotiate for 8+)
Management actions:
• Dashboard now created for Grant Management Directorate for monthly monitoring
• Incremental enhancements to fix bugs and make grant-making tools more user-friendly
• The Implementation through Partnership project will focus partner engagement to
accelerate grant-making & to improve targeted technical assistance
• Project AIM is undertaking a review of grant-making processes; identifying pain points
and potential solutions
KPI 7

GAC2 to Board approval
62
Findings:
• Watch out: the longer Board electronic voting period now under discussion will make this
harder to achieve in the future
Management actions:
• Differentiate approaches to GAC sign-off for small and low risk grants
• Explore electronic sign-off for GAC2 fast-track grants
KPI 7

Board approval to grant signing
63
Findings:
• Country signing processes also take time and cause delays
Management action:
• Communicate expected Board approval date in advance to country teams to facilitate
scheduling grant signing
KPI 7

Grant signing to disbursement
64
Findings:
• Lack of clarity in new grant creation and first disbursement processes + technical
challenges in creating disbursements in the online systems led to delays
• Annual funding decisions (ADMF) was not prioritized when there was existing cash
balance in-country
Management actions:
• Guidance has been developed on grant creation and disbursement under a new
grant
• Country teams to systematically process ADMF immediately following grant signing
(even if there is cash in-country)
KPI 7

Implications of KPI7 Performance
No impact on programs: there are no anticipated or perceived disruptions or
gaps in interventions
• Country teams try to anticipate delays in grant-making by processing grant
extensions (with additional funding or not) to ensure no program disruption
• Where ADMFs were not processed immediately, there were sufficient cash
in-country and disbursements were not needed urgently
65
KPI 7

Recommendation
• Submissions to date would need to lose ~3.5 months to reach an 8 month
target, or 1.5 months to reach 10 months
• Proposed management actions estimate saving ~6 weeks from the process
Recommendation to revise KPI7 target for 2016
• Keep target of 10 months for 75% of submissions
• Use 8 months as stretch target - need more time to achieve this
66
KPI 7
67
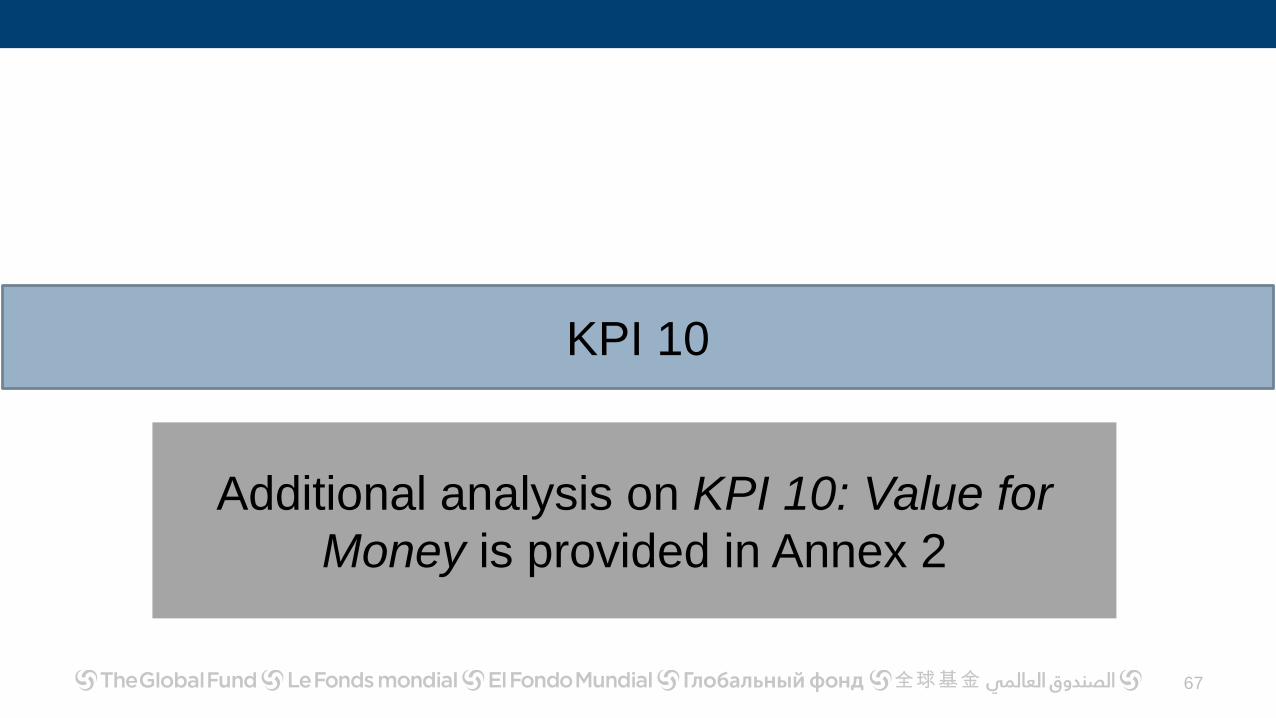
KPI 10
Additional analysis on KPI 10: Value for
Money is provided in Annex 2

68
KPI 11

Strategic Objective 1
Invest more
strategically
Strategic Objective 2
Evolve the funding
model
Strategic Objective 3
Actively support grant
implementation success
Strategic Objective 4
Promote and protect
human rights
Strategic Objective 5
Sustain the gains,
mobilize resources
Strategic Enablers
Enhance partnerships &
Improve operations
Strategic Goals &
Targets
Performance
Grant expenses forecastKPI 11
Measure
2015 Target: 0.9 - 1.1
Forecast to 2015 year end: 1.0 (USD 4.1bn / 3.9bn)
(F3 2015 Grant Expense / Grant Expense Corporate Budget)
Year to date Q3: 0.83 (USD 3.1bn / 3.7bn)
2016 Target: 0.9 - 1.1
Corporate Expenditure Rate (CER): Proportion of
forecast grant expenses made to schedule
Total F3 2015 forecast grant expenses are approximately
equal to 2015 budget
However, 83% of year-to-date budget was committed as of
September
In total, 80% of 2015 total budget was committed as of
September
These shifts in grant expenses from original budget are
resulting from delays in grant signing, as well as low
absorption levels
x
Grant Expenses
69

GF/B32/ER03 – Annex 2
Electronic Report to the Board Page 1
Annex 2: Response to Board questions on KPI 10: Value for Money
Board agreed target: Reduce spend by 8% per year for equivalent commodities at equivalent quality
and volume
Questions:
Following a 2014 performance of 9%, 2015 performance has thus far dropped to 4%. We need
to understand:
o The numbers and trends underlying this drop (disaggregated along categories)
o The forecasted outcome for the full year (disaggregated along categories)
o The reasons behind underperformance in this KPI
If the delays in grant signing are not having a negative impact on the ground, then why are
delays in procurement driving a halving of savings?
Against the background of the negotiated Long-Term Agreements for commodities and the
prospective bulge in spending for 2016 and 2017, how can a delay in purchasing in 2015 have
such a dramatic impact?
Was this target overestimated? How did this happen?
Why is the Secretariat proposing to halve the target for 2016, particularly in the area of medical
commodities?
Why were negotiated prices not reduced further? And how does the Global Fund performance
compare with appropriate benchmarks in the market? To the extent possible, please provide
performance against relevant benchmarks (disaggregated along categories)
Response:
Performance on KPI 10 driven largely by tender timing
Since 2013, the Procurement for Impact (P4I) initiative has already achieved substantial savings on
health commodities, reflected in the global price reductions made available to the Global Fund’s
Principal Recipients (PRs). This includes both PRs that participate in the Pooled Procurement
Mechanism (PPM) and some countries that procure directly through national systems or PSAs, either
with their own funds or Global Fund financing (e.g., Georgia, PAHO). These lower prices are expected
to persist through 2016 and beyond.
Figure 1 displays by category the percent of PPM spend in the first half of 2015 and savings achieved in
2014 and the first half of 2015. Savings are displayed in terms of absolute value and as a percent of
spend. Per the methodology for KPI 10, 2014 and H1 2015 savings were calculated based on unit costs
from the prior year. H1 2015 savings are also shown if compared to 2013 base prices.
Figure 1: PPM savings (in USD millions) and percent savings on comparable products1
2014 vs. 2013 2015 H1 vs. 2013 2015 H1 vs. 2014 Category $ % $ % $ %
ACTs 5.3 14.3% 3.3 7.4% -0.4 -0.9% CPM
ACTs2 26.2 23.9% 19.0 7.6% 2.7 5.2%
ARVs 6.9 2.2% 18.6 7.2% 13.6 5.3% LLINs 1.5 1.3% 3.8 3.1% -2.2 -1.8%
HIV Dx 0.1 0.4% 0.0 -0.1% 0.0 -0.2% Malaria
Dx 1.5 11.7% 4.6 29.3% 3.0 21.4%
Other3 11.8 28.6% 2.5 7.6% 6.9 10.3% Total 53.2 8.1% 51.7 9.3% 23.7 4.2%
1 Includes only spend on products that are comparable between years. For example, if a specific product was purchased in only one year, it would not be included. 2 Includes ACTs financed through the private sector co-payment mechanism. Savings calculated based on Global Fund share of co-paid ACTs, not entire price. 3 Includes condoms, lab supplies, and non-core drugs (such as those for opportunistic infections).

GF/B32/ER03 – Annex 2
Electronic Report to the Board Page 2
The key driver of performance on KPI 10 is the timing of Global Fund tenders compared to the timing
used to calculate the KPI. For the largest PPM categories (ACTs and co-paid ACTs, ARVs and LLINs),
prices are negotiated through two- or three-year framework agreements with manufacturers.
Meanwhile, KPI 10 calculates savings on an annual basis. This means that only savings compared to
the prior year are counted. Targets were set to expect the same savings every year, even though not all
categories are re-negotiated every year. Savings results are cyclical and will align with the timing of
tenders. Savings for a given product will also decrease over time.
For the largest categories, which represent more than 90% of spend through the PPM, this timing plays
out as below:
ACTs and co-paid ACTs:
Current framework agreements were implemented in 2014. Figure 1 highlights substantial
savings on ACTs and co-paid ACTs in 2014, reflecting these prices.
2015 prices are set by the same framework agreements and are essentially the same as in 2014.
Therefore, no additional savings are reflected in 2015 KPI performance.
LLINs:
Similar to ACTs, LLIN framework agreements were implemented in 2014 and set prices for two
years. Therefore, savings would be expected in 2014, but not in 2015.
Prices for LLINs appear to have increased slightly in the first half of 2015. This is largely due
to the timing of this analysis. Individual suppliers still have different prices for the same
product. If volumes in the beginning of the year are allocated to a higher-priced supplier (for
example, due to country registration or lead time requirements), it can look like the price has
increased. Annual savings are forecast based on a weighted average of expected allocations over
a full year.
As discussed below, it is anticipated that the weighted average price for LLINs in 2015 will
actually be slightly lower than in 2014, resulting in additional savings
ARVs:
A global tender was implemented in early 2015 and as expected, Figure 1 shows that this is the
only major category with substantial USD savings in the first half of 2015.
The ARV framework agreements also include price roadmaps, which generate additional
savings through volume discounts and manufacturer production efficiencies enabled by longer-
term contracting.
Savings from ARVs were slightly lower than expected in 2015 because country demand was also
below forecast. However, some additional price reductions were achieved ahead of schedule.
Therefore, although demand has been only about 90% of forecast, savings are likely to reach
over 95% of projection by year-end.
Other categories:
There was also a tender for viral load diagnostics completed in June 2015. While this is a
smaller category, some savings are expected in the second half of 2015 and 2016. Given the
lengthy technology selection process for viral load diagnostics, savings are expected to
materialize later.
Other HIV diagnostics, malaria diagnostics, and other products were not under active
management in 2015. These categories continue to be competed through spot tenders on an
as-needed basis. Savings in these categories are difficult to predict.
Savings forecast for remainder of 2015 expected to improve
Figure 2 illustrates forecast savings for the rest of 2015. As noted above, additional savings are expected
for ARVs. The Secretariat anticipates that stable prices will continue for ACTs.

GF/B32/ER03 – Annex 2
Electronic Report to the Board Page 3
A reduction in the overall price of LLINs is expected for the full year due to decreasing costs of raw
materials, which are reflected through a contractual price adjustment mechanism in the Global Fund’s
framework agreements.
These factors will allow the Secretariat to come close to achieving the eight percent savings target in
2015, despite the timing mismatch and lower demand for ARVs described above.
Figure 2: Forecast savings for the full year 2015 (in USD millions)
Category H1 2015
Actual Savings 2015 Total
Forecast Savings 2015 Total
Forecast % Savings4 ACTs (0.4) 0.0 0.0% CPM ACTs5 2.7 2.7 3.2% ARVs 13.6 35.0 9.9% LLINs (2.2) 16.0 6.0% HIV Dx 0.0 0.0 0.0% Malaria Dx 3.0 3.0 21.4% Other6 6.9 9.0 10.2% Total 23.7 65.7 7.0%
New information allows potential increase in 2016 KPI 10 target
A meaningful savings target for 2016 will consider the framework agreements currently in place and
which prices are likely to change during the year. Expectations for the largest PPM categories are
discussed below.
Since the KPI targets were originally proposed, new information on future LLIN prices has become
available based on manufacturer proposals received in late November for the Global Fund’s current
LLIN tender. Based on this new information, the Secretariat has revised its savings estimate for 2016
and anticipates savings between 6 and 8 percent of PPM spend. This translates into approximately $40
to $55 million. Given that targets have not yet been approved, the Secretariat would propose a revised
7% savings target for 2016.
ACTs and co-paid ACTs: The current framework agreement and prices for ACTs will remain in
place throughout 2016, with a new tender expected at the end of the year.
LLINs: The Secretariat is in the midst of re-tendering for LLINs and new framework
agreements are anticipated in January. While LLINs are a mature product, pricing has been
competitive and further savings are expected.
ARVs: Current framework agreements will remain in place throughout 2015. Price roadmaps
should generate additional savings through volume discounts and production efficiencies.
Viral load diagnostics: While savings are expected from the 2015 viral load tender, this category
is small in terms of total spend. Savings may be significant for the product, but they are unlikely
to drive large impact on overall PPM spend.
Other categories: Likewise, the Secretariat is exploring bringing additional categories under
management (such as rapid diagnostic tests), but the remaining categories are relatively small.
Further, prices for some products are already quite low (such as malaria RDTs, which are
roughly $0.20 per test). These prices have already decreased over the last two years through
spot tenders. Some additional savings may result, but are unlikely to be significant compared
to results from LLINs and ARVs.
In addition, some cost savings are anticipated in 2016 from reduced transactional fees. The e-
marketplace will also continue to extend the benefits of the Global Fund’s framework agreements
4 Total spend for 2015 is estimated based on YTD actuals for ARVs and LLINs, and an average of 2013 and 2014 spend for the remaining categories. 5 Includes ACTs financed through the private sector co-payment mechanism. Savings calculated based on Global Fund share of co-paid ACTs, not entire price. 6 Includes condoms, lab supplies, and non-core drugs (such as those for opportunistic infections).

GF/B32/ER03 – Annex 2
Electronic Report to the Board Page 4
beyond PPM participants. However, because the existing KPI 10 focuses on PPM spend, it will not
capture these savings.
Multi-year framework agreements enable lower prices and more secure supply
The longer-term commitments offered by the Global Fund help manufacturers to plan production and
lower their cost base. This ultimately lowers prices and improves affordability, as well as improving the
availability of key health products (as evidenced by the improvements in on-time delivery among
manufacturers). Framework agreements may include price roadmaps (as noted for ARVs above), which
do further reduce prices over time. In addition, all agreements include a “most favoured nation” clause,
which requires that any improved pricing offered to other public sector buyers be made available to the
Global Fund.
Global Fund compares favourably to international benchmarks
Global Fund prices also compare favourably to other benchmarks. The table below provides indicative
pricing for the highest volume products in each major PPM category during the first half of 2015. In all
cases, the Global Fund is within international benchmark ranges.
Figure 3: Global Fund reference prices compared to international benchmarks
Category Product
Global Fund weighted average
PPM price, H1 2015
International benchmarks7
LLINs All LLINs8 $3.04 $2.02 - $5.13
ACTs A/L 20/120mg FDC, 6x4, Hospital $0.93
$0.63 - $1.119
A/L 20/120mg FDC, 6x3, Hospital $0.73 AL 20/120mg FDC, 6x2, Hospital $0.52
CPM ACTs
A/L 20/120mg FDC, 6x4, Individual $1.09 A/L 20/120mg FDC, 6x2, Individual $0.64 A/L 20/120mg Disp, 6x2, Individual $0.70
ARVs
TDF/3TC/EFV 300/300/600mg, 30 tabs
$8.99 $9.00 - $11.16
AZT/3TC/NVP 300/150/200mg, 60 tabs
$8.30 $8.11 - $8.32
AZT/3TC 300/150mg, 60 tabs $6.54 $6.48 - $7.04 AZT/3TC/NVP 60/30/50mg disp, 60 tabs
$3.60 $3.50 - $3.63
TDF/3TC 300/300mg, 30 tabs $4.62 $4.32 - $4.78
7 ACT reference prices are from a sample of PMI country operational plan budgets for FY 2016. LLIN reference prices are from UNICEF (as of April 2015) and a sample of PMI country operational plan budgets for FY 2016. ARV reference prices are from the CHAI ARV Market Report, published in November 2015. The range of reference prices from 6 buyers is provided, including CHAI, SCMS / PEPFAR, MSF, WHO GPRM, South Africa, and Kenya. Specific details of reference prices can be found in the original CHAI report. 8 For UNICEF and Global Fund, does not include PBO or conical LLINs. Unclear whether these are included for PMI. 9 PMI operational plans do not always specify which ACT, dosage or pack size are planned for purchase. Where ACTs other than A/L are specified, these were excluded. Highest and lowest values removed.