Embed Size (px)
Citation preview

Electronic Journal of Biotechnology
E-ISSN: 0717-3458
Pontificia Universidad Católica de Valparaíso
Chile
Torres-Vázquez, José Antonio; Vázquez Flores, Felícitas; Montaldo, Hugo H.; Ulloa-Arvizu, Raúl;
Valencia Posadas, Mauricio; Gayosso Vázquez, Amanda; Alonso Morales, Rogelio Alejandro
Genetic polymorphism of the as1-casein locus in five populations of goats from Mexico
Electronic Journal of Biotechnology, vol. 11, núm. 3, julio, 2008, pp. 1-11
Pontificia Universidad Católica de Valparaíso
Valparaíso, Chile
Available in: http://www.redalyc.org/articulo.oa?id=173314719007
How to cite
Complete issue
More information about this article
Journal's homepage in redalyc.org
Scientific Information System
Network of Scientific Journals from Latin America, the Caribbean, Spain and Portugal
Non-profit academic project, developed under the open access initiative

Electronic Journal of Biotechnology ISSN: 0717-3458 Vol.11 No.3, Issue of July 15, 2008 © 2008 by Pontificia Universidad Católica de Valparaíso -- Chile Received November 19, 2007 / Accepted March 14, 2008
This paper is available on line at http://www.ejbiotechnology.info/content/vol11/issue3/full/11/
DOI: 10.2225/vol11-issue3-fulltext-11 RESEARCH ARTICLE
Genetic polymorphism of the αs1-casein locus in five populations of goats from Mexico
José Antonio Torres-Vázquez Departamento de Genética y Bioestadística
Facultad de Medicina Veterinaria y Zootecnia Universidad Nacional Autónoma de México
Ciudad Universitaria, México 04510, D.F., México Tel: 52 55 56 22 5894 Fax: 52 55 5622 5956
E-mail: [email protected]
Felícitas Vázquez Flores Escuela de Medicina Veterinaria y Zootecnia Benemérita Universidad Autónoma de Puebla
4 Sur No. 304 col. Centro. 75482, Tecamachalco, Puebla Tel: 52 249 422 01 78 Fax: 52 249 422 01 78
E-mail: [email protected]
Hugo H. Montaldo* Departamento de Genética y Bioestadística
Facultad de Medicina Veterinaria y Zootecnia Universidad Nacional Autónoma de México
Ciudad Universitaria, México 04510, D.F., México Tel: 52 55 56 22 5894 Fax: 52 55 5622 5956
E-mail: [email protected]
Raúl Ulloa-Arvizu Departamento de Genética y Bioestadística
Facultad de Medicina Veterinaria y Zootecnia Universidad Nacional Autónoma de México
Ciudad Universitaria, México 04510, D.F., México Tel: 52 55 56 22 5894 Fax: 52 55 5622 5956
E-mail: [email protected]
Mauricio Valencia Posadas Instituto de Ciencias Agrícolas
Universidad de Guanajuato Ex-Hacienda El Copal, AP 311 Irapuato Guanajuato
CP 36500, México Tel: 52 46 2624 1889 Fax: 52 46 2624 8678
E-mail: [email protected]
Amanda Gayosso Vázquez Departamento de Genética y Bioestadística
Facultad de Medicina Veterinaria y Zootecnia Universidad Nacional Autónoma de México
Ciudad Universitaria, México 04510, D.F., México Tel: 52 55 56 22 5894 Fax: 52 55 5622 5956
E-mail: [email protected]
Rogelio Alejandro Alonso Morales Departamento de Genética y Bioestadística
Facultad de Medicina Veterinaria y Zootecnia Universidad Nacional Autónoma de México
Ciudad Universitaria, México 04510, D.F., México Tel: 52 55 56 22 5894 Fax: 52 55 5622 5956
E-mail: [email protected]

Torres-Vázquez, J.A. et al.
2
With the objective of estimating allele frequencies, and testing for population divergence for the CSN1S1 locus, genotypes of animals from five goat populations; Saanen (n = 97), Alpine (n = 81) Toggenburg (n = 92), local goats with external appearance similar to the Murciana-Granadina breed from Central Mexico (n = 26) and heterogeneous local animals denominated Mosaico Lagunero (n = 30), from Northern Mexico, were identified using PCR and Xmn1 PCR-RFLP methodology. For Saanen, Alpine and Toggenburg, the sum of E and F alleles had the largest frequencies (from 0.468 to 0.789), while for the groups local Murciana-Granadina and Mosaico Lagunero the sum of the most frequent allelic groups (A* and B*), were 0.385 and 0.533 respectively. Both local Murciana-Granadina and Mosaico Lagunero populations showed heterozygote excess (P < 0.08). The percentage of the total genetic variation (FST) explained by population differences was 5.16. There was genetic differentiation for most pair comparisons between populations (P < 0.05), excepting for Alpine versus Toggenburg, and Toggenburg versus Mosaico Lagunero (P > 0.05). For Saanen and Alpine the frequencies of alleles E and F were similar to the same breeds previously analyzed in Europe. Therefore there are opportunities of increasing the frequency of the strong alleles for protein content Gene Assisted Selection (GAS) in these two breeds. For Toggenburg the most frequent allelic groups were F (0.32) and B* (0.21). Results indicate differentiation between most populations for this locus. Moreover, heterozygote excess in local populations indicated breed admixture.
In Mexico and other countries, goat milk is used mainly for its transformation in cheeses and sweets. The economic value of milk depends therefore in a great extent on the content and total quantity of protein and fat (Montaldo and Manfredi, 2002).
The polymorphism of CSN1S1 in goats is associated with the quality, composition, some technological properties of
*Corresponding author
the milk, also with the yield and quality of cheese (Martin et al. 2002; Roncada et al. 2002; Gómez et al. 2004). The alleles of the CSN1S1 locus in goats have been grouped in 4 levels according to their individual approximate contribution to quantity of protein in milk; strong alleles (A, B1, B2, B3, B4, C, H, L and M), intermediate alleles (E and I), weak alleles (D, F and G), and null alleles (O1, O2 and N) (Grosclaude et al. 1987; Moioli et al. 1998; Rando et al. 2000; Bevilacqua et al. 2002; Ramunno et al. 2005; Sacchi et al. 2005; Sztankóová et al. 2007). In dairy goat populations, it is often considered convenient to identify the CSN1S1 genotypes of individual animals, with the idea of incorporating this information to the selection processes, and therefore propitiate an increase on the rate of genetic gain for casein contents and yield through gene assisted selection (GAS), compared to selection programs based only on phenotypic and pedigree information (BLUP), (Grosclaude et al. 1987; Moioli et al. 1998; Dekkers, 2004; Sánchez et al. 2005).
Several studies have been carried out in different goat populations to estimate genotypic and allelic frequencies for this locus (Feligini et al. 2005). The diversity of the CSN1S1 gene can help in understanding the genetic structure of goat populations in Mexico, which is characterized by a great racial heterogeneity (Montaldo and Meza, 1999). The objective of this study is to study the genetic polymorphism of the CSN1S1 locus in five populations of goats from Mexico, by estimating genotype and allele frequencies, as well as testing for population divergence.
MATERIALS AND METHODS
Populations
A total of 270 blood samples of goats from different populations: Saanen (n = 97), Alpine (n = 81), and Toggenburg (n = 92) were collected from dairy goat flocks belonging to the National Association of Breeders of
Financial support: This study was supported by grant SAGARPA 2003-152 by the National Council of Science and Technology (CONACYT), Mexico.
Keywords: CSN1S1, gene frequencies, genetic diversity, goat milk, PCR-RFLP.
Abbreviations: CSN1S1: αs1-Casein FIS: subpopulation inbreeding coefficient FIT: overall inbreeding coefficient FST: degree of genetic differentiation of subpopulationsGAS: Gene-Assisted Selection Ho: observed heterozygosity Hs: expected heterozygosity HWE: Hardy-Weinberg Equilibrium LINE: Long Interspersed Nuclear Element ne: effective number of alleles PCR: Polymerase Chain Reaction

Polymorphism of the αs1-casein locus in goats from Mexico
3
Registered Goats of Mexico. Besides, 26 samples of black-solid colour local goats with external appearance of Murciano-Granadina breed obtained from Apaseo el Grande in the State of Guanajuato, in Central Mexico, were included. Also, 30 blood samples of goats obtained in the northern Mexican region named 'La Laguna', area that include the Southern portion of the state of Coahuila and the Northwestern portion of the state of Durango. This last population is probably product of crossbreeding between local animals and specialized breeds such as Nubian, Alpine, Toggenburg and Saanen. Due to these reasons, this group of goats has been denominated Mosaico Lagunero (SAGARPA, 2002).
Genotype identification
The genomic DNA was extracted by phenol-chloroform. For the allele E typing, the Polymerase Chain Reaction (PCR) was used in order to amplify a region present in the exon 19 of the CSN1S1 locus. In the E variant a 457 bp segment was amplified due to the presence of a long interspersed nuclear transposable element (LINE, Long Interspersed Nuclear Elements). In non-E alleles, a 205 bp region was amplified (Pérez et al. 1994). The PCR reaction was prepared in a final volume of 20 µl containing: 100 ng of genomic DNA, 10 pmol of each primer (Forward: 5’ ATG GGA TTG AAA ATT CCA TGC 3’, reverse: 5’ ATA CTA CTG GAA TTT AGG TA 3’), 1 U of Taq DNA polymerase, PCR buffer (1.5 mM MgCl2; 10 mM Tris-HCl pH 8.4; 50 mM KCl; 10 µg/ml gelatin), 0.2 mM of dNTPs, and 0.15 µg/ml of BSA. The amplification conditions were: an initial step of 94ºC for 3 min; followed for 30 cycles of 94ºC for 30 sec, 59ºC for 30 sec and 72ºC for 30 sec and a final step of 72ºC for 3 min. Differentiation between alleles
F, N, A* (CSN1S1 A, G, H, I, O1, O2) and B* (CSN1S1 B1, B2, B3, B4, C, E, L) was developed by the XmnI PCR-RFLP method according to Ramunno et al. (2000).
Locus variation of the alpha s1-casein and Hardy-Weinberg equilibrium test
In each population, genotypic frequencies, allelic frequencies, fixation index (FIS) (Weir and Cockerham, 1984), observed heterozygosity (Ho), and expected heterozygosity (Hs) were estimated by using the GENEPOP version 3.4 software (Raymond and Rousset, 1995a). The effective number of alleles (ne) was estimated as ne = 1 / Σxi
2, where xi is the frequency of the i-th allele for the CSN1S1 locus. At each population U Score was used to test average heterozygote deficit or excess (Rousset and Raymond, 1995) using GENEPOP version 3.4 software (Raymond and Rousset, 1995a). Departures from Hardy-Weinberg equilibrium (HWE) at each population were tested by the method of Guo and Thompson (1992) using GENEPOP version 3.4 software (Raymond and Rousset, 1995a), and HWDIAG version 1.beta software (Rogatko et al. 2002).
Genetic differentiation and Wright’s F statistics (FIS, FST, and FIT)
To determine the extent of genetic variation within and between populations for this locus, F statistics was obtained (Nei, 1987). FST statistic estimates the variation produced by differences between populations. The statistic FIS estimates the variation inside populations. The statistic FIT is the inbreeding coefficient of one individual relative to the total population.
F statistics was estimated with the method proposed by Weir and Cockerham (1984), using the software GENEPOP version 3.4 (Raymond and Rousset, 1995a). Genetic differentiation between the caprine populations was evaluated with an exact test and a log-likehood G test performed with GENEPOP version 3.4 software (Raymond and Rousset, 1995a), which uses the Markov Chain method to get the probability of the genotypic distributions between the different populations (Goudet et al. 1996).
RESULTS
E, F and N allele genotyping
Through an amplification of one region in the exon 19 it was identified the insertion of a LINE element in the allele E. In Figure 1 can be observed a gel showing homozygote individuals for E, (662 bp fragment), heterozygote individuals (662 and 205 bp fragment) and homozygote individuals for non-E fragment (205 bp alleles). Because the CSN1S1 01 allele is characterized by the deletion of the last part of the gene, the 662 bp fragment obtained after PCR amplification of exon 19 of the goat CSN1S1 gene identify both individuals with genotype E/E that E/01. However, the consequences may not be very important,
Figure 1. Typification of allele E of the CSN1S1 locus. The amplified fragments from exon 19 of αs-1 casein were separated on a 2% agarose gel. M corresponds to the molecular weight marker pBR322/MspI; it can be observed 2 homozygote individuals for allele E (662 bp); one heterozygotic individual for allele E (662 and 205 bp) and one homozygotic individual for non-E alleles (205 bp).

Torres-Vázquez, J.A. et al.
4
because the frequency of O1 allelehad been found very low in previous studies (Grosclaude et al. 1987; Mahé and Grosclaude, 1989; Ramunno et al. 1991).
The identification of alleles F and N were obtained through the amplification of one segment of exon 9 and its posterior digestion with XmnI enzyme. In Figure 2 can be observed genotypes after XmnI digestion of fragments obtained by the XmnI PCR-RFLP method according to Ramunno et al. (2000). This technique allowed us to identify F and N alleles, but not distinguish alleles A from G, H, I, O1, O2 on the haplotype associated to 63 and 150 bp fragments, neither alleles B from B1, B2, B3, B4, C, E, L on the haplotype associated to 63 and 161 bp fragments (Ramunno et al. 2005; Cosenza et al. 2008).
Allele and genotype frequencies and effective number of alleles (ne)
The distribution of the observed genotypes and the frequency of alleles at CSN1S1 locus are reported in the Table 1 and Table 2 respectively. In the Saanen population, alleles E (0.42) and F (0.37), and in Alpine E (0.24) and F (0.28) were the most frequent. There were no homozygote Saanens for the A* allele, neither A*B* heterozygotes. The Saanen population had the lower ne (3.03) while the Alpine population presented the highest (4.69). In the Toggenburg population, the most frequent alleles were F (0.32) and B* (0.21); in the Murciano-Granadina population the most frequent alleles were E (0.44) and A* (0.25). In Murciano-Granadina population, we did not observe homozygote animals for A*, B*, N or F alleles, neither heterozygote animals for B*N, B*F and NF. In the Mosaico Lagunero population, the most frequent alleles were B* (0.35) and F (0.23), and we did not observed homozygotes for A*, B* or E, neither heterozygotes for A*E.
A large genetic diversity was observed (Hs > 0.7) in most populations, excepting in Saanen, which had the smaller value for Hs (0.67). In the Saanen population, only 3 alleles contributed to this heterozygosity, since A* and N alleles had frequencies smaller than 0.08. On the other hand, Alpine and Toggenburg populations presented values close of Hs (0.8) to the maximum possible for 5 alleles (Table 2).
Hardy-Weinberg equilibrium test
Using the method of Rogatko et al. (2002), only the Alpine population was found to be in HWE (P > 0.05), and the rest of the populations showed disequilibrium (P < 0.05). However, using the Guo and Thompson method (1992), HWE was not rejected in Alpine, Murciana-Granadina or Mosaico Lagunero populations (P > 0.05), while other populations showed significant departures as well (P < 0.05) (Table 3).
Toggenburg and Saanen populations showed a positive value for FIS, therefore a heterozygote deficiency test was applied and it was found that it was not significant (P > 0.05) (Table 3). Meanwhile Murciana-Granadina and Mosaico Lagunero populations, with a negative value for FIS, were used to apply the heterozygote excess test. Murciana-Granadina (P = 0.02) and Mosaico Lagunero (P = 0.08) populations showed evidence of heterozygote excess (Table 3).
Genetic differentiation and Wright’s F statistics (FIS, FST and FIT)
The statistic FIT it’s refers to the inbreeding coefficient of the metapopulation that in this study corresponded to 0.0484. The statistic FIS value is the average inbreeding of the 5 populations, whose value was of -0.0034, showing a small average excess of heterozygote proportion. The FST
Figure 2. Observed genotypes by the XmnI PCR-RFLP method. M corresponds to the molecular weight marker pBR322/MspI; CSN1S1 A* = A, G, H, I, O1, O2; CSN1S1 B* = B1, B2, B3, B4, C, L.

Polymorphism of the αs1-casein locus in goats from Mexico
5
index measures the genetic differentiation in the populations. Their value of 0.0516 indicates a moderate genetic differentiation between the goat populations.
Due to the existence of differences between the populations, a test to evaluate differences on the genotypic frequencies between pairs of populations was performed (Raymond and Rousset, 1995b). In 8 tests there were highly significant difference (P < 0.01), meanwhile in Toggenburg versus Alpine (P = 0.088) and Toggenburg versus Mosaico Lagunero (P = 0.068) a lower significance was found.
DISCUSSION
Genotypic and allele frequencies
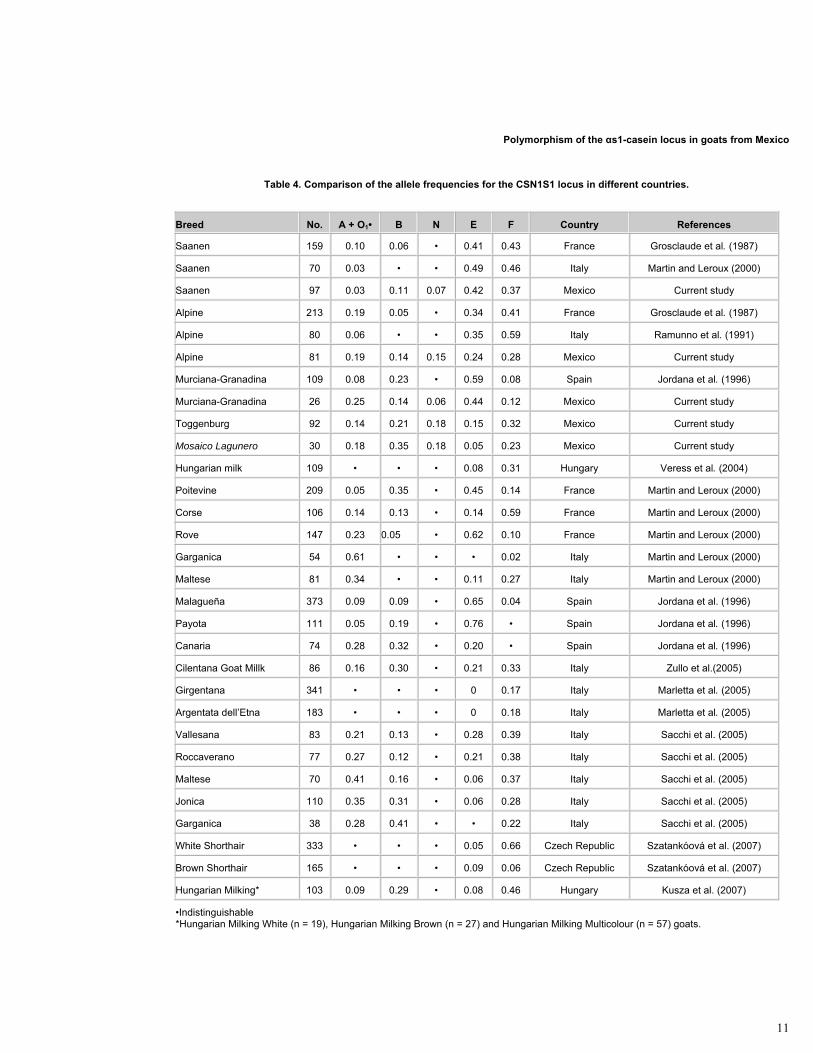
This is the first study in Mexico that contributes with results about the polymorphism of the CSN1S1 locus of goats. Previous studies indicate that in the Alpine and Saanen breeds, alleles E and F are the most frequent (about 0.40 each one), while allele A shows a smaller frequency (about 0.10) (Grosclaude et al. 1987; Ramunno et al. 1991). On the other hand, E and B alleles predominate in the Murciana-Granadina (0.59), Malagueña (0.65) and Payoya (0.76) breeds, while A and B alleles are more frequent in Canaria (A: 0.28 and B: 0.32) breed. It is important to mention that most of Spanish breeds present a low frequency of F allele (Jordana et al. 1996).
In this study it was observed a higher frequency of alleles E (0.42) and F (0.37) in the Saanen population, coinciding in general terms with the frequencies observed in France E (0.41) and F (0.43) (Grosclaude et al. 1987), and in Italy E (0.49) and F (0.46) (Martin and Leroux, 2000) (Table 4). In the Alpine population, allele F showed the higher frequency (0.28); followed by allele E (0.24). The allele F was also the most frequent in the studies from France (0.41) (Grosclaude et al. 1987) and Italy (0.59) (Ramunno et al. 1991). However, these values are somewhat higher than those obtained in this study. The Alpine population had the greater genetic diversity, reported as Hs (0.787) and, as a consequence, the larger ne (4.69). This last value is close to the maximum possible value which is 5.
For the Toggenburg population the most frequent alleles were F (0.32) and B* (0.21). Until now, it has not been found allele or genotype frequency estimates for this locus in this breed.
In this study, the higher frequencies for the local Murciana-Granadina population were for the alleles E (0.44), A* (0.25) and B* (0.14). In Spain, it was reported that the most frequent alleles for the Murciana-Granadina breed were E (0.59) and B (0.23) (Jordana et al. 1996), but the alleles A and F showed smaller values than those found in this study. These differences could have been caused by a founder effect, genetic drift or by adding a mixture with other populations. The effect of selection for milk production in the reduction of frequencies of strong alleles is another
factor that could not ruled out in causing population divergence for this locus, but so far the evidence is weak.
In the case of the Mosaico Lagunero population the higher frequency alleles were B* (0.35) and F (0.23); this population is the result of crossbreeding between local goats with Alpine, Saanen, Toggenburg and Nubian males. It is probable that this population would present about one half of strong alleles (0.53), which could be a consequence of local or Nubian influence (Montaldo and Meza, 1999). Nubian breed presents lower milk production levels than those of Alpine or Saanen breeds, but is superior in protein and fat content in the milk (Wiggans et al. 1988).
Population structure and divergence
The negative value of FIS = -0.23 (P < 0.05) in the Murciana-Granadina population, shows a heterozygote excess, which could be explained by the fact that this population is product of crossbreeding between local goats and other breeds. For the Mosaico Lagunero population, it was obtained also some evidence of an excess in heterozygotes numbers, with an FIS = -0.18 (P = 0.08) (Table 3).
In this study, the average heterozygote excess value inside each population was -0.0034, which is different from the positive values found in purebred goat populations from Italy, Morocco, France, China and Switzerland (Saitbekova et al. 1999; Yang et al. 1999; Tadlaoui et al. 2002; Sacchi et al. 2005). The positive value of FST indicates that 5.16% of the genetic variation is explained by the difference between the caprine populations. These values, despite being based on only one locus data (Nei, 1987), agree with the result of study by Sacchi et al. (2005) (FST = 6.2%) in 5 caprine breeds using four loci (αs1-casein, αs2-casein, β-casein, and κ-casein). However, Saitbekova et al. (1999) using microsatellites found a superior value in all loci for the FST index of 17%.
For the Alpine and Toggenburg populations the biggest absolute difference was for the E allele |0.094|, and for Toggenburg and Mosaico Lagunero populations the biggest absolute difference was for the B* allele |0.138|.
CONCLUDING REMARKS
Differentiation was found for this locus for most pairwise comparisons between populations.
For Saanen and Alpine populations, the frequencies of alleles E and F of the CSN1S1 locus resulted to be close to those found in France and Italy. In the local population with appearance of Murciana-Granadina, the allele frequency of A* and B* alleles agree with those reported in Spain for the Granadina-Murciana breed.
There are wide possibilities of increasing the strong frequencies using GAS in Alpine, Saanen and Toggenburg,
Torres-Vázquez, J.A. et al.
6
due to the low frequency of the strong alleles in these populations.
Evidences of crossbreeding exist in the Murciana-Granadina and Mosaico Lagunero populations. The high frequency of strong alleles in the Mosaico Lagunero population makes think on the influence of other breeds.
REFERENCES
BEVILACQUA, C.; FERRANTI, P.; GARRO, G.; VELTRI, C.; LAGONIGRO, R.; LEROUX, C.; PIETROLÀ, E.; ADDEO, F.; PILLA, F.; CHIANESSE, L. and MARTIN P. Interallelic recombination is probably responsible of the occurrence of a new as1-casein variant in the goat species. European Journal of Biochemistry, February 2002, vol. 269, no. 4, p. 1293-1303.
COSENZA, G.; PAUCIULLO, A.; GALLO, D.; COLIMORO, L.; D’AVINO, A.; MANCUSI, A. and RAMUNNO, L. Genotyping at the CSN1S1 locus by PCR-RFLP and AS-PCR in a Neapolitan goat population. Small Ruminant Research, January 2008, vol. 74, no. 1-3, p. 84-90.
DEKKERS, J.C.M. Commercial application of marker- and gene-assisted selection in livestock: Strategies and lessons. Journal of Animal Science, 2004, vol. 82, p. E313-E328.
FELIGINI, M.; FRATI, S.; CURIK, V.A.; BRAMBILLA, A.; PARMA, P.;CURIK, I.; GREPPI, G.F. and ENNE, G. Caprine αs-1-casein polymorphism: characterisation of A, B, E and F variants by means of various biochemical and molecular techniques. Food Technology and Biotechnology, April-June 2005, vol. 43, no. 2, p. 123-132.
GÓMEZ, J.Á.l; MIRALLES, B.; AGÜERA, P. and AMIGO, L. Quantitative determination of αs2- and αs-1-casein in goat’s milk with different genotypes by capillary electrophoresis. Journal of Chromatography A, October 2004, vol. 1054, p. 279-284.
GOUDET, J.; RAYMOND, M.; DE MEEÜS, T. and ROUSSET, F. Testing differentiation in diploid populations. Genetics, December 1996, vol. 144, no. 4, p. 1933-1940.
GROSCLAUDE, F.; MAHÉ, M.-F.; BRIGNON, G.; DI STASIO, L. and JEUNET, R. A Mendelian polymorphism underlying variations of goat αs-1-casein. Genetics Selection Evolution, 1987, vol. 19, no. 4, p. 399-412.
GUO, S.W. and THOMPSON, E.A. Performing the exact test of Hardy-Weinberg proportions for multiple alleles. Biometrics, June 1992, vol. 48, p. 361-372.
JORDANA, J.; AMILLS, M.; DIAZ, E.; ANGULO, C.; SERRADILLA, J.M. and SANCHEZ, A. Gene frequencies of caprine αs1-casein polymorphism in Spanish goat
breeds. Small Ruminant Research, May 1996, vol. 20, no. 3, p. 215-221.
KUSZA, S.; VERESS, G.; KUKOVICS, S.; JÁVOR, A.S.; SANCHEZ, A.; ANGIOLILLO, A. and BOSZE, Z. Genetic polymorphism of αs1- and αs2-caseins in Hungarian Milking Goats. Small Ruminant Research, April 2007, vol. 68, no. 3, p. 329-332.
MAHÉ, M.F. and GROSCLAUDE, F. αS1-CnD, another allele associated with a decreased synthesis rate at the caprine αS1-casein locus. Genetics Selection Evolution, 1989, vol. 21, no. 2, p. 127-129.
MARLETTA, D.; BORDONARO, S.; GUASTELLA, A.M.; CRISCIONE, A. and D’URSO, G. Genetic polymorphism of the calcium sensitive caseins in sicilian Girgentana and Argentata dell'Etna goat breeds. Small Ruminant Research, March 2005, vol. 57, no. 2-3, p. 133-139.
MARTIN, P. and LEROUX, C. Le gène caprin spécifiant la caséine αs-1: un suspect tout désigné aux effets aussi multiples qu’inattendus. INRA productions animales (Special issue, Molecular genetics: principles and applications in animal populations), 2000, p. 125-132.
MARTIN, P.; SZYMANOWSKA, M.; ZWIERZCHOWSKI, L. and LEROUX, C. The impact of genetic polymorphisms on the protein composition of ruminant milks. Reproduction Nutrition Development, September-October 2002, vol. 42, no. 5, p. 433-459.
MOIOLI, B.; PILLA, F. and TRIPALDI, C. Detection of milk protein genetic polymorphisms in order to improve dairy traits in sheep and goats: a review. Small Ruminant Research, March 1998, vol. 27, no. 3, p. 185-195.
MONTALDO, H.H. and MANFREDI, E. Organization of selection programs for dairy goats. In: 7th World Congress on Genetics Applied to Livestock Production. (19th-23th
August, 2002, Montpellier, France), 2002, p. 19-23.
MONTALDO, H.H. and MEZA, C.A. Genetic goat resources in Mexico: bio-economical efficiency of local and specialised genotypes. Wool Technology and Sheep Breeding, 1999, vol. 47, no. 2, paper 8, p. 184-198.
NEI, M. Molecular Evolutionary Genetics. New York; Columbia University Press, 1987. 512 p. ISBN 0231063202.
PEREZ, M.; LEROUX, C.; BONASTRE, A.S. and MARTÍN, P. Occurrence of a LINE sequence in the 3′ UTR of the goat αs1-casein E-encoding allele associated with reduced protein synthesis level. Gene, September 1994, vol. 147, no. 2, p. 179-187.
RAMUNNO, L.; RANDO, A.; DI GREGORIO, P.; MASSARI, M.; BLASI, M. and MASINA, P. Struttura

Polymorphism of the αs1-casein locus in goats from Mexico
7
genetica di alcune popolazioni caprine allevate in Italia a locus della caseina αs1. In: IX Congress Nazionales ASPA (3rd - 7th June, 1991, Milan), 1991, p. 579-589.
RAMUNNO, L.; COSENZA, G.; PAPPALARDO, M.; PASTORE, N.; GALLO, D.; DI GREGORIO, P. and MASINA, P. Identification of the goat CSN1S1F allele by means of PCR-RFLP method. Animal Genetics, October 2000, vol. 31, no. 5, p. 342.
RAMUNNO, L.; COSENZA, G.; RANDO, A.; PAUCIULLO, A.; ILLARIO, R.; GALLO, D.; DI BERARDINO, D. and MASINA, P. Comparative analysis of gene sequence of goat CSN1S1 F and N alleles and characterization of CSN1S1 transcript variants in mammary gland. Gene, January 2005, vol. 345, no. 2, p. 289-299.
RANDO, A.; RAMUNNO, L. and MASINA, P. Mutations in casein genes. Zootecnica e Nutrizione Animale, 2000, vol. 26, no. 3, p. 105-114.
RAYMOND, M. and ROUSSET, F. GENEPOP (Version 1.2): Population Genetics Software for Exact Tests and Ecumenicism. Journal of Heredity, May 1995a, vol. 86, no. 3, p. 248-249.
RAYMOND, M. and ROUSSET, F. An exact test for population differentiation. Evolution, December 1995b, vol. 49, no. 6, p. 1280-1283.
ROGATKO, A.; SLIFKER, M.J. and BABB, J.S. Hardy-Weinberg Equilibrium Diagnostics. Theoretical Population Biology, November 2002, vol. 62, no. 3, p. 251-257.
RONCADA, P.; GIVIRAGHI, A.; LIBERATORI, S.; CANAS, B. and GREPPI, G.F. Identification of caseins in goat milk. Proteomics, June 2002, vol. 2, no. 6, p. 723-726.
ROUSSET, F. and RAYMOND, M. Testing heterozygote excess and deficiency. Genetics, August 1995, vol. 140, no. 4, p. 1413-1419.
SACCHI, P.; CHESSA, S.; BUDELLI, E.; BOLLA, P.; CERIOTTI, G.; SOGLIA, D.; RASERO, R.; CAUVIN, E. and CAROLI, A. Casein haplotype structure in five Italian goat breeds. Journal of Dairy Science, April 2005, vol. 88, no. 4, p. 1561-1568.
SAGARPA. Secretaría de Agricultura Ganadería, Desarrollo Rural y Pesca. Informe sobre la Situación de los Recursos Genéticos Pecuarios en México. Claridades Agropecuarias, November 2002, vol. 111, p. 1-52.
SAITBEKOVA, N.; GAILLARD, G.; OBEXER-RUFF, G. and DOLF, G. Genetic diversity in Swiss goat breeds based on microsatellite analysis. Animal Genetics, February 1999, vol. 30, no. 1, p. 36-41 .
SÁNCHEZ, A.; ILAHI, H.; MANFREDI, E. and SERRADILLA, J.M. Potential benefit from using the αs1-
casein genotype information in a selection scheme for dairy goats. Journal of Animal Breeding and Genetics, February 2005, vol. 122, no. 1, p. 21-29.
SZATANKÓOVÁ, Z.; MÁTLAVÁ, V. and MALÁ, G. Genetic polymorphism at the CSN1S1 gene in two Czech goat breeds. Czech Journal of Animal Science, July 2007, vol. 52, no. 7, p. 199-202.
TADLAOUI, A.; BABILLIOT, J.M.; LEROUX, C. and MARTIN, P. Genetic diversity of the two main Moroccan goat breeds; phylogenetic relationships with four breeds reared in France. Small Ruminant Research, September 2002, vol. 45, no. 3, p. 225-233.
VERESS, G.; KUSZA, S.; BÖSZE, Z.; KUKOVICS, S. and JÁVOR, A. Polymorphism of the αs-1-casein, κ-casein and β-lactoglobulin genes in the Hungarian Milk Goat. South African Journal of Animal Science, 2004, vol. 34, no. 5, p. 20-23.
WIGGANS, G.R.; VAN DIJK, J.W.J. and MISZTAL, I. Genetic evaluation of dairy goats for milk and fat yield with an animal model. Journal of Dairy Science, May 1988, vol. 71, no. 5, p. 1330-1337.
WEIR, B.S. and COCKERHAM, C.C. Estimating F-statistics for the analysis of population structure. Evolution, November 1984, vol. 38, no. 6, p. 1358-1370.
YANG, L.; ZHAO, S.H.; LI, K.; PENG, Z.Z. and MONTGOMERY, G.W. Determination of genetic relationships among five indigenous Chinese goat breeds with six microsatellite markers. Animal Genetics, December 1999, vol. 30, no. 6, p. 452-455.
ZULLO, A.; BARONE, C.M.A.; CHIANESE, L.; COLATRUGLIO, P.; OCCIDENTE, M. and MATASSINO, D. Protein polymorphisms and coagulation properties of Cilentana goat milk. Small Ruminant Research, June 2005, vol. 58, no. 3, p. 223-230.
Note: Electronic Journal of Biotechnology is not responsible if on-line references cited on manuscripts are not available any more after the date of publication. Supported by UNESCO / MIRCEN network.

Torres-Vázquez, J.A. et al.
8
APPENDIX TABLES
Table 1. Observed genotypes at CSN1S1 locus of goats from Mexico.
Observed genotypes Saanen Alpine Toggenburg Appearance of Murciana-Granadina Mosaico Lagunero
A*A* 0.000 0.025 0.011 0.000 0.000
A*B* 0.000 0.062 0.076 0.154 0.267
A*N 0.010 0.062 0.098 0.038 0.067
A*E 0.021 0.074 0.043 0.269 0.000
A*F 0.031 0.123 0.043 0.038 0.033
B*B* 0.010 0.025 0.011 0.000 0.000
B*N 0.021 0.037 0.065 0.000 0.167
B*E 0.021 0.074 0.022 0.115 0.033
B*F 0.155 0.062 0.239 0.000 0.233
NN 0.031 0.062 0.033 0.000 0.033
NE 0.031 0.074 0.076 0.077 0.033
NF 0.021 0.012 0.054 0.000 0.033
EE 0.216 0.049 0.043 0.115 0.000
EF 0.330 0.160 0.065 0.192 0.033
FF 0.103 0.099 0.120 0.000 0.067
TOTAL 1.000 1.000 1.000 1.000 1.000
CSN1S1 A* = A, G, H, I, O1, O2; CSN1S1 B* = B1, B2, B3, B4, C, L.

Polymorphism of the αs1-casein locus in goats from Mexico
9
Table 2. Allelic frequencies at the CSN1S1 locus, observed heterozygosity (Ho), expected heterozygosity (Hs), and the effective number of alleles (ne) for population.
Population GENEPOP P value*
HWDIAG P value**
Fixation index FIS***
Heterozygote deficiency
P value
Heterozygote excess P value
Saanen 0.0011a 0.0000a 0.0512 0.0549 0.9460
Alpine 0.1583b 0.3365b 0.0645 0.0903 0.8970
Toggenburg 0.0032a 0.0000a 0.0003 0.4853 0.5076
Appearance of Murciana-Granadina 0.4990 b 0.0234a -0.2326 0.9957 0.0191
Mosaico Lagunero 0.0788 b 0.0140a -0.1783 0.9347 0.0800
*HWE Test (GENEPOP version 3.4). **HWE Test (HWDIAG version 1.beta). ***Fixation index (Weir and Cockerham, 1984). a Population in Hardy-Weinberg disequilibrium. bPopulations in Hardy-Weinberg equilibrium.

Torres-Vázquez, J.A. et al.
10
Table 3. Obtained results of the programs for testing heterozygote excess and deficiency, FIS and Hardy-Weinberg equilibrium test.
Allele
Population A* B* N E F
Ho Hs ne
Saanen 0.031 0.108 0.072 0.418 0.371 0.639 0.670 3.031
Alpine 0.185 0.142 0.154 0.241 0.278 0.741 0.787 4.686
Toggenburg 0.141 0.212 0.179 0.147 0.321 0.783 0.779 4.516
Appearance of Murciana-Granadina 0.250 0.135 0.058 0.442 0.115 0.885 0.707 3.414
Mosaico Lagunero 0.183 0.350 0.183 0.050 0.233 0.900 0.753 4.055
CSN1S1 A* = A, G, H, I, O1, O2; CSN1S1 B* = B1, B2, B3, B4, C, L. 1.- Hscorresponds to the expected heterozygosity (Hs = 1 – Σxi2). 2.- Ho corresponds to the observed heterozygosity. 3.- ne corresponds to the effective number of alleles (ne = 1 / Σxi2).
Polymorphism of the αs1-casein locus in goats from Mexico
11
Table 4. Comparison of the allele frequencies for the CSN1S1 locus in different countries.
Breed No. A + O1• B N E F Country References
Saanen 159 0.10 0.06 • 0.41 0.43 France Grosclaude et al. (1987)
Saanen 70 0.03 • • 0.49 0.46 Italy Martin and Leroux (2000)
Saanen 97 0.03 0.11 0.07 0.42 0.37 Mexico Current study
Alpine 213 0.19 0.05 • 0.34 0.41 France Grosclaude et al. (1987)
Alpine 80 0.06 • • 0.35 0.59 Italy Ramunno et al. (1991)
Alpine 81 0.19 0.14 0.15 0.24 0.28 Mexico Current study
Murciana-Granadina 109 0.08 0.23 • 0.59 0.08 Spain Jordana et al. (1996)
Murciana-Granadina 26 0.25 0.14 0.06 0.44 0.12 Mexico Current study
Toggenburg 92 0.14 0.21 0.18 0.15 0.32 Mexico Current study
Mosaico Lagunero 30 0.18 0.35 0.18 0.05 0.23 Mexico Current study
Hungarian milk 109 • • • 0.08 0.31 Hungary Veress et al. (2004)
Poitevine 209 0.05 0.35 • 0.45 0.14 France Martin and Leroux (2000)
Corse 106 0.14 0.13 • 0.14 0.59 France Martin and Leroux (2000)
Rove 147 0.23 0.05 • 0.62 0.10 France Martin and Leroux (2000)
Garganica 54 0.61 • • • 0.02 Italy Martin and Leroux (2000)
Maltese 81 0.34 • • 0.11 0.27 Italy Martin and Leroux (2000)
Malagueña 373 0.09 0.09 • 0.65 0.04 Spain Jordana et al. (1996)
Payota 111 0.05 0.19 • 0.76 • Spain Jordana et al. (1996)
Canaria 74 0.28 0.32 • 0.20 • Spain Jordana et al. (1996)
Cilentana Goat Millk 86 0.16 0.30 • 0.21 0.33 Italy Zullo et al.(2005)
Girgentana 341 • • • 0 0.17 Italy Marletta et al. (2005)
Argentata dell’Etna 183 • • • 0 0.18 Italy Marletta et al. (2005)
Vallesana 83 0.21 0.13 • 0.28 0.39 Italy Sacchi et al. (2005)
Roccaverano 77 0.27 0.12 • 0.21 0.38 Italy Sacchi et al. (2005)
Maltese 70 0.41 0.16 • 0.06 0.37 Italy Sacchi et al. (2005)
Jonica 110 0.35 0.31 • 0.06 0.28 Italy Sacchi et al. (2005)
Garganica 38 0.28 0.41 • • 0.22 Italy Sacchi et al. (2005)
White Shorthair 333 • • • 0.05 0.66 Czech Republic Szatankóová et al. (2007)
Brown Shorthair 165 • • • 0.09 0.06 Czech Republic Szatankóová et al. (2007)
Hungarian Milking* 103 0.09 0.29 • 0.08 0.46 Hungary Kusza et al. (2007)
•Indistinguishable *Hungarian Milking White (n = 19), Hungarian Milking Brown (n = 27) and Hungarian Milking Multicolour (n = 57) goats.