Embed Size (px)
Citation preview

Charles University in Prague
Faculty of Mathematics and Physics
DOCTORAL THESIS
Milan Klicpera
Electron properties of the substitutedcerium compounds
Department of Condensed Matter Physics
Supervisor of the doctoral thesis: Pavel Javorsky
Study programme: Physics
Specialization: F3
Prague 2015

Dedication
I would like to express my great gratitude to the supervisor of my Ph.D.thesis - Pavel Javorsky. His support during my studies and knowledge of the fieldwere truly invaluable. He taught me how to prepare sample and measure thephysical properties on it, including the neutron diffraction experiments, as wellas to interpret the results of such the measurements and publish them in peerreviewed journals. He was always willing to help me with any problem I facedand always with the enthusiasm and readiness.
I would also like to acknowledge the support and assistance given me by mycolleagues on the Department of Condensed Matter Physics during my studieson this department. The regular meetings to improve the knowledge of the fieldof interest and to solve any difficulty as well as the promptness of my colleaguesto help were very inspiring.
I acknowledge the help of Jirı Pospısil and Michal Valiska with the prepara-tion of the single crystals and their characterization. Great thanks belong alsoto Marie Kratochvılova for her introducing me to the problematic of electronmicroscopy and EDX technique as well as for her cooperation during our stud-ies. I highly appreciate my colleagues, Jirı Kastil, Jan Fikacek and Petr Cermak,for their assistance with everyday problems, measurements and for comfortableatmosphere in our office. The special thanks belong to Petr Dolezal for the col-laboration on many tasks and all kind of work he did in Prague during last yearof my Ph.D. studies.
I am very grateful to Martin Boehm, supervisor of my work in Institut Laue-Langevin, Grenoble, France, for his guidance while commissioning the ThALESinstrument as well as for the introduction to the triple-axis-spectroscopy prob-lematic. He made my stay in ILL as comfortable as possible, always willing tohelp me.
I want to thank also my colleagues in ILL, especially, Jirı Kulda, Paul Steffens,Simon Holbain, Karin Schmalzl, Andrea Piovano and many others for their helpwith my integration into the TAS group as well as into the ILL everyday life.
I would like to thank also instrument scientists who helped me not only withthe neutron experiments realization, but often also with the data treatment:Devashibhai T. Adroja (MARI and IRIS, ISIS, Didcot), Michael Marek Koza(IN6, ILL, Grenoble), Bachir Ouladdiaf (D10, CYCLOPS and Orient Express,ILL, Grenoble), Andreas Hoser (E6, HZB, Berlin), Ines Puente Orench (D1B,ILL, Grenoble), Astrid Schneidewind and Petr Cermak (PANDA, MLZ, Garch-ing), Stephane Rols (IN4c, ILL, Grenoble) and Martin Boehm and Paul Steffens(ThALES, ILL, Grenoble).
This thesis is dedicated to my parents, Svetlana and Milan, for their love,endless support and encouragement during my studies.


I declare that I carried out this doctoral thesis independently, and only with thecited sources, literature and other professional sources.
I understand that my work relates to the rights and obligations under the ActNo. 121/2000 Coll., the Copyright Act, as amended, in particular the fact thatthe Charles University in Prague has the right to conclude a license agreementon the use of this work as a school work pursuant to Section 60 paragraph 1 ofthe Copyright Act.
In ........................ date ................ signature of the author


Nazev prace: Elektronove vlastnosti substituovanych cerovych sloucenin
Autor: Milan Klicpera
Katedra: Katedra fyziky kondenzovanych latek
Vedoucı disertacnı prace: doc. Mgr. Pavel Javorsky Dr.
Abstrakt: Predmetem teto prace je studium vibronovych stavu v tetragonalnıchslouceninach CeCuAl3 a CePd2Al2 a jejich vyvoj se substitucı jednotlivych prvku.Prıprava monokrystalickych a polykrystalickych vzorku byla nasledovana jejichchemickou a strukturnı charakterizacı. Na vzorcıch byly pozorovany strukturnı,magneticke a supravodive fazove prechody; a nasledne dukladne studovany. Zasad-nı experimenty byly provedeny s vyuzitım pruzneho a nepruzneho neutronovehorozptylu. Zıskana data umoznila urcit magneticke struktury sloucenin CeCuAl3,CePd2Al2 a CePd2Ga2. Energeticka spektra substituovanych sloucenin ze seriıCe(Cu,Al)4 a CePd2(Al,Ga)2 umoznila prımo pozorovat vyvoj krystaloveho polea jeho interakce s fonony ve studovanych slouceninach.
Klıcova slova: intermetalicke slouceniny ceru, vibronove stavy, elektronove vlast-nosti, neutronovy rozptyl
Title: Electron properties of the substituted cerium compounds
Author: Milan Klicpera
Department: Department of Condensed Matter Physics
Supervisor: doc. Mgr. Pavel Javorsky Dr.
Abstract: The subject of this work is the study of vibron states in tetragonalCeCuAl3 and CePd2Al2 compounds and their development with the substitutionof constituent elements. After the preparation of single crystals and polycrys-talline samples, the careful chemical and structural characterization was done.The structural, magnetic and superconducting phase transitions in samples wereobserved and thoroughly investigated. The crucial experiments were performedusing the elastic and inelastic neutron scattering techniques leading to the refine-ment of magnetic structures in CeCuAl3, CePd2Al2 and CePd2Ga2. The energyspectra of substituted Ce(Cu,Al)4 and CePd2(Al,Ga)2 compounds were studiedas well allowing to determine the crystal field excitations and their interactionwith phonons (vibron states) in these materials.
Keywords: Ce-internetallic compounds, vibron states, electronic properties, neu-tron scattering


Contents
Introduction 3
1 Theoretical background 51.1 Materials with 4f electrons . . . . . . . . . . . . . . . . . . . . . 51.2 Crystalline electric field . . . . . . . . . . . . . . . . . . . . . . . . 61.3 Magnetic structure of material . . . . . . . . . . . . . . . . . . . . 81.4 Cerium and Ce-based compounds . . . . . . . . . . . . . . . . . . 9
2 Experimental techniques 132.1 Sample preparation . . . . . . . . . . . . . . . . . . . . . . . . . . 132.2 Structure and chemical characterization . . . . . . . . . . . . . . . 14
2.2.1 Energy dispersive X-ray analysis . . . . . . . . . . . . . . . 152.2.2 Diffraction techniques . . . . . . . . . . . . . . . . . . . . 162.2.3 Differential scanning calorimetry . . . . . . . . . . . . . . 18
2.3 Magnetization measurements . . . . . . . . . . . . . . . . . . . . . 192.4 Specific heat . . . . . . . . . . . . . . . . . . . . . . . . . . . . . . 202.5 Electrical resistivity . . . . . . . . . . . . . . . . . . . . . . . . . . 222.6 Neutron scattering . . . . . . . . . . . . . . . . . . . . . . . . . . 23
2.6.1 Neutron diffraction . . . . . . . . . . . . . . . . . . . . . . 242.6.2 Inelastic neutron scattering . . . . . . . . . . . . . . . . . 26
3 Vibron states 333.1 Vibron states in CeAl2 . . . . . . . . . . . . . . . . . . . . . . . . 333.2 Tetragonal CeTX3 compounds and vibron state in CeCuAl3 . . . 34
4 Results and discussion 394.1 CeCuAl3 and CeTX3 compounds . . . . . . . . . . . . . . . . . . 39
4.1.1 Crystal structure in CeTX3 compounds . . . . . . . . . . . 394.1.2 Crystal structure of CeCuAl3 . . . . . . . . . . . . . . . . 414.1.3 Bulk properties of CeCuAl3 single crystal . . . . . . . . . . 484.1.4 Magnetic structure in CeCuAl3 . . . . . . . . . . . . . . . 554.1.5 Inelastic scattering on CeCuAl3 single crystal . . . . . . . 634.1.6 Crystal field excitations in Ce(Cu,Al)4 compounds . . . . . 65
4.2 CePd2Al2 and CeT2X2 compounds . . . . . . . . . . . . . . . . . 734.2.1 CePd2Al2 single crystal . . . . . . . . . . . . . . . . . . . . 754.2.2 Physical properties of CePd2(Al,Ga)2 compounds . . . . . 804.2.3 Magnetic structures of CePd2Al2 and CePd2Ga2 . . . . . . 914.2.4 Vibron states in (Ce,La)Pd2(Al,Ga)2 . . . . . . . . . . . . 96
Conclusions 107
Bibliography 109
List of Tables 117
List of Abbreviations 119
1

2
Introduction
The Ce-based intermetallic compounds stay in the foreground of interest alreadyseveral decades for their often uncommon and surprising behavior, especially inlow-temperature region. The only one 4f electron shielded by 5d and 6s electronorbitals together with the influence of crystal electric field (CEF) stay behindthe physical properties as magnetic ordering at very low temperatures, valencefluctuations, heavy-fermion behavior or unconventional superconductivity. An-other highly interesting phenomenon was found in several Ce-based materials:the inelastic neutron scattering energy spectra display an additional peak whichcannot be described in terms of pure crystal field splitting. The first observationof such a peak was done on cubic CeAl2 compound and the physical model wasintroduced to describe it soon after [1]. The Thalmaier-Fulde model is basedon a strong CEF exciton-phonons coupling in the compound, which results ina new quantum quasi-bound state, so called vibron state, revealing itself as anadditional peak in the energy spectra of a compound [1].
A strong magneto-elastic coupling of the 4f electrons resulting in a formationof vibron state was observed only in a very few intermetallic compounds, e.g.PrNi2 [2], CePd2Al2 [3] or CeCuAl3 [4]. The vibron state in latter two materialswas observed quite recently and, in contrast with previous compounds, CePd2Al2and CeCuAl3 crystallize in the tetragonal crystal structure. The broad study ofthese two compounds and their substitutions by means of magnetic, transportand mainly neutron scattering experiments forms the content of this thesis.
The main idea of the study is to follow the development of vibron states withthe substitution of constituent elements in CeCuAl3 and CePd2Al2 compoundsand to find out the relation between the presence/development/absence of vibronstates and another microscopic and also macroscopic properties of these materials.In the same time, we investigate the crystal and magnetic structure of studiedcompounds and their development with temperature variation. A broad field ofexperimental methods was used and their descriptions are included in the thesistogether with a comprehensive comparison of results with another representativesof tetragonal Ce-based compounds.
The first chapter contains a brief introduction to the problematic of ceri-um atom and Ce-based intermetallic compounds. The description of experimen-tal methods used during the study follows in chapter 2. Most of the methodsare commonly known and frequently used in condensed matter physic research.Therefore, we focus on techniques allowing the preparation of studied compoundsas well as their structure and chemical characterization. At the end of chapter 2,we describe the neutron scattering theory and experiments in more details asthese experiments were essential for our understanding of properties of studiedcompounds.
Chapter 3 consists of previous results on the Ce-based compounds belong-ing to the same family as CeCuAl3 and CePd2Al2. This chapter also gives thedescription of vibron states in CeAl2 and CeCuAl3 compounds. The followingchapter 4 then contains the main part of the thesis. It comprises every phaseof the study on investigated compounds starting from the sample preparation,through the structure and chemical characterization, the measurement of basic
3

bulk properties and culminates with the neutron scattering experiments. Thechapter 4 is moreover divided into two parts, where first of them contains theoutcome concerning CeCuAl3 compound and its substitutions and second onethen consists of the results obtained on CePd2Al2 single crystal and Al-Ga sub-stituted compounds. The appropriate discussion is given for each part of thethesis. The short conclusive chapter then summarizes main results of the study.
The thesis does not contain the results on several substituted compoundsinvestigated in course of Ph.D. studies of the author. The investigations ofstructural and bulk magnetic properties of Ce(Cu,Au)Al3 and CeCu(Al,Ga)3 se-ries, superconductivity of LaPd2(Al,Ga)2 compounds or pressure experiments onCePd2(Al,Ga)2 compounds are not included in the thesis to increase its read-ability and clarity. These results are summarized in our papers listed within thethesis and summarized at the end of thesis.
4
1. Theoretical background
1.1 Materials with 4f electrons
The chemical elements with partially filled 4f shell attract an attention alreadyseveral decades. 4f metals belong between elements with natural magnetic order,together with transition d-metals and 5f elements. They are often called rare-earth metals or lanthanides, although e.g. La does not contain any f -electron.On the other hand, we can consider the lanthanum, to some extent, for the 4felement with empty 4f shell. It could be very convenient in cases, where thenon-magnetic analogue of 4f element-based metal is needed for the estimation ofphysical properties bounded with the crystal lattice.
The magnetic properties of 4f elements are strongly influenced by the numberof electrons in 4f shell. The same applies for the ionic radius of these elements:so called lanthanide contraction takes place in these materials. The ionic ra-dius decreases with increasing atomic number (number of electrons in 4f shell).Nevertheless, lanthanides exhibit very similar chemical properties externally. Areason behind such a behavior is found in the electronic structure of these el-ements. Compared to the transition d-metal, where d-electrons form the lastelectron shell (where the nuclei is in the center of atom), in the case of rare-earth elements, 4f shell is shielded by outermost 5s and 5p orbitals. Such anelectronic structure stays behind above mentioned properties of 4f elements andhas a great impact on their magnetic properties. Well shielded 4f electrons lo-calized relatively close to the nuclei interact with other atoms indirectly, only.Ruderman-Kittel-Kasuya-Yosida interaction (RKKY) considering the hybridiza-tion of 4f states with spins of conduction electrons is generally responsible forthe magnetic ordering in rare-earth based materials. Nevertheless, one shouldtake into account also other indirect interactions as superexchange interactionin oxides and fluorides or exchange interaction between 5d states of rare-earthelement and other element d-states.
The magnetism in the materials based on rare earth ions is theoretically welldescribed by Hund’s rules. As we use the effective magnetic moment, µeff , quiteoften in the thesis, we remind to the reader its definition:
µeff = gJ√J(J − 1)µB. (1.1)
gJ is Lande factor reflecting mutual orientation of total angular momentum J ,orbital momentum L and spin momentum S in real space (see Figure 1.1) definedas:
gJ = 1 +J(J + 1) + S(S + 1)− L(L+ 1)
2J(J + 1). (1.2)
J = |L−S| for 4f shell filled from less than one half, J = L+S for more than half-filled 4f shell. µB is then the electron magnetic dipole moment usually called Bohrmagneton. Such a definition of µeff is valid for the material in the paramagneticstate and in non-zero external magnetic field. The randomly oriented magneticmoments are influenced by applied field leading to the non-zero magnetic momentof the material. µeff for Ce3+ free ion is equal to 2.54 µB.
5
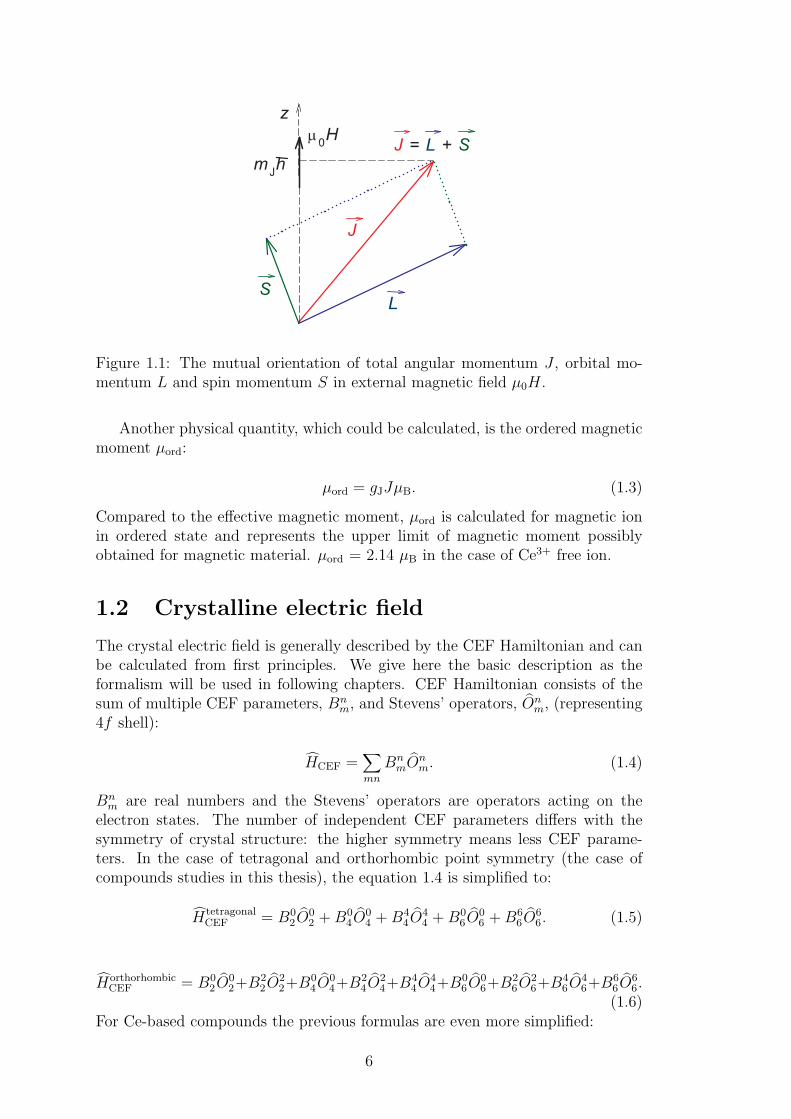
Figure 1.1: The mutual orientation of total angular momentum J , orbital mo-mentum L and spin momentum S in external magnetic field µ0H.
Another physical quantity, which could be calculated, is the ordered magneticmoment µord:
µord = gJJµB. (1.3)
Compared to the effective magnetic moment, µord is calculated for magnetic ionin ordered state and represents the upper limit of magnetic moment possiblyobtained for magnetic material. µord = 2.14 µB in the case of Ce3+ free ion.
1.2 Crystalline electric field
The crystal electric field is generally described by the CEF Hamiltonian and canbe calculated from first principles. We give here the basic description as theformalism will be used in following chapters. CEF Hamiltonian consists of thesum of multiple CEF parameters, Bn
m, and Stevens’ operators, Onm, (representing
4f shell):
HCEF =∑
mn
BnmO
nm. (1.4)
Bnm are real numbers and the Stevens’ operators are operators acting on the
electron states. The number of independent CEF parameters differs with thesymmetry of crystal structure: the higher symmetry means less CEF parame-ters. In the case of tetragonal and orthorhombic point symmetry (the case ofcompounds studies in this thesis), the equation 1.4 is simplified to:
HtetragonalCEF = B0
2O02 + B0
4O04 +B4
4O44 +B0
6O06 + B6
6O66. (1.5)
HorthorhombicCEF = B0
2O02+B2
2O22+B0
4O04+B2
4O24+B4
4O44+B0
6O06+B2
6O26+B4
6O46+B6
6O66.
(1.6)For Ce-based compounds the previous formulas are even more simplified:
6
Htetragonal−CeCEF = B0
2O02 + B0
4O04 + B4
4O44, (1.7)
Horthorhombic−CeCEF = B0
2O02 + B2
2O22 + B0
4O04 + B2
4O24 + B4
4O44, (1.8)
as the Stevens operators O6 are zero.Localized character of 4f electrons stays behind a very similar physical prop-
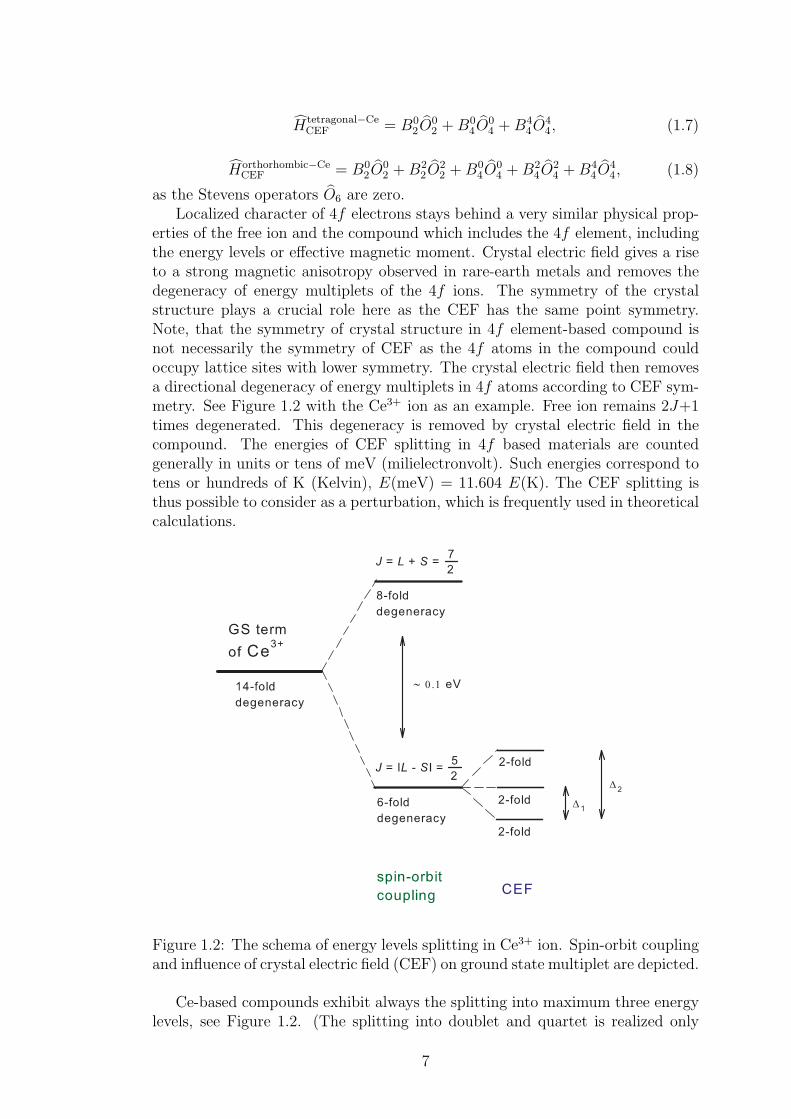
erties of the free ion and the compound which includes the 4f element, includingthe energy levels or effective magnetic moment. Crystal electric field gives a riseto a strong magnetic anisotropy observed in rare-earth metals and removes thedegeneracy of energy multiplets of the 4f ions. The symmetry of the crystalstructure plays a crucial role here as the CEF has the same point symmetry.Note, that the symmetry of crystal structure in 4f element-based compound isnot necessarily the symmetry of CEF as the 4f atoms in the compound couldoccupy lattice sites with lower symmetry. The crystal electric field then removesa directional degeneracy of energy multiplets in 4f atoms according to CEF sym-metry. See Figure 1.2 with the Ce3+ ion as an example. Free ion remains 2J+1times degenerated. This degeneracy is removed by crystal electric field in thecompound. The energies of CEF splitting in 4f based materials are countedgenerally in units or tens of meV (milielectronvolt). Such energies correspond totens or hundreds of K (Kelvin), E(meV) = 11.604 E(K). The CEF splitting isthus possible to consider as a perturbation, which is frequently used in theoreticalcalculations.
Figure 1.2: The schema of energy levels splitting in Ce3+ ion. Spin-orbit couplingand influence of crystal electric field (CEF) on ground state multiplet are depicted.
Ce-based compounds exhibit always the splitting into maximum three energylevels, see Figure 1.2. (The splitting into doublet and quartet is realized only
7
for the cubic structure.) The reason for such a splitting is found in quantummechanics. Kramer’s theorem of degeneracy says, that all energy levels in time-reversal invariant systems have to be double degenerated, i.e. if eigenstate of theHamiltonian with energy E exists, there must be another state with the sameenergy E. Kramer’s theorem is valid for all systems with an odd total numberof fermions (it includes free ion or a system with odd number of electrons). Theexternal magnetic field removes the degeneracy of energy levels.
The CEF parameters, Bnm, and corresponding energy levels splitting are quite
routinely calculated from point charge model and known crystal structure ofcompound. CEF parameters determined from the measurement (e.g. inelasticneutron scattering or magnetic susceptibility) are the same as theoretical onesin ideal case. In real materials, we observe small differences due to non-idealdistribution of elements and other defects in the crystal. The great importancehas the valence state of the 4f element. Cerium ion exhibits usually valencenumber 3+, but it can loose one electron and become Ce4+. The same appliese.g. for Yb2+ → Yb3+. The valence state is generally not the same for all ions(of the same element) in the compound leading to the non-integer value, whichcould be easily sample dependent.
1.3 Magnetic structure of material
Mutual magnetic interactions between ions with not-fully filled electron shell maylead to their regular arrangement. The magnetic order can, however, occur onlyat sufficiently low temperatures where magnetic interactions outweigh the ther-mal fluctuations in the material. Above the magnetic ordering temperature thecompounds behave as paramagnets, below ordering temperature several magnet-ic orders could be realized: ferromagnetic, antiferromagnetic and ferrimagnetic(i.e. uncompensated antiferromagnetic) order. The temperature of the transitionfrom paramagnetic to ordered state is called Curie Temperature, TC, for ferro-magnet and Neel temperature, TN, for antiferromagnet. The magnetic dipolesare identically oriented in ferromagnet, whereas more complicated magnetic mo-ment arrangements can be found in antiferromagnetically ordered material. Themagnetic dipoles in antiferromagnet could be reoriented by external magneticfield (typically quite strong) which leads to the metamagnetic transition to theferromagnetic state.
The arrangement of magnetic moments in the compound (at temperatureslower than TC or TN) is periodic and forms its magnetic structure. The magneticstructure can be easily related to the crystal structure of the compound. Thecrystallographic unit cell is the smallest possible unit cell of magnetic structure.For the ferromagnetic material, the crystallographic and magnetic unit cell coin-cide as all the magnetic moments are oriented to the identical direction in space.The different directions of magnetic moments in the antiferromagnet then oftenlead to larger magnetic unit cell. One can introduce the ratio between crystallo-graphic and magnetic unit cell, so called propagation vector of magnetic structure~k. The components of propagation vector are determined as the ratio betweenthe size of crystallographic and magnetic unit cell in appropriate direction. Whenboth unit cells are identical, propagation vector ~k = (0, 0, 0).
The introduction of propagation vector is of great importance as ~k is the
8
vector of reciprocal space and can be used in scattering theory formalism. Themagnetic moment on jth atom in the unit cell is described as:
µj =∑
~k~mj,~ke
−i~k.~T , (1.9)
where ~mj,~k is a complex basis vector directly determined from propagation vector
and position of the jth atom in the unit cell. ~T is the lattice translation vectorassociated with the position of the magnetic moment. Summation is done over allsets of ~k-vectors as the magnetic structure could be described by more than onepropagation vector. Generally, the magnetic structure could be very complex,including incommensurate (the magnetic structure is not commensurate with thecrystallographic one) or modulated structures described by propagation vectorswith irrational components.
The equation 1.9 is significantly simplified in case when the ~mj,~k is real. Mag-netic moment µj have to be real as it is the physical quantity. Therefore theimaginary part of exponential must (i) equal to zero or (ii) cancel each oth-er with imaginary part of exponential corresponding to the propagation vector−~k. The first scenario is realized for simple magnetic structures and implies thecommensurate magnetic structure, the second one then assumes two propagationvectors: ~k and −~k and leads to amplitude modulated magnetic structure.
The detailed description of magnetic structure formalism as well as the deter-mination of magnetic structures using the neutron diffraction techniques couldbe found e.g. in Ref. [5].
1.4 Cerium and Ce-based compounds
The cerium atom with electron configuration [Xe] 4f 15d16s2 represents very spe-cial case among the rare-earth elements. Only one 4f electron screened by outer-most 5s and 5p orbitals stays behind unique and often exotic physical propertiesof Ce and Ce-based compounds. Although the 4f electron is shielded by outer-most electron levels, the influence of magnetic field, temperature, pressure and/orchemical pressure on compound could lead to the transition of 4f electron fromits localized state to the conduction band. The valence number of the ion is thenchanged from Ce3+ to Ce4+ and cerium becomes non-magnetic. Together withthe loss of magnetic moment, also the crystal electric field is changed. Moreover,the real sample is not ideal as it contains defects and stoichiometry variations.Also the crystal structure itself (its symmetry) may cause the occupation of someatomic positions preferentially with Ce3+ and other positions with Ce4+. Suchelectron configuration in the compound is called mixed-valence state and could beeffectively detected by microscopic measurements, e.g. neutron scattering tech-niques allow to distinguish between atomic sites with different values of magneticmoments. The cases, when the both configurations have non-zero probabilityand ions are varying between them, are referred to as a valence-fluctuating state.The average life time of each configuration is so short that most experiments can-not distinguish between them. The compound then reveals a non-integer valencestate.
9

The consequences of valence state instability of Ce lead to significant changesin physical properties among Ce-based compounds. Often, the compounds exhibita mixture of Ce3+ and Ce4+ ions. If the content of 4+ valence ions reaches certainvalue, the magnetic ordering is lost and the compound stays non-magnetic evenat very low temperatures. The situation, when the total valence of cerium ionsin the compound subtle differs from 3+, happens quite often: the compoundorders magnetically, usually at low temperature, and exhibits properties oftenquite different from these expected for purely magnetic compound.
Figure 1.3: The schema of Kondo singlet. A weak coupling at high temperature,and a strong coupling at low temperature are demonstrated.
The two mechanisms compete in Ce-based compounds frequently: (i) the in-teraction leading to the magnetic order, generally of RKKY type, and (ii) so calledKondo interaction (see Refs. [6] and [7] for detailed description). The conductionelectrons scatter on the localized magnetic moments in the metal, which leads tothe formation of electron singlets (see Figure 1.3). The Kondo singlet consistsfrom one 4f electron and one conduction electron with oppositely oriented spin,the magnetic moment of whole singlet is equal to zero. However, the couplingbetween electrons is only weak at high temperature (the conduction electronspass by magnetic electron with the Fermi velocity vF) and becomes stronger withdecreasing temperature, see Figure 1.3. A typical behavior bounded with Kondosinglet creation in the compound can be traced: the logarithmic temperaturedependence of the electrical resistivity, reduced sizes of the magnetic momentsin the magnetically ordered and paramagnetic state or strongly enhanced Pauliparamagnetic susceptibility and electronic coefficient of the specific heat.
The competition between RKKY and Kondo interaction in the compound canbe tentatively described by Doniach’s diagram [8], see Figure 1.4. The strengthof interactions is marked as TRKKY and TK, respectively, where the energy foreach interaction could be expressed as:
kBTRKKY ≈ J2exn(EF), (1.10)
10
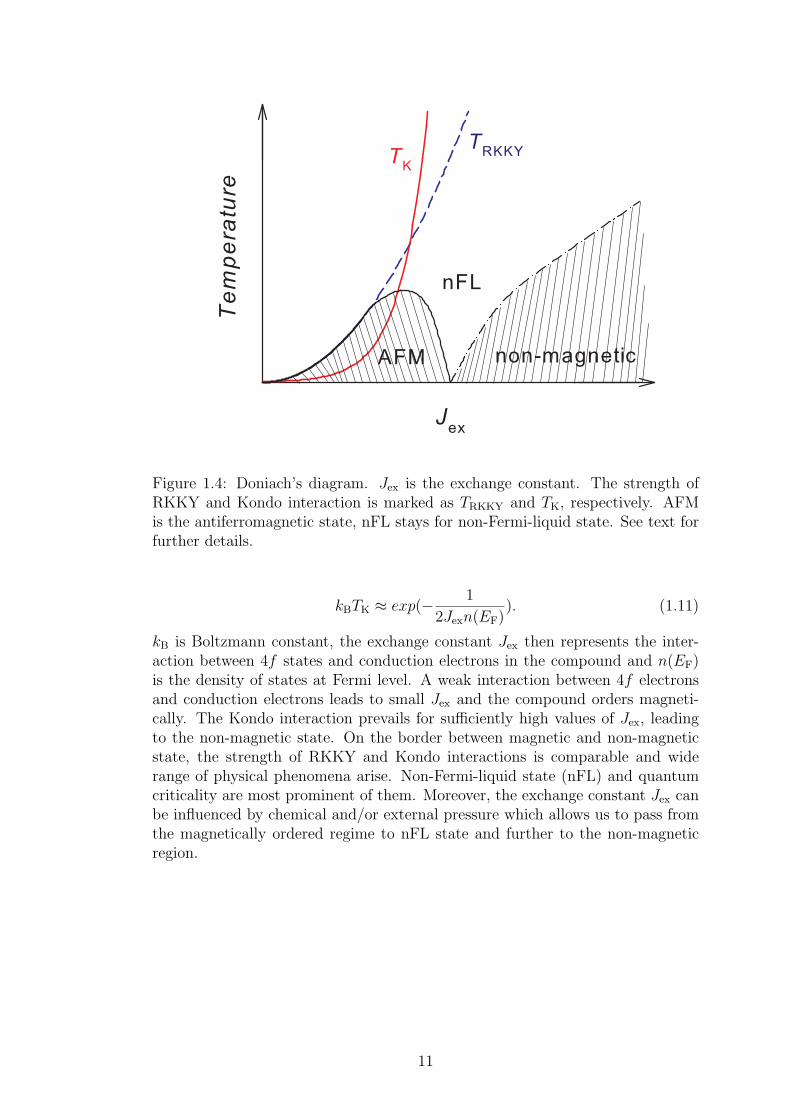
Figure 1.4: Doniach’s diagram. Jex is the exchange constant. The strength ofRKKY and Kondo interaction is marked as TRKKY and TK, respectively. AFMis the antiferromagnetic state, nFL stays for non-Fermi-liquid state. See text forfurther details.
kBTK ≈ exp(− 1
2Jexn(EF)). (1.11)
kB is Boltzmann constant, the exchange constant Jex then represents the inter-action between 4f states and conduction electrons in the compound and n(EF)is the density of states at Fermi level. A weak interaction between 4f electronsand conduction electrons leads to small Jex and the compound orders magneti-cally. The Kondo interaction prevails for sufficiently high values of Jex, leadingto the non-magnetic state. On the border between magnetic and non-magneticstate, the strength of RKKY and Kondo interactions is comparable and widerange of physical phenomena arise. Non-Fermi-liquid state (nFL) and quantumcriticality are most prominent of them. Moreover, the exchange constant Jex canbe influenced by chemical and/or external pressure which allows us to pass fromthe magnetically ordered regime to nFL state and further to the non-magneticregion.
11

12

2. Experimental techniques
The experimental techniques described in this chapter were used during our studyof CeCuAl3, CePd2Al2 and their substitutions. We prepared and characterizedall the samples by ourself on the ground of Department of Condensed MatterPhysics. The basic magnetization and transport measurements were performed inMagnetism and Low Temperatures Laboratories, MLTL (http://mltl.eu/), whichare supported within the program of Czech Research Infrastructures (project no.LM2011025). The experiments with the usage of neutron scattering were doneon instruments in neutron facilities as stated below.
2.1 Sample preparation
The studied poly- and single- crystalline samples were prepared from high puri-ty elements, see Table 2.1, in relatively large amount (tens and units of grams,respectively) mainly because of needs of neutron scattering experiments. Thepollycrystals were prepared by arc-melting of pure elements in appropriate sto-ichiometry. In the case of compounds with gallium, 0.5% of Ga was added toaccount for its higher evaporation. The melting process took place under protec-tion of an argon atmosphere. The water-cooled tungsten electrode and coppercrucible were used. All the samples (maximal weight of 2 g) were four timesflipped and remelted to ensure good homogeneity. All the single crystals wereprepared from the polycrystalline precursors; typical weight of precursor was≈ 8 g.
Table 2.1: The purity of elements used for the preparation of studied compounds.The purity is written in the N-form: 4N5 ≡ 99.995% metals basis, Alfa Aesar.
element La Ce Cu Au Pd Al Gapurity 3N 2N8 6N 5N 4N5 6N 7N
The Czochralski pulling method belongs to the relatively commonly usedmethods for single crystal growth. We prepared most of the studied single crys-tals by this method in the modified tri-arc furnace installed in Department ofCondensed Matter Physics. The polycrystalline precursor of appropriate stoi-chiometry is melted up by three tungsten electrodes and levitates on water-cooledcopper crucible. First, the melted material is heated for certain amount of time,in our case always ≈ 0.5 hour, to ensure homogeneity of the melt. The crucible,and with it also the melt, are rotated in addition. Secondly, the water-cooledseed is introduced to the melt - the tungsten seed could be used in the first step,in further step a part of prepared ingot serves as seed. In the third step, theseed (and ingot) is pulled out of the melt with constant speed, in our case thespeed was 6 - 8 mm per hour. In the same time, the ingot rotates (typically4 rotations per minute) in the opposite sense than the crucible. The speeds ofpulling and rotation and mainly their stability during the whole growing processare of great importance. Another important parameter is the temperature of the
13

melt, which has similar or rather more significant effect. The speeds and mainlythe temperature must be regulated in order to allow the formation of an interfacebetween the melt and ingot at which the crystallization process takes place. Aftersuccessful connection of the melt and solid ingot, several millimeters of crystalare grown. The critical phase in the growing process is the formation of so called’neck’, which follows. The diameter of the ingot is tuned by the temperature ofmelt in order to get rid of all single crystal grains but one. Afterwards, the di-ameter is enlarged again to maximally 5 mm (for larger diameter we need to useanother furnace). If possible, the second neck is managed and we grow the ingotas long as possible. The last critical part is the ending of the ingot. The diameterof the ingot should be narrowed very slowly and it should be very narrow whenit is separated from the melt. The temperature transfer from the melt to theingot should be as low as possible to prevent a formation of defects as twinningor inclusion of the foreign phase by fast-cooling. The pictures of initial phase ofpreparation of CeCuAl3 single crystal and prepared ingot are shown in Figure2.1.
a) b)
Figure 2.1: The photos of a) initial phase of preparation by Czochralski pullingmethod and b) prepared ingot of CeCuAl3.
Another type of preparation of our single crystals was the floating zone method.We needed large amount of CeCuAl3 for powder neutron diffraction experiment.To ensure the homogeneity of the sample, whole amount of material was preparedas one large single crystal by floating zone method. The precursor in the shapeof a rod of 5 mm diameter and ≈ 18 g weight was used for the preparation bythe optical floating zone furnace (model: FZ-T-4000-VI-VPM-PC). The growingprocess took place under 6N Ar protective atmosphere with 125 kPa pressure andthe flow rate of 0.5 liter per minute. In contrast with the Czochralski method, inthe case of floating zone method the sample is heated up only locally, which leadsto lower evaporation of constituent elements, contamination by residual gas andbetter stability of the growth itself. The pulling rates and rotation speed werethe same as used in the case of preparation by Czochralski pulling method.
2.2 Structure and chemical characterization
The sample prepared by methods described above may exhibit many defects.A different crystal structure and a wrong stoichiometry are the most important
14
of them. Another problem could be a stoichiometry variation in the sample,inclusions of foreign phases and a presence of oxides of constituent elements.Moreover, one should take into account also the occupation of lattice sites ofone element by other element with similar ionic radius, especially in substitutedcompounds. In the case of single crystal, one has to verify first, that preparedingot consists of only one grain. The opposite case leads to the sample with certainanisotropy given by similar orientation of all grains or even to the polycrystal.
All prepared samples were investigated by means of energy dispersive X-raydiffraction (EDX) and powder X-ray diffraction measurements. The single crys-tals were checked by Laue X-ray and neutron diffraction, in addition.
2.2.1 Energy dispersive X-ray analysis
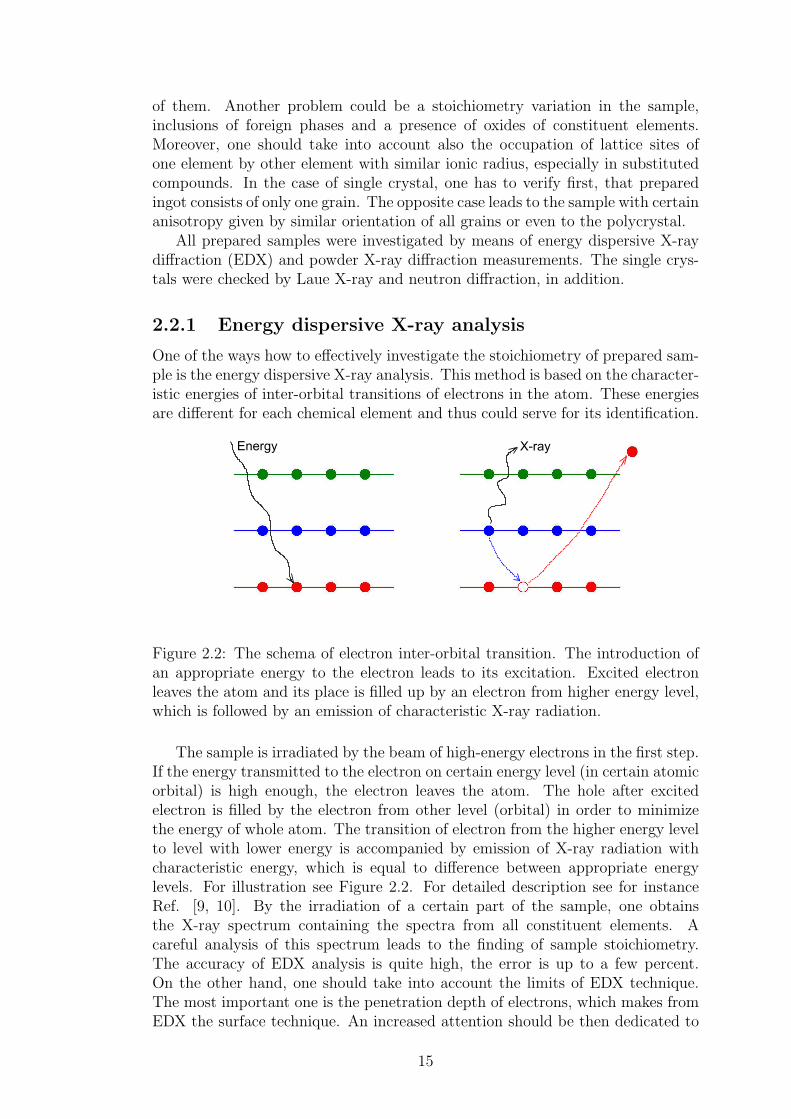
One of the ways how to effectively investigate the stoichiometry of prepared sam-ple is the energy dispersive X-ray analysis. This method is based on the character-istic energies of inter-orbital transitions of electrons in the atom. These energiesare different for each chemical element and thus could serve for its identification.
X-rayEnergy
Figure 2.2: The schema of electron inter-orbital transition. The introduction ofan appropriate energy to the electron leads to its excitation. Excited electronleaves the atom and its place is filled up by an electron from higher energy level,which is followed by an emission of characteristic X-ray radiation.
The sample is irradiated by the beam of high-energy electrons in the first step.If the energy transmitted to the electron on certain energy level (in certain atomicorbital) is high enough, the electron leaves the atom. The hole after excitedelectron is filled by the electron from other level (orbital) in order to minimizethe energy of whole atom. The transition of electron from the higher energy levelto level with lower energy is accompanied by emission of X-ray radiation withcharacteristic energy, which is equal to difference between appropriate energylevels. For illustration see Figure 2.2. For detailed description see for instanceRef. [9, 10]. By the irradiation of a certain part of the sample, one obtainsthe X-ray spectrum containing the spectra from all constituent elements. Acareful analysis of this spectrum leads to the finding of sample stoichiometry.The accuracy of EDX analysis is quite high, the error is up to a few percent.On the other hand, one should take into account the limits of EDX technique.The most important one is the penetration depth of electrons, which makes fromEDX the surface technique. An increased attention should be then dedicated to
15
the shape and size of the studied sample. The overlap of peaks from differentelements spectra forms another difficulty.
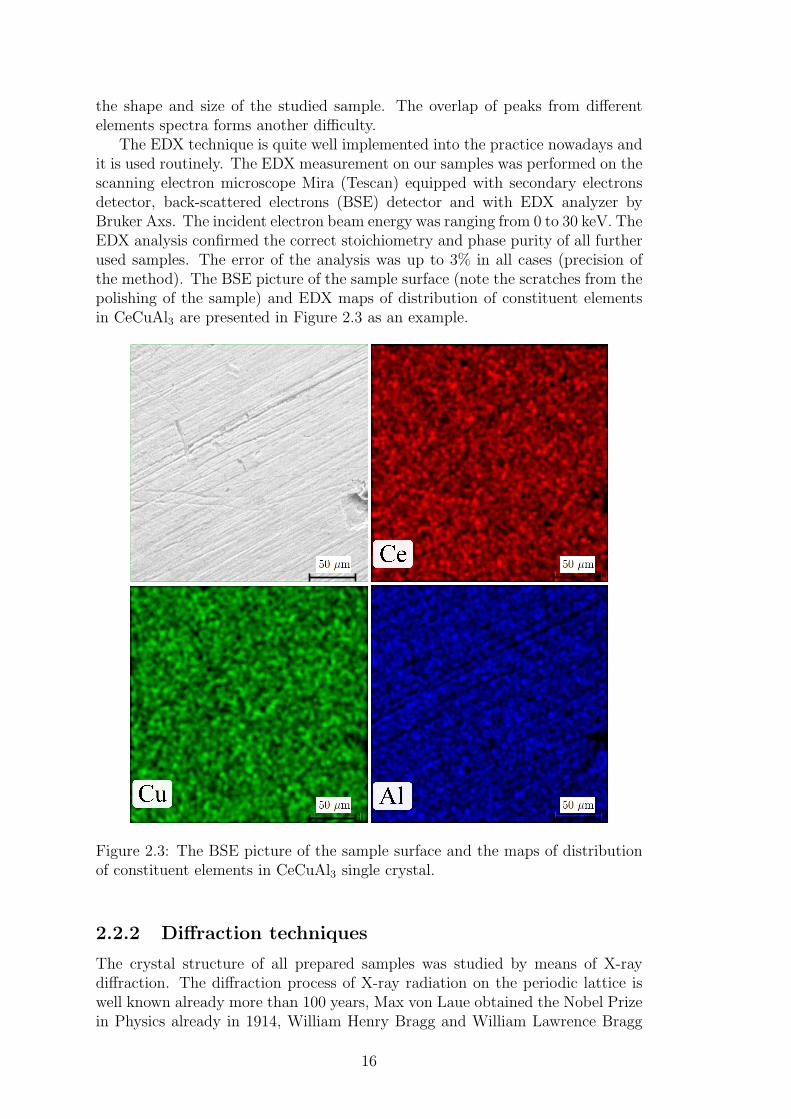
The EDX technique is quite well implemented into the practice nowadays andit is used routinely. The EDX measurement on our samples was performed on thescanning electron microscope Mira (Tescan) equipped with secondary electronsdetector, back-scattered electrons (BSE) detector and with EDX analyzer byBruker Axs. The incident electron beam energy was ranging from 0 to 30 keV. TheEDX analysis confirmed the correct stoichiometry and phase purity of all furtherused samples. The error of the analysis was up to 3% in all cases (precision ofthe method). The BSE picture of the sample surface (note the scratches from thepolishing of the sample) and EDX maps of distribution of constituent elementsin CeCuAl3 are presented in Figure 2.3 as an example.
Figure 2.3: The BSE picture of the sample surface and the maps of distributionof constituent elements in CeCuAl3 single crystal.
2.2.2 Diffraction techniques
The crystal structure of all prepared samples was studied by means of X-raydiffraction. The diffraction process of X-ray radiation on the periodic lattice iswell known already more than 100 years, Max von Laue obtained the Nobel Prizein Physics already in 1914, William Henry Bragg and William Lawrence Bragg
16

then one year later. For this reason, we do not describe the method in detail andremind here only the obligatory Bragg’s law:
nλ = 2d.sinθ. (2.1)
n is positive integer number. λ is the wavelength of used radiation. d staysfor distance between crystallographic planes and θ is the angle between incidentradiation and the sample surface.
The investigation of our powder samples was performed on Bruker D8 Advancediffractometer equipped with the Cu Kα1,2 X-ray source (the initial wavelengths1.54056 A and 1.54439 A, respectively). The Bragg-Brentano θ − 2θ geometrywas implemented. The obtained diffraction patterns were consequently refinedusing the Rietveld analysis employing the Fullprof software [11].
High temperature powder X-ray diffraction measurements were performedon powdered CeCuAl3 single crystal and on polycrystalline LaCuAl3 using thePANanalytical MPD diffractometer with MRI high-temperature chamber in con-ventional BB symmetric θ-2θ scan. Tantalum strip heater and platinum radiationheater were used as a heating elements, the heating rate was 5oC per minute. Thesample was directly put to tantalum strip heater in order to have a good thermalcontact. The pressure in heating chamber was of the order 10−2 Pa to protectthe tantalum strip from corrosion and to ensure the same conditions for measure-ments at each temperature. The measurement was done at temperatures from32 to 500oC.
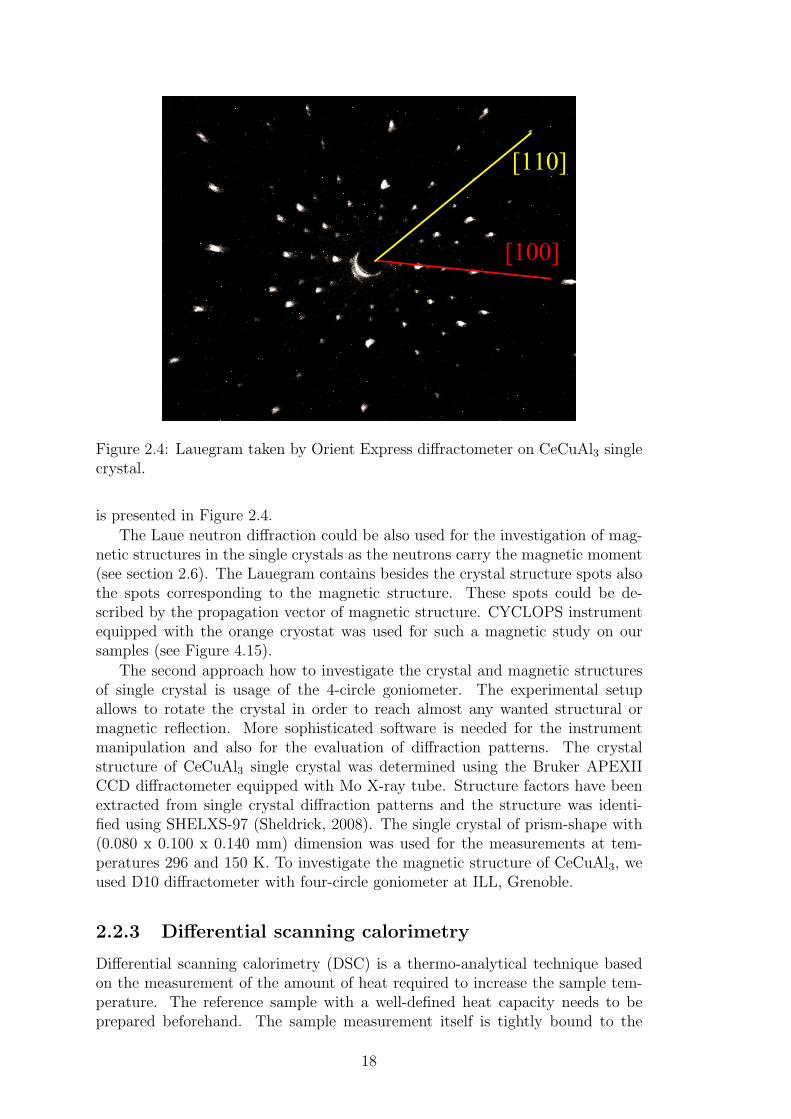
To characterize the single crystals, two methods were used. First, Laue diffrac-tion method. The X-ray or neutron radiation does not need to be adjusted inany way as we need a broad spectra of wavelengths. The Bragg’s condition issatisfied for each set of crystallographic planes and appropriate wavelengths re-sulting in the array of spots on so called Lauegram. The spots on Lauegram formthe hyperboles, where each hyperbola belongs to the one set of crystallographicplanes. The symmetry of crystallographic planes in the single crystal leads tothe symmetry of diffraction patterns in Lauegram. The transmission and back-reflection modifications of Laue diffraction method are commonly used, leadingto the same results.
Besides the orientation of single crystal, the Laue technique is used to inves-tigate its perfection. The quality of single crystal is mirroring in the size andshape of the diffraction spots. The distorted or smeared spots could be a resultof bended or twisted crystal. The sample containing more than one grain or thetwinning can be also easily identified.
The quality and orientation of our single crystals were verified by both LaueX-ray diffraction and Laue neutron diffraction techniques. The usage of X-raydiffraction in conventional laboratory is limited and therefore it becomes the sur-face technique for bulk samples. Scans over all the crystal including the places ro-tated exactly by 180o with respect to previous ones should be the matter of course.However, the sample might still contain more than one grain. The neutrons havea large penetration depth and whole sample volume could be investigated in thesame time. The Laue neutron diffraction experiments were performed on OrientExpress and CYCLOPS (CYlindrical Ccd Laue Octagonal Photo Scintillator) in-struments [12] at Institute Laue-Langevin (ILL), Grenoble, France. The exampleof Lauegram taken by Orient Express diffractometer on CeCuAl3 single crystal
17
[100]
[110]
Figure 2.4: Lauegram taken by Orient Express diffractometer on CeCuAl3 singlecrystal.
is presented in Figure 2.4.
The Laue neutron diffraction could be also used for the investigation of mag-netic structures in the single crystals as the neutrons carry the magnetic moment(see section 2.6). The Lauegram contains besides the crystal structure spots alsothe spots corresponding to the magnetic structure. These spots could be de-scribed by the propagation vector of magnetic structure. CYCLOPS instrumentequipped with the orange cryostat was used for such a magnetic study on oursamples (see Figure 4.15).
The second approach how to investigate the crystal and magnetic structuresof single crystal is usage of the 4-circle goniometer. The experimental setupallows to rotate the crystal in order to reach almost any wanted structural ormagnetic reflection. More sophisticated software is needed for the instrumentmanipulation and also for the evaluation of diffraction patterns. The crystalstructure of CeCuAl3 single crystal was determined using the Bruker APEXIICCD diffractometer equipped with Mo X-ray tube. Structure factors have beenextracted from single crystal diffraction patterns and the structure was identi-fied using SHELXS-97 (Sheldrick, 2008). The single crystal of prism-shape with(0.080 x 0.100 x 0.140 mm) dimension was used for the measurements at tem-peratures 296 and 150 K. To investigate the magnetic structure of CeCuAl3, weused D10 diffractometer with four-circle goniometer at ILL, Grenoble.
2.2.3 Differential scanning calorimetry
Differential scanning calorimetry (DSC) is a thermo-analytical technique basedon the measurement of the amount of heat required to increase the sample tem-perature. The reference sample with a well-defined heat capacity needs to beprepared beforehand. The sample measurement itself is tightly bound to the
18
measurement of reference: both the sample and reference are maintained at near-ly the same temperature throughout the experiment, which allows together withprevious calibration to obtain heat-temperature dependence of the sample. Thecomplementary technique is called differential thermal analysis (DTA). WhileDSC measures the energy required to keep both the reference and the sample atthe same temperature, DTA measures the difference in temperature between thesample and the reference when they are receiving the same amount of heat.
DSC allows to observe the differences in the heat flow between the sampleand calibrated reference, while keeping both at the same temperature. Thesedifferences correspond to the absorption and emission of the heat by the sample,while undergoing the phase transition. The process of the phase transition couldbe endothermic or exothermic, which is detected also by DSC. Endothermic pro-cess is bounded with ’negative’ peak in the temperature dependence of heat flowas the heat is absorbed during the phase transition. The solid-liquid transitionrepresents such a process. Exothermic process is then exactly opposite and isaccompanied by the ’positive’ peak in temperature-heat transfer development.Thus, not only the temperatures of the phase transitions in the sample, but alsoits type could be determined by DSC measurement.
Differential scanning calorimetry was carried out on CeCuAl3 single crystal aswell as on LaCuAl3 polycrystalline sample in order to obtain melting temperaturesand to find any sign of presence of other transition as well as to verify the phasepurity of the sample. Measurements were performed under protection of Heatmosphere on SETSYS Evolution 24 instrument (SETARAM InstrumentationCompany) and data were processed using SETARAM software. Heating andcooling scans were taken with the rate of 10oC per minute in temperature rangefrom 28 to 1400oC.
2.3 Magnetization measurements
The magnetization measurement techniques are well known and standardly usedin condensed matter research. We do not describe them here and kindly ask readerto see a large number of publications, e.g. Refs. [13, 14], for details. Instead,we focus on the description of magnetization in the sample in paramagnetic andordered state.
The total magnetic moment of the sample in the paramagnetic state is equalto zero. The individual magnetic moments on magnetic ions compensate eachanother due to their random orientation in the material. Nevertheless, the ap-plication of external magnetic field could overcome the thermal fluctuations ofmagnetic moments and the material exhibits a non-zero magnetization M . Theresponse of the sample in the paramagnetic state to the applied magnetic field, socalled magnetic susceptibility χ, is generally described by modified Curie-Weisslaw:
χ ≈ M
H=
NAµ2Bµ
2eff
3kB(T − θp)+ χ0, (2.2)
where NA is the Avogadro constant, θp is paramagnetic Curie temperature and χ0
stays for the Pauli and Van Vleck paramagnetic susceptibility. We note, that thesusceptibility is not the scalar quantity, in general. Both the magnetization and
19

magnetic field are vectors, thus the susceptibility is the tensor of 3x3 dimension.The simplified relation could be used, to some extent, in the cases, when the mag-netization vector has the same direction as the magnetic field, i.e. the significantcrystallographic direction of the sample crystal structure is oriented along the ap-plied field. The effective magnetic moment obtained by fitting the experimentaldata to the Curie-Weiss law is generally comparable with theoretically predictedµeff from equation 1.1.
The magnetization and alternate current (ac-) susceptibility measurementswere performed using the Physical Property Measurement System (PPMS) andMagnetic Property Measurement System (MPMS), Quantum Design, installedin the Magnetism and Low Temperatures Laboratories, MLTL (http://mltl.eu/).The magnetic field ranges from 0 to 14 T and to 7 T for PPMS and MPMS in-struments, respectively. Polycrystalline samples used for the measurement werecrushed into fine powder and afterwards fixed in a random orientation by glue(Canagon) in a plastic capsule. Typical weight of the sample was ≈ 60 mg. Thesingle crystals were measured in the prism-shaped form with the long edge cutalong significant crystallographic directions oriented along magnetic field direc-tion. Such experimental arrangement allows us to neglect the difficulty due tothe demagnetizing factor [15].
2.4 Specific heat
The measurement of the specific heat belongs among the standard techniquesimplemented during the investigation of physical properties of the material. Thespecific heat namely reflects the microscopic properties and their changes in thesample, which makes it very important quantity for condensed matter physics.The total specific heat of the sample is considered to consist of electronic, Cel,phonon, Cph, and magnetic, Cmag, contributions:
Cp = Cel + Cph + Cmag. (2.3)
General problem with the specific heat data treatment originates in a difficultseparation of individual components from total specific heat.
The electronic contribution of specific heat originates in the presence of con-duction electrons near the Fermi level in all metallic materials and could beexpressed as:
Cel =1
3π2n(EF)k
2BT ≡ γelT. (2.4)
n(EF) stays for the density of states on the Fermi level, γel is then the Sommerfeldcoefficient of electronic specific heat.
The lattice vibrations (quantized as phonons) are tightly bound with a thermalenergy given to matter and form significant contribution to its specific heat. 3nbranches (n is number of atoms in an elementary unit cell) of the phonon spectrumis divided into 3 acoustic and 3n-3 optic branches and are described by the Debyeand Einstein models, respectively. The wavevector of acoustic phonons is linearlydependent on the frequency, while the optic phonons exhibit non-zero frequencyalso in the center of Brillouin zone. The phonon contribution to the specific heatin the compounds with lattice periodicity could be then described by relation:
20

Cph = CphD+CphE = 9kBNA(T
θD)3
∫ θDT
0
x4ex
(ex − 1)2dx+kBNA
3n−3∑
i=1
(θEi
T)2
eθEiT
(eθEiT − 1)2
,
(2.5)where θD and θE stay for the Debye and Einstein temperatures, respectively.When describing the phonons in the material, one should take into account alsothe effect of anharmonicity, which is not included in previous formula [16]. Thehigh temperature limit of equation 2.5 is equal to 3R per one mole of the material,while Cph at low temperatures reveals a cubic dependence on the temperature.The specific heat for the non-magnetic compound in the low temperature regioncould be thus written as:
Cp = Cel + Cph = γelT + βT 3 = γelT +12π4R
5θ3DT 3 (2.6)
The magnetic contribution to the specific heat consists in non-zero total mag-netic moment of atoms in matter. The crystal electric field in the material influ-ences the electronic properties of such atoms (splits degeneration of the multipletground state, see subsection 1.2), which leads to the rise of the entropy and thusalso the specific heat. The CEF contribution to Cmag is often called Schottkycontribution:
CSchottky = kBNA(
∑ni=1(
Ei
kBT)2e
− EikBT
∑ni=1 e
− EikBT
− (
∑ni=1
Ei
kBTe− Ei
kBT
∑ni=1 e
− EikBT
)2). (2.7)
Any change of the electronic properties of atoms in the material leads to thechange of the entropy and thus also to the change of specific heat. The formationof magnetic ordering, transition to the superconducting (SC) state or structuraltransitions reveal themselves as anomalies in the temperature evolution of specificheat.
The determination of individual contributions to the specific heat of generalcompound represents quite difficult task. Nevertheless, in the special cases, themagnetic contribution could be, to some extent, estimated after the subtractionof the electronic and phonon contributions of the non-magnetic analogue fromtotal specific heat of investigated compound. Such an approach is frequentlyused in the specific heat data treatment of rare-earth based compounds, whereLa, Y and Lu analogues could be employed.
The magnetic entropy of the material could be easily calculated from Cmag:
Smag(T′) =
∫ T ′
0
Cmag
TdT. (2.8)
A comparison of Smag to the theoretical value:
Smag = Rln(2J + 1) (2.9)
could be than easily done revealing inter alia the strength of Kondo interactionin Ce-based compound or even the presence of short-range magnetic correlations.The theoretic value of Smag for Ce3+ ion is equal to Rln(6) = 14.9 J.K−1.mol−1.
21
The specific heat measurement on studied samples was performed using thetime-relaxation method on PPMS instrument, see e.g. Ref. [17]. The thermalcontact between sample and sample holder was provided by the apiezon N grease,which served for the attachment of the sample to holder in the same time. All thesample measurements were forestalled by the measurement of the sample holderwith appropriate amount of grease to determine the contribution of apiezon tomeasured specific heat precisely. The contributions of the sample holder andapiezon were subtracted afterwards. The measurements at temperatures frominterval (0.4 − 5) K were provided on ≈ 2 g samples, the samples with ≈ 20 gweigh were used for the measurement at temperatures between 1.8 and 300 K.The larger sample allows us to get a good accuracy with respect to the increaseof sample holder contribution to measured specific heat at higher temperatures.
2.5 Electrical resistivity
The electrical resistivity of the non-magnetic compound generally consists fromonly two contributions: residual resistivity, R0, and electron-phonon part, Rph.The total electrical resistivity is then described by the Matthiessen’s rule, whereRph could be described by the Bloch-Gruneisen formula:
R(T ) = R0 +Rph(T ) = R0 + A(T
θRD)n
∫ θRDT
0
xn
(ex − 1)(1− e−x)dx. (2.10)
A is a constant depending on the velocity of electrons at the Fermi surface, theDebye radius and the number density of electrons in the metal. θRD stays for theDebye temperature determined from resistivity measurement. In the case of oneatom in an elementary unit cell, θRD should reach a value obtained from specificheat measurement via equation 2.5. In the case of more than one atom per unitcell, the equation 2.5 needs to be corrected. Integer number n depends on thetype of interaction in the material: n = 2 points out to the electron-electroninteraction, n = 3 is typical for the transition metals with strong s− d electronsscattering and n = 5 implies electron-phonon scattering in the material.
The electrical resistivity of compound containing magnetic ions can be de-scribed by Mattheissen’s rule as:
R(T ) = R0 +Rph(T ) +Rel(T ), (2.11)
where the Rel represents the contribution from the electron-electron scattering.The determination of individual contribution to the electrical resistivity is prob-lematic, similarly as in the case of specific heat. Another difficulty represents thetype of magnetic order: in the case of antiferromagnet, the equation 2.11 must becorrected by truncation factor for a different periodicity of the magnetic lattice.In special cases, we can assume the same Rph contribution for magnetic and non-magnetic analogues and estimate Rel. This contribution is for Fermi-liquid-likesystem proportional to the square of temperature:
Rel(T ) = DT 2. (2.12)
22
In condensed matter, we observe several mechanisms, which influence the elec-trical resistivity development. Superconductivity leads to the zero electrical re-sistivity below critical temperature and critical magnetic field. A logarithmicincrease of resistivity with decreasing temperature due to the screening of mag-netic moments by conduction electrons represents another case, when the systemcannot be described purely on the basis of above mentioned relations. For furtherreading see e.g. Refs. [18, 19].
The electrical resistivity was measured using a classical four-point schema withtransversal current-field mode on PPMS instrument. The prism-shaped sampleswith (≈ 20 x 4 x 4 mm3) dimensions were connected to the electrical circuit by Cuwires and colloidal silver paste. Single crystalline samples cut along significantcrystallographic directions (mostly the same samples as used for magnetizationmeasurements) were connected to the electrical circuit with the electrical current,j, aligned along the long sample edge.
The double layered cylindrical pressure cell [20] and pressure exchange medi-um Daphne 7373 oil [21] were used for the measurement up to 3 GPa in temper-ature range 2 - 300 K. The manganin wire was used as the sensor to determinethe pressure at room temperature. The uncertainty of pressure determinationof 0.05 GPa originates in the electrical resistivity measurement of the manganinwire. Above 2.2 GPa, additional error of 0.2 GPa should be considered because ofsolidification of Daphne 7373 oil at room temperature [21]. Another asymmetricexperimental error (≈ 0.2 GPa) occurs in low pressure region (p < 1 GPa) at lowtemperatures as the pressure decreases by cooling.
2.6 Neutron scattering
The neutron scattering techniques belong to the most powerful tools for the con-densed matter investigation. Neutron consists of quarks u-d-d leading to the zeroelectric charge (or strictly speaking, charge lower than experimental error) andnon-zero magnetic moment. Such properties allow the neutron non-destructivelypenetrate the matter to depth of several centimeters. It interacts with the nu-clei via the strong interaction (there is no Coulomb barrier to overcome) andwith magnetic moments of unpaired electrons via dipole-dipole interaction. Itbrings out the information not only about the crystal (nuclear) structure, butalso about the magnetic structure of the material. The important properties ofthe neutron are its wavelength or energy and momentum. The wavelengths ofthe order of 10−10 m (= Angstroems) make the neutron an ideal probe for atomicand molecular structure investigation. Moreover, the size of nuclei is typicallyseveral femto-meters (10−13 m), the interaction between the neutron and nucleusis thus nearly point-like. The energy ≈ meV is then in the same range as diffu-sive motion, phonons, magnons, vibration modes of molecules etc. The randomsensitivity to individual chemical elements and also individual isotopes representsanother highly convenient property of neutron, which is frequently used not on-ly in condensed matter research, but also for the investigation of chemical andbiological materials.
The production of neutrons by fission and spallation processes requires largefacilities. Such a drawback is common for both neutron scattering and com-plementary synchrotron X-ray radiation scattering techniques. Comparing both
23
techniques, the X-ray scattering works with radiation energy in order of keV, hasa smaller penetration depth and mainly, the radiation is scattered by electron den-sity and thus the heavy elements contribute to the diffraction patterns strongerthan the light ones. On the other hand, great advantages of synchrotron radia-tion are broad spectrum of wavelengths, high flux, brilliance and high stability ofsource.
The thesis is not aiming to describe the X-ray and neutron scattering tech-niques in detail, for further reading e.g. Refs. [22, 23, 24] are recommended. Wegive here only several basic relations and basic description of used instruments,which is necessary for a good understanding of the data aquirement and treat-ment within the thesis. The neutron scattering could be generally divided into twotypes, elastic and inelastic, based on the way neutron interacts with the matter.The main difference between these types of scattering lies in the kinetic energyconservation. While, the elastic scattering (also called diffraction) contains theprocesses, in which the total kinetic energy of the neutron and target does notchange during the experiment, the inelastic scattering deals with the processes,where the total kinetic energy before and after scattering process differs (partof the kinetic energy is converted to other type of energy, e.g. deformation orexcitation energy). The neutron is elementary particle with no excitable inter-nal degrees of freedom and the target is typically very massive, therefore elasticscattering implies the energy conservation of the target.
2.6.1 Neutron diffraction
The measured intensity of scattered beam represents an overall output of generalX-ray or neutron scattering experiment. The relation between the intensity, I,and microscopic properties of the sample is not always straightforward as severalfactors reflecting the sample and instrument features take place. Moreover, themicroscopic properties of the sample are included in so called structure factor, F ,which appears in the following formula only as a square:
I = LfAExP |F |2 . (2.13)
As the structure factor is generally a complex number, the phase of F is lostand sophisticated approach has to be used to restore it. Lorentz factor, Lf , isreflecting a different speed of different reciprocal lattice points as they are passingthrough the Ewald sphere during the measurement. We restrict ourselves onlyto easy formulas which applies to our measurements on powder diffractometersD1B (ILL, Grenoble) and E6 (HZB, Berlin) and on triple axis spectrometer D10(ILL, Grenoble) in ’elastic mode’:
Lpowder =1
sin2θsinθ, Lsingle crystal =
1
sinθ. (2.14)
Lorentz factors for various types of measurements can be found e.g. in Ref.[25]. The absorption of the material, A, plays an important role in the scatter-ing experiment as it influences the measured intensity depending on the samplecomposition (elemental and isotopic), size and shape of the sample and on wave-length of neutron radiation. The extinction, Ex, represents another importantfactor in the kinematic theory of diffraction. The extinction is strongly dependent
24
on the size and mosaicity of domains in the sample and could be thus determinedmostly only by fitting the experimental data. We restrict ourself to mention on-ly phenomenological Zachariasen formula, which is implemented in the Fullprofpackage [11] and which was used during the refinement of our single crystal data.For further reading, see e.g. Ref. [26]. Preferential orientation factor, P , thencorrects a non-random orientation of grains in the powder sample and could bedescribed by e.g. March function [11]:
Phkl =∫(f 2
corcos2α +
sin2α
fcor)−
32 , (2.15)
where the correlation factor, fcor, expresses the degree of preferential orientation.The preferential orientation does not occur in the sample when fcor = 1, takesthe plate-shape form for fcor < 1 and needle-shape for fcor > 1 [11].
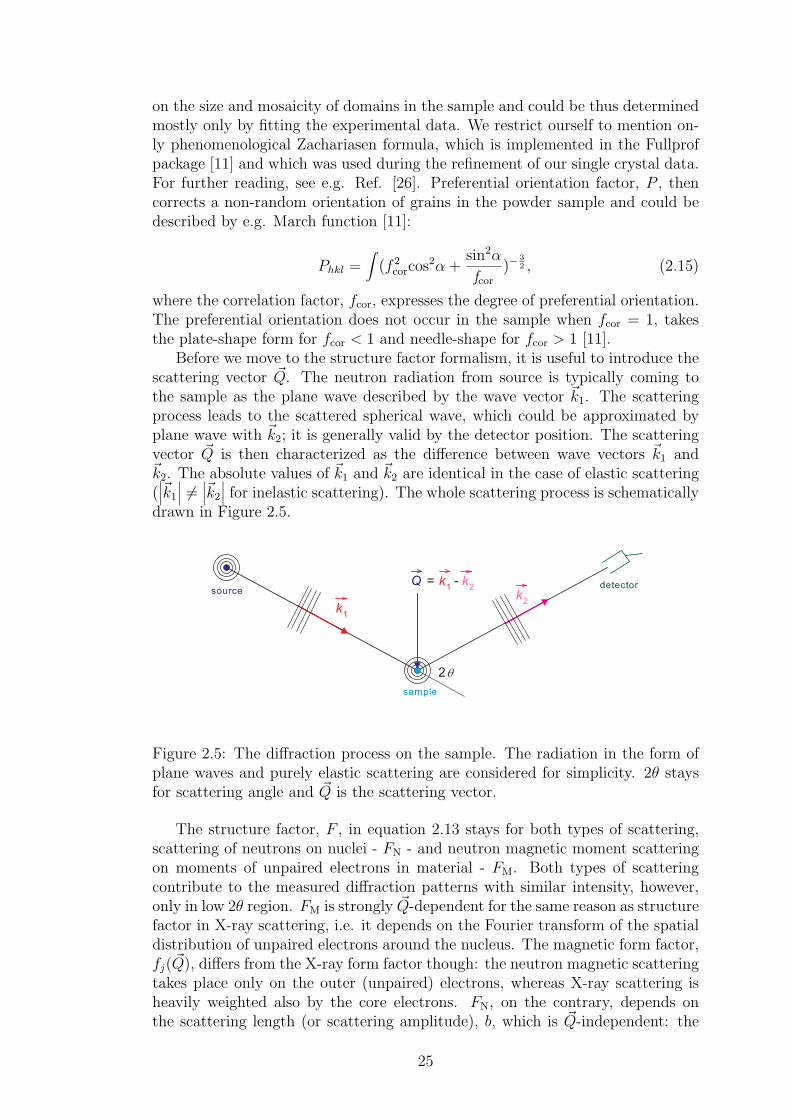
Before we move to the structure factor formalism, it is useful to introduce thescattering vector ~Q. The neutron radiation from source is typically coming tothe sample as the plane wave described by the wave vector ~k1. The scatteringprocess leads to the scattered spherical wave, which could be approximated byplane wave with ~k2; it is generally valid by the detector position. The scatteringvector ~Q is then characterized as the difference between wave vectors ~k1 and~k2. The absolute values of ~k1 and ~k2 are identical in the case of elastic scattering(∣∣∣~k1
∣∣∣ 6=∣∣∣~k2
∣∣∣ for inelastic scattering). The whole scattering process is schematicallydrawn in Figure 2.5.
Figure 2.5: The diffraction process on the sample. The radiation in the form ofplane waves and purely elastic scattering are considered for simplicity. 2θ staysfor scattering angle and ~Q is the scattering vector.
The structure factor, F , in equation 2.13 stays for both types of scattering,scattering of neutrons on nuclei - FN - and neutron magnetic moment scatteringon moments of unpaired electrons in material - FM. Both types of scatteringcontribute to the measured diffraction patterns with similar intensity, however,only in low 2θ region. FM is strongly ~Q-dependent for the same reason as structurefactor in X-ray scattering, i.e. it depends on the Fourier transform of the spatialdistribution of unpaired electrons around the nucleus. The magnetic form factor,fj( ~Q), differs from the X-ray form factor though: the neutron magnetic scatteringtakes place only on the outer (unpaired) electrons, whereas X-ray scattering isheavily weighted also by the core electrons. FN, on the contrary, depends onthe scattering length (or scattering amplitude), b, which is ~Q-independent: the
25
wavelength of neutrons used for the scattering experiments (Angstroem, A) istypically 4-5 orders of magnitude larger than the dimension of the nucleus (fm).The nucleus can be thus treated as the point target, i.e. delta function in space.The Fourier transform of delta function is a unity and therefore b is elementand isotope dependent constant. The value of b for individual isotope cannotbe calculated theoretically, experimentally determined values are tabulated. Thenuclear and magnetic structure factors could be written in the following forms:
FN( ~Q) =∑
j
bjei ~Q~Rje−Wj , (2.16)
FM( ~Q) =∑
j
fj( ~Q)µj⊥ei ~Q~Rje−Wj , (2.17)
where first exponential describes the relation between the direct and reciprocalspace and second one stays for the temperature Debye-Waller factor. µ⊥ repre-sents the component of magnetic moment perpendicular to the scattering vector~Q. Neutron diffraction sees only this perpendicular component of magnetic mo-ment due to the dipole-dipole interaction.
The summation of nuclear and magnetic scattering contributions to total in-tensity differs for individual experimental setups: F 2 = F 2
N + F 2M for experiment
employing unpolarized neutron beam, whereas F 2 = (FN + FM)2 for polarized
radiation, for example. For further reading see e.g. Refs. [22, 23, 24].
2.6.2 Inelastic neutron scattering
The second type of interaction of neutron with the matter, inelastic neutron scat-tering, deals with the scattering processes, in which the energy and momentum ofthe incoming and scattered neutrons differ;
∣∣∣~k1∣∣∣ 6=
∣∣∣~k2∣∣∣ (
∣∣∣~k1∣∣∣ ≡ k1). Compared to
the elastic case, the scattered intensity is significantly different and the measure-ment itself requires more sophisticated experimental setup. In general, two typesof inelastic neutron scattering instruments are employed: time of flight spectrom-eter (ToF) and triple-axis spectrometer (TAS). The former instrument is usuallyused for the measurement on polycrystalline samples and other chemical or evenbiological materials, while the later one is dedicated to the measurement on singlecrystals. For the measurement of large Q-range on the single crystal could be usedthe ToF spectrometer. We will describe these two types of instruments as wellas the inelastic scattering in more details in present thesis as a significant part ofit consists of the results from our neutron scattering experiments using the ToFspectrometers IN4 (ILL, Grenoble), IN6 (ILL, Grenoble), MARI (ISIS, Didcot)and IRIS (ISIS, Didcot) and TAS instruments D10 (in elastic mode, only; ILL,Grenoble), ThALES (ILL, Grenoble), IN20 (ILL, Grenoble) and PANDA (MLZ,Garching). The instruments are usually constructed depending on the requestedenergy range and resolution for the experiment; generally, we can divide them tothe ’cold’ instruments (IN6, IRIS, ThALES, PANDA) and ’thermal’ instruments(IN4, MARI, IN20).
26
ToF and TAS instruments
The measurement with time of flight spectrometer begins with the monochroma-tization of white neutron beam. Two approaches are used, in general. First, theneutron beam is partially monochromatized by the two counter-rotating discschoppers and afterwards diffracted by the monochromator crystal leading to thespecific wavelength of neutrons. In the next step, the neutron beam is pulsed intovery short bursts by Fermi chopper (one can imagine the rotating set of parallelslits, which transmits the beam only when the neutron path is parallel to theslits). This is the case of e.g. IN4 instrument. Second approach consists in usageof a set of chopper discs, used e.g. for IN5 instrument at ILL, Grenoble. A firstpair of choppers creates the polychromatic neutron bursts (the same process asin the former approach). Another chopper removes harmonics due to the largebandwidth of wavelengths. Further chopper avoids overlapping of scattered neu-trons from successive bursts after sample by suppressing some of the producedpulses. Finally, a pair of monochromator counter-rotating discs chops a singlewavelength (a narrow band of nearly monochromatic neutrons). The preparationof neutron beam for the experiment is significantly easier in the case of spallationsource as the neutron bursts are produced directly by the source. Well definedmonochromatic bursts of neutrons interact with the sample and the scatteredneutrons are counted by area detectors covering relatively large part of spacearound the sample. The energy which is exchanged between the neutron andthe sample can be then calculated from the difference in arrival time of neutronsto the detector (with respect to elastically scattered neutrons at the detectorposition), i.e. from the speed of individual neutrons.
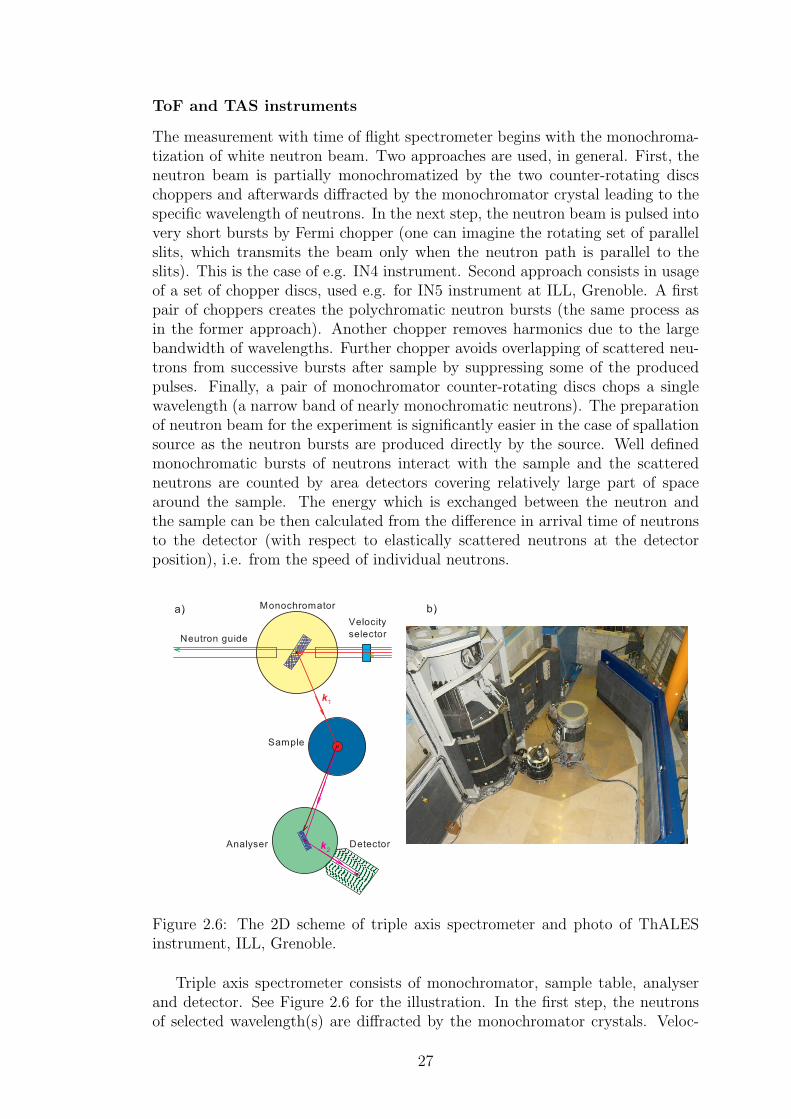
Figure 2.6: The 2D scheme of triple axis spectrometer and photo of ThALESinstrument, ILL, Grenoble.
Triple axis spectrometer consists of monochromator, sample table, analyserand detector. See Figure 2.6 for the illustration. In the first step, the neutronsof selected wavelength(s) are diffracted by the monochromator crystals. Veloc-
27
ity selector (one can imagine chopper) could be used for the primary selectionof neutron energy or wavelength; especially, the higher harmonics of wavelengthcould be effectively sorted out by incorporation of velocity selector in front of themonochromator. The second scattering process takes place at the sample posi-tion, while we have a control on the incoming neutron properties (~k1). Neutronsscattered by the sample could be registered by (two-dimensional) detector, whichis the case of our measurement on D10 instrument in ’elastic mode’, or are ana-lyzed by the analyzer (the third scattering process). The analyzer crystals diffract
only the neutrons of specific ~k2, which are counted by a tube detector in the fi-nal step of the measurement. The whole experiment takes place within so calledscattering plane, usually; nevertheless, the special type of analyzer-detector setup(e.g. FlatCone, ILL, Grenoble) allowing also the measurement out of the planecould be employed. During the typical experiment on TAS, one holds wave vector~k1 or ~k2 constant while varying the other. Detailed description of TAS as well asall optical components can reader find in many publications, we recommend e.g.Ref. [24].
Scattering triangle
Let us describe the inelastic neutron scattering process on sample in detail: theincoming neutron of specific wavelength (energy) and momentum interacts withthe sample both elastically (see previous subsection) and inelastically. The laterprocess leads to the change of energy or/and momentum of neutron. The de-tection and analysis of scattered neutron properties then give the informationabout the microscopic nature of studied material. The whole scattering processis frequently described in the following way (compare with elastic case and Fig-
ure 2.6). The scattering vector ~Q could be still characterized as the difference
between wave vectors ~k1 and ~k2 as in the case of elastic scattering:
~Q = ~k1 − ~k2. (2.18)
However, the vectors of incoming and scattered waves do not have the same size inthe inelastic case, thus ~Q is generally not the vector of reciprocal lattice ( ~Q 6= ~G,
where ~G is reciprocal lattice vector). It is convenient to relate the momentum
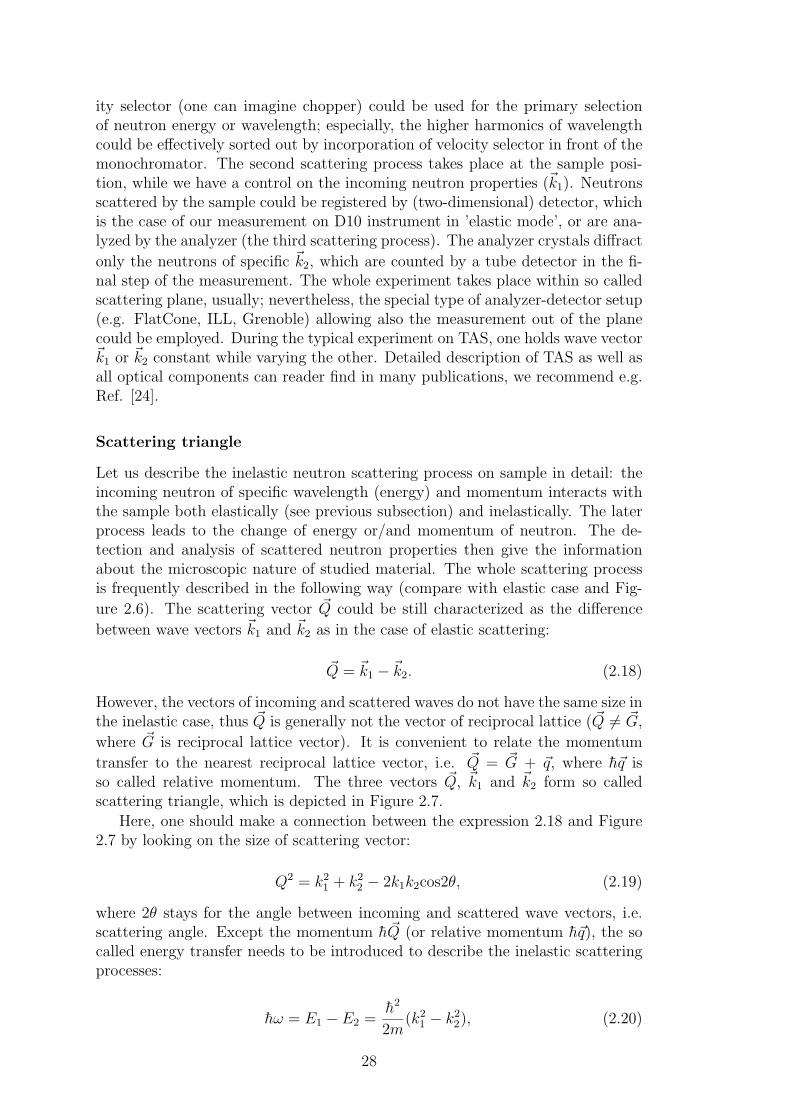
transfer to the nearest reciprocal lattice vector, i.e. ~Q = ~G + ~q, where h~q isso called relative momentum. The three vectors ~Q, ~k1 and ~k2 form so calledscattering triangle, which is depicted in Figure 2.7.
Here, one should make a connection between the expression 2.18 and Figure2.7 by looking on the size of scattering vector:
Q2 = k21 + k2
2 − 2k1k2cos2θ, (2.19)
where 2θ stays for the angle between incoming and scattered wave vectors, i.e.scattering angle. Except the momentum h ~Q (or relative momentum h~q), the socalled energy transfer needs to be introduced to describe the inelastic scatteringprocesses:
hω = E1 − E2 =h2
2m(k2
1 − k22), (2.20)
28
Figure 2.7: The scattering triangle of inelastic neutron scattering on reciprocallattice.
where the kinetic energy of neutron is described by non-relativistic formula as thespeed of neutron is of order of km per second, i.e. 5 orders of magnitude lowerthan speed of light. m stays for the neutron mass. Now, we can introduce ascattering function S( ~Q, ω), which is defined in reciprocal ( ~Q, ω) space. But first,
we turn to the practical experimental usage of above listed formulas. Any ( ~Q, ω)point of reciprocal lattice can be reached by an infinite number of combinationof (~k1, ~k2), however, the experimental arrangement (see Figure 2.6) as well asthe constrains of the neutron beam (technical and physical) reduce significantly
our options. During the experiment, one holds wave vector ~k1 fixed (i.e. the
direction and energy of incoming neutrons are fixed), while the chosen ( ~Q, ω)point is reached by detection of the final energy (energy of scattered neutron
given by ~k2)
E2 =h2
2mk22 = E1 − hω =
h2
2mk21 − hω (2.21)
at a scattering angle 2θ:
cos2θ =k 21 + k 2
2 −Q2
2k1k2. (2.22)
The analogical measurement can be done (and usually it is done) in the configu-
ration with ~k2 fixed. The measurement limits are given in formulas 2.21 and 2.22.Let us look at the elastic case (k1 = k2, hω = 0) for example. The largest valueof Q = 2k1 = 2k2 can be reached for 2θ = 180o, i.e. for backscattering. Thus theneutron can transfer twice its initial momentum, in maximum.
Frequently, the inelastic scattering measurement is performed, while ~Q fixed.Two regimes depending on the mutual size of ~k1 and ~k2 could be distinguished:• k1 > k2, according to relation 2.21 energy transfer hω > 0, energy is transferred
29
from the incident neutron to the sample and an excitation in the sample is created,while the neutron gets de-excited.
• k1 < k2 and thus hω < 0, the sample gives a quantum of energy to the neutron- an excitation in sample is annihilated and neutron gets excited. The ener-gy gain/loss processes lead us to the proper introduction of scattering function
S( ~Q, ω).
Scattering function
The present thesis does not intend to describe the scattering process in detail,we restrict ourself to the main results of scattering theory, only, and recommende.g. Refs. [23, 24] for further reading. The scattering process in general can bedescribed by the so called differential cross section. This quantity express theprobability of the neutron being scattered by the scattering center, or in otherworlds, probability of a neutron passing from the state ~k1 to the state ~k2 whileexchanging the energy hω with the sample, and for nuclear scattering is usuallywritten as:
d2σ~k1→~k2
dΩdE2
=k2k1
1
2πh
∑
λi
p(λi)N∑
j,j′
bjb∗j′
∫ ∞
−∞dt
⟨λi|e−i ~Q. ~R0
j′ei~Q. ~Rj(t)|λi
⟩e−iωt. (2.23)
Here, one can define the scattering function S( ~Q, ω) as:
d2σ~k1→~k2
dΩdE2
≡ k2k1
S( ~Q, ω). (2.24)
The formula for differential cross section (and thus also for scattering function)describes all scattering processes, i.e. both coherent and incoherent processes.The scattering function and its ~Q and ω dependencies can be directly measuredby scattering experiment. The equation 2.23 (and thus also equation 2.24) couldbe further separated as the coherent scattering depends on the average scatteringlength of a scatterer: bjb
∗j′ → 〈bj〉
⟨b∗j′
⟩, while incoherent scattering is determined
by the deviation from the scattering length average: bjb∗j′ → (
⟨b2j⟩− 〈bj〉2). The
coherent scattering gives us the information about the correlations that existbetween all the scatterers. The information about the cooperative effects amongdifferent atoms, such as elastic Bragg scattering or inelastic scattering by phononsor magnons is given just by coherent neutron scattering. Whereas, the incoherentscattering brings the information about the correlation of a particle with itself intime and describes thus the dynamics in the sample.
The formula 2.23 is significantly simplified in the case of elastic scattering andwe can get back to the neutron diffraction description used in previous subsec-tion. If we subtract the elastic contributions from differential cross section, thenS( ~Q, ω) corresponds to fluctuations in the sample, as a function of momentumand energy. An important property of the scattering function is the principle ofdetailed balance:
S(− ~Q,−ω) = e− hω
kBT S (~Q , ω). (2.25)
30
The detailed balance expresses the fact, that the probability of a transition inthe sample depends on the statistical weight factor for the initial state. Theprobability is lower for annihilation of excitation than for excitation creation asit is asymmetric in ω. Therefore the negative branch of S( ~Q, ω) will always beinferior to the positive branch. As seen from equation 2.25, the temperatureplays crucial role: at very low (zero) temperature, the sample is in ground state.The sample cannot give any energy to the neutron as there is no excited state.Therefore S( ~Q, ω) = 0 for ω < 0. At high temperature (kBT >> hω), the factor
e− hω
kBT ≈ 1 and thus the scattering function becomes more and more symmetricwith the increasing temperature.
The whole scattering function formalism can be used also for the definition ofscattering of neutron on magnetic spins in material. However, we mention hereonly the relation between magnetic scattering function (obeying detailed balanceprinciple) and the imaginary part of dynamical susceptibility:
Smag( ~Q, ω) =χ′′( ~Q, ω)
1− e− hω
kBT
. (2.26)
The commonly known fluctuation-dissipation theorem relates the measured scat-tering function to dissipative part of a linear response function, i.e. it quantifiesthe relation between the fluctuations in a system at thermal equilibrium andthe response of the system to applied perturbations. For further reading, werecommend e.g. Ref. [27].
Collective excitations
Finally, we turn to a brief description of physical properties of the sample mea-sured by inelastic neutron scattering techniques. Above, we have shown, that neu-tron scattering techniques bring the information about crystal (nuclear) structureand magnetic structure of the material. Moreover, the fluctuations in the samplecould be investigated as function of the momentum and energy. Now, we focuson the collective excitations in the matter, phonons and magnons in particular,which can be effectively studied by inelastic neutron scattering measurements.
The lattice vibrations in the material are quantized as phonons and could beobserver indirectly by macroscopic methods as e.g. specific heat or electrical re-sistivity. The neutron scattering allows us to directly study the phonon spectrumof the material. The emission (absorption) of phonons corresponds directly toenergy loss (gain) of probing neutron. On the basis of such a measurement, onecan construct so called dispersion relations, ωj(~q), for a given material. Every jdefines one out of 3n phonon branches, where n is number of atoms in an elemen-tary unit cell. If n > 2 and there are different atoms in unit cell, three acousticbranches are present: one longitudinal (the displacement of the atoms takes placealong the wave propagation) and two transversal branches (perpendicular move-ment of atoms to the energy transfer direction is observed). Acoustic phononsare just coherent movements of atoms (of the lattice) out of their equilibriumpositions. Acoustic phonons exhibit a linear relationship between frequency andphonon wavevector for long wavelengths (low value of q) and for q → 0 the en-ergy transfer also tends to zero. The rest of phonon branches (3n− 3) representout-of-phase movement of the atoms in the lattice (one atom moves to the given
31
direction, while neighboring atom to opposite direction - it is caused by differentmass or charge of individual atoms in the lattice) and are called optical modes.The optical phonons exhibit non-zero frequency also in the center of the Brillouinzone as positive and negative ions at adjacent lattice sites move against eachother, creating a time-varying electrical dipole moment.
The magnons (= quanta of spin waves) in the magnetic material could bedescribed in a very similar way as phonons, taking the magnetic lattice insteadof crystal lattice. Thermal energy and quantum zero-point fluctuations cause thefluctuation of individual magnetic moments in an ordered structure. The spins inthe material are coupled to one another by exchange interactions leading to thecollective excitations. One can again directly measure the dispersion relationsωj(~q) of spin waves in the material by neutron scattering techniques. In general,the dispersion relations for ferromagnet and antiferromagnet differs significantlyas the spin wave intensity for antiferromagnet is strong near an antiferromag-netic superlattice peak and weak near a Bragg peak of the nuclear lattice. Thedispersion relations for Heisenberg ferromagnet and antiferromagnet with onlynearest-neighbor interactions at small q are quadratically and linearly dependenton q: ωj(~q) ∝ q2 and ωj(~q) ∝ q, respectively. One should define the scatteringfunction for each type of material separately. Moreover, the multiple magnonscattering or magnetic domains in the material have to be taken into account.
One can continue with the neutron scattering theory and with description ofneutron scattering techniques in detail. We did not mention a large amount ofimportant aspects and properties of scattering on matter, e.g. diffuse scattering,usage of polarized neutrons, spin echo technique or very important resolutionfunction. Nevertheless, given introduction should be sufficient for good under-standing to the present thesis. We finish the theoretical part here and recommende.g. Refs. [23, 28, 24] for further reading.
32
3. Vibron states
The electron–phonon (e–p) interaction is often neglected in many materials be-cause only subtle effects of this interaction are observed. Nevertheless, there aremany materials in which the e–p interaction has to be taken into account, forexample the BCS superconductors. Another interesting feature, the strong inter-action between crystal field excitations and phonon modes has been described ina few cases. This type of interaction leads to the formation of a vibron quasi-bound state, which has been directly observed as an additional peak in the en-ergy spectra of several Ce-based intermetallic compounds, e.g. CeAl2 [29, 30],CePt2 [31, 32], CePd2Al2 [3] or recently CeCuAl3 [4], and also in PrNi2 [2]. Anadditional peak in energy spectra of mentioned compounds could be describedwithin Thalmeier–Fulde model [1], which was generalized also for compoundscrystallizing in tetragonal structure [3, 4]. Vibron states are featured by a strongmagneto-elastic coupling between orbital and lattice degrees of freedom. Such acoupling results in the changes of macroscopic properties as well as in a new typeof (hybrid) magneto-phonon mode [1, 4].
3.1 Vibron states in CeAl2
The most prominent (and probably first) compound, where the vibron state wasobserved is cubic CeAl2. First inelastic neutron study by Steglich et al. [29] waspublished in 1979. Already three years later, Thalmeier and Fulde developeda theory behind the observation of an additional peak in the crystal electricspectrum of CeAl2 [1].
CeAl2 crystallizes in cubic face-centered Cu2Mg-type structure (cubic Lavephase, C15, space group 227). Such a crystal structure is common also to CePt2[31, 32] and PrNi2 [2]. Ce atoms in this structure form a diamond lattice, whileAl atoms occupy tetrahedral positions [33]. CeAl2 is the Kondo compound whichorders antiferromagnetically below Neel temperature of 3.8 K. Although the an-tiferromagnetic ordering was ascertained [34], the magnetic structure was notcompletely solved for more than 30 years (despite the efforts). Finally, Schweizer
et al. [35] determined the magnetic structure as incommensurate double-~k struc-ture with magnetic moments on two Ce sites described by two elliptical helicesof opposed chiralities lying in the (110) plane.
The inelastic neutron scattering study of crystal field excitations in CeAl2 [29]led to the observation of two CF-like peaks in energy spectrum. According to theKramer’s theorem (see section 1.2), Ce3+ ions in the 4f 1 electronic configuration(J = 5
2) exhibit always the splitting into maximum three energy levels, see Figure
1.2. In the case of cubic structure, the splitting into doublet and quartet isrealized, only. Therefore, one expects only one peak in the energy spectrum ofCeAl2 bounded with only one CF excitation from doublet ground state Γ7 toexcited quartet Γ8. The explanation of two peaks in CeAl2 spectrum given byThalmeier and Fulde [1] leads to Figure 3.1. Instead of expected excited quartetΓ8, two crystal field levels are observed. The interaction of CF exciton with highphonon density of states (hω0 = 12 meV) results in a new bound state [1] (panelb) in Figure 3.1) and two CF-like peaks in energy spectrum at 8.9 and 15.7 meV
33

Figure 3.1: The schema of energy levels splitting in CeAl2 taken from Refs.[1, 30]. Panel a) shows the expected line splitting, while panel b) representsobserved splitting. The grey region (right) corresponds to energies with highphonon density of states.
are observed [29].Both theoretical description [36] and investigation of phonon branches in
CeAl2 [30, 33] have supported former Thalmeier-Fulde theory [1]. The energyspectrum thus cannot be described only by pure CF hamiltonian. Another termdescribing the CF exciton-phonons interaction has to be taken into account [1]:
Htot = HCF + Hint =∑
mn
BnmO
nm − g0
∑
µ
(aµ + a+µ )Oµ. (3.1)
The large value of magneto-elastic constant, g0 = 0.54 meV, compared to otherRAl2, was supported by the pronounced softening of the c44 elastic mode. Andit was claimed that the origin of large value of magneto-elastic constant lies inthe hybridisation of Ce 4f electron with conduction electrons [36]. Also the ex-perimental observation of low-temperature inelastic linewidths much larger thanthe width of elastic line [37] was satisfactorily explained by dynamic crystal fieldtheory [38]. Despite both the theory and the experimental investigation of vibronstates have brought a significant piece of knowledge about this phenomenon, es-pecially in the case of CeAl2, the research on this subject is still not finished. Thevibron states in tetragonal compounds CePd2Al2 [3] and CeCuAl3 [4] remain stillnot sufficiently explained and form the content of this thesis.
3.2 Tetragonal CeTX3 compounds and vibron
state in CeCuAl3
The tetragonal CeTX3 or more generally CeTxX4−x compounds, where T is atransition element d-metal and X is a p-metal, exhibit various ground states andphenomena depending on the actual chemical composition and/or applied exter-nal pressure. Most of these compounds, for example CeRhGe3 [39], CeAuAl3 [40]
34
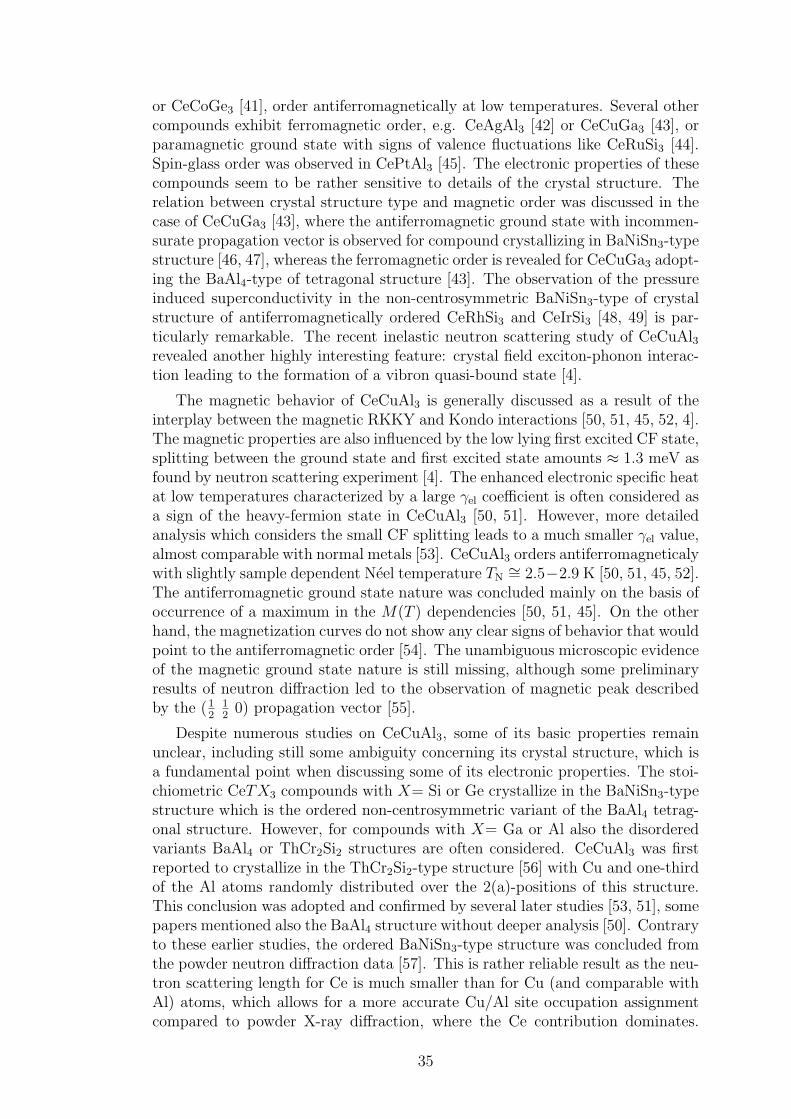
or CeCoGe3 [41], order antiferromagnetically at low temperatures. Several othercompounds exhibit ferromagnetic order, e.g. CeAgAl3 [42] or CeCuGa3 [43], orparamagnetic ground state with signs of valence fluctuations like CeRuSi3 [44].Spin-glass order was observed in CePtAl3 [45]. The electronic properties of thesecompounds seem to be rather sensitive to details of the crystal structure. Therelation between crystal structure type and magnetic order was discussed in thecase of CeCuGa3 [43], where the antiferromagnetic ground state with incommen-surate propagation vector is observed for compound crystallizing in BaNiSn3-typestructure [46, 47], whereas the ferromagnetic order is revealed for CeCuGa3 adopt-ing the BaAl4-type of tetragonal structure [43]. The observation of the pressureinduced superconductivity in the non-centrosymmetric BaNiSn3-type of crystalstructure of antiferromagnetically ordered CeRhSi3 and CeIrSi3 [48, 49] is par-ticularly remarkable. The recent inelastic neutron scattering study of CeCuAl3revealed another highly interesting feature: crystal field exciton-phonon interac-tion leading to the formation of a vibron quasi-bound state [4].
The magnetic behavior of CeCuAl3 is generally discussed as a result of theinterplay between the magnetic RKKY and Kondo interactions [50, 51, 45, 52, 4].The magnetic properties are also influenced by the low lying first excited CF state,splitting between the ground state and first excited state amounts ≈ 1.3 meV asfound by neutron scattering experiment [4]. The enhanced electronic specific heatat low temperatures characterized by a large γel coefficient is often considered asa sign of the heavy-fermion state in CeCuAl3 [50, 51]. However, more detailedanalysis which considers the small CF splitting leads to a much smaller γel value,almost comparable with normal metals [53]. CeCuAl3 orders antiferromagneticalywith slightly sample dependent Neel temperature TN
∼= 2.5−2.9 K [50, 51, 45, 52].The antiferromagnetic ground state nature was concluded mainly on the basis ofoccurrence of a maximum in the M(T ) dependencies [50, 51, 45]. On the otherhand, the magnetization curves do not show any clear signs of behavior that wouldpoint to the antiferromagnetic order [54]. The unambiguous microscopic evidenceof the magnetic ground state nature is still missing, although some preliminaryresults of neutron diffraction led to the observation of magnetic peak describedby the (1
2120) propagation vector [55].
Despite numerous studies on CeCuAl3, some of its basic properties remainunclear, including still some ambiguity concerning its crystal structure, which isa fundamental point when discussing some of its electronic properties. The stoi-chiometric CeTX3 compounds with X= Si or Ge crystallize in the BaNiSn3-typestructure which is the ordered non-centrosymmetric variant of the BaAl4 tetrag-onal structure. However, for compounds with X= Ga or Al also the disorderedvariants BaAl4 or ThCr2Si2 structures are often considered. CeCuAl3 was firstreported to crystallize in the ThCr2Si2-type structure [56] with Cu and one-thirdof the Al atoms randomly distributed over the 2(a)-positions of this structure.This conclusion was adopted and confirmed by several later studies [53, 51], somepapers mentioned also the BaAl4 structure without deeper analysis [50]. Contraryto these earlier studies, the ordered BaNiSn3-type structure was concluded fromthe powder neutron diffraction data [57]. This is rather reliable result as the neu-tron scattering length for Ce is much smaller than for Cu (and comparable withAl) atoms, which allows for a more accurate Cu/Al site occupation assignmentcompared to powder X-ray diffraction, where the Ce contribution dominates.
35
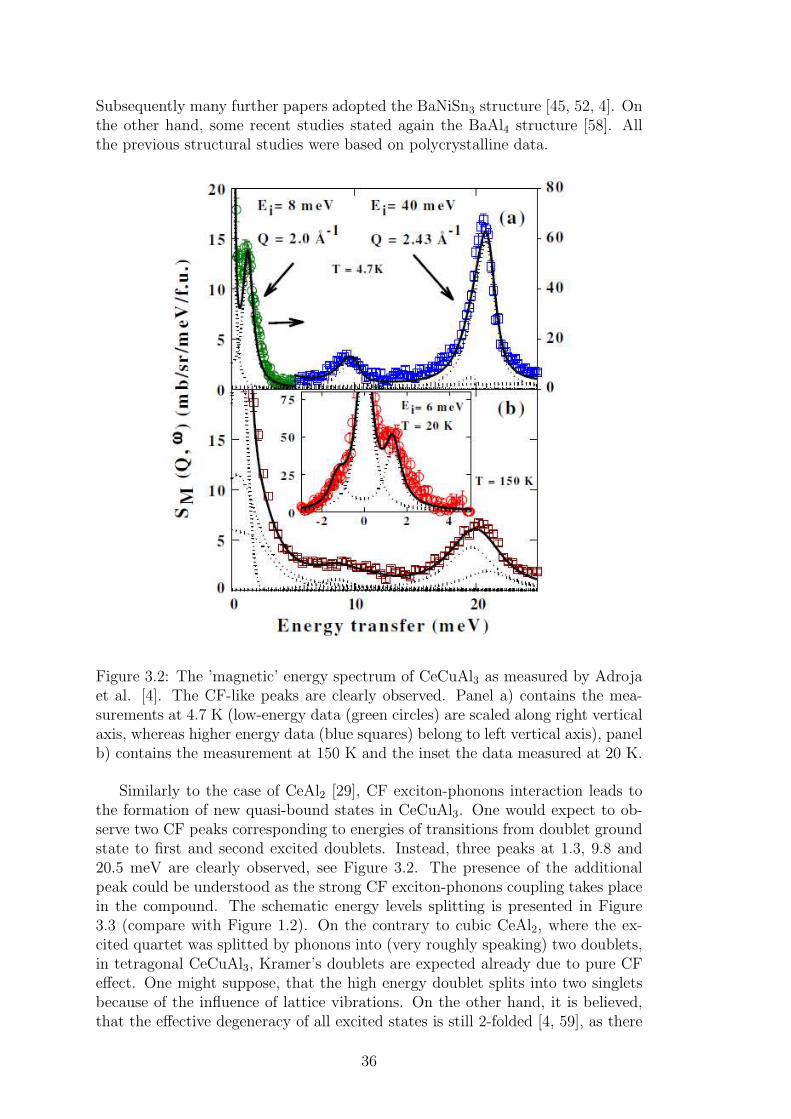
Subsequently many further papers adopted the BaNiSn3 structure [45, 52, 4]. Onthe other hand, some recent studies stated again the BaAl4 structure [58]. Allthe previous structural studies were based on polycrystalline data.
Figure 3.2: The ’magnetic’ energy spectrum of CeCuAl3 as measured by Adrojaet al. [4]. The CF-like peaks are clearly observed. Panel a) contains the mea-surements at 4.7 K (low-energy data (green circles) are scaled along right verticalaxis, whereas higher energy data (blue squares) belong to left vertical axis), panelb) contains the measurement at 150 K and the inset the data measured at 20 K.
Similarly to the case of CeAl2 [29], CF exciton-phonons interaction leads tothe formation of new quasi-bound states in CeCuAl3. One would expect to ob-serve two CF peaks corresponding to energies of transitions from doublet groundstate to first and second excited doublets. Instead, three peaks at 1.3, 9.8 and20.5 meV are clearly observed, see Figure 3.2. The presence of the additionalpeak could be understood as the strong CF exciton-phonons coupling takes placein the compound. The schematic energy levels splitting is presented in Figure3.3 (compare with Figure 1.2). On the contrary to cubic CeAl2, where the ex-cited quartet was splitted by phonons into (very roughly speaking) two doublets,in tetragonal CeCuAl3, Kramer’s doublets are expected already due to pure CFeffect. One might suppose, that the high energy doublet splits into two singletsbecause of the influence of lattice vibrations. On the other hand, it is believed,that the effective degeneracy of all excited states is still 2-folded [4, 59], as there
36
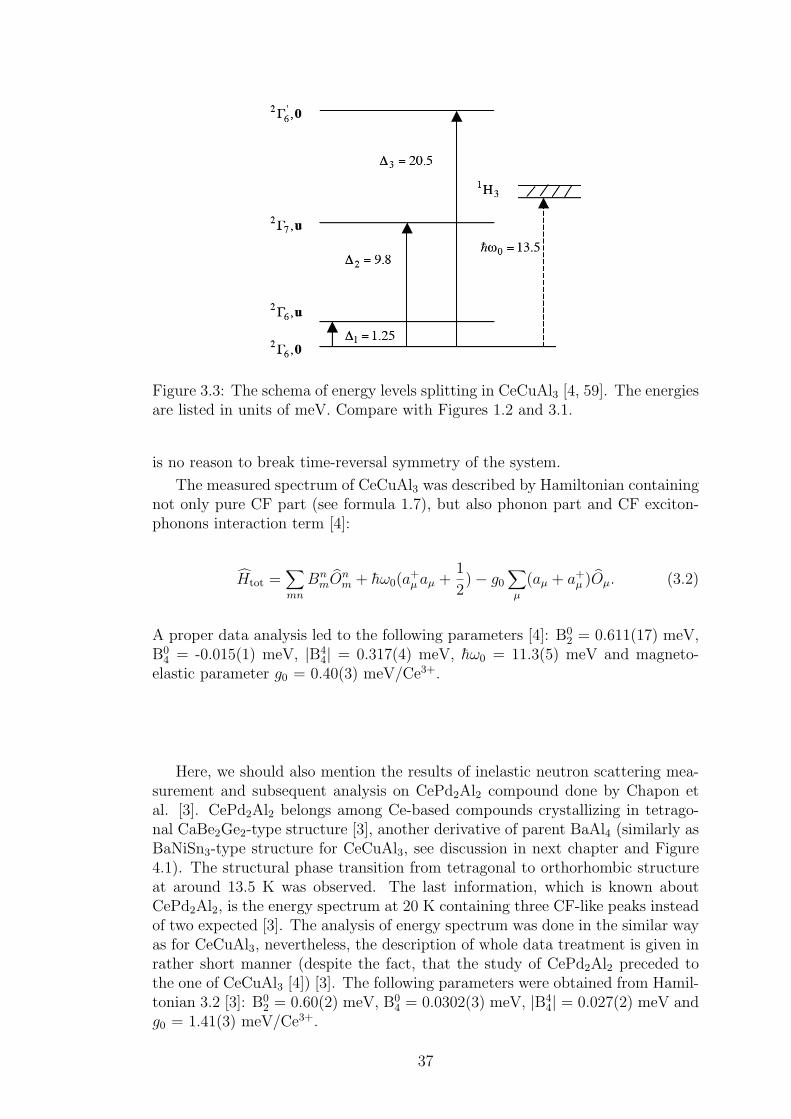
Figure 3.3: The schema of energy levels splitting in CeCuAl3 [4, 59]. The energiesare listed in units of meV. Compare with Figures 1.2 and 3.1.
is no reason to break time-reversal symmetry of the system.
The measured spectrum of CeCuAl3 was described by Hamiltonian containingnot only pure CF part (see formula 1.7), but also phonon part and CF exciton-phonons interaction term [4]:
Htot =∑
mn
BnmO
nm + hω0(a
+µ aµ +
1
2)− g0
∑
µ
(aµ + a+µ )Oµ. (3.2)
A proper data analysis led to the following parameters [4]: B02 = 0.611(17) meV,
B04 = -0.015(1) meV, |B4
4| = 0.317(4) meV, hω0 = 11.3(5) meV and magneto-elastic parameter g0 = 0.40(3) meV/Ce3+.
Here, we should also mention the results of inelastic neutron scattering mea-surement and subsequent analysis on CePd2Al2 compound done by Chapon etal. [3]. CePd2Al2 belongs among Ce-based compounds crystallizing in tetrago-nal CaBe2Ge2-type structure [3], another derivative of parent BaAl4 (similarly asBaNiSn3-type structure for CeCuAl3, see discussion in next chapter and Figure4.1). The structural phase transition from tetragonal to orthorhombic structureat around 13.5 K was observed. The last information, which is known aboutCePd2Al2, is the energy spectrum at 20 K containing three CF-like peaks insteadof two expected [3]. The analysis of energy spectrum was done in the similar wayas for CeCuAl3, nevertheless, the description of whole data treatment is given inrather short manner (despite the fact, that the study of CePd2Al2 preceded tothe one of CeCuAl3 [4]) [3]. The following parameters were obtained from Hamil-tonian 3.2 [3]: B0
2 = 0.60(2) meV, B04 = 0.0302(3) meV, |B4
4| = 0.027(2) meV andg0 = 1.41(3) meV/Ce3+.
37
The study of energy spectra and vibron states in CeCuAl3 and CePd2Al2 andthe relation between microscopic and macroscopic properties of these compoundsrepresent the main goal of the thesis. We investigated the crystal structures,electronic properties and magnetic structures of these compounds using a varietyof experimental techniques including the neutron scattering experiments.
Together with a detailed investigation of a CeCuAl3 single crystal, we stud-ied also several substituted systems to obtain a broader picture of the micro-scopic nature of CeCuAl3 and its changes with the doping. The isostructuralCe(Cu,Al)4, Ce(Cu,Au)Al3 and CeCu(Al,Ga)3 series were investigated in courseof Ph.D. work. The results of structural and bulk magnetic properties of the lattertwo series are summarized in our papers [60, 61] and are not included in the textof the thesis to keep its reasonable length. Here we focus on the Ce(Cu,Al)4 series,in which the crystal field excitations and possible vibron states were investigatedby inelastic neutron scattering.
CePd2Al2 single crystal and whole CePd2(Al,Ga)2 series were also closelystudied. Most of the results of bulk measurements and X-ray diffraction on singlecrystal as well as the pressure experiments on studied compounds are describedin details in master thesis of Petr Dolezal, who collaborated in this subject [62],and our papers [63, 64]. During our systematic investigation of CePd2Al2−xGaxand LaPd2Al2−xGax compounds, the superconductivity of lanthanum compoundswas found in the whole series. The superconductivity in this series cannot bediscussed purely in terms of BCS theory as there is a significant deviation fromthe expected behavior. The details on the superconductivity in LaPd2(Al,Ga)2are given in our paper [65]. Again, the above mentioned subjects are not includedin the text of this thesis to keep its reasonable length and not to overlap with otherstudent theses. Here we focus on the crystal field and vibron state developmentin CePd2(Al,Ga)2 and a possible connection to the structural phase transition inthese compounds.
38
4. Results and discussion
4.1 CeCuAl3 and CeTX3 compounds
The Ce-based intermetallic CeTX3 compounds, where T is a transition elementd-metal and X is a p-metal, have been intensively investigated in last years fortheir exotic properties, especially at low temperatures. The electronic propertiesof CeTX3 compounds are strongly dependent on competition between long-rangeRKKY interaction and Kondo interaction. The influence of crystal electric fieldplays also an important role. The ground states and phenomena in these com-pounds are strongly influenced by chemical composition and/or external pressure,see previous section 3.2. The magnetic structure was determined for only severalCeTX3 compounds so far, due to often small magnetic moment and low orderingtemperature. Also the investigation of crystal structure is not always straight-forward as Ce contribution to diffraction patterns dominates, while T and Xelements contribute with a similar strength (at least in the case of powder X-raydiffraction).
4.1.1 Crystal structure in CeTX3 compounds
CeTX3, or more generally Ce(T,X)4, compounds crystallize frequently in thetetragonal structure of BaAl4-type and its derivates. Table 4.1 summarizes thecrystal structure parameters of previously investigated CeTX3 compounds. Sev-eral compounds from CeTX3 family adopt a cubic structure, e.g. CeRuSn3
[66] or CeRhSn3 [67]. CeRuGe3 [68], CeNiGe3 [69] and CeAgAl3 [70] crystal-lize in orthorhombic structure. The orthorhombic structure was reported alsofor CePdGa3 [71] and CePtGa3 [72], however this Fmm2 structure is very sim-ilar to parent BaAl4 structure: the lattice parameters aorth and borth differ sub-tle only, while a-axis is identical with the diagonal of BaAl4-type structure, i.e.atetr = aorth√
2≈ 4.31 A for these compounds (see Table 4.1). We stress out the
case of CeTAl3 compounds with T = Cu, Ag and Au. The isoelectronic sub-stitution of d-metal element (i.e. the change of lattice parameters) causes interalia the change of crystal structure from tetragonal for CeCuAl3 to orthorhombicfor CeAgAl3 [70] and back to tetragonal for CeAuAl3 [73]. Also the magneticstructure in CeAgAl3 was reported to be ferromagnetic [42], whereas other twocompounds exhibit antiferromagnetic ground state [51, 40]. Such an observationdocuments an important role of chemical composition on the physical propertiesin CeTX3 compounds.
The tetragonal centrosymmetric BaAl4-type structure (I4/mmm, 139) and itsderivates, centrosymmetric ThCr2Si2 (I4/mmm, 139), ordered primitive CaBe2Ge2(P4/nmm, 129) and ordered non-centrosymmetric BaNiSn3 (I4mm, 107) struc-tures, differ from each other by different stacking of d- and p-metal element planes(of CeTX3 compounds) along the tetragonal c-axis, while the Ce atomic posi-tions remain the same. All mentioned structure types are shown in Figure 4.1.In BaAl4-type, T and X atoms are randomly distributed over the 2(a) and 4(b)sites, leading to centrosymmetric structure. In the ThCr2Si2-type, the randomdistribution remains on the 2(a) positions, whereas the 4(b) sites are occupied
39

Table 4.1: The crystal structure types and lattice parameters of previously studiedCeTX3 compounds. The c/a ratio and volume of fundamental unit cell, V , arelisted as well. The lattice parameters of CeCuAl3 (*) were determined during ourrecent investigation of single crystal (see following section and Ref. [74]).
Compound Structure a (A) b (A) c (A) c/a V (A3) Ref.type
CeFeGe3 BaNiSn3 4.3320 9.9550 2.2980 186.8178 [75]CeRuSi3 BaNiSn3 4.2070 9.9260 2.3594 175.6788 [76]CeRuGe3 Cmmm 21.850 4.234 4.285 396.4178 [68]CeRuSn3 Pm3n 9.726 920.03 [66]CeRhSn3 Pm3n 9.7115 915.92 [67]CeCoSi3 BaNiSn3 4.1350 9.5670 2.3137 163.5787 [77]CeCoGe3 BaNiSn3 4.3204 9.8348 2.2764 183.5750 [41]CeRhSi3 BaNiSn3 4.2690 9.7380 2.2811 177.4688 [78]CeRhGe3 BaNiSn3 4.3960 10.0224 2.2799 193.6810 [39]CeIrSi3 BaNiSn3 4.2520 9.7150 2.2848 175.6424 [79]CeIrGe3 BaNiSn3 4.4010 10.0240 2.2777 194.1529 [80]CeNiGa3 ThCr2Si2 4.25 10.24 2.4094 184.96 [81]CeNiGe3 Cmma 4.1391 21.828 4.1723 376.9601 [69]CePdAl3 BaNiSn3 4.3435 10.9536 2.5218 206.6486 [70]CePdGa3 Fmm2 6.1036 6.1624 10.3971 419.6212 [71]CePdSi3 BaNiSn3 4.3300 9.6310 2.2242 180.5707 [82]CePdSb3 CaBe2Ge2 4.482 9.860 2.1999 198.0709 [81]CePtAl3 BaNiSn3 4.3239 10.6670 2.4670 199.4314 [70]CePtAl3 BaAl4 4.311 10.668 2.4746 198.2618 [45]CePtGa3 Fmm2 6.100 6.113 10.512 391.99 [72]CePtSi3 BaNiSn3 4.3215 9.6075 2.2232 179.4235 [83]CeCuAl3 BaNiSn3 4.2620 10.6806 2.5060 194.0093 [74]*CeCuGa3 BaNiSn3 4.2450 10.4200 2.4547 187.7687 [46]CeCuGa3 BaAl4 4.2729 10.4359 2.4423 190.5353 [43]CeAgAl3 Cmcm 6.2101 6.1186 10.8691 412.9950 [70]CeAuAl3 BaNiSn3 4.3660 10.8445 2.4839 206.7174 [84]CeAuGa3 BaNiSn3 4.337 10.660 2.4579 200.510 [45]
exclusively by X element. Both structures are clearly centrosymmetric. Thenon-centrosymmetric BaNiSn3 is completely ordered structure type with follow-ing atomic coordinates:
2Ce in 2(a): (0, 0, zCe), (12, 12, 12+ zCe)
2T in 2(a): (0, 0, zT ), (12, 12, 12+ zT )
2X in 2(a): (0, 0, zXa), (1
2, 12, 12+ zXa
)
4X in 4(b): (0, 12, zXb
), (12, 0, zXb
), (12, 1, 1
2+ zXb
), (1, 12, 12+ zXb
),
where z... represents the shift along the c-axis, while zCe ≈ 0 and zXb≈ 0.25. The
case of CaBe2Ge2-type structure is slightly different as the mutual stacking oflayers along the tetragonal axis leads to ordered centrosymmetric structure with
40
primitive unit cell. Figure of primitive unit cell will be shown in following section4.2 together with the study of CePd2Al2 compound. CaBe2Ge2-type structurehas two possible origins shifted by (1
4,−1
4, 0) to each other. The unit cell with
the origin 1 described by atomic coordinates:
2Ce in 2(c): (0, 12, zCe), (
12, 0,−zCe)
2T in 2(a): (0, 0, 0), (12, 12, 0)
2T in 2(c): (0, 12, zTc
), (12, 0,−zTc
)
2X in 2(b): (0, 0, 12), 1
2, 12, 12)
2X in 2(c): (0, 12, zXc
), (12, 0,−zXc
)
could be shown in the same way as other BaAl4 derivates by shifting the atomicpositions by (1
2, 0,−zCe). Alternatively, the structure with origin 2 with atomic
positions shifted by (14, 14, zCe) would lead to the same representation. The el-
ementary cell of CaBe2Ge2-type structure shown in Figure 4.1 is thus not theprimitive unit cell.
4.1.2 Crystal structure of CeCuAl3
Crystal structure determination on CeCuAl3 single crystal
Several tetragonal crystal structures were suggested for CeCuAl3 by pollycrys-talline studies [56, 53, 51, 50, 57, 45, 52, 4, 58], as introduced in section 3.2.Nevertheless, the determination of crystal structure type based on powder X-raydiffraction is very complicated as Ce atoms contribute significantly stronger todiffraction patterns than Cu and Al (which contribute similarly due to similarnumber of electrons). To distinguish between structure types shown in Figure4.1, the precise method allowing observation of Cu and Al atoms in given atomicpositions is needed. The diffraction experiment on single crystal employing afour-circle goniometer is one of the methods allowing a correct determination ofcrystal structure type.
The preparation of CeCuAl3 single crystal and its structural and chemicalcharacterization is described in sections 2.1 and 2.2: the single crystal was pre-pared from polycrystalline precursor using the Czochralski growing method. Pre-pared polycrystalline sample was annealed for 8 days at 900oC in quartz tube,the rate of heating the sample from room temperature was 3oC per minute, therate of cooling down from 900oC was 1oC per minute. The single crystal wasfirst investigated in its as-cast form and subsequently it has been annealed in thesame way as polycrystalline sample.
The prepared ingot (Figure 2.1) was investigated by means of Laue X-ray andneutron diffraction verifying the quality and tetragonal symmetry of the sample(see Figure 2.4). The powder X-ray diffraction on powderized part of singlecrystal recorded at room temperature confirms that this compound crystallizesin the tetragonal structure. The best fit of the diffraction pattern was obtainedfor the BaNiSn3-type structure (RBragg = 6.9% compared to RBragg = 31.3% forthe ThCr2Si2-type). Introducing certain degree of Cu-Al disorder to the BaNiSn3
structure did not lead to any improvement of the fit. We examined closely also thediffraction patterns of polycrystalline sample with similar result. These results,pointing to the BaNiSn3 structure, are well consistent with the neutron diffraction
41

BaAl4
ThCr2Si2 CaBe2Ge2 BaNiSn3
Ba
Al
Th
Cr
Si
Ca
Be
Ge
Ba
Ni
Sn
Figure 4.1: The tetragonal structure types: centrosymmetric BaAl4 (I4/mmm,139) and three its derivatives - centrosymmetric ThCr2Si2 (I4/mmm, 139), or-dered primitive CaBe2Ge2 (P4/nmm, 129) and ordered non-centrosymmetricBaNiSn3 (I4mm, 107) structure. CaBe2Ge2-type structure has two possible ori-gins shifted by (1
4,−1
4, 0) to each other; presented figure was drawn taking the
origin 1 shifted by (12, 0,−zCe) or alternatively origin 2 shifted by (1
4, 14, zCe), i.e.
the primitive unit cell is not shown, for better lucidity.
data [57]. However, we should have in mind somewhat limited sensitivity ofpowder X-ray diffraction to Cu and Al positions and Cu-Al disorder.
The crystal structure was then uniquely determined by single crystal X-raydiffraction (295 independent reflections, Rint = 0.0169) as tetragonal BaNiSn3-type structure (space group I4mm, 107) without any sign of disorder in Cu and Alatomic positions. We should note, that the best structure solution was obtainedwhen a racemic-twinning has been introduced. It seems that there exists twoequally populated domains which are connected by a mirroring, where the mirrorplane is perpendicular to the four-fold axis. The refined structure parametersat room temperature and at 150 K are summarized in Table 4.2. The thermaldisplacements of atoms are listed in Table 4.2 as well.
The chemical composition investigation of our CeCuAl3 single crystal as wellas polycrystalline sample was done employing the EDX analysis. The analysisconfirms the stochiometric composition Ce:Cu:Al = 1:1:3 (with up to 0.03 error
42

Table 4.2: Structure parameters of CeCuAl3 single crystal determined from X-raydiffraction patterns taken at 150 K and at room temperature. V f.u. is the volumeper fundamental unit cell. zCe, zCu, zAla and zAlb are fraction coordinates of atomsin the unit cell (see previous subsection 4.1.1). R is the agreement factor for thefit of diffraction patterns (goodness of fit on F 2). The thermal displacementsof atoms are described by: -2π2(h2a∗2U11 + ... + 2hka∗b∗U12), where matrixelements U12, U13 and U23 are equal to zero. SHELXS-97 program employing theRietveld analysis was used for the determination of structure parameters.
T (K) 150 296a (pm) 425.27(3) 426.20(2)c (pm) 1066.80(7) 1068.06(5)c/a 2.5085(2) 2.5060(2)Vf.u. (10
6pm3) 96.47(2) 97.01(2)atomic positions:2Ce in 2(a) (0, 0, 0fix) (0, 0, 0fix)2Cu in 2(a) (0, 0, 0.0946(3)) (0, 0, 0.0942(2))2Al in 2(a) (0, 0, 0.3689(1)) (0, 0, 0.36909(8))4Al in 4(b) (0, 1
2, 0.2508(2)) (0, 1
2, 0.2505(2))
thermal displacement:U11 (Ce) 0.0032(2) 0.00490(7)U22 (Ce) 0.0032(2) 0.00490(7)U33 (Ce) 0.0041(2) 0.0069(1)U11 (Cu) 0.0068(4) 0.0097(2)U22 (Cu) 0.0068(4) 0.0097(2)U33 (Cu) 0.0093(7) 0.0108(3)U11 (Al) 0.006(1) 0.0086(9)U22 (Al) 0.006(1) 0.0095(9)U33 (Al) 0.0061(5) 0.0092(3)U11 (Alb) 0.0056(8) 0.0077(4)U22 (Alb) 0.0056(8) 0.0077(4)U33 (Alb) 0.011(2) 0.0128(9)R (%) 2.36 1.12
of analysis). The distribution of elements in sample was also checked by EDXequipment, homogeneous distribution of elements can be seen in Figure 2.3.
Structural phase transition in CeCuAl3
Some properties of CeCuAl3 are slightly influenced by sample thermal treatment[51]. These changes can be ascribed to the annealing process which generallyimproves the quality of the sample, i.e. reduces the residual resistivity and alsoimproves the thermal properties of the sample. To optimize the sample thermaltreatment, the knowledge of the phase diagram and mainly the melting temper-ature is essential. We have performed DSC measurement to reveal the meltingtemperature. Surprisingly, we have observed a further phase transition in courseof these measurements.
43
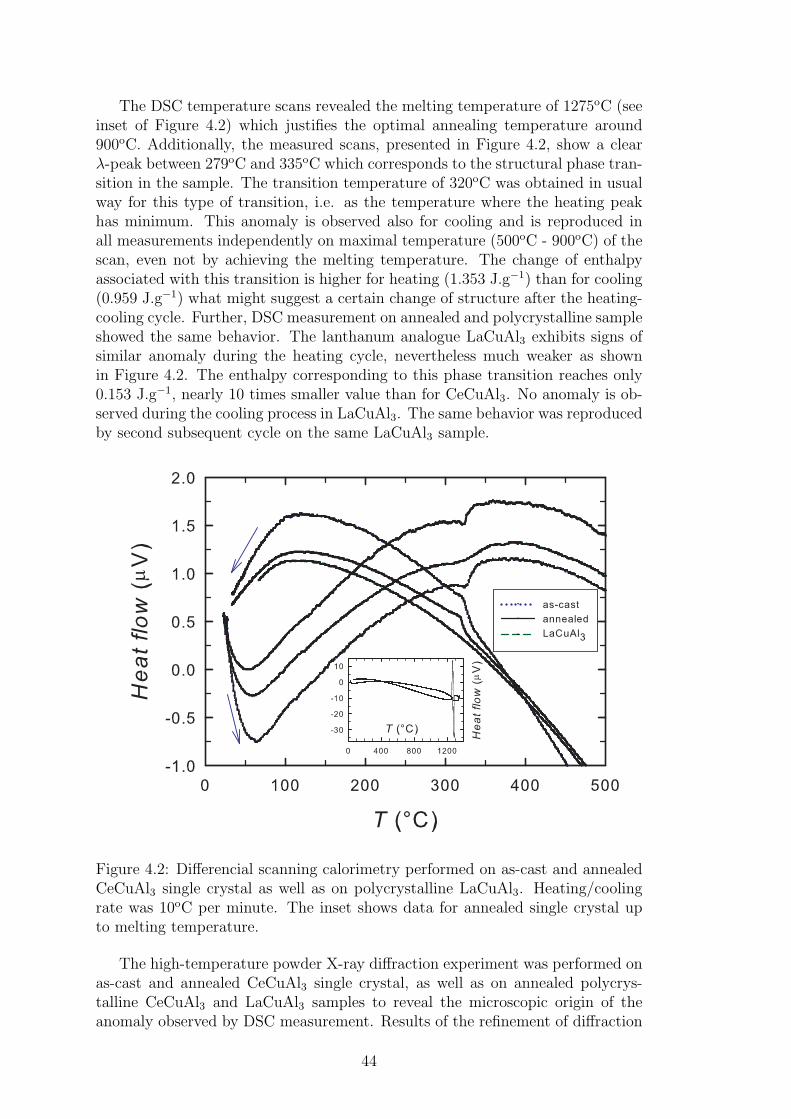
The DSC temperature scans revealed the melting temperature of 1275oC (seeinset of Figure 4.2) which justifies the optimal annealing temperature around900oC. Additionally, the measured scans, presented in Figure 4.2, show a clearλ-peak between 279oC and 335oC which corresponds to the structural phase tran-sition in the sample. The transition temperature of 320oC was obtained in usualway for this type of transition, i.e. as the temperature where the heating peakhas minimum. This anomaly is observed also for cooling and is reproduced inall measurements independently on maximal temperature (500oC - 900oC) of thescan, even not by achieving the melting temperature. The change of enthalpyassociated with this transition is higher for heating (1.353 J.g−1) than for cooling(0.959 J.g−1) what might suggest a certain change of structure after the heating-cooling cycle. Further, DSC measurement on annealed and polycrystalline sampleshowed the same behavior. The lanthanum analogue LaCuAl3 exhibits signs ofsimilar anomaly during the heating cycle, nevertheless much weaker as shownin Figure 4.2. The enthalpy corresponding to this phase transition reaches only0.153 J.g−1, nearly 10 times smaller value than for CeCuAl3. No anomaly is ob-served during the cooling process in LaCuAl3. The same behavior was reproducedby second subsequent cycle on the same LaCuAl3 sample.
Figure 4.2: Differencial scanning calorimetry performed on as-cast and annealedCeCuAl3 single crystal as well as on polycrystalline LaCuAl3. Heating/coolingrate was 10oC per minute. The inset shows data for annealed single crystal upto melting temperature.
The high-temperature powder X-ray diffraction experiment was performed onas-cast and annealed CeCuAl3 single crystal, as well as on annealed polycrys-talline CeCuAl3 and LaCuAl3 samples to reveal the microscopic origin of theanomaly observed by DSC measurement. Results of the refinement of diffraction
44
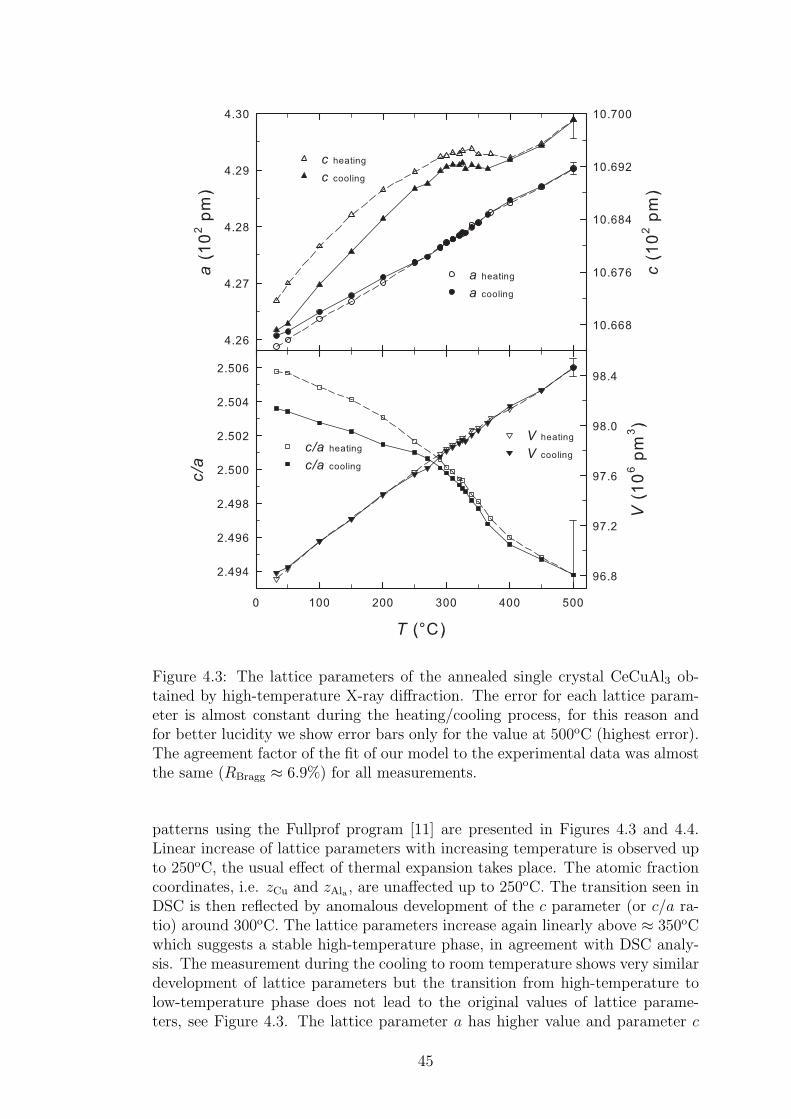
Figure 4.3: The lattice parameters of the annealed single crystal CeCuAl3 ob-tained by high-temperature X-ray diffraction. The error for each lattice param-eter is almost constant during the heating/cooling process, for this reason andfor better lucidity we show error bars only for the value at 500oC (highest error).The agreement factor of the fit of our model to the experimental data was almostthe same (RBragg ≈ 6.9%) for all measurements.
patterns using the Fullprof program [11] are presented in Figures 4.3 and 4.4.Linear increase of lattice parameters with increasing temperature is observed upto 250oC, the usual effect of thermal expansion takes place. The atomic fractioncoordinates, i.e. zCu and zAla , are unaffected up to 250oC. The transition seen inDSC is then reflected by anomalous development of the c parameter (or c/a ra-tio) around 300oC. The lattice parameters increase again linearly above ≈ 350oCwhich suggests a stable high-temperature phase, in agreement with DSC analy-sis. The measurement during the cooling to room temperature shows very similardevelopment of lattice parameters but the transition from high-temperature tolow-temperature phase does not lead to the original values of lattice parame-ters, see Figure 4.3. The lattice parameter a has higher value and parameter c
45

Figure 4.4: The atomic fraction coordinates of annealed single crystal CeCuAl3and LaCuAl3 polycrystal obtained by high-temperature X-ray diffraction. Theerror of determination of atomic positions is ≈ 6.10−3. The lines are to guide theeye.
has lower value compared to initial ones before the heating/cooling cycle. Thechange can be expressed as ∼= 0.05 % of their initial values. Although the latticeparameters in CeCuAl3 are different after heating/cooling cycle, the volume offundamental unit cell stays almost unaffected because the parameters a and cchange in opposite way.
The transition around ≈ 300oC is more visible in development of atomic frac-tion coordinates zCu and zAla plotted in Figure 4.4. The difference between thesecoordinates at temperatures below and above 300oC is ≈ 6.10−3 what representsalmost 2% change of the value of these coordinates (see also illustrative pictureof changed atomic coordinates in Figure 4.5 and changes of interatomic distancesgiven in Table 4.3). We are aware that the numerical error of determination ofthese values is also approximately 6.10−3. Furthermore, the uncertainty of de-
46

termination of atomic positions from powder diffraction data is higher than onlynumerical error. In powder diffraction patterns, we face the problem of overlap-ping of the diffraction lines which is not present when using the single crystaldiffraction data. The overlapping can strongly affect, together with diffractiondata quality, the accuracy of parameters of the structural model. The atom-ic positions determined using single crystal diffraction are much more accurate.The values obtained from powder diffraction are bounded with relatively high er-ror and here serve mainly to follow qualitatively their temperature development.Despite relatively high error, the tendency, scatter of the values and mainly re-producibility of the effect on several samples are clear enough to conclude thatthe phase transition is present in CeCuAl3.
Table 4.3: Interatomic distances in CeCuAl3 obtained by employment of theRietveld analysis at temperatures below and above structural phase transition.The patterns taken on powder sample were processed with Fullprof program [11].The atomic positions are labelled as shown in previous subsection 4.1.1 and Figure4.5.
T Ce-Cu Ce-Ala Ce-Alb Cu-Ala Cu-Alb Ala-Alb(oC) (pm) (pm) (pm) (pm) (pm) (pm)500 329.0(5) 326.9(6) 342.7(7) 250.1(6) 255.8(7) 258.9(6)100 329.7(5) 322.4(7) 341.2(7) 250.8(6) 249.3(7) 261.2(6)
Ce
Al
Cu
Figure 4.5: The BaNiSn3-type structure adopted by CeCuAl3 below 300oC. Theatomic fraction coordinates are changed above 300oC as the smeared Cu andAl atoms with arrows denote. For better clarity, the shift is 10 times highercompared to the real change. The illustrative marking of atoms is done for easierunderstanding the Table 4.3.
The phase transition was observed for both, as-cast and annealed samples, as
47
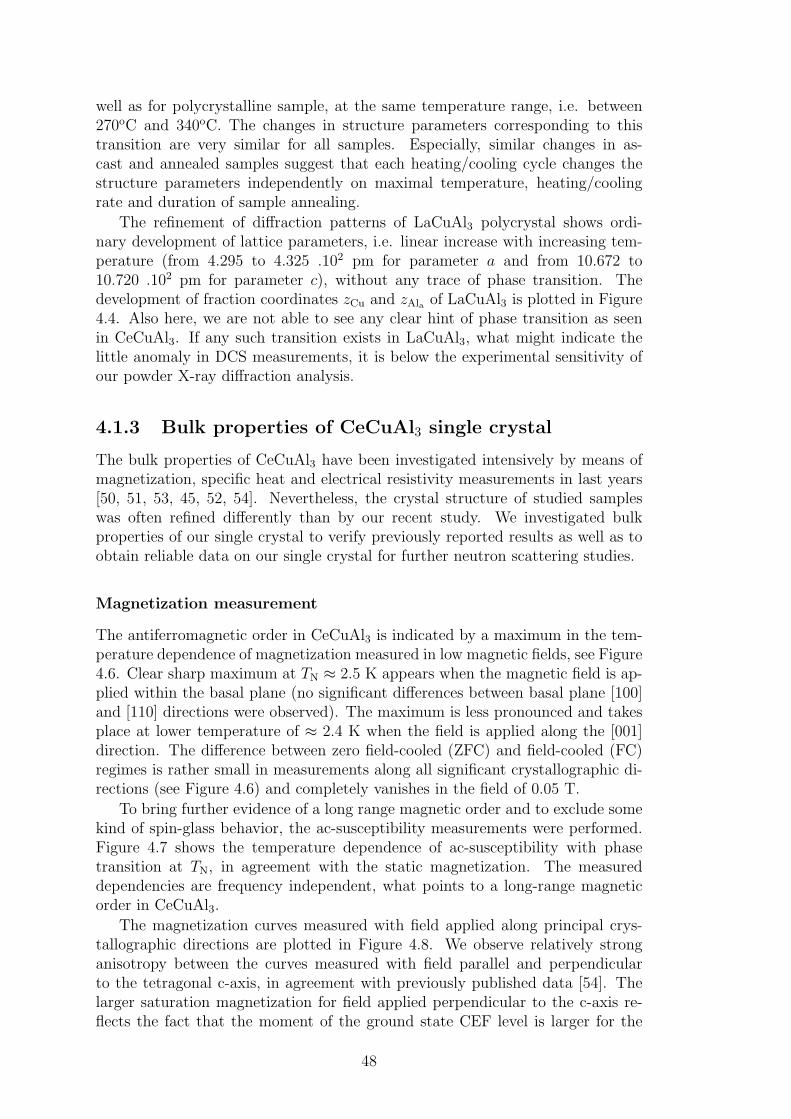
well as for polycrystalline sample, at the same temperature range, i.e. between270oC and 340oC. The changes in structure parameters corresponding to thistransition are very similar for all samples. Especially, similar changes in as-cast and annealed samples suggest that each heating/cooling cycle changes thestructure parameters independently on maximal temperature, heating/coolingrate and duration of sample annealing.
The refinement of diffraction patterns of LaCuAl3 polycrystal shows ordi-nary development of lattice parameters, i.e. linear increase with increasing tem-perature (from 4.295 to 4.325 .102 pm for parameter a and from 10.672 to10.720 .102 pm for parameter c), without any trace of phase transition. Thedevelopment of fraction coordinates zCu and zAla of LaCuAl3 is plotted in Figure4.4. Also here, we are not able to see any clear hint of phase transition as seenin CeCuAl3. If any such transition exists in LaCuAl3, what might indicate thelittle anomaly in DCS measurements, it is below the experimental sensitivity ofour powder X-ray diffraction analysis.
4.1.3 Bulk properties of CeCuAl3 single crystal
The bulk properties of CeCuAl3 have been investigated intensively by means ofmagnetization, specific heat and electrical resistivity measurements in last years[50, 51, 53, 45, 52, 54]. Nevertheless, the crystal structure of studied sampleswas often refined differently than by our recent study. We investigated bulkproperties of our single crystal to verify previously reported results as well as toobtain reliable data on our single crystal for further neutron scattering studies.
Magnetization measurement
The antiferromagnetic order in CeCuAl3 is indicated by a maximum in the tem-perature dependence of magnetization measured in low magnetic fields, see Figure4.6. Clear sharp maximum at TN ≈ 2.5 K appears when the magnetic field is ap-plied within the basal plane (no significant differences between basal plane [100]and [110] directions were observed). The maximum is less pronounced and takesplace at lower temperature of ≈ 2.4 K when the field is applied along the [001]direction. The difference between zero field-cooled (ZFC) and field-cooled (FC)regimes is rather small in measurements along all significant crystallographic di-rections (see Figure 4.6) and completely vanishes in the field of 0.05 T.
To bring further evidence of a long range magnetic order and to exclude somekind of spin-glass behavior, the ac-susceptibility measurements were performed.Figure 4.7 shows the temperature dependence of ac-susceptibility with phasetransition at TN, in agreement with the static magnetization. The measureddependencies are frequency independent, what points to a long-range magneticorder in CeCuAl3.
The magnetization curves measured with field applied along principal crys-tallographic directions are plotted in Figure 4.8. We observe relatively stronganisotropy between the curves measured with field parallel and perpendicularto the tetragonal c-axis, in agreement with previously published data [54]. Thelarger saturation magnetization for field applied perpendicular to the c-axis re-flects the fact that the moment of the ground state CEF level is larger for the
48
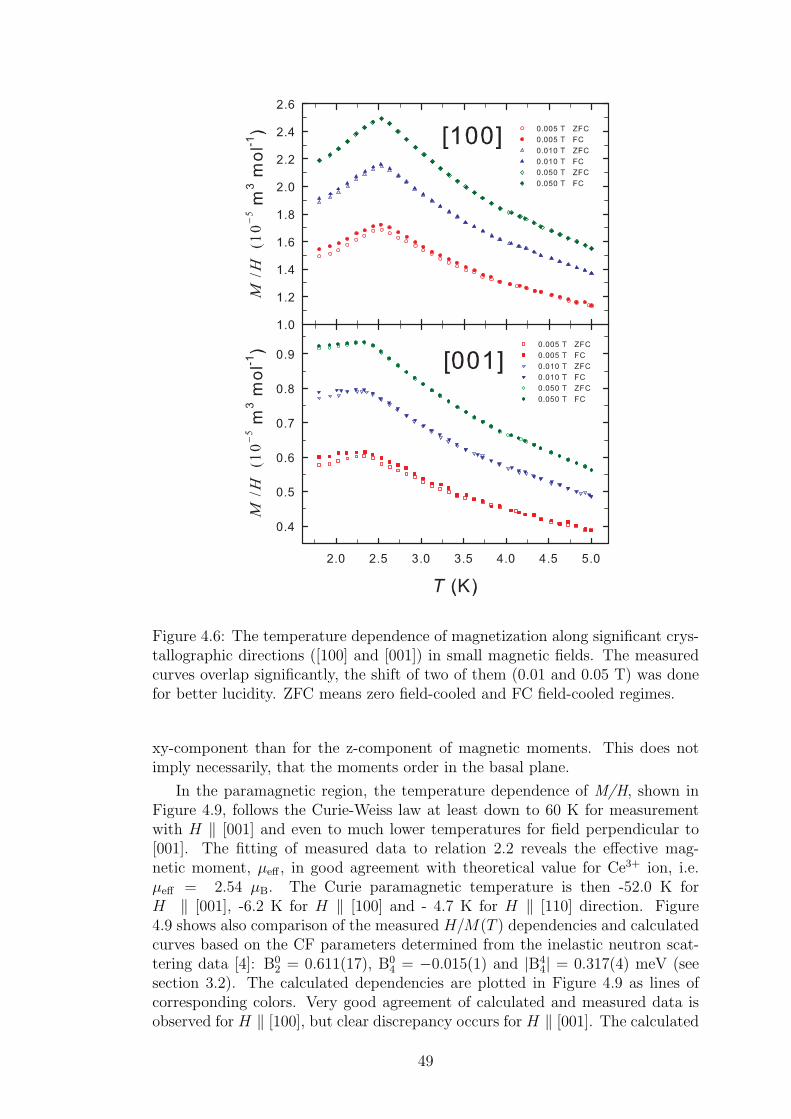
Figure 4.6: The temperature dependence of magnetization along significant crys-tallographic directions ([100] and [001]) in small magnetic fields. The measuredcurves overlap significantly, the shift of two of them (0.01 and 0.05 T) was donefor better lucidity. ZFC means zero field-cooled and FC field-cooled regimes.
xy-component than for the z-component of magnetic moments. This does notimply necessarily, that the moments order in the basal plane.
In the paramagnetic region, the temperature dependence of M/H, shown inFigure 4.9, follows the Curie-Weiss law at least down to 60 K for measurementwith H ‖ [001] and even to much lower temperatures for field perpendicular to[001]. The fitting of measured data to relation 2.2 reveals the effective mag-netic moment, µeff , in good agreement with theoretical value for Ce3+ ion, i.e.µeff = 2.54 µB. The Curie paramagnetic temperature is then -52.0 K forH ‖ [001], -6.2 K for H ‖ [100] and - 4.7 K for H ‖ [110] direction. Figure4.9 shows also comparison of the measured H/M(T ) dependencies and calculatedcurves based on the CF parameters determined from the inelastic neutron scat-tering data [4]: B0
2 = 0.611(17), B04 = −0.015(1) and |B4
4| = 0.317(4) meV (seesection 3.2). The calculated dependencies are plotted in Figure 4.9 as lines ofcorresponding colors. Very good agreement of calculated and measured data isobserved for H ‖ [100], but clear discrepancy occurs for H ‖ [001]. The calculated
49

Figure 4.7: The real part of ac-susceptibility measured along [100] direction ofCeCuAl3 single crystal. The curves for all frequencies overlap, therefore eachfrequency curve is shifted by -0.2 from the previous one, for better lucidity. Thecurve for frequency of 0.13 Hz is not shifted.
Figure 4.8: The magnetic field dependence of magnetization with magnetic fieldapplied along [100], [110] and [001] directions at temperatures 1.8 and 10 K, i.e.below and above ordering temperature, respectively.
50
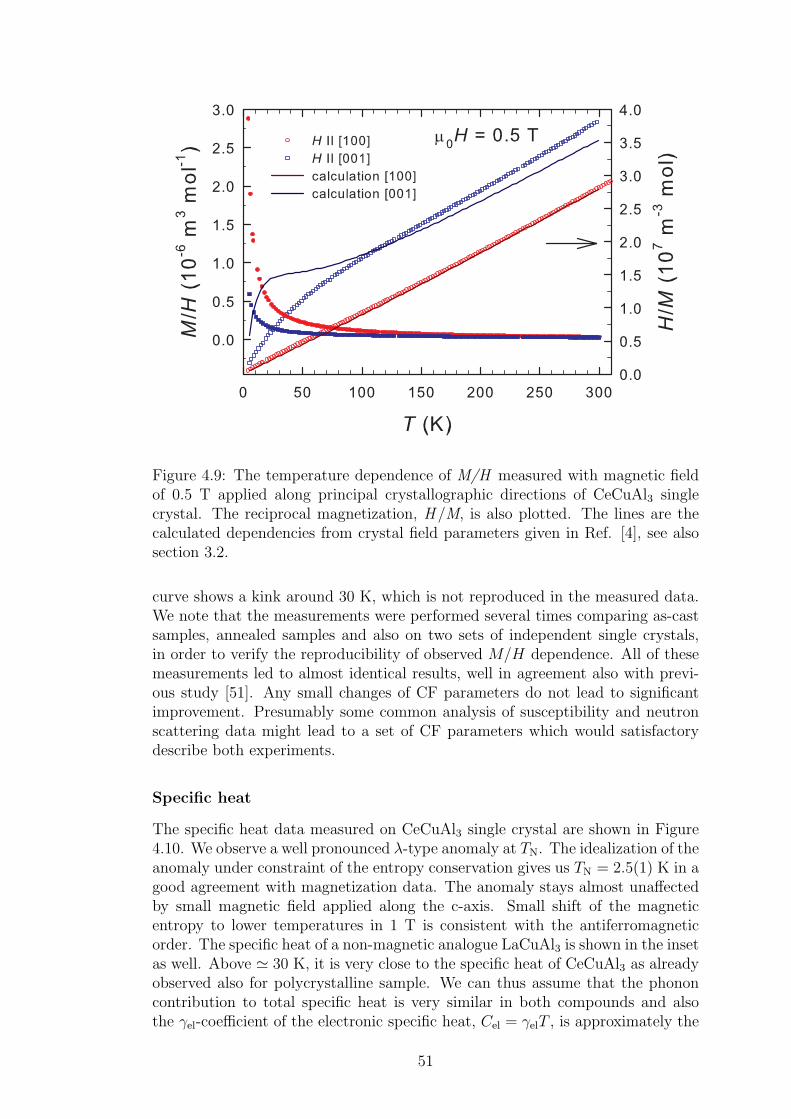
Figure 4.9: The temperature dependence of M/H measured with magnetic fieldof 0.5 T applied along principal crystallographic directions of CeCuAl3 singlecrystal. The reciprocal magnetization, H /M, is also plotted. The lines are thecalculated dependencies from crystal field parameters given in Ref. [4], see alsosection 3.2.
curve shows a kink around 30 K, which is not reproduced in the measured data.We note that the measurements were performed several times comparing as-castsamples, annealed samples and also on two sets of independent single crystals,in order to verify the reproducibility of observed M/H dependence. All of thesemeasurements led to almost identical results, well in agreement also with previ-ous study [51]. Any small changes of CF parameters do not lead to significantimprovement. Presumably some common analysis of susceptibility and neutronscattering data might lead to a set of CF parameters which would satisfactorydescribe both experiments.
Specific heat
The specific heat data measured on CeCuAl3 single crystal are shown in Figure4.10. We observe a well pronounced λ-type anomaly at TN. The idealization of theanomaly under constraint of the entropy conservation gives us TN = 2.5(1) K in agood agreement with magnetization data. The anomaly stays almost unaffectedby small magnetic field applied along the c-axis. Small shift of the magneticentropy to lower temperatures in 1 T is consistent with the antiferromagneticorder. The specific heat of a non-magnetic analogue LaCuAl3 is shown in the insetas well. Above ≃ 30 K, it is very close to the specific heat of CeCuAl3 as alreadyobserved also for polycrystalline sample. We can thus assume that the phononcontribution to total specific heat is very similar in both compounds and alsothe γel-coefficient of the electronic specific heat, Cel = γelT , is approximately the
51
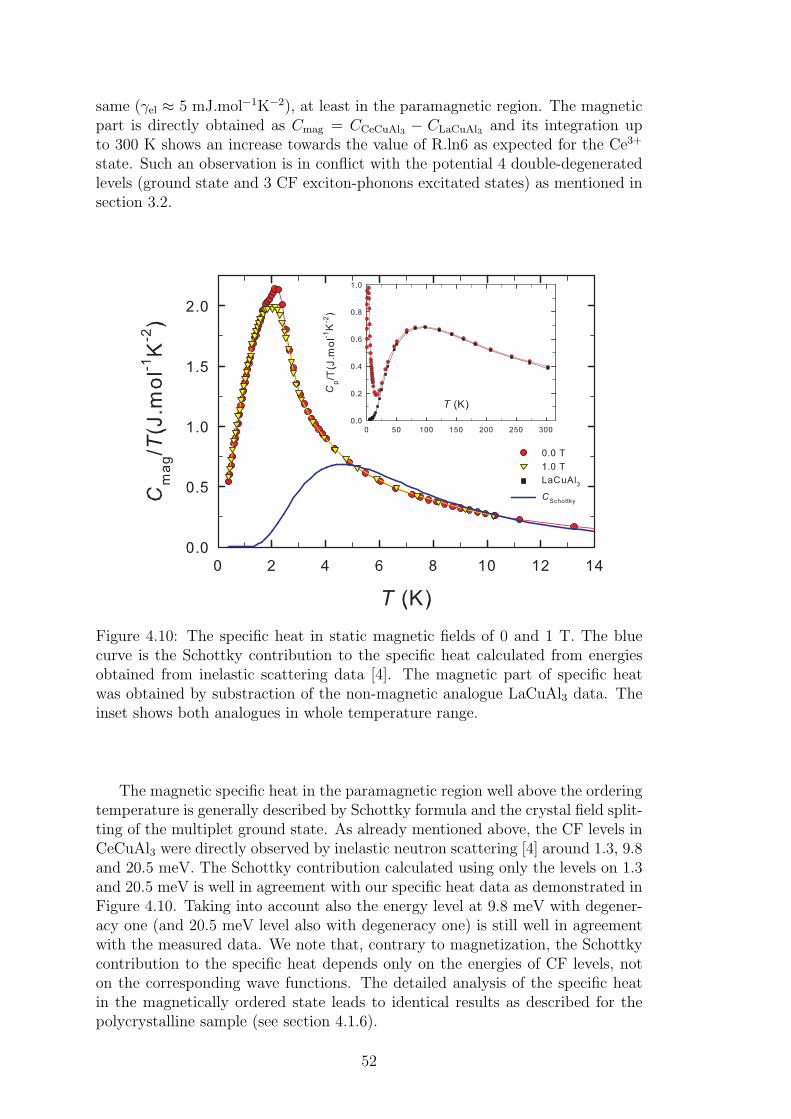
same (γel ≈ 5 mJ.mol−1K−2), at least in the paramagnetic region. The magneticpart is directly obtained as Cmag = CCeCuAl3 − CLaCuAl3 and its integration upto 300 K shows an increase towards the value of R.ln6 as expected for the Ce3+
state. Such an observation is in conflict with the potential 4 double-degeneratedlevels (ground state and 3 CF exciton-phonons excitated states) as mentioned insection 3.2.
Figure 4.10: The specific heat in static magnetic fields of 0 and 1 T. The bluecurve is the Schottky contribution to the specific heat calculated from energiesobtained from inelastic scattering data [4]. The magnetic part of specific heatwas obtained by substraction of the non-magnetic analogue LaCuAl3 data. Theinset shows both analogues in whole temperature range.
The magnetic specific heat in the paramagnetic region well above the orderingtemperature is generally described by Schottky formula and the crystal field split-ting of the multiplet ground state. As already mentioned above, the CF levels inCeCuAl3 were directly observed by inelastic neutron scattering [4] around 1.3, 9.8and 20.5 meV. The Schottky contribution calculated using only the levels on 1.3and 20.5 meV is well in agreement with our specific heat data as demonstrated inFigure 4.10. Taking into account also the energy level at 9.8 meV with degener-acy one (and 20.5 meV level also with degeneracy one) is still well in agreementwith the measured data. We note that, contrary to magnetization, the Schottkycontribution to the specific heat depends only on the energies of CF levels, noton the corresponding wave functions. The detailed analysis of the specific heatin the magnetically ordered state leads to identical results as described for thepolycrystalline sample (see section 4.1.6).
52

Electrical resistivity
The electrical resistivity measured in zero magnetic field with current along allthree principal crystallographic directions is plotted in Figure 4.11. A relativelybroad maximum around 10 K is clearly observable in resistivity data measuredalong all crystallographic directions in perfect agreement with previously pub-lished data by Kontani et al. [51]. The decrease below 10 K can be caused by thedevelopment of Kondo lattice state and crystal field effect at low temperatures asspeculated in Ref. [51]. The kink at low temperatures demonstrates clearly thetemperature of magnetic phase transition at around 2.5 K, in good agreementwith magnetization and specific heat measurements (see Figure 4.11).
The magnetoresistivity measurements were performed in several arrangementswith respect to the electrical current and magnetic field directions. There were4 types of mutual arrangements of crystallographic directions, electrical currentflow j and magnetic field H as shown in Figures 4.12 and 4.13. In all cases,the current flow was perpendicular to the magnetic field (j⊥H), i.e. transverseconfiguration. Temperature dependencies of resistivity in several static fields areplotted in Figure 4.12 and the magnetoresistance (MR) curves in Figure 4.13.Several differences can be traced depending on the experimental arrangement.
Figure 4.11: The temperature dependence of electrical resistivity with the currentalong significant crystalographic directions. The arrows indicate magnetic phasetransition temperatures as determined from specific heat data.
Large negative magnetoresistance is observed for j ‖ [001], resembling mea-surements reported for substituted CeCuxAg1−xAl3 compounds [86]. Significantdifference in resistivity development takes place for j⊥[001] regardless the fielddirection. In these arrangements, positive MR appears for temperatures belowTN in magnetic fields up to 2-3 T (0.45 and 1.0 K curves in Figure 4.13). We
53

Figure 4.12: The temperature dependence of electrical resistivity in magneticfield measured in several experimental arrangements with respect to current jand magnetic field H directions.
Figure 4.13: The magnetoresistance (MR = ρ(H,T )−ρ(0,T )ρ(0,T )
) at several temperaturesbelow and above antiferromagnetic phase transition with the current along prin-cipal crystalographic directions. The transverse configuration (j ⊥ H) of currentand magnetic field was used.
54
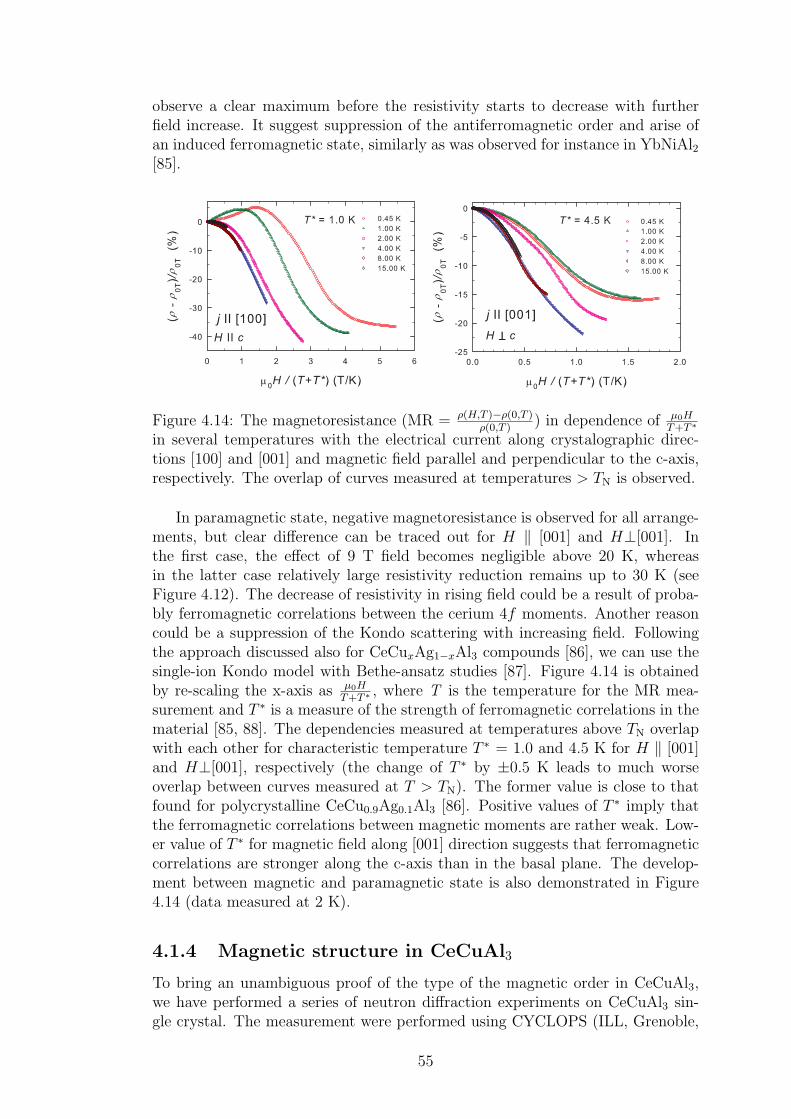
observe a clear maximum before the resistivity starts to decrease with furtherfield increase. It suggest suppression of the antiferromagnetic order and arise ofan induced ferromagnetic state, similarly as was observed for instance in YbNiAl2[85].
Figure 4.14: The magnetoresistance (MR = ρ(H,T )−ρ(0,T )ρ(0,T )
) in dependence of µ0HT+T ∗
in several temperatures with the electrical current along crystalographic direc-tions [100] and [001] and magnetic field parallel and perpendicular to the c-axis,respectively. The overlap of curves measured at temperatures > TN is observed.
In paramagnetic state, negative magnetoresistance is observed for all arrange-ments, but clear difference can be traced out for H ‖ [001] and H⊥[001]. Inthe first case, the effect of 9 T field becomes negligible above 20 K, whereasin the latter case relatively large resistivity reduction remains up to 30 K (seeFigure 4.12). The decrease of resistivity in rising field could be a result of proba-bly ferromagnetic correlations between the cerium 4f moments. Another reasoncould be a suppression of the Kondo scattering with increasing field. Followingthe approach discussed also for CeCuxAg1−xAl3 compounds [86], we can use thesingle-ion Kondo model with Bethe-ansatz studies [87]. Figure 4.14 is obtainedby re-scaling the x-axis as µ0H
T+T ∗, where T is the temperature for the MR mea-
surement and T ∗ is a measure of the strength of ferromagnetic correlations in thematerial [85, 88]. The dependencies measured at temperatures above TN overlapwith each other for characteristic temperature T ∗ = 1.0 and 4.5 K for H ‖ [001]and H⊥[001], respectively (the change of T ∗ by ±0.5 K leads to much worseoverlap between curves measured at T > TN). The former value is close to thatfound for polycrystalline CeCu0.9Ag0.1Al3 [86]. Positive values of T ∗ imply thatthe ferromagnetic correlations between magnetic moments are rather weak. Low-er value of T ∗ for magnetic field along [001] direction suggests that ferromagneticcorrelations are stronger along the c-axis than in the basal plane. The develop-ment between magnetic and paramagnetic state is also demonstrated in Figure4.14 (data measured at 2 K).
4.1.4 Magnetic structure in CeCuAl3
To bring an unambiguous proof of the type of the magnetic order in CeCuAl3,we have performed a series of neutron diffraction experiments on CeCuAl3 sin-gle crystal. The measurement were performed using CYCLOPS (ILL, Grenoble,
55
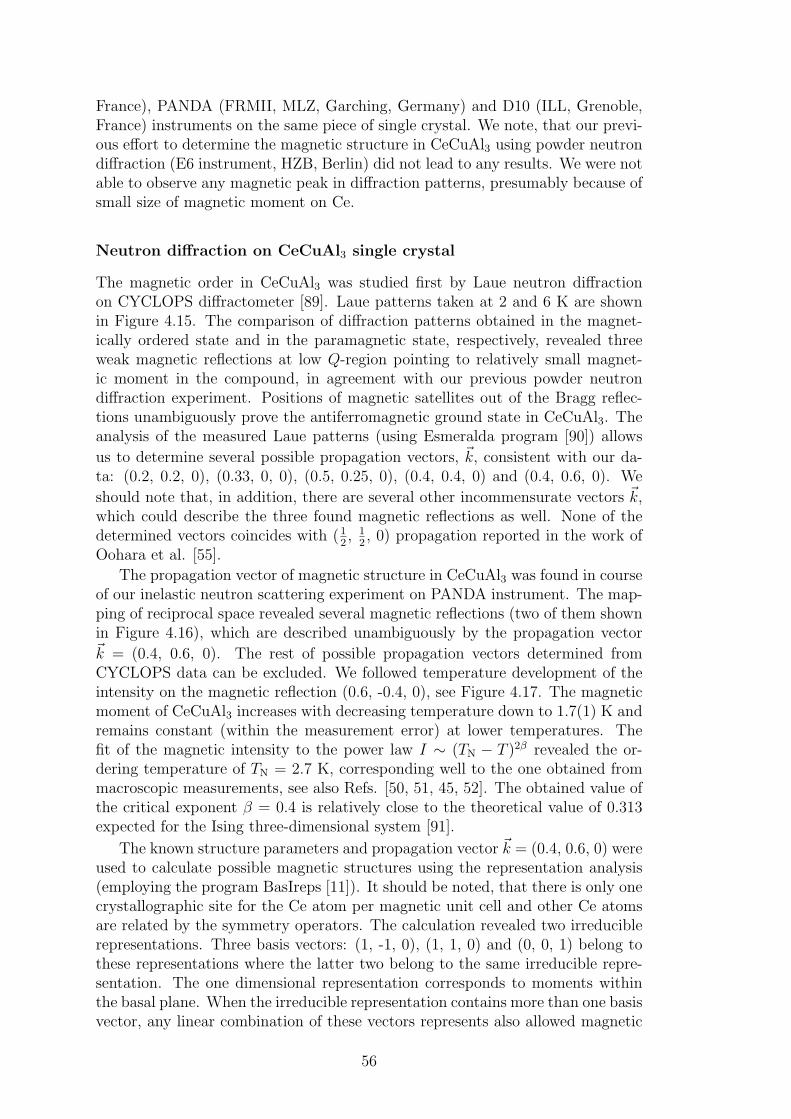
France), PANDA (FRMII, MLZ, Garching, Germany) and D10 (ILL, Grenoble,France) instruments on the same piece of single crystal. We note, that our previ-ous effort to determine the magnetic structure in CeCuAl3 using powder neutrondiffraction (E6 instrument, HZB, Berlin) did not lead to any results. We were notable to observe any magnetic peak in diffraction patterns, presumably because ofsmall size of magnetic moment on Ce.
Neutron diffraction on CeCuAl3 single crystal
The magnetic order in CeCuAl3 was studied first by Laue neutron diffractionon CYCLOPS diffractometer [89]. Laue patterns taken at 2 and 6 K are shownin Figure 4.15. The comparison of diffraction patterns obtained in the magnet-ically ordered state and in the paramagnetic state, respectively, revealed threeweak magnetic reflections at low Q-region pointing to relatively small magnet-ic moment in the compound, in agreement with our previous powder neutrondiffraction experiment. Positions of magnetic satellites out of the Bragg reflec-tions unambiguously prove the antiferromagnetic ground state in CeCuAl3. Theanalysis of the measured Laue patterns (using Esmeralda program [90]) allows
us to determine several possible propagation vectors, ~k, consistent with our da-ta: (0.2, 0.2, 0), (0.33, 0, 0), (0.5, 0.25, 0), (0.4, 0.4, 0) and (0.4, 0.6, 0). We
should note that, in addition, there are several other incommensurate vectors ~k,which could describe the three found magnetic reflections as well. None of thedetermined vectors coincides with (1
2, 1
2, 0) propagation reported in the work of
Oohara et al. [55].
The propagation vector of magnetic structure in CeCuAl3 was found in courseof our inelastic neutron scattering experiment on PANDA instrument. The map-ping of reciprocal space revealed several magnetic reflections (two of them shownin Figure 4.16), which are described unambiguously by the propagation vector~k = (0.4, 0.6, 0). The rest of possible propagation vectors determined fromCYCLOPS data can be excluded. We followed temperature development of theintensity on the magnetic reflection (0.6, -0.4, 0), see Figure 4.17. The magneticmoment of CeCuAl3 increases with decreasing temperature down to 1.7(1) K andremains constant (within the measurement error) at lower temperatures. Thefit of the magnetic intensity to the power law I ∼ (TN − T )2β revealed the or-dering temperature of TN = 2.7 K, corresponding well to the one obtained frommacroscopic measurements, see also Refs. [50, 51, 45, 52]. The obtained value ofthe critical exponent β = 0.4 is relatively close to the theoretical value of 0.313expected for the Ising three-dimensional system [91].
The known structure parameters and propagation vector ~k = (0.4, 0.6, 0) wereused to calculate possible magnetic structures using the representation analysis(employing the program BasIreps [11]). It should be noted, that there is only onecrystallographic site for the Ce atom per magnetic unit cell and other Ce atomsare related by the symmetry operators. The calculation revealed two irreduciblerepresentations. Three basis vectors: (1, -1, 0), (1, 1, 0) and (0, 0, 1) belong tothese representations where the latter two belong to the same irreducible repre-sentation. The one dimensional representation corresponds to moments withinthe basal plane. When the irreducible representation contains more than one basisvector, any linear combination of these vectors represents also allowed magnetic
56
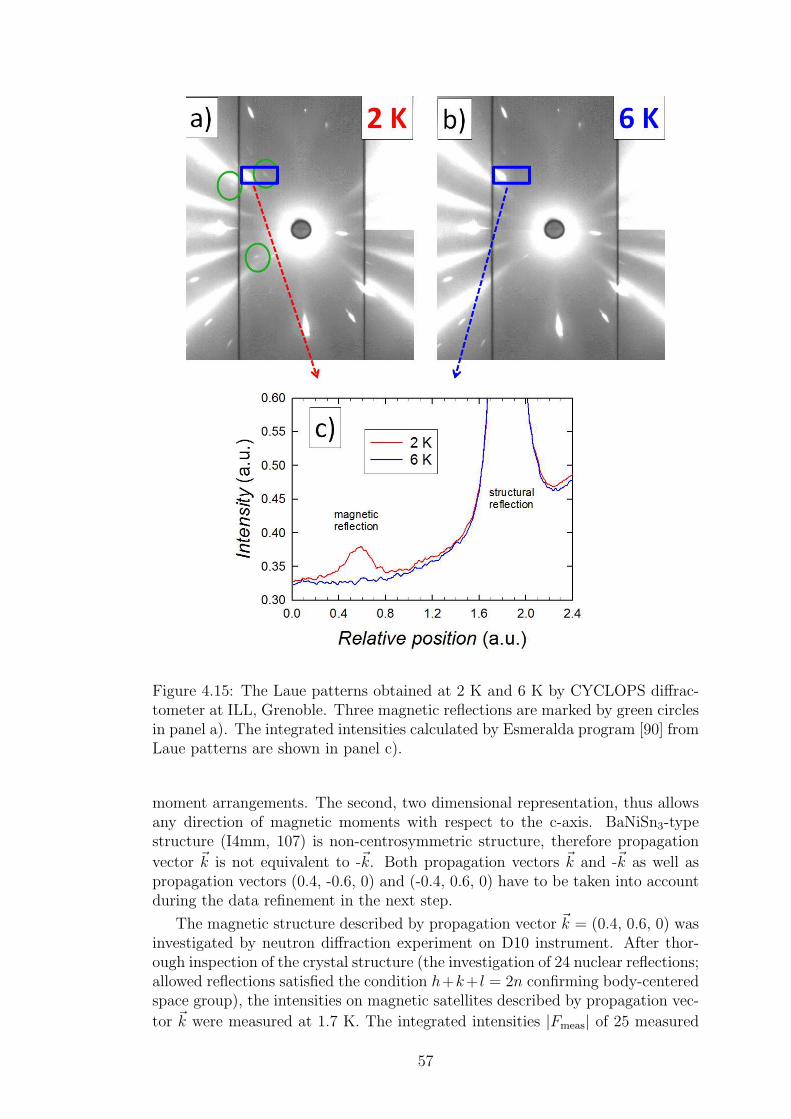
Figure 4.15: The Laue patterns obtained at 2 K and 6 K by CYCLOPS diffrac-tometer at ILL, Grenoble. Three magnetic reflections are marked by green circlesin panel a). The integrated intensities calculated by Esmeralda program [90] fromLaue patterns are shown in panel c).
moment arrangements. The second, two dimensional representation, thus allowsany direction of magnetic moments with respect to the c-axis. BaNiSn3-typestructure (I4mm, 107) is non-centrosymmetric structure, therefore propagation
vector ~k is not equivalent to -~k. Both propagation vectors ~k and -~k as well aspropagation vectors (0.4, -0.6, 0) and (-0.4, 0.6, 0) have to be taken into accountduring the data refinement in the next step.
The magnetic structure described by propagation vector ~k = (0.4, 0.6, 0) wasinvestigated by neutron diffraction experiment on D10 instrument. After thor-ough inspection of the crystal structure (the investigation of 24 nuclear reflections;allowed reflections satisfied the condition h+k+ l = 2n confirming body-centeredspace group), the intensities on magnetic satellites described by propagation vec-
tor ~k were measured at 1.7 K. The integrated intensities |Fmeas| of 25 measured
57
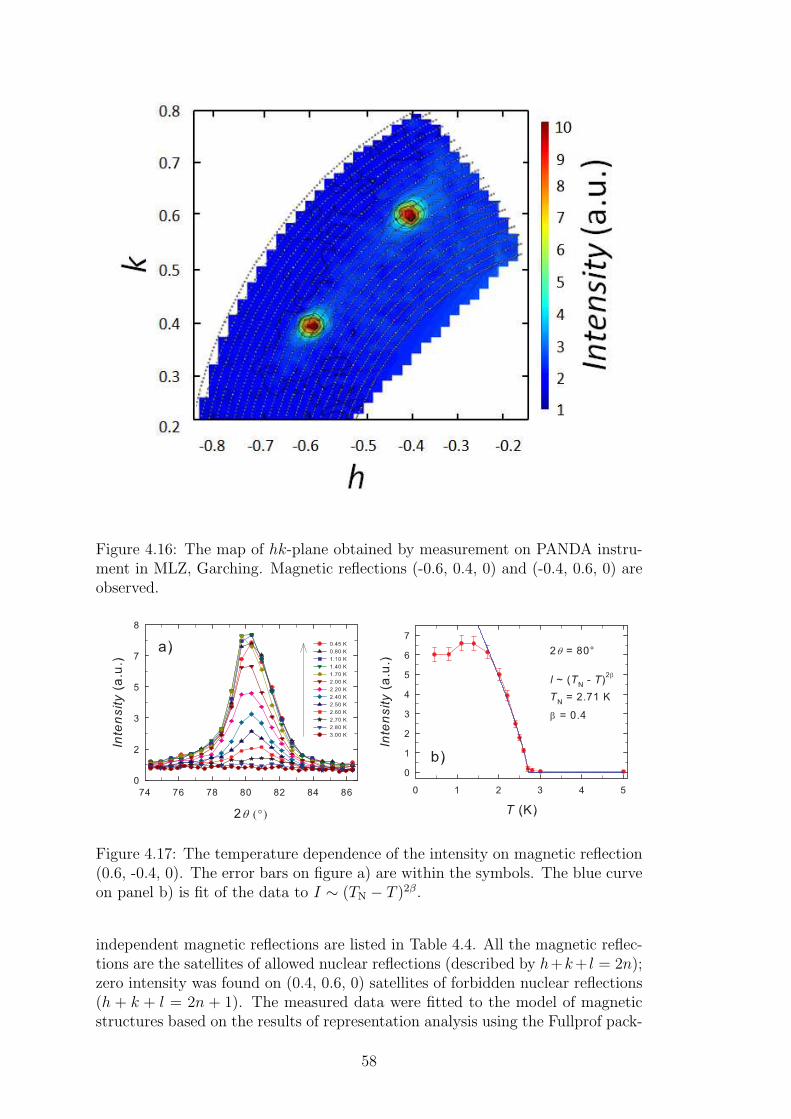
Figure 4.16: The map of hk-plane obtained by measurement on PANDA instru-ment in MLZ, Garching. Magnetic reflections (-0.6, 0.4, 0) and (-0.4, 0.6, 0) areobserved.
Figure 4.17: The temperature dependence of the intensity on magnetic reflection(0.6, -0.4, 0). The error bars on figure a) are within the symbols. The blue curveon panel b) is fit of the data to I ∼ (TN − T )2β.
independent magnetic reflections are listed in Table 4.4. All the magnetic reflec-tions are the satellites of allowed nuclear reflections (described by h+k+ l = 2n);zero intensity was found on (0.4, 0.6, 0) satellites of forbidden nuclear reflections(h + k + l = 2n + 1). The measured data were fitted to the model of magneticstructures based on the results of representation analysis using the Fullprof pack-
58
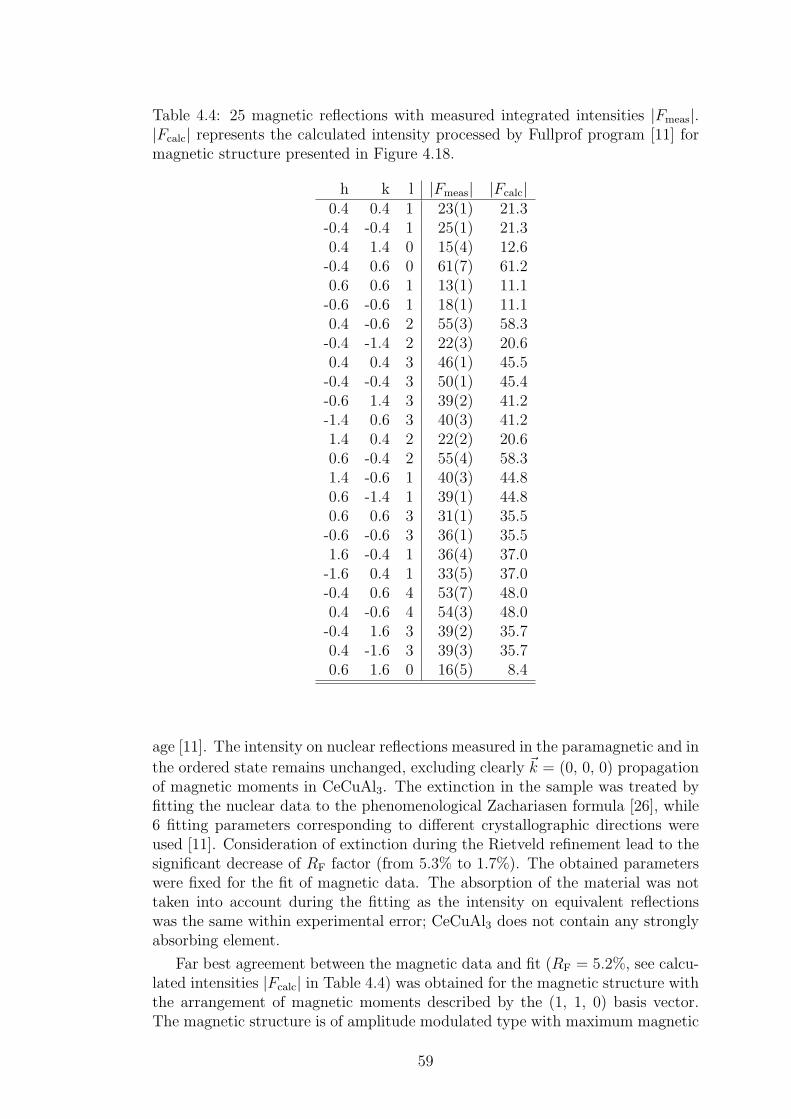
Table 4.4: 25 magnetic reflections with measured integrated intensities |Fmeas|.|Fcalc| represents the calculated intensity processed by Fullprof program [11] formagnetic structure presented in Figure 4.18.
h k l |Fmeas| |Fcalc|0.4 0.4 1 23(1) 21.3-0.4 -0.4 1 25(1) 21.30.4 1.4 0 15(4) 12.6-0.4 0.6 0 61(7) 61.20.6 0.6 1 13(1) 11.1-0.6 -0.6 1 18(1) 11.10.4 -0.6 2 55(3) 58.3-0.4 -1.4 2 22(3) 20.60.4 0.4 3 46(1) 45.5-0.4 -0.4 3 50(1) 45.4-0.6 1.4 3 39(2) 41.2-1.4 0.6 3 40(3) 41.21.4 0.4 2 22(2) 20.60.6 -0.4 2 55(4) 58.31.4 -0.6 1 40(3) 44.80.6 -1.4 1 39(1) 44.80.6 0.6 3 31(1) 35.5-0.6 -0.6 3 36(1) 35.51.6 -0.4 1 36(4) 37.0-1.6 0.4 1 33(5) 37.0-0.4 0.6 4 53(7) 48.00.4 -0.6 4 54(3) 48.0-0.4 1.6 3 39(2) 35.70.4 -1.6 3 39(3) 35.70.6 1.6 0 16(5) 8.4
age [11]. The intensity on nuclear reflections measured in the paramagnetic and in
the ordered state remains unchanged, excluding clearly ~k = (0, 0, 0) propagationof magnetic moments in CeCuAl3. The extinction in the sample was treated byfitting the nuclear data to the phenomenological Zachariasen formula [26], while6 fitting parameters corresponding to different crystallographic directions wereused [11]. Consideration of extinction during the Rietveld refinement lead to thesignificant decrease of RF factor (from 5.3% to 1.7%). The obtained parameterswere fixed for the fit of magnetic data. The absorption of the material was nottaken into account during the fitting as the intensity on equivalent reflectionswas the same within experimental error; CeCuAl3 does not contain any stronglyabsorbing element.
Far best agreement between the magnetic data and fit (RF = 5.2%, see calcu-lated intensities |Fcalc| in Table 4.4) was obtained for the magnetic structure withthe arrangement of magnetic moments described by the (1, 1, 0) basis vector.The magnetic structure is of amplitude modulated type with maximum magnetic
59

moment reaching 0.28(1) µB/Ce3+, see Figure 4.18. The amplitude modulated
magnetic structure with strongly reduced magnetic moments lying within thebasal plane is well consistent also with results of previous 27Al NQR study [92].All magnetic reflections measured on D10 instrument are described by propaga-tion vectors (0.4, -0.6, 0) and (-0.4, 0.6, 0). As follows from the representationanalysis, any linear combination of (1, 1, 0) and (0, 0, 1) basis vectors should beconsidered. Considering non-zero component described by (0, 0, 1) would leadto tilting of magnetic moments out of the basal plane. Nevertheless, allowing afree z-component does not lead to any significant improvement of the fit and con-verges to a zero value of z-component. We should note, that allowing a subtle tiltof magnetic moments within the basal plane from [110] crystallographic directionleads to somewhat better agreement factor of RF = 4.3%. The model using the(1, -1, 0) basis vector gives an unacceptable fit with RF = 35.6%.
Figure 4.18: The magnetic structure of CeCuAl3 described by propagation vector~k = (0.4, 0.6, 0). Red arrows symbolize magnetic moments at zCe = 0, blue arrowsthen moments at zCe =
12. All moments lie within basal planes.
The discrepancy between our results and previous study of Oohara et al.[55] needs to be further discussed. The propagation vector (1
2, 1
2, 0) found by
former neutron diffraction experiment [55] is clearly not reproduced in any ofour three independent neutron experiments, the agreement holds only for thez-component kz = 0. Some differences in the crystal structure and/or sample
60

quality may be a reason for different propagation vector. CeCuAl3 crystal usedby Oohara et al. [55] was originally reported to crystallize in the BaAl4-typesuperlattice [51] without further details concerning e.g. atomic positions andoccupancies. The experiments in our present work were performed on structurallywell described single crystal with the tetragonal ordered non-centrosymmetricBaNiSn3-type structure [74]. Moreover, during our experiments on PANDA andD10 instruments, we investigated the possibility of another magnetic propagationvector as presented in Ref. [55]. We found out a tiny peak corresponding to thereflection (0.5, 0.5, 0) and another one at (-0.5, 0.5, 0) reflection. The intensitiesof these peaks were considerably weaker than the ones observed for magneticpeaks described by propagation vector (0.4, 0.6, 0), see Figure 4.16 (the peakdescribed as (-0.5, 0.5, 0) is not visible in the intensity scale). Nevertheless,we were able to examine these (1
2, 1
2, 0) peaks at temperatures from 1.7 K to
200 K during our measurement on D10 instrument. No change of the intensity ofthese peaks was observed in the whole temperature interval. On the other hand,the peaks described by ~k = (0.4, 0.6, 0) disappeared at temperature of 2.7 K(as demonstrated in Figure 4.17). λ
2contamination from the (1, 1, 0) nuclear
reflection might be a certain source of intensity on the (12, 12, 0) reflection. However
Oohara et al. [55] presented the temperature development of the observed peak,which is in a strong disagreement with λ
2contamination. Such a temperature
evolution was not reproduced by our study. The structural difference thus remainsthe only explanation.
The measurements employing the inelastic neutron scattering on CeCuAl3 [4]and CeAuAl3 [84] strongly corroborate our results. The crystal field parametersobtained for both isoelectronic and isostructural compounds: B0
2 = 0.611 meV,B0
4 = -0.015 meV and |B44| = 0.317 meV for CeCuAl3 and B0
2 = 1.2036 meV,B0
4 = -0.0031 meV and |B44| = 0.4269 meV for CeAuAl3, lead to the same type of
magnetic anisotropy with magnetic moments arranged within the basal plane. In-deed, our present study on CeCuAl3 as well as previous investigation of CeAuAl3[84] reveal the magnetic moments to be confined within the basal plane. Themagnetic structures are thus fully consistent with reported CF parameters. Onthe other hand, the CeCuAl3 study of Oohara et al. [55] points out to the mag-netic moments aligned along the c-axis, which is in the strong disagreement withour study and also with the CF parameters [4].
Magnetic structures in CeTX3 compounds
We should discuss the value of magnetic moment in CeCuAl3 (0.28(1) µB/Ce3+)
which is significantly reduced compared to full Ce3+ moment. Such a small groundstate magnetic moment is not exceptional among CeTX3 compounds adoptingthe BaNiSn3-type structure. CeCoGe3 compound reveals the magnetic momentof 0.405 µB/Ce
3+ [41], CeRhGe3 the moment of 0.45 µB/Ce3+ [39]. Even a small-
er value of magnetic moment (0.13 µB/Ce3+) was found in CeRhSi3 [78]. A
similar value is predicted also for CeIrSi3 [79]. On the other hand, CeCuGa3(1.24 µB/Ce
3+) [47] and CeAuAl3 (1.05 µB/Ce3+) [84] reveal significantly high-
er magnetic moments. The small value of magnetic moment in these CeTX3
compounds is often associated to the influence of Kondo effect on long-rangemagnetic ordering. However, the Neel temperature and Kondo temperature aresimilar for all CeTX3 compounds pointing out to similar reduction of magnetic
61

moment due to Kondo effect. It is thus unlikely, that the magnetic momentswithin CeTX3 family differ so significantly because of a sole Kondo effect andother mechanisms have to be taken into account. The influence of crystal fieldplays an important role, however, the values of magnetic moments based on CFcalculations are slightly higher then 1 µB/Ce
3+ for above listed compounds. Theprevious 27Al NQR studies on CeCuAl3 [92] and NMR on CeAuAl3 [93] broughtthe significant piece of information about the size of magnetic moment in thesecompounds. While in CeAuAl3 the Ce magnetic moment is predicted to be re-duced by about 25% due to Kondo screening [93], CeCuAl3 should exhibit muchsmaller magnetic moment (< 0.2 µB/Ce
3+) [92]. Based on the 27Al NQR re-sults, the cancellation of the respective internal fields from nearest neighbor Cemoments is a probable explanation for such a small value. Indeed, the neutronscattering study on CeAuAl3 [84] revealed significantly higher magnetic momentthan that in CeCuAl3 in our present study. This agreement shows, that the in-teratomic distances play crucial role in the formation of magnetic ground state.The reason behind so significantly different values of magnetic moment in CeTX3
compounds needs to be further investigated, though. Presumably, the combina-tion of neutron scattering and nuclear magnetic resonance techniques would bringproper explanation.
When comparing the magnetic propagation vectors within the CeTX3 fam-ily of compounds crystallizing in the non-centrosymmetric BaNiSn3-type struc-ture, one can distinguish three different types of magnetic structure propagation:CeCuAl3 (~k = (0.4, 0.6, 0)) and CeCuGa3 (~k = (0.176, 0.176, 0)) [47] form the firstgroup, in which the magnetic moments lie within the basal plane and the antifer-romagnetic propagation occurs also within the basal plane. The second group isformed by compounds with the magnetic structure characterized by propagationvectors ~k = (kx = ky = 0, kz 6= 0), i.e. the magnetic moments form ferromagneticplanes which are propagating antiferromagnetically along the c-axis. CeCoGe3with ~k = (0, 0, 1
2) [41], CeRhGe3 with ~k = (0, 0, 3
4) [39] and recently investi-
gated CeAuAl3 with ~k = (0, 0, 0.52) [84] belong to this group. The last partof CeTX3 family crystallizing in BaNiSn3-type structure contains compoundswith more complex magnetic structures described by more general propagationvectors: CeRhSi3 and CeIrSi3 show the propagation vectors (0.218, 0, 0.5) and(0.265, 0, 0.43), respectively [78, 79]. The systematics in the propagation of mag-netic moments in these compounds is not obvious so far. One might expect, thatthe lattice parameters would play an important role in the magnetic structureformation. The c/a ratio itself does not seem to be the only driving parameter -rather close values of c/a ratio 2.48 and 2.51 are found for CeAuAl3 and CeCuAl3compounds showing different propagation direction [74, 84], see Table 4.1. Thec/a ratio in CeTGe3 and CeTSi3 takes the value of ≈ 2.3 [41, 39, 78, 79] andthese compounds exhibit propagation vector with z-component kz 6= 0.
The nearest interatomic Ce-Ce distance (i.e. lattice parameter a, see Table4.1) seems to be crucial for the ordering of magnetic moments in CeTX3 com-pounds: CeCuAl3 [74] and CeCuGa3 [47] with kz = 0 exhibit nearest Ce-Ceneighbors distances lower than 4.3 A, whereas CeCoGe3 [41], CeRhGe3 [39] andCeAuAl3 [84] with a > 4.3 A propagate along the tetragonal axis (kz 6= 0). In thethird group formed by CeRhSi3 [78] and CeIrSi3 [79], both a and c are relativelysmall (i.e. small lattice volume), what brings the second nearest Ce-Ce neighbors
62
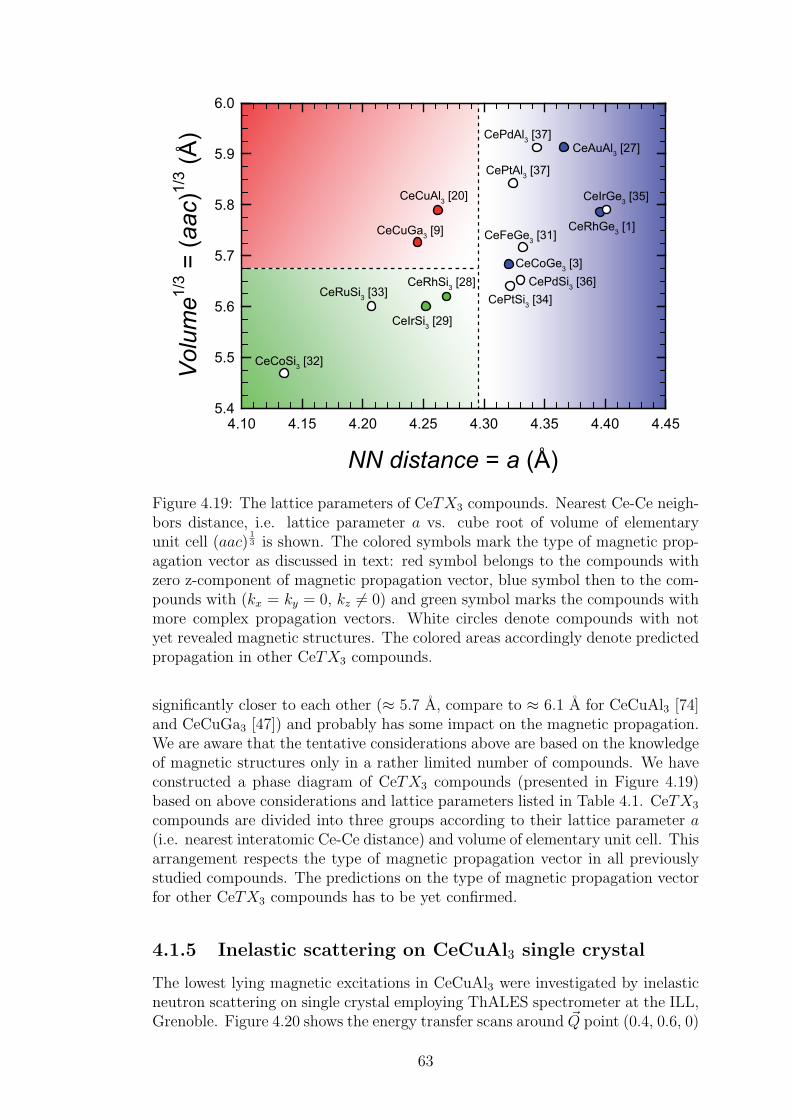
NN distance = a (Å)
4.10 4.15 4.20 4.25 4.30 4.35 4.40 4.45
Vo
lum
e1
/3 =
(a
ac)1
/3 (
Å)
5.4
5.5
5.6
5.7
5.8
5.9
6.0
CePtAl3 [37]
CePdAl3 [37]
CeCuAl3 [20]
CeAuAl3 [27]
CeRuSi3 [33]
CeRhGe3 [1]
CeIrGe3 [35]
CeCoSi3 [32]
CeRhSi3 [28]
CeIrSi3 [29]
CeCoGe3 [3]
CeCuGa3 [9]
CePtSi3 [34]
CePdSi3 [36]
CeFeGe3 [31]
Figure 4.19: The lattice parameters of CeTX3 compounds. Nearest Ce-Ce neigh-bors distance, i.e. lattice parameter a vs. cube root of volume of elementaryunit cell (aac)
13 is shown. The colored symbols mark the type of magnetic prop-
agation vector as discussed in text: red symbol belongs to the compounds withzero z-component of magnetic propagation vector, blue symbol then to the com-pounds with (kx = ky = 0, kz 6= 0) and green symbol marks the compounds withmore complex propagation vectors. White circles denote compounds with notyet revealed magnetic structures. The colored areas accordingly denote predictedpropagation in other CeTX3 compounds.
significantly closer to each other (≈ 5.7 A, compare to ≈ 6.1 A for CeCuAl3 [74]and CeCuGa3 [47]) and probably has some impact on the magnetic propagation.We are aware that the tentative considerations above are based on the knowledgeof magnetic structures only in a rather limited number of compounds. We haveconstructed a phase diagram of CeTX3 compounds (presented in Figure 4.19)based on above considerations and lattice parameters listed in Table 4.1. CeTX3
compounds are divided into three groups according to their lattice parameter a(i.e. nearest interatomic Ce-Ce distance) and volume of elementary unit cell. Thisarrangement respects the type of magnetic propagation vector in all previouslystudied compounds. The predictions on the type of magnetic propagation vectorfor other CeTX3 compounds has to be yet confirmed.
4.1.5 Inelastic scattering on CeCuAl3 single crystal
The lowest lying magnetic excitations in CeCuAl3 were investigated by inelasticneutron scattering on single crystal employing ThALES spectrometer at the ILL,Grenoble. Figure 4.20 shows the energy transfer scans around ~Q point (0.4, 0.6, 0)
63
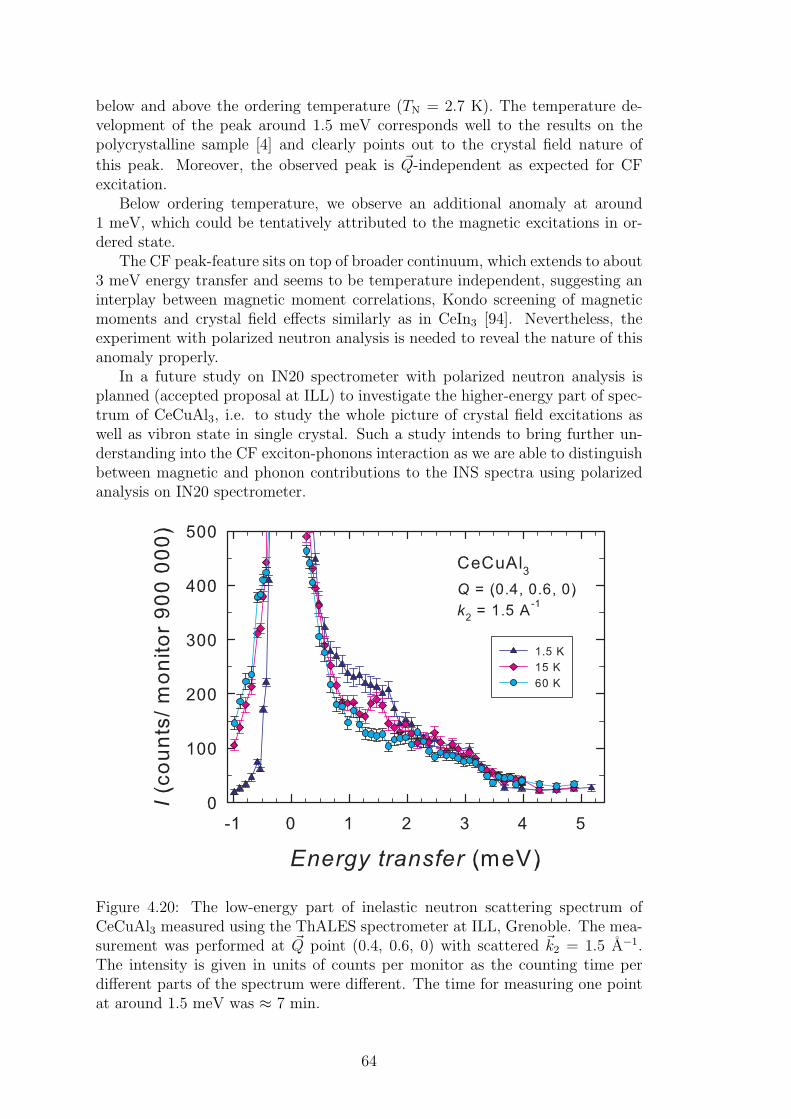
below and above the ordering temperature (TN = 2.7 K). The temperature de-velopment of the peak around 1.5 meV corresponds well to the results on thepolycrystalline sample [4] and clearly points out to the crystal field nature of
this peak. Moreover, the observed peak is ~Q-independent as expected for CFexcitation.
Below ordering temperature, we observe an additional anomaly at around1 meV, which could be tentatively attributed to the magnetic excitations in or-dered state.
The CF peak-feature sits on top of broader continuum, which extends to about3 meV energy transfer and seems to be temperature independent, suggesting aninterplay between magnetic moment correlations, Kondo screening of magneticmoments and crystal field effects similarly as in CeIn3 [94]. Nevertheless, theexperiment with polarized neutron analysis is needed to reveal the nature of thisanomaly properly.
In a future study on IN20 spectrometer with polarized neutron analysis isplanned (accepted proposal at ILL) to investigate the higher-energy part of spec-trum of CeCuAl3, i.e. to study the whole picture of crystal field excitations aswell as vibron state in single crystal. Such a study intends to bring further un-derstanding into the CF exciton-phonons interaction as we are able to distinguishbetween magnetic and phonon contributions to the INS spectra using polarizedanalysis on IN20 spectrometer.
Figure 4.20: The low-energy part of inelastic neutron scattering spectrum ofCeCuAl3 measured using the ThALES spectrometer at ILL, Grenoble. The mea-surement was performed at ~Q point (0.4, 0.6, 0) with scattered ~k2 = 1.5 A−1.The intensity is given in units of counts per monitor as the counting time perdifferent parts of the spectrum were different. The time for measuring one pointat around 1.5 meV was ≈ 7 min.
64
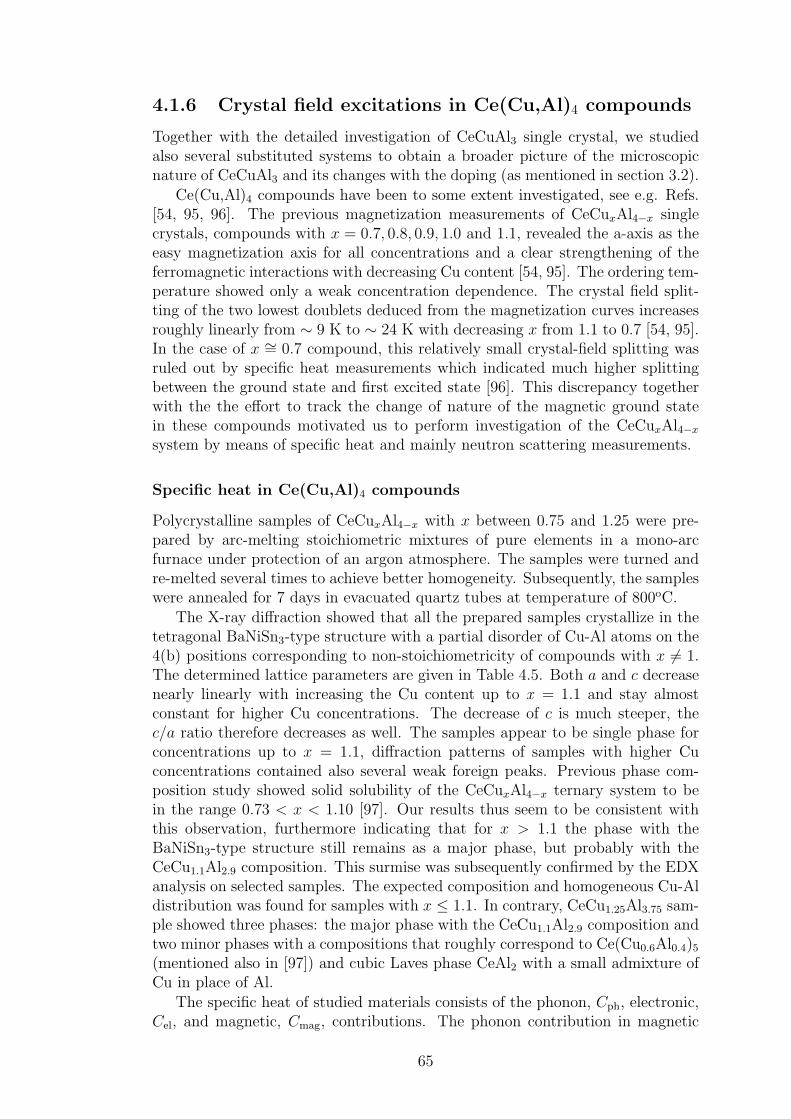
4.1.6 Crystal field excitations in Ce(Cu,Al)4 compounds
Together with the detailed investigation of CeCuAl3 single crystal, we studiedalso several substituted systems to obtain a broader picture of the microscopicnature of CeCuAl3 and its changes with the doping (as mentioned in section 3.2).
Ce(Cu,Al)4 compounds have been to some extent investigated, see e.g. Refs.[54, 95, 96]. The previous magnetization measurements of CeCuxAl4−x singlecrystals, compounds with x = 0.7, 0.8, 0.9, 1.0 and 1.1, revealed the a-axis as theeasy magnetization axis for all concentrations and a clear strengthening of theferromagnetic interactions with decreasing Cu content [54, 95]. The ordering tem-perature showed only a weak concentration dependence. The crystal field split-ting of the two lowest doublets deduced from the magnetization curves increasesroughly linearly from ∼ 9 K to ∼ 24 K with decreasing x from 1.1 to 0.7 [54, 95].In the case of x ∼= 0.7 compound, this relatively small crystal-field splitting wasruled out by specific heat measurements which indicated much higher splittingbetween the ground state and first excited state [96]. This discrepancy togetherwith the the effort to track the change of nature of the magnetic ground statein these compounds motivated us to perform investigation of the CeCuxAl4−x
system by means of specific heat and mainly neutron scattering measurements.
Specific heat in Ce(Cu,Al)4 compounds
Polycrystalline samples of CeCuxAl4−x with x between 0.75 and 1.25 were pre-pared by arc-melting stoichiometric mixtures of pure elements in a mono-arcfurnace under protection of an argon atmosphere. The samples were turned andre-melted several times to achieve better homogeneity. Subsequently, the sampleswere annealed for 7 days in evacuated quartz tubes at temperature of 800oC.
The X-ray diffraction showed that all the prepared samples crystallize in thetetragonal BaNiSn3-type structure with a partial disorder of Cu-Al atoms on the4(b) positions corresponding to non-stoichiometricity of compounds with x 6= 1.The determined lattice parameters are given in Table 4.5. Both a and c decreasenearly linearly with increasing the Cu content up to x = 1.1 and stay almostconstant for higher Cu concentrations. The decrease of c is much steeper, thec/a ratio therefore decreases as well. The samples appear to be single phase forconcentrations up to x = 1.1, diffraction patterns of samples with higher Cuconcentrations contained also several weak foreign peaks. Previous phase com-position study showed solid solubility of the CeCuxAl4−x ternary system to bein the range 0.73 < x < 1.10 [97]. Our results thus seem to be consistent withthis observation, furthermore indicating that for x > 1.1 the phase with theBaNiSn3-type structure still remains as a major phase, but probably with theCeCu1.1Al2.9 composition. This surmise was subsequently confirmed by the EDXanalysis on selected samples. The expected composition and homogeneous Cu-Aldistribution was found for samples with x ≤ 1.1. In contrary, CeCu1.25Al3.75 sam-ple showed three phases: the major phase with the CeCu1.1Al2.9 composition andtwo minor phases with a compositions that roughly correspond to Ce(Cu0.6Al0.4)5(mentioned also in [97]) and cubic Laves phase CeAl2 with a small admixture ofCu in place of Al.
The specific heat of studied materials consists of the phonon, Cph, electronic,Cel, and magnetic, Cmag, contributions. The phonon contribution in magnetic
65
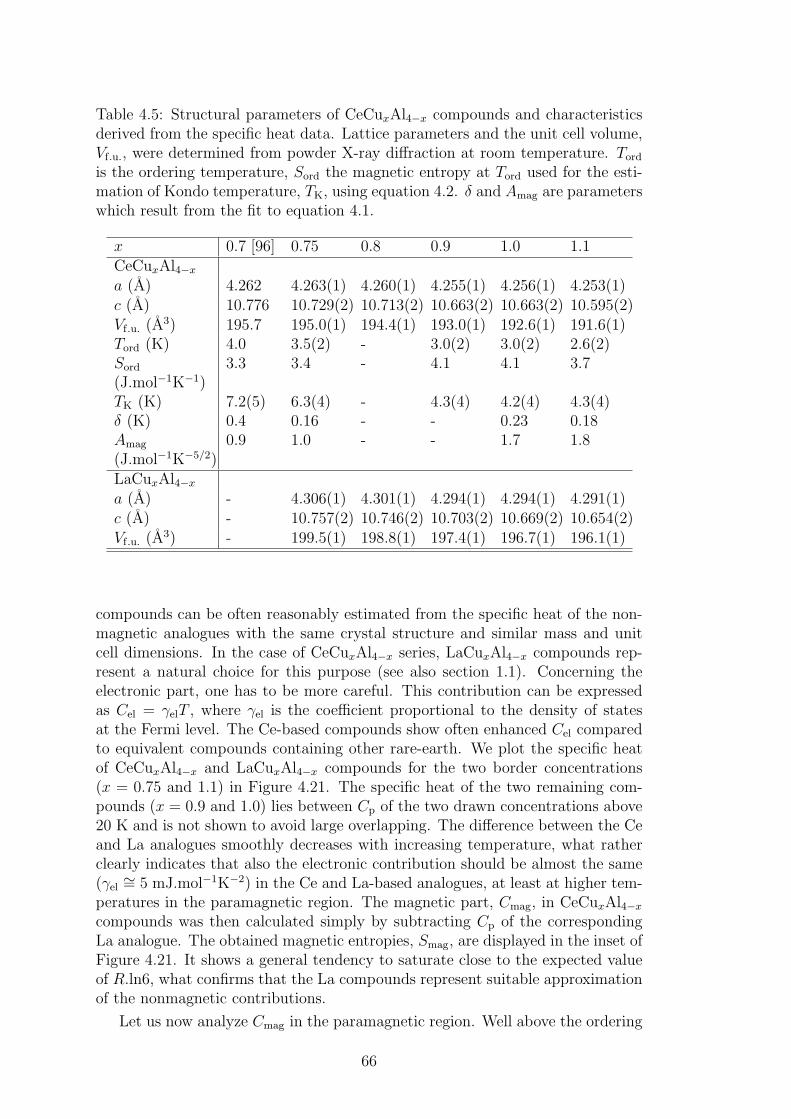
Table 4.5: Structural parameters of CeCuxAl4−x compounds and characteristicsderived from the specific heat data. Lattice parameters and the unit cell volume,Vf.u., were determined from powder X-ray diffraction at room temperature. Tord
is the ordering temperature, Sord the magnetic entropy at Tord used for the esti-mation of Kondo temperature, TK, using equation 4.2. δ and Amag are parameterswhich result from the fit to equation 4.1.
x 0.7 [96] 0.75 0.8 0.9 1.0 1.1CeCuxAl4−x
a (A) 4.262 4.263(1) 4.260(1) 4.255(1) 4.256(1) 4.253(1)c (A) 10.776 10.729(2) 10.713(2) 10.663(2) 10.663(2) 10.595(2)Vf.u. (A
3) 195.7 195.0(1) 194.4(1) 193.0(1) 192.6(1) 191.6(1)Tord (K) 4.0 3.5(2) - 3.0(2) 3.0(2) 2.6(2)Sord
(J.mol−1K−1)3.3 3.4 - 4.1 4.1 3.7
TK (K) 7.2(5) 6.3(4) - 4.3(4) 4.2(4) 4.3(4)δ (K) 0.4 0.16 - - 0.23 0.18Amag
(J.mol−1K−5/2)0.9 1.0 - - 1.7 1.8
LaCuxAl4−x
a (A) - 4.306(1) 4.301(1) 4.294(1) 4.294(1) 4.291(1)c (A) - 10.757(2) 10.746(2) 10.703(2) 10.669(2) 10.654(2)Vf.u. (A
3) - 199.5(1) 198.8(1) 197.4(1) 196.7(1) 196.1(1)
compounds can be often reasonably estimated from the specific heat of the non-magnetic analogues with the same crystal structure and similar mass and unitcell dimensions. In the case of CeCuxAl4−x series, LaCuxAl4−x compounds rep-resent a natural choice for this purpose (see also section 1.1). Concerning theelectronic part, one has to be more careful. This contribution can be expressedas Cel = γelT , where γel is the coefficient proportional to the density of statesat the Fermi level. The Ce-based compounds show often enhanced Cel comparedto equivalent compounds containing other rare-earth. We plot the specific heatof CeCuxAl4−x and LaCuxAl4−x compounds for the two border concentrations(x = 0.75 and 1.1) in Figure 4.21. The specific heat of the two remaining com-pounds (x = 0.9 and 1.0) lies between Cp of the two drawn concentrations above20 K and is not shown to avoid large overlapping. The difference between the Ceand La analogues smoothly decreases with increasing temperature, what ratherclearly indicates that also the electronic contribution should be almost the same(γel ∼= 5 mJ.mol−1K−2) in the Ce and La-based analogues, at least at higher tem-peratures in the paramagnetic region. The magnetic part, Cmag, in CeCuxAl4−x
compounds was then calculated simply by subtracting Cp of the correspondingLa analogue. The obtained magnetic entropies, Smag, are displayed in the inset ofFigure 4.21. It shows a general tendency to saturate close to the expected valueof R.ln6, what confirms that the La compounds represent suitable approximationof the nonmagnetic contributions.
Let us now analyze Cmag in the paramagnetic region. Well above the ordering
66

Figure 4.21: The magnetic entropy of CeCuxAl4−x compounds in the whole mea-sured temperature range. The inset shows the temperature dependence of thespecific heat of CeCuxAl4−x and LaCuxAl4−x (x = 0.75 and 1.1) compounds.The other concentrations exhibit basically similar behavior above 10 K.
temperature (listed in Table 4.5), it is assumed to be described by usual Schottkycontribution describing the crystal field excitations, see equation 2.7.
The CF energy levels at E1 = 1.3 meV and E2 = 20.5 meV were directly ob-served by inelastic neutron scattering in CeCuAl3 [4]. The Schottky contributioncalculated using these values is compared with experimental data in Figure 4.22.The main features are reproduced, especially the enhancement of Cmag below20 K. The difference between observed and calculated data may be ascribed tocertain dispersion of the CF levels and possible small differences in the phononspectra of CeCuAl3 and LaCuAl3. We have also to remind the existence of thevibron state in CeCuAl3, see section 3.2 [4], which certainly influences both thephonon and Schottky contributions.
Certain development of the energy splitting between the ground state and firstexcited state with respect to Cu concentration x was deduced from magnetizationcurves [54]. E1 was reported to increase almost linearly from ∼ 0.8 meV forx = 1.1 to ∼ 2 meV for x = 0.7 [54, 95]. The predicted value of E1 ∼ 2 meVfor CeCu0.7Al3.3 is however in a strong disagreement with the heat capacity data[96]. According to the specific heat, it was suggested that E1 should lie above∼ 7 meV. Our present analysis is in a good agreement with this former study.We can clearly exclude existence of E1 around 2 meV for CeCu0.75Al3.25 evenconsidering all the uncertainties mentioned above for CeCuAl3. We estimateE1 ≃ 8.6 meV, the corresponding data are drawn in Figure 4.22. CeCu0.9Al3.1
67
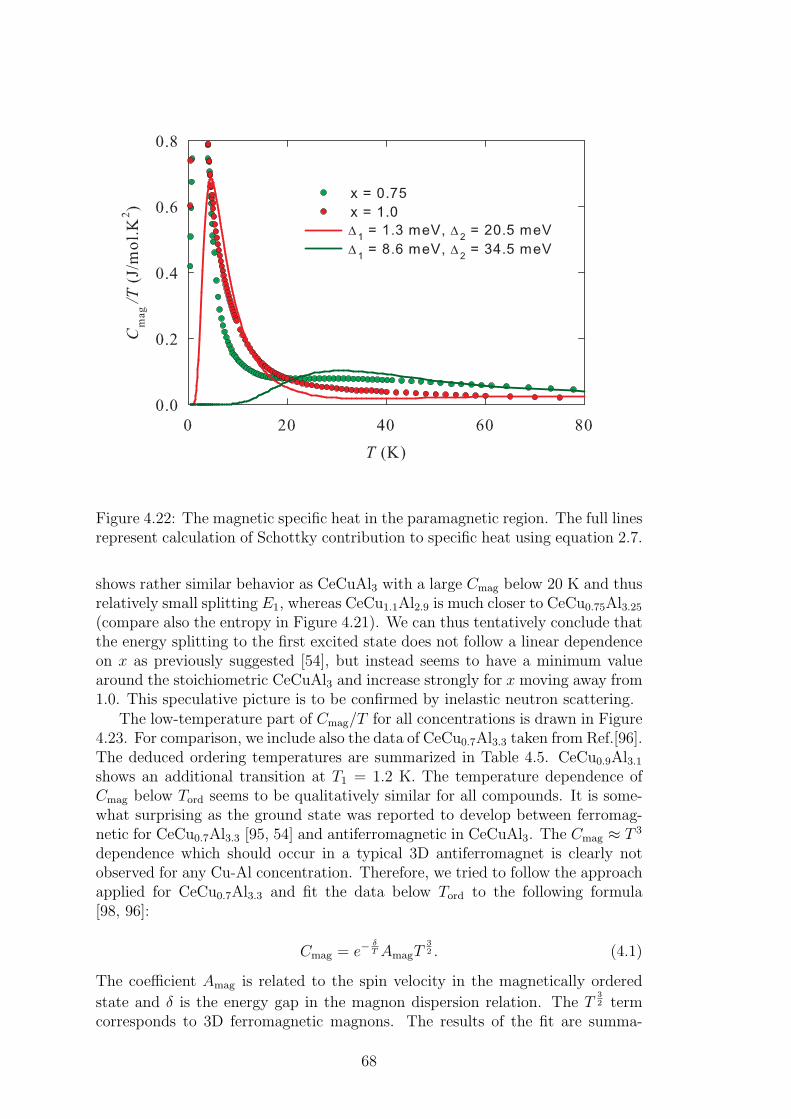
Figure 4.22: The magnetic specific heat in the paramagnetic region. The full linesrepresent calculation of Schottky contribution to specific heat using equation 2.7.
shows rather similar behavior as CeCuAl3 with a large Cmag below 20 K and thusrelatively small splitting E1, whereas CeCu1.1Al2.9 is much closer to CeCu0.75Al3.25(compare also the entropy in Figure 4.21). We can thus tentatively conclude thatthe energy splitting to the first excited state does not follow a linear dependenceon x as previously suggested [54], but instead seems to have a minimum valuearound the stoichiometric CeCuAl3 and increase strongly for x moving away from1.0. This speculative picture is to be confirmed by inelastic neutron scattering.
The low-temperature part of Cmag/T for all concentrations is drawn in Figure4.23. For comparison, we include also the data of CeCu0.7Al3.3 taken from Ref.[96].The deduced ordering temperatures are summarized in Table 4.5. CeCu0.9Al3.1shows an additional transition at T1 = 1.2 K. The temperature dependence ofCmag below Tord seems to be qualitatively similar for all compounds. It is some-what surprising as the ground state was reported to develop between ferromag-netic for CeCu0.7Al3.3 [95, 54] and antiferromagnetic in CeCuAl3. The Cmag ≈ T 3
dependence which should occur in a typical 3D antiferromagnet is clearly notobserved for any Cu-Al concentration. Therefore, we tried to follow the approachapplied for CeCu0.7Al3.3 and fit the data below Tord to the following formula[98, 96]:
Cmag = e−δT AmagT
32 . (4.1)
The coefficient Amag is related to the spin velocity in the magnetically ordered
state and δ is the energy gap in the magnon dispersion relation. The T32 term
corresponds to 3D ferromagnetic magnons. The results of the fit are summa-
68
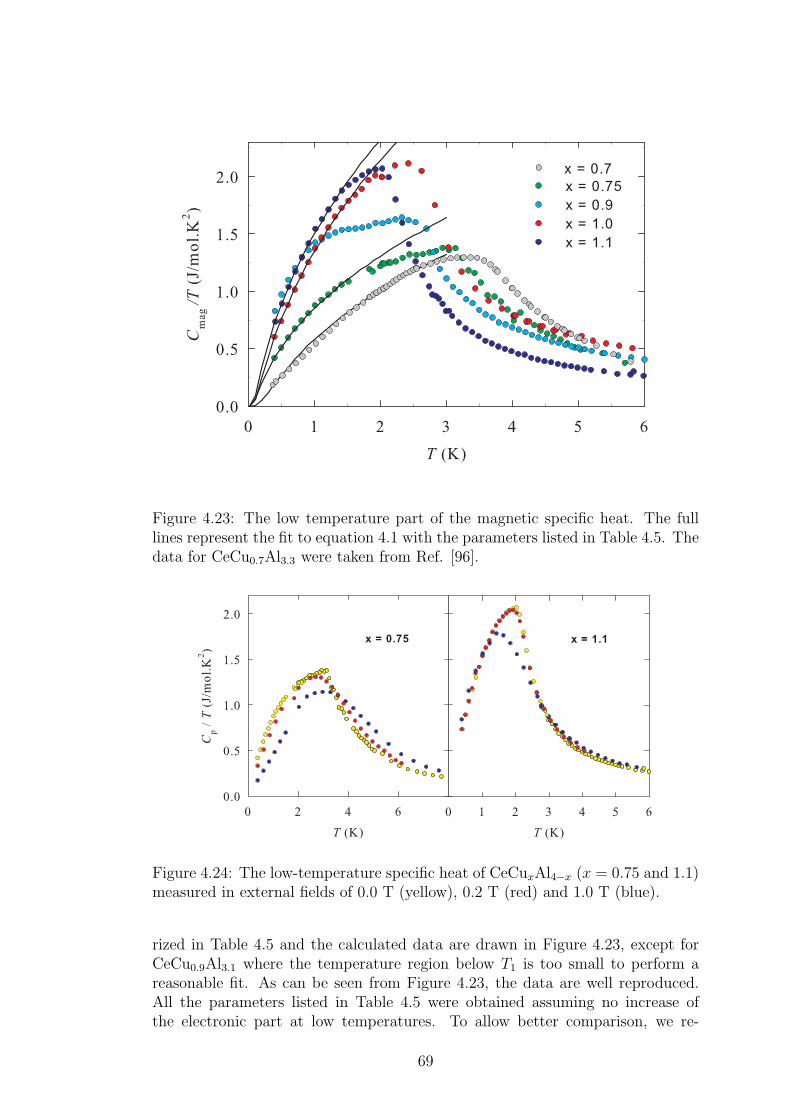
Figure 4.23: The low temperature part of the magnetic specific heat. The fulllines represent the fit to equation 4.1 with the parameters listed in Table 4.5. Thedata for CeCu0.7Al3.3 were taken from Ref. [96].
Figure 4.24: The low-temperature specific heat of CeCuxAl4−x (x = 0.75 and 1.1)measured in external fields of 0.0 T (yellow), 0.2 T (red) and 1.0 T (blue).
rized in Table 4.5 and the calculated data are drawn in Figure 4.23, except forCeCu0.9Al3.1 where the temperature region below T1 is too small to perform areasonable fit. As can be seen from Figure 4.23, the data are well reproduced.All the parameters listed in Table 4.5 were obtained assuming no increase ofthe electronic part at low temperatures. To allow better comparison, we re-
69
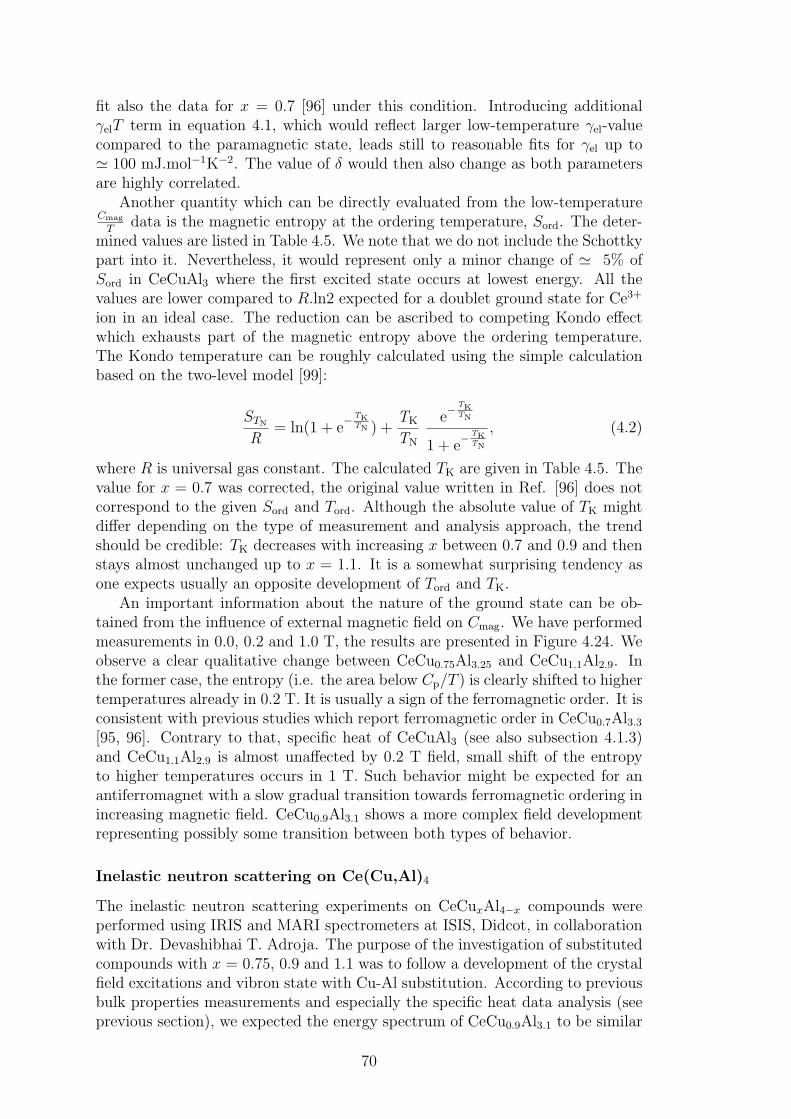
fit also the data for x = 0.7 [96] under this condition. Introducing additionalγelT term in equation 4.1, which would reflect larger low-temperature γel-valuecompared to the paramagnetic state, leads still to reasonable fits for γel up to≃ 100 mJ.mol−1K−2. The value of δ would then also change as both parametersare highly correlated.
Another quantity which can be directly evaluated from the low-temperatureCmag
Tdata is the magnetic entropy at the ordering temperature, Sord. The deter-
mined values are listed in Table 4.5. We note that we do not include the Schottkypart into it. Nevertheless, it would represent only a minor change of ≃ 5% ofSord in CeCuAl3 where the first excited state occurs at lowest energy. All thevalues are lower compared to R.ln2 expected for a doublet ground state for Ce3+
ion in an ideal case. The reduction can be ascribed to competing Kondo effectwhich exhausts part of the magnetic entropy above the ordering temperature.The Kondo temperature can be roughly calculated using the simple calculationbased on the two-level model [99]:
STN
R= ln(1 + e
−TKTN ) +
TK
TN
e−TK
TN
1 + e−TK
TN
, (4.2)
where R is universal gas constant. The calculated TK are given in Table 4.5. Thevalue for x = 0.7 was corrected, the original value written in Ref. [96] does notcorrespond to the given Sord and Tord. Although the absolute value of TK mightdiffer depending on the type of measurement and analysis approach, the trendshould be credible: TK decreases with increasing x between 0.7 and 0.9 and thenstays almost unchanged up to x = 1.1. It is a somewhat surprising tendency asone expects usually an opposite development of Tord and TK.
An important information about the nature of the ground state can be ob-tained from the influence of external magnetic field on Cmag. We have performedmeasurements in 0.0, 0.2 and 1.0 T, the results are presented in Figure 4.24. Weobserve a clear qualitative change between CeCu0.75Al3.25 and CeCu1.1Al2.9. Inthe former case, the entropy (i.e. the area below Cp/T ) is clearly shifted to highertemperatures already in 0.2 T. It is usually a sign of the ferromagnetic order. It isconsistent with previous studies which report ferromagnetic order in CeCu0.7Al3.3[95, 96]. Contrary to that, specific heat of CeCuAl3 (see also subsection 4.1.3)and CeCu1.1Al2.9 is almost unaffected by 0.2 T field, small shift of the entropyto higher temperatures occurs in 1 T. Such behavior might be expected for anantiferromagnet with a slow gradual transition towards ferromagnetic ordering inincreasing magnetic field. CeCu0.9Al3.1 shows a more complex field developmentrepresenting possibly some transition between both types of behavior.
Inelastic neutron scattering on Ce(Cu,Al)4
The inelastic neutron scattering experiments on CeCuxAl4−x compounds wereperformed using IRIS and MARI spectrometers at ISIS, Didcot, in collaborationwith Dr. Devashibhai T. Adroja. The purpose of the investigation of substitutedcompounds with x = 0.75, 0.9 and 1.1 was to follow a development of the crystalfield excitations and vibron state with Cu-Al substitution. According to previousbulk properties measurements and especially the specific heat data analysis (seeprevious section), we expected the energy spectrum of CeCu0.9Al3.1 to be similar
70
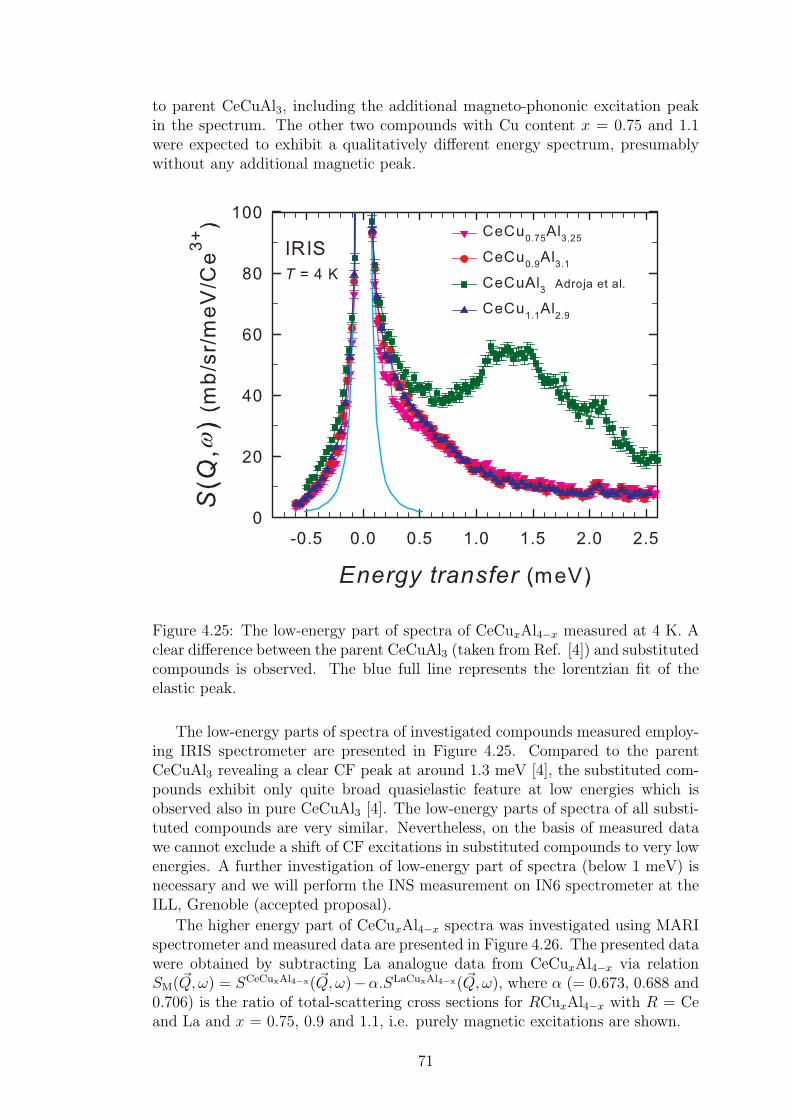
to parent CeCuAl3, including the additional magneto-phononic excitation peakin the spectrum. The other two compounds with Cu content x = 0.75 and 1.1were expected to exhibit a qualitatively different energy spectrum, presumablywithout any additional magnetic peak.
Figure 4.25: The low-energy part of spectra of CeCuxAl4−x measured at 4 K. Aclear difference between the parent CeCuAl3 (taken from Ref. [4]) and substitutedcompounds is observed. The blue full line represents the lorentzian fit of theelastic peak.
The low-energy parts of spectra of investigated compounds measured employ-ing IRIS spectrometer are presented in Figure 4.25. Compared to the parentCeCuAl3 revealing a clear CF peak at around 1.3 meV [4], the substituted com-pounds exhibit only quite broad quasielastic feature at low energies which isobserved also in pure CeCuAl3 [4]. The low-energy parts of spectra of all substi-tuted compounds are very similar. Nevertheless, on the basis of measured datawe cannot exclude a shift of CF excitations in substituted compounds to very lowenergies. A further investigation of low-energy part of spectra (below 1 meV) isnecessary and we will perform the INS measurement on IN6 spectrometer at theILL, Grenoble (accepted proposal).
The higher energy part of CeCuxAl4−x spectra was investigated using MARIspectrometer and measured data are presented in Figure 4.26. The presented datawere obtained by subtracting La analogue data from CeCuxAl4−x via relationSM( ~Q, ω) = SCeCuxAl4−x( ~Q, ω)−α.SLaCuxAl4−x( ~Q, ω), where α (= 0.673, 0.688 and0.706) is the ratio of total-scattering cross sections for RCuxAl4−x with R = Ceand La and x = 0.75, 0.9 and 1.1, i.e. purely magnetic excitations are shown.
71
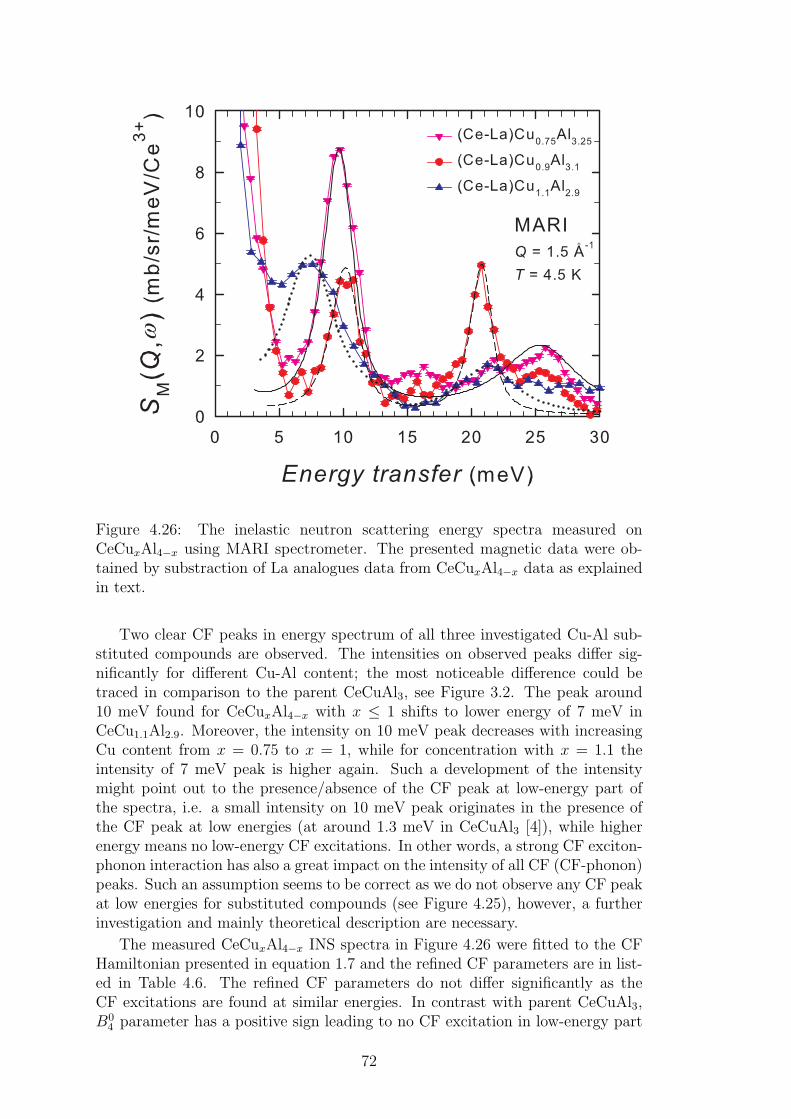
Figure 4.26: The inelastic neutron scattering energy spectra measured onCeCuxAl4−x using MARI spectrometer. The presented magnetic data were ob-tained by substraction of La analogues data from CeCuxAl4−x data as explainedin text.
Two clear CF peaks in energy spectrum of all three investigated Cu-Al sub-stituted compounds are observed. The intensities on observed peaks differ sig-nificantly for different Cu-Al content; the most noticeable difference could betraced in comparison to the parent CeCuAl3, see Figure 3.2. The peak around10 meV found for CeCuxAl4−x with x ≤ 1 shifts to lower energy of 7 meV inCeCu1.1Al2.9. Moreover, the intensity on 10 meV peak decreases with increasingCu content from x = 0.75 to x = 1, while for concentration with x = 1.1 theintensity of 7 meV peak is higher again. Such a development of the intensitymight point out to the presence/absence of the CF peak at low-energy part ofthe spectra, i.e. a small intensity on 10 meV peak originates in the presence ofthe CF peak at low energies (at around 1.3 meV in CeCuAl3 [4]), while higherenergy means no low-energy CF excitations. In other words, a strong CF exciton-phonon interaction has also a great impact on the intensity of all CF (CF-phonon)peaks. Such an assumption seems to be correct as we do not observe any CF peakat low energies for substituted compounds (see Figure 4.25), however, a furtherinvestigation and mainly theoretical description are necessary.
The measured CeCuxAl4−x INS spectra in Figure 4.26 were fitted to the CFHamiltonian presented in equation 1.7 and the refined CF parameters are in list-ed in Table 4.6. The refined CF parameters do not differ significantly as theCF excitations are found at similar energies. In contrast with parent CeCuAl3,B0
4 parameter has a positive sign leading to no CF excitation in low-energy part
72
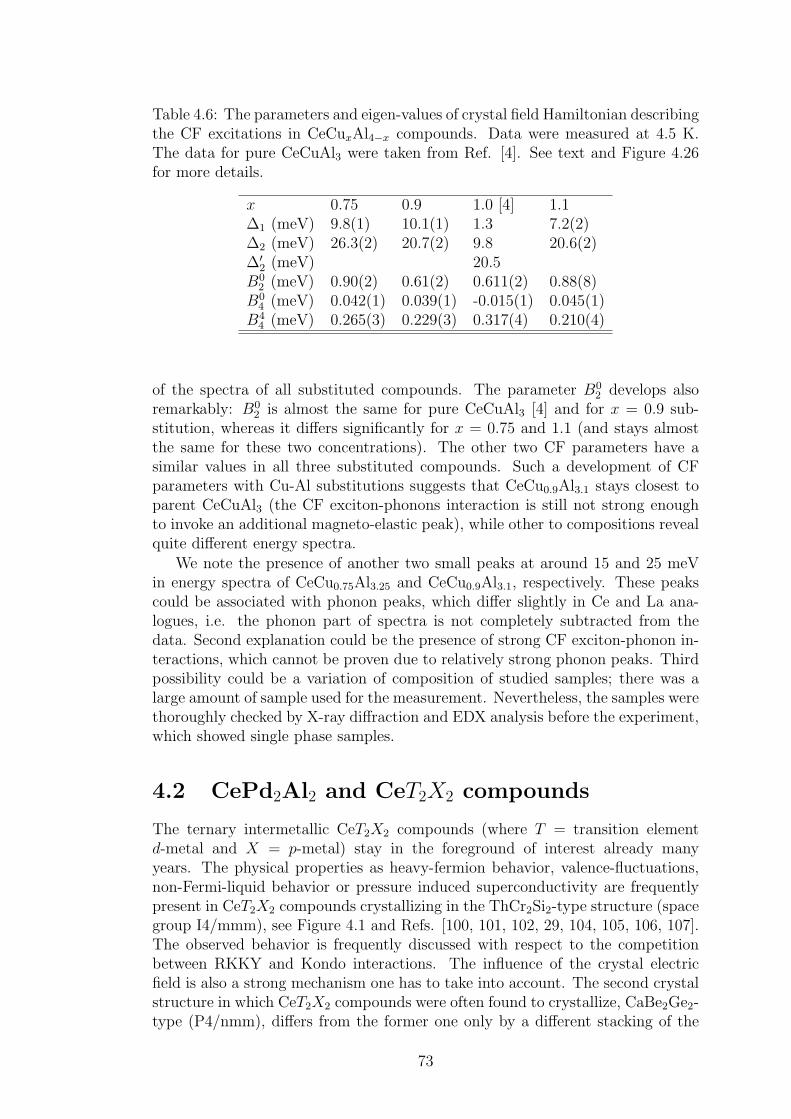
Table 4.6: The parameters and eigen-values of crystal field Hamiltonian describingthe CF excitations in CeCuxAl4−x compounds. Data were measured at 4.5 K.The data for pure CeCuAl3 were taken from Ref. [4]. See text and Figure 4.26for more details.
x 0.75 0.9 1.0 [4] 1.1∆1 (meV) 9.8(1) 10.1(1) 1.3 7.2(2)∆2 (meV) 26.3(2) 20.7(2) 9.8 20.6(2)∆′
2 (meV) 20.5B0
2 (meV) 0.90(2) 0.61(2) 0.611(2) 0.88(8)B0
4 (meV) 0.042(1) 0.039(1) -0.015(1) 0.045(1)B4
4 (meV) 0.265(3) 0.229(3) 0.317(4) 0.210(4)
of the spectra of all substituted compounds. The parameter B02 develops also
remarkably: B02 is almost the same for pure CeCuAl3 [4] and for x = 0.9 sub-
stitution, whereas it differs significantly for x = 0.75 and 1.1 (and stays almostthe same for these two concentrations). The other two CF parameters have asimilar values in all three substituted compounds. Such a development of CFparameters with Cu-Al substitutions suggests that CeCu0.9Al3.1 stays closest toparent CeCuAl3 (the CF exciton-phonons interaction is still not strong enoughto invoke an additional magneto-elastic peak), while other to compositions revealquite different energy spectra.
We note the presence of another two small peaks at around 15 and 25 meVin energy spectra of CeCu0.75Al3.25 and CeCu0.9Al3.1, respectively. These peakscould be associated with phonon peaks, which differ slightly in Ce and La ana-logues, i.e. the phonon part of spectra is not completely subtracted from thedata. Second explanation could be the presence of strong CF exciton-phonon in-teractions, which cannot be proven due to relatively strong phonon peaks. Thirdpossibility could be a variation of composition of studied samples; there was alarge amount of sample used for the measurement. Nevertheless, the samples werethoroughly checked by X-ray diffraction and EDX analysis before the experiment,which showed single phase samples.
4.2 CePd2Al2 and CeT2X2 compounds
The ternary intermetallic CeT2X2 compounds (where T = transition elementd-metal and X = p-metal) stay in the foreground of interest already manyyears. The physical properties as heavy-fermion behavior, valence-fluctuations,non-Fermi-liquid behavior or pressure induced superconductivity are frequentlypresent in CeT2X2 compounds crystallizing in the ThCr2Si2-type structure (spacegroup I4/mmm), see Figure 4.1 and Refs. [100, 101, 102, 29, 104, 105, 106, 107].The observed behavior is frequently discussed with respect to the competitionbetween RKKY and Kondo interactions. The influence of the crystal electricfield is also a strong mechanism one has to take into account. The second crystalstructure in which CeT2X2 compounds were often found to crystallize, CaBe2Ge2-type (P4/nmm), differs from the former one only by a different stacking of the
73
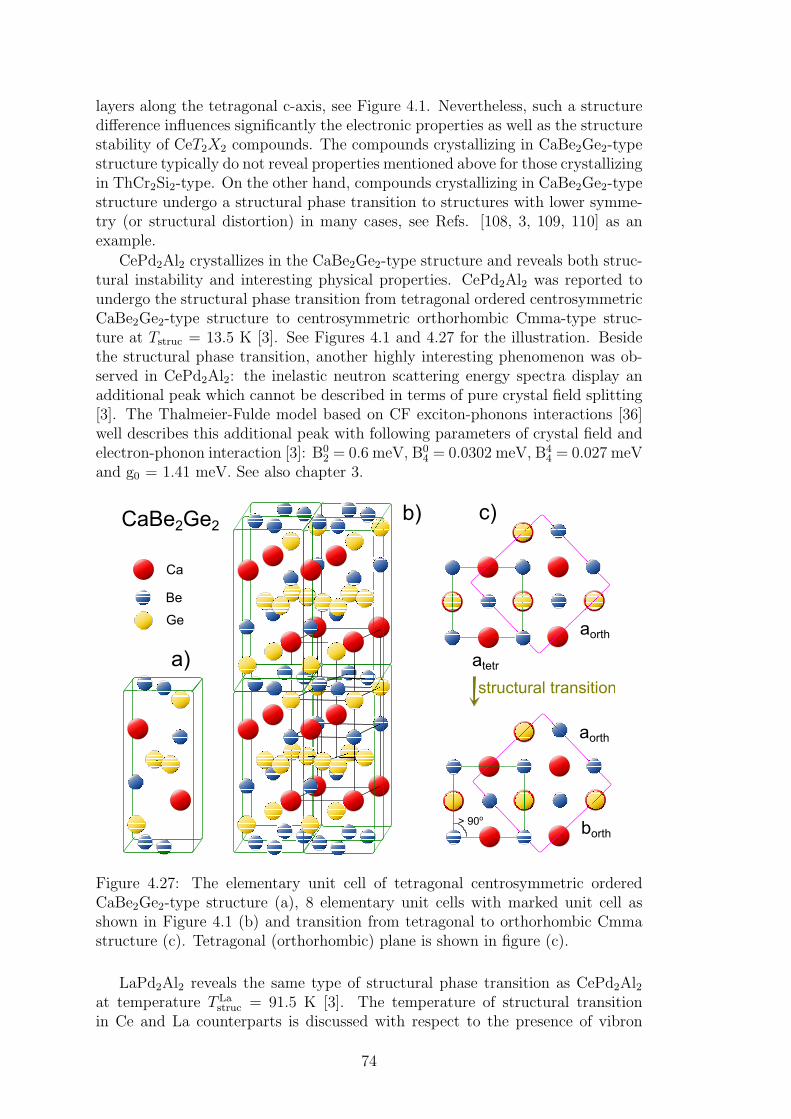
layers along the tetragonal c-axis, see Figure 4.1. Nevertheless, such a structuredifference influences significantly the electronic properties as well as the structurestability of CeT2X2 compounds. The compounds crystallizing in CaBe2Ge2-typestructure typically do not reveal properties mentioned above for those crystallizingin ThCr2Si2-type. On the other hand, compounds crystallizing in CaBe2Ge2-typestructure undergo a structural phase transition to structures with lower symme-try (or structural distortion) in many cases, see Refs. [108, 3, 109, 110] as anexample.
CePd2Al2 crystallizes in the CaBe2Ge2-type structure and reveals both struc-tural instability and interesting physical properties. CePd2Al2 was reported toundergo the structural phase transition from tetragonal ordered centrosymmetricCaBe2Ge2-type structure to centrosymmetric orthorhombic Cmma-type struc-ture at Tstruc = 13.5 K [3]. See Figures 4.1 and 4.27 for the illustration. Besidethe structural phase transition, another highly interesting phenomenon was ob-served in CePd2Al2: the inelastic neutron scattering energy spectra display anadditional peak which cannot be described in terms of pure crystal field splitting[3]. The Thalmeier-Fulde model based on CF exciton-phonons interactions [36]well describes this additional peak with following parameters of crystal field andelectron-phonon interaction [3]: B0
2 = 0.6 meV, B04 = 0.0302 meV, B4
4 = 0.027 meVand g0 = 1.41 meV. See also chapter 3.
CaBe2Ge2
Be
Ge
Ca
a)
b) c)
atetr
aorth
borth
aorth
> 90o
structural transition
Figure 4.27: The elementary unit cell of tetragonal centrosymmetric orderedCaBe2Ge2-type structure (a), 8 elementary unit cells with marked unit cell asshown in Figure 4.1 (b) and transition from tetragonal to orthorhombic Cmmastructure (c). Tetragonal (orthorhombic) plane is shown in figure (c).
LaPd2Al2 reveals the same type of structural phase transition as CePd2Al2at temperature T La
struc = 91.5 K [3]. The temperature of structural transitionin Ce and La counterparts is discussed with respect to the presence of vibron
74
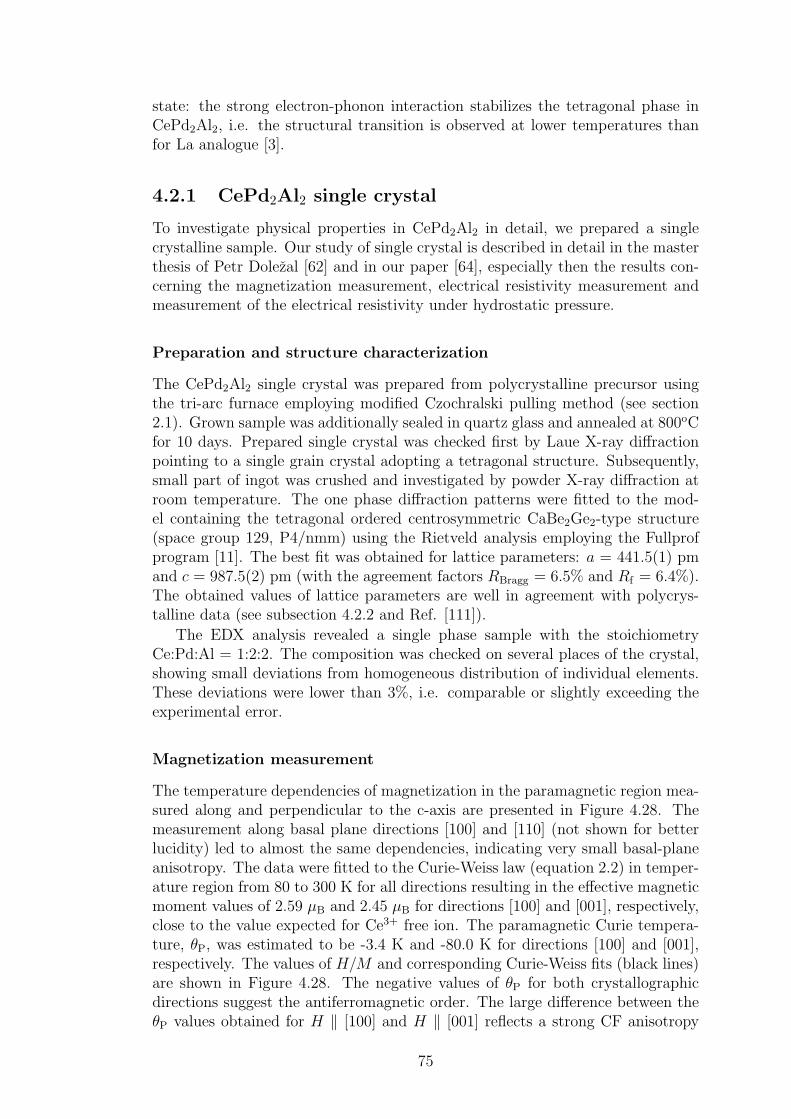
state: the strong electron-phonon interaction stabilizes the tetragonal phase inCePd2Al2, i.e. the structural transition is observed at lower temperatures thanfor La analogue [3].
4.2.1 CePd2Al2 single crystal
To investigate physical properties in CePd2Al2 in detail, we prepared a singlecrystalline sample. Our study of single crystal is described in detail in the masterthesis of Petr Dolezal [62] and in our paper [64], especially then the results con-cerning the magnetization measurement, electrical resistivity measurement andmeasurement of the electrical resistivity under hydrostatic pressure.
Preparation and structure characterization
The CePd2Al2 single crystal was prepared from polycrystalline precursor usingthe tri-arc furnace employing modified Czochralski pulling method (see section2.1). Grown sample was additionally sealed in quartz glass and annealed at 800oCfor 10 days. Prepared single crystal was checked first by Laue X-ray diffractionpointing to a single grain crystal adopting a tetragonal structure. Subsequently,small part of ingot was crushed and investigated by powder X-ray diffraction atroom temperature. The one phase diffraction patterns were fitted to the mod-el containing the tetragonal ordered centrosymmetric CaBe2Ge2-type structure(space group 129, P4/nmm) using the Rietveld analysis employing the Fullprofprogram [11]. The best fit was obtained for lattice parameters: a = 441.5(1) pmand c = 987.5(2) pm (with the agreement factors RBragg = 6.5% and Rf = 6.4%).The obtained values of lattice parameters are well in agreement with polycrys-talline data (see subsection 4.2.2 and Ref. [111]).
The EDX analysis revealed a single phase sample with the stoichiometryCe:Pd:Al = 1:2:2. The composition was checked on several places of the crystal,showing small deviations from homogeneous distribution of individual elements.These deviations were lower than 3%, i.e. comparable or slightly exceeding theexperimental error.
Magnetization measurement
The temperature dependencies of magnetization in the paramagnetic region mea-sured along and perpendicular to the c-axis are presented in Figure 4.28. Themeasurement along basal plane directions [100] and [110] (not shown for betterlucidity) led to almost the same dependencies, indicating very small basal-planeanisotropy. The data were fitted to the Curie-Weiss law (equation 2.2) in temper-ature region from 80 to 300 K for all directions resulting in the effective magneticmoment values of 2.59 µB and 2.45 µB for directions [100] and [001], respectively,close to the value expected for Ce3+ free ion. The paramagnetic Curie tempera-ture, θP, was estimated to be -3.4 K and -80.0 K for directions [100] and [001],respectively. The values of H/M and corresponding Curie-Weiss fits (black lines)are shown in Figure 4.28. The negative values of θP for both crystallographicdirections suggest the antiferromagnetic order. The large difference between theθP values obtained for H ‖ [100] and H ‖ [001] reflects a strong CF anisotropy
75
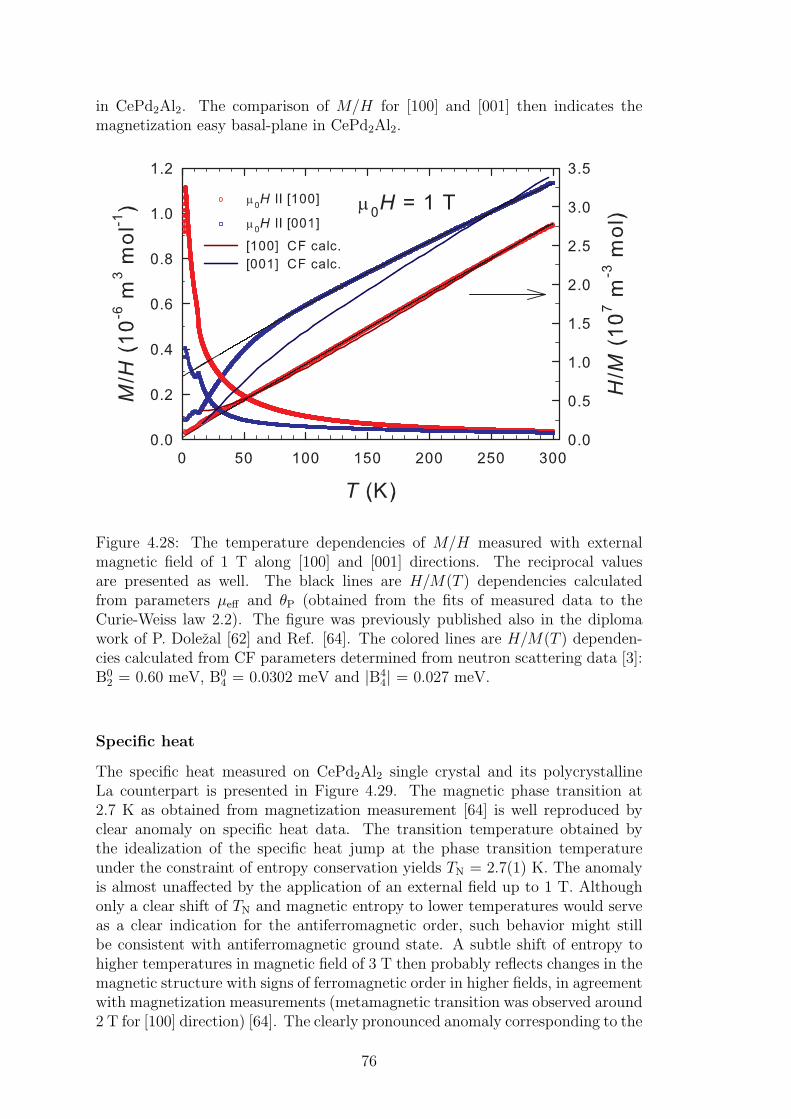
in CePd2Al2. The comparison of M/H for [100] and [001] then indicates themagnetization easy basal-plane in CePd2Al2.
Figure 4.28: The temperature dependencies of M/H measured with externalmagnetic field of 1 T along [100] and [001] directions. The reciprocal valuesare presented as well. The black lines are H/M(T ) dependencies calculatedfrom parameters µeff and θP (obtained from the fits of measured data to theCurie-Weiss law 2.2). The figure was previously published also in the diplomawork of P. Dolezal [62] and Ref. [64]. The colored lines are H/M(T ) dependen-cies calculated from CF parameters determined from neutron scattering data [3]:B0
2 = 0.60 meV, B04 = 0.0302 meV and |B4
4| = 0.027 meV.
Specific heat
The specific heat measured on CePd2Al2 single crystal and its polycrystallineLa counterpart is presented in Figure 4.29. The magnetic phase transition at2.7 K as obtained from magnetization measurement [64] is well reproduced byclear anomaly on specific heat data. The transition temperature obtained bythe idealization of the specific heat jump at the phase transition temperatureunder the constraint of entropy conservation yields TN = 2.7(1) K. The anomalyis almost unaffected by the application of an external field up to 1 T. Althoughonly a clear shift of TN and magnetic entropy to lower temperatures would serveas a clear indication for the antiferromagnetic order, such behavior might stillbe consistent with antiferromagnetic ground state. A subtle shift of entropy tohigher temperatures in magnetic field of 3 T then probably reflects changes in themagnetic structure with signs of ferromagnetic order in higher fields, in agreementwith magnetization measurements (metamagnetic transition was observed around2 T for [100] direction) [64]. The clearly pronounced anomaly corresponding to the
76

structural phase transition from tetragonal to orthorhombic structure is observedaround 13 K. The magnetic field of 3 T has no impact on this anomaly (see Figure4.29).
Figure 4.29: The temperature dependence of specific heat in CePd2Al2 single crys-tal and LaPd2Al2 polycrystal. The inset contains the zoomed low-temperatureregion with the data measured in external magnetic field applied along [100] direc-tion. The figure was previously published also in the diploma work of P. Dolezal[62] and Ref. [64].
The total specific heat of CePd2Al2 is considered to consist of phonon, elec-tronic and magnetic contributions: Cp = Cph + Cel + Cmag. The isostructuralnon-magnetic La analogue could be used for a reasonable estimation of the phononand electronic part of specific heat. The almost perfect overlap of specific heatdata for Ce and La counterparts at high temperatures justifies such an approach(see Figures 4.29 and 4.30). However, both compounds undergo the structuralphase transition, which brings certain uncertainties in the estimation of Cmag.The structural transition in LaPd2Al2 around 99 K reveals itself in only verysmall broad anomaly on specific heat data as discussed in section 4.2.2. On theother hand, the anomaly around 13 K in CePd2Al2 is well pronounced (see Figure4.29). We should note, however, that the measurement was done on polycrys-talline sample of LaPd2Al2, whereas single crystal of CePd2Al2 was measured.The structural transition in CePd2Al2 is furthermore affected by CF exciton-phonons interaction which involves cerium magnetic degrees of freedom, so it cancontribute to the overall magnetic entropy. In Figure 4.31, we show the magneticentropy obtained as a simple difference between the Ce and La data (i.e. fullyincluding the entropy related to the transition around 13 K) and magnetic en-tropy obtained when the specific heat corresponding to the anomaly around 13 Kis completely subtracted from the Ce data. The two approaches could be consid-ered as a lower and upper limit of the magnetic entropy. The error of estimation
77
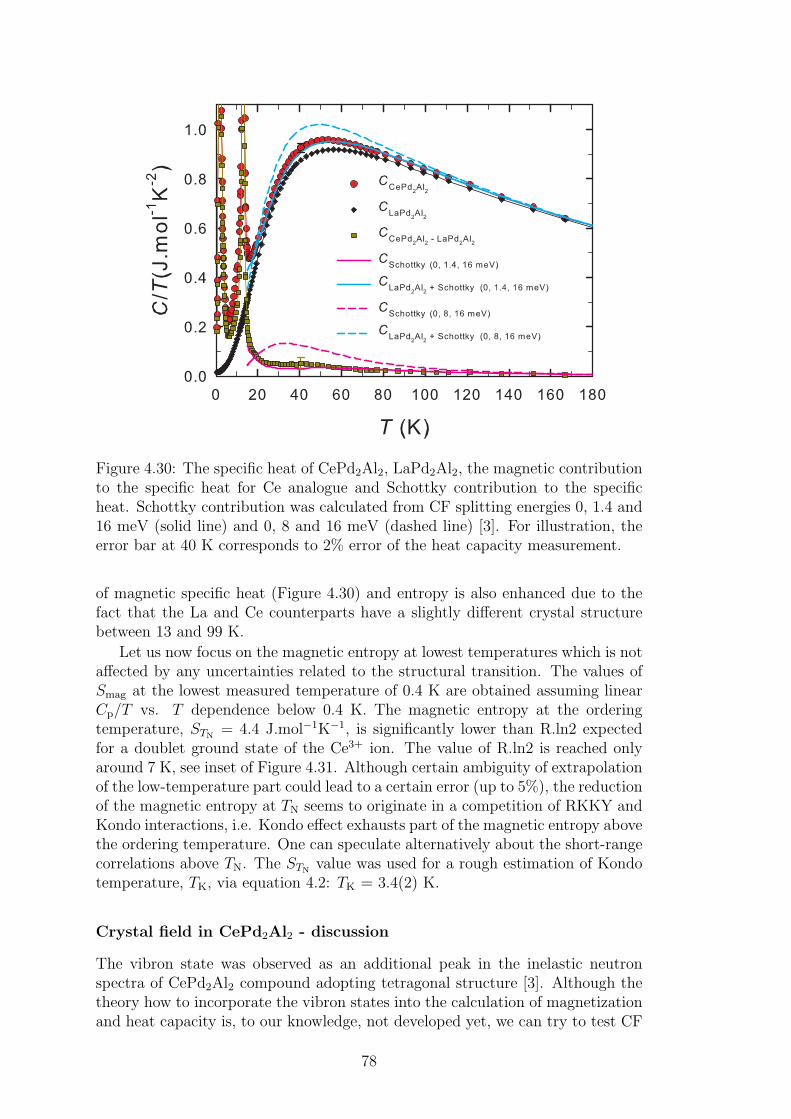
Figure 4.30: The specific heat of CePd2Al2, LaPd2Al2, the magnetic contributionto the specific heat for Ce analogue and Schottky contribution to the specificheat. Schottky contribution was calculated from CF splitting energies 0, 1.4 and16 meV (solid line) and 0, 8 and 16 meV (dashed line) [3]. For illustration, theerror bar at 40 K corresponds to 2% error of the heat capacity measurement.
of magnetic specific heat (Figure 4.30) and entropy is also enhanced due to thefact that the La and Ce counterparts have a slightly different crystal structurebetween 13 and 99 K.
Let us now focus on the magnetic entropy at lowest temperatures which is notaffected by any uncertainties related to the structural transition. The values ofSmag at the lowest measured temperature of 0.4 K are obtained assuming linearCp/T vs. T dependence below 0.4 K. The magnetic entropy at the orderingtemperature, STN
= 4.4 J.mol−1K−1, is significantly lower than R.ln2 expectedfor a doublet ground state of the Ce3+ ion. The value of R.ln2 is reached onlyaround 7 K, see inset of Figure 4.31. Although certain ambiguity of extrapolationof the low-temperature part could lead to a certain error (up to 5%), the reductionof the magnetic entropy at TN seems to originate in a competition of RKKY andKondo interactions, i.e. Kondo effect exhausts part of the magnetic entropy abovethe ordering temperature. One can speculate alternatively about the short-rangecorrelations above TN. The STN
value was used for a rough estimation of Kondotemperature, TK, via equation 4.2: TK = 3.4(2) K.
Crystal field in CePd2Al2 - discussion
The vibron state was observed as an additional peak in the inelastic neutronspectra of CePd2Al2 compound adopting tetragonal structure [3]. Although thetheory how to incorporate the vibron states into the calculation of magnetizationand heat capacity is, to our knowledge, not developed yet, we can try to test CF
78
Figure 4.31: The temperature dependence of magnetic entropy determined as sim-ple difference between the Ce and La data (SCe−La) and with additional subtrac-tion of the specific heat of the structural transition anomaly at Tstruc (SCe−La−STA).The inset contains the zoomed low-temperature part of entropy, where the arrowsmark the phase transitions as obtained from anomalies on specific heat data.
parameters by comparing with the magnetization and specific heat data withouttaking into account the influence of vibron state. The measured H/M(T ) depen-dencies in Figure 4.28 are compared to the curves (colored lines correspondingto specific magnetic field directions) calculated using the above given CF pa-rameters. The agreement between the measured data and calculated curves isimpressive: not only the mutual anisotropy, but also the magnetization magni-tude are in a good agreement. The observed discrepancies at lower temperaturescould be tentatively ascribed to the influence of vibron state which is not takeninto account during the calculation as well as the influence of structural phasetransition.
The magnetic part of specific heat in the paramagnetic region well above theordering temperature is generally described by Schottky formula and the crystalfield splitting of the multiplet ground state. The Schottky contribution above13 K is calculated from CF splitting energies for tetragonal crystal structure:0, 1.4, 8 and 16 meV. At lower temperatures the compound adopts already or-thorhombic crystal structure, where the CF parameters and also eigenenergiesare significantly different, see section 4.2.4. The experimental Cmag was com-pared with the Schottky contribution calculated using the energies of CF levels:0, 8 and 16 meV. The data are drawn in Figure 4.30. The calculation clearly failsto describe the experimental data, even considering somewhat enhanced error ofthe magnetic specific heat. Instead, the data are well reproduced when consider-
79

ing energy level at 1.4 meV (with degeneracy 2), see Figure 4.30. The degeneracyof individual levels might be matter of debate. Figure 4.30 shows a simple casewith further doublet state at 16 meV and no level at 8 meV. Taking into accountonly levels at 1.4 and 8 meV leads to much worse agreement (not shown).
4.2.2 Physical properties of CePd2(Al,Ga)2 compounds
Crystal structure and structural phase transitions
Polycrystalline RPd2Al2−xGax samples, where R = Ce and La and where x rangesfrom 0.0 to 2.0 with a step of 0.4, were prepared by arc-melting of pure elementsin a mono-arc furnace under the protection of an argon atmosphere. All thesamples were additionally sealed in a quartz glass under pressure of 10−4 Pa andannealed for 10 days at 850oC.
To verify the crystal structure and to refine the structural parameters, theX-ray diffraction patterns were recorded at room temperature. The structureparameters were refined by Rietveld analysis using the Fullprof program [11].The analysis revealed the ordered centrosymmetric tetragonal crystal structureof CaBe2Ge2-type (space group 129, P4/nmm) at room temperature for the wholeseries. The refined lattice parameters are listed in Table 4.7. The stoichiometryand chemical composition of prepared samples were checked subsequently by EDXanalysis revealing one phase samples with expected stoichiometries.
The low-temperature X-ray diffraction was used to investigate the structuralphase transitions in (Ce,La)Pd2Al2−xGax compounds in detail. Detailed descrip-tion of structure parameters development with temperature is part of the masterthesis of Petr Dolezal [62] (only in czech language) and our recent publication[111]. We restrict ourself only to the description of found low-T orthorhombicstructures (see Figure 4.27) and to the development of structural transition tem-peratures in CePd2Al2−xGax and LaPd2Al2−xGax series (see Table 4.7 and Figure4.32) as it is important for further discussion in section 4.2.4.
The CePd2Al2−xGax compounds undergo the structural phase transition fromtetragonal CaBe2Ge2-type structure to orthorhombic structure (Cmma) in tem-perature range from 13 to 130 K depending on Al-Ga concentration. Surprisingly,the statement is valid also for CePd2Ga2, for which the low-temperature phasewas identified as the triclinic structure by Kitagawa et al. [109]. Nevertheless,the low-temperature lattice parameters in CePd2Ga2 and in the rest of the seriesdiffer significantly, what leads us to labels: orthorhombic I and orthorhombic IIstructure for x < 2 and x = 2, respectively. The lattice parameters a and bdiffer only slightly in the case of orthorhombic I structure. Their values are veryclose to the length of a basal plane diagonal of tetragonal structure (see Figure4.27), i.e. aorth ≈ borth =
√2atetr. Orthorhombic II structure then reveals more
pronounced difference between parameters a and b. The orthorhombic I and IIstructures are isostructural, nevertheless, the Al-Ga substitution does not leadto the transition between them. One can rather suppose a formation of one ofthem, while the other wears off. Intervals of coexistence could be traced. Formore details see Ref. [111]. Ce and La counterparts undergo the same type ofstructural transition.
The concentration dependencies of the structural phase transition tempera-ture, Tstruc, in CePd2Al2−xGax and LaPd2Al2−xGax compounds (as determined
80
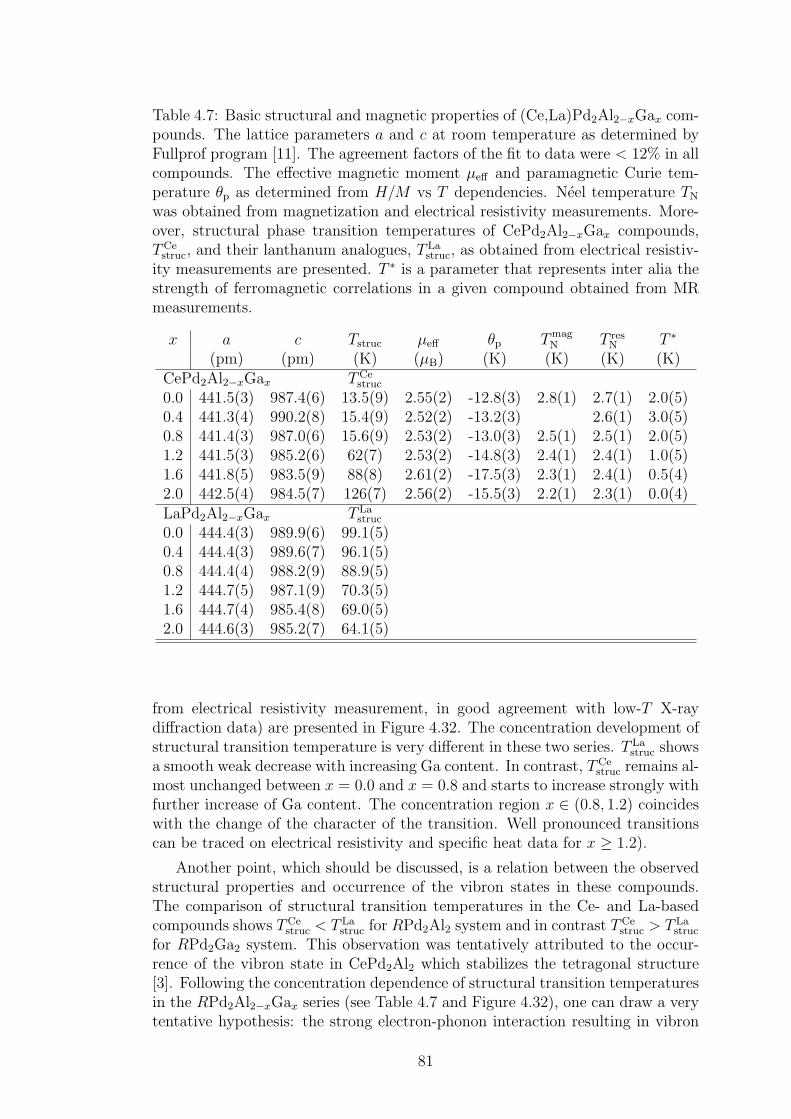
Table 4.7: Basic structural and magnetic properties of (Ce,La)Pd2Al2−xGax com-pounds. The lattice parameters a and c at room temperature as determined byFullprof program [11]. The agreement factors of the fit to data were < 12% in allcompounds. The effective magnetic moment µeff and paramagnetic Curie tem-perature θp as determined from H/M vs T dependencies. Neel temperature TN
was obtained from magnetization and electrical resistivity measurements. More-over, structural phase transition temperatures of CePd2Al2−xGax compounds,TCestruc, and their lanthanum analogues, T La
struc, as obtained from electrical resistiv-ity measurements are presented. T ∗ is a parameter that represents inter alia thestrength of ferromagnetic correlations in a given compound obtained from MRmeasurements.
x a c Tstruc µeff θp TmagN T res
N T ∗
(pm) (pm) (K) (µB) (K) (K) (K) (K)CePd2Al2−xGax TCe
struc
0.0 441.5(3) 987.4(6) 13.5(9) 2.55(2) -12.8(3) 2.8(1) 2.7(1) 2.0(5)0.4 441.3(4) 990.2(8) 15.4(9) 2.52(2) -13.2(3) 2.6(1) 3.0(5)0.8 441.4(3) 987.0(6) 15.6(9) 2.53(2) -13.0(3) 2.5(1) 2.5(1) 2.0(5)1.2 441.5(3) 985.2(6) 62(7) 2.53(2) -14.8(3) 2.4(1) 2.4(1) 1.0(5)1.6 441.8(5) 983.5(9) 88(8) 2.61(2) -17.5(3) 2.3(1) 2.4(1) 0.5(4)2.0 442.5(4) 984.5(7) 126(7) 2.56(2) -15.5(3) 2.2(1) 2.3(1) 0.0(4)LaPd2Al2−xGax T La
struc
0.0 444.4(3) 989.9(6) 99.1(5)0.4 444.4(3) 989.6(7) 96.1(5)0.8 444.4(4) 988.2(9) 88.9(5)1.2 444.7(5) 987.1(9) 70.3(5)1.6 444.7(4) 985.4(8) 69.0(5)2.0 444.6(3) 985.2(7) 64.1(5)
from electrical resistivity measurement, in good agreement with low-T X-raydiffraction data) are presented in Figure 4.32. The concentration development ofstructural transition temperature is very different in these two series. T La
struc showsa smooth weak decrease with increasing Ga content. In contrast, TCe
struc remains al-most unchanged between x = 0.0 and x = 0.8 and starts to increase strongly withfurther increase of Ga content. The concentration region x ∈ (0.8, 1.2) coincideswith the change of the character of the transition. Well pronounced transitionscan be traced on electrical resistivity and specific heat data for x ≥ 1.2).
Another point, which should be discussed, is a relation between the observedstructural properties and occurrence of the vibron states in these compounds.The comparison of structural transition temperatures in the Ce- and La-basedcompounds shows TCe
struc < T Lastruc for RPd2Al2 system and in contrast TCe
struc > T Lastruc
for RPd2Ga2 system. This observation was tentatively attributed to the occur-rence of the vibron state in CePd2Al2 which stabilizes the tetragonal structure[3]. Following the concentration dependence of structural transition temperaturesin the RPd2Al2−xGax series (see Table 4.7 and Figure 4.32), one can draw a verytentative hypothesis: the strong electron-phonon interaction resulting in vibron
81
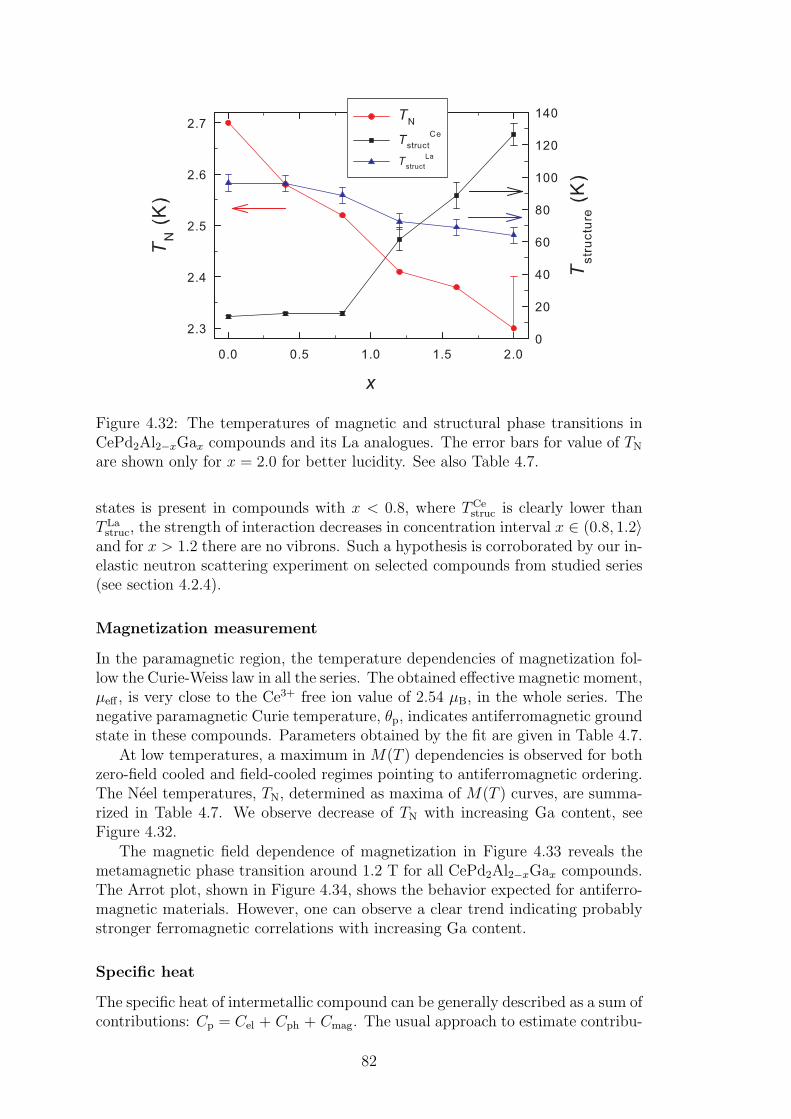
Figure 4.32: The temperatures of magnetic and structural phase transitions inCePd2Al2−xGax compounds and its La analogues. The error bars for value of TN
are shown only for x = 2.0 for better lucidity. See also Table 4.7.
states is present in compounds with x < 0.8, where TCestruc is clearly lower than
T Lastruc, the strength of interaction decreases in concentration interval x ∈ (0.8, 1.2〉
and for x > 1.2 there are no vibrons. Such a hypothesis is corroborated by our in-elastic neutron scattering experiment on selected compounds from studied series(see section 4.2.4).
Magnetization measurement
In the paramagnetic region, the temperature dependencies of magnetization fol-low the Curie-Weiss law in all the series. The obtained effective magnetic moment,µeff , is very close to the Ce3+ free ion value of 2.54 µB, in the whole series. Thenegative paramagnetic Curie temperature, θp, indicates antiferromagnetic groundstate in these compounds. Parameters obtained by the fit are given in Table 4.7.
At low temperatures, a maximum in M(T ) dependencies is observed for bothzero-field cooled and field-cooled regimes pointing to antiferromagnetic ordering.The Neel temperatures, TN, determined as maxima of M(T ) curves, are summa-rized in Table 4.7. We observe decrease of TN with increasing Ga content, seeFigure 4.32.
The magnetic field dependence of magnetization in Figure 4.33 reveals themetamagnetic phase transition around 1.2 T for all CePd2Al2−xGax compounds.The Arrot plot, shown in Figure 4.34, shows the behavior expected for antiferro-magnetic materials. However, one can observe a clear trend indicating probablystronger ferromagnetic correlations with increasing Ga content.
Specific heat
The specific heat of intermetallic compound can be generally described as a sum ofcontributions: Cp = Cel + Cph + Cmag. The usual approach to estimate contribu-
82
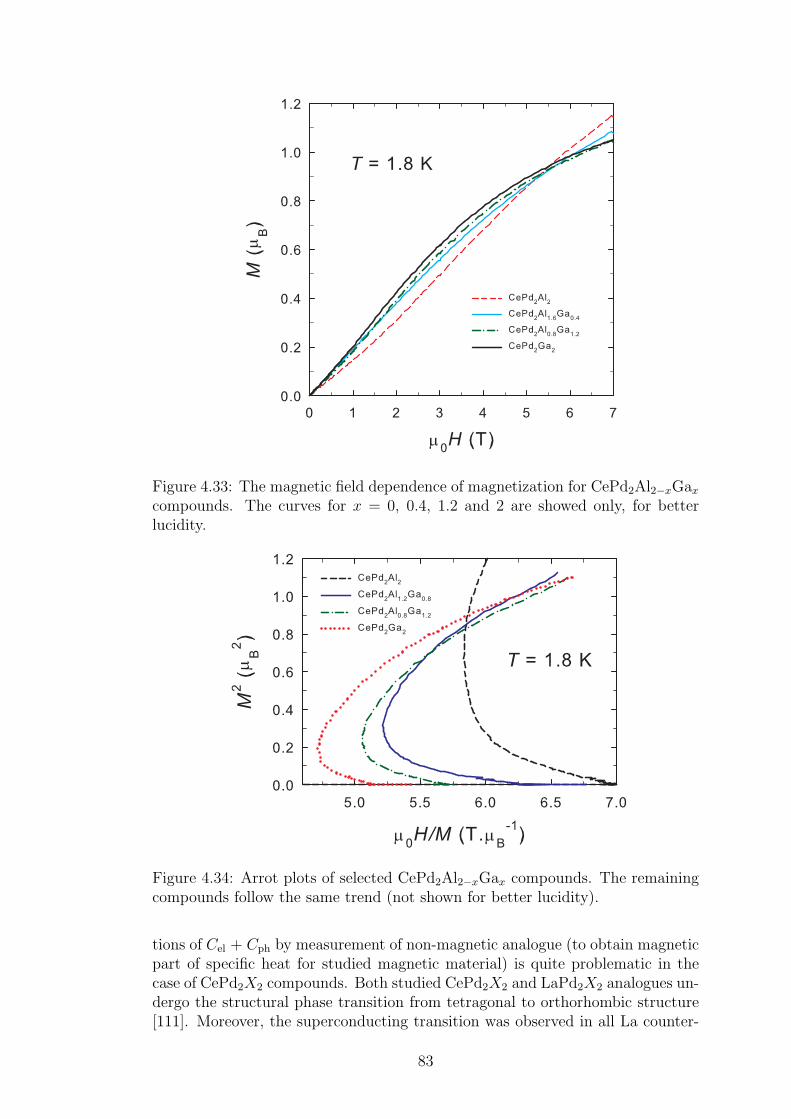
Figure 4.33: The magnetic field dependence of magnetization for CePd2Al2−xGaxcompounds. The curves for x = 0, 0.4, 1.2 and 2 are showed only, for betterlucidity.
Figure 4.34: Arrot plots of selected CePd2Al2−xGax compounds. The remainingcompounds follow the same trend (not shown for better lucidity).
tions of Cel + Cph by measurement of non-magnetic analogue (to obtain magneticpart of specific heat for studied magnetic material) is quite problematic in thecase of CePd2X2 compounds. Both studied CePd2X2 and LaPd2X2 analogues un-dergo the structural phase transition from tetragonal to orthorhombic structure[111]. Moreover, the superconducting transition was observed in all La counter-
83
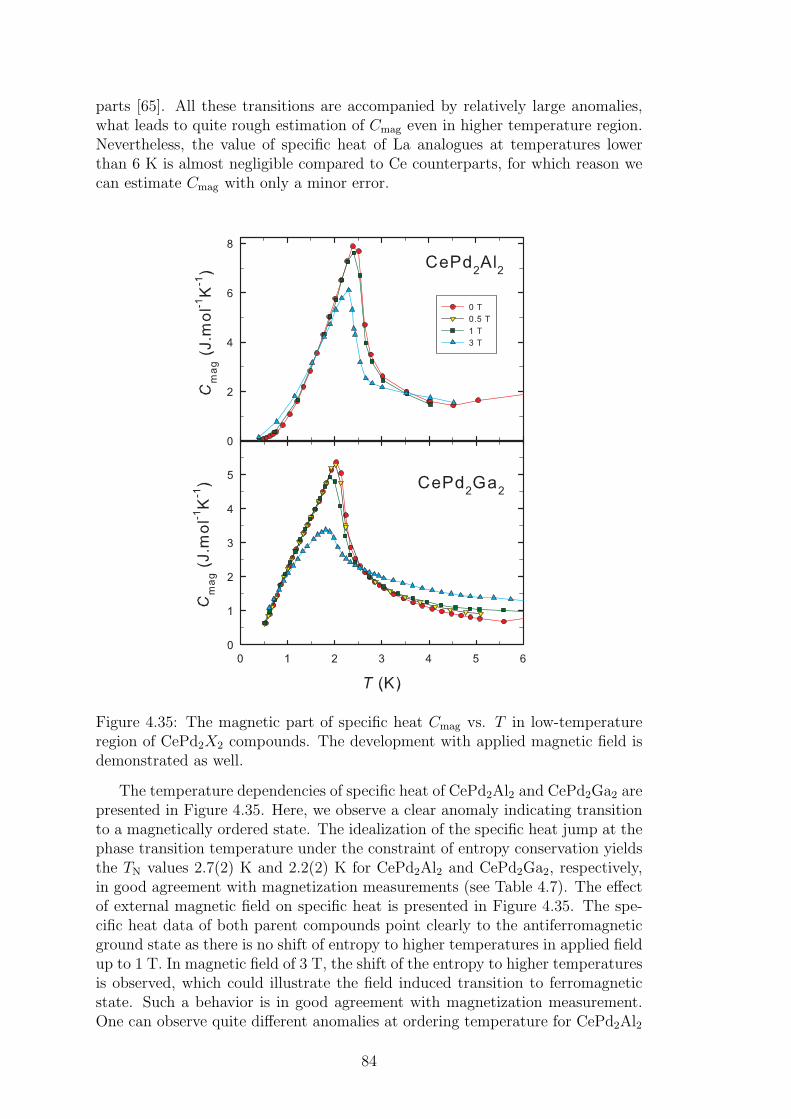
parts [65]. All these transitions are accompanied by relatively large anomalies,what leads to quite rough estimation of Cmag even in higher temperature region.Nevertheless, the value of specific heat of La analogues at temperatures lowerthan 6 K is almost negligible compared to Ce counterparts, for which reason wecan estimate Cmag with only a minor error.
Figure 4.35: The magnetic part of specific heat Cmag vs. T in low-temperatureregion of CePd2X2 compounds. The development with applied magnetic field isdemonstrated as well.
The temperature dependencies of specific heat of CePd2Al2 and CePd2Ga2 arepresented in Figure 4.35. Here, we observe a clear anomaly indicating transitionto a magnetically ordered state. The idealization of the specific heat jump at thephase transition temperature under the constraint of entropy conservation yieldsthe TN values 2.7(2) K and 2.2(2) K for CePd2Al2 and CePd2Ga2, respectively,in good agreement with magnetization measurements (see Table 4.7). The effectof external magnetic field on specific heat is presented in Figure 4.35. The spe-cific heat data of both parent compounds point clearly to the antiferromagneticground state as there is no shift of entropy to higher temperatures in applied fieldup to 1 T. In magnetic field of 3 T, the shift of the entropy to higher temperaturesis observed, which could illustrate the field induced transition to ferromagneticstate. Such a behavior is in good agreement with magnetization measurement.One can observe quite different anomalies at ordering temperature for CePd2Al2
84
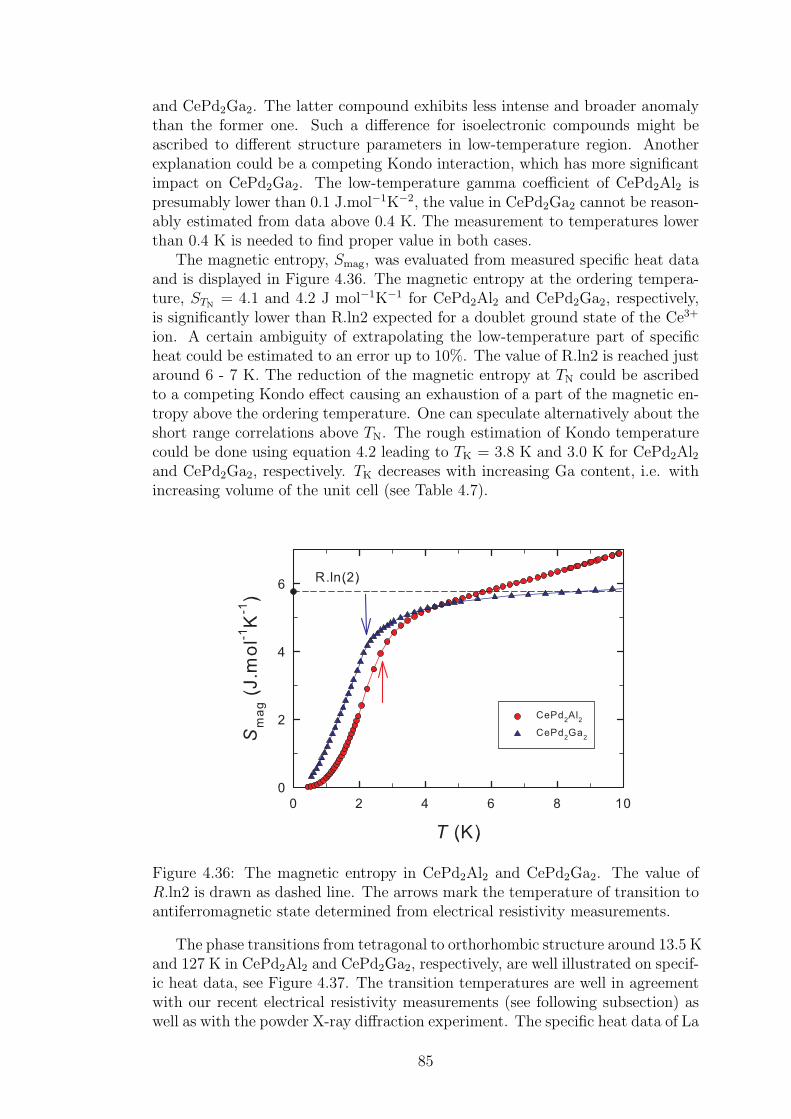
and CePd2Ga2. The latter compound exhibits less intense and broader anomalythan the former one. Such a difference for isoelectronic compounds might beascribed to different structure parameters in low-temperature region. Anotherexplanation could be a competing Kondo interaction, which has more significantimpact on CePd2Ga2. The low-temperature gamma coefficient of CePd2Al2 ispresumably lower than 0.1 J.mol−1K−2, the value in CePd2Ga2 cannot be reason-ably estimated from data above 0.4 K. The measurement to temperatures lowerthan 0.4 K is needed to find proper value in both cases.
The magnetic entropy, Smag, was evaluated from measured specific heat dataand is displayed in Figure 4.36. The magnetic entropy at the ordering tempera-ture, STN
= 4.1 and 4.2 J mol−1K−1 for CePd2Al2 and CePd2Ga2, respectively,is significantly lower than R.ln2 expected for a doublet ground state of the Ce3+
ion. A certain ambiguity of extrapolating the low-temperature part of specificheat could be estimated to an error up to 10%. The value of R.ln2 is reached justaround 6 - 7 K. The reduction of the magnetic entropy at TN could be ascribedto a competing Kondo effect causing an exhaustion of a part of the magnetic en-tropy above the ordering temperature. One can speculate alternatively about theshort range correlations above TN. The rough estimation of Kondo temperaturecould be done using equation 4.2 leading to TK = 3.8 K and 3.0 K for CePd2Al2and CePd2Ga2, respectively. TK decreases with increasing Ga content, i.e. withincreasing volume of the unit cell (see Table 4.7).
Figure 4.36: The magnetic entropy in CePd2Al2 and CePd2Ga2. The value ofR.ln2 is drawn as dashed line. The arrows mark the temperature of transition toantiferromagnetic state determined from electrical resistivity measurements.
The phase transitions from tetragonal to orthorhombic structure around 13.5 Kand 127 K in CePd2Al2 and CePd2Ga2, respectively, are well illustrated on specif-ic heat data, see Figure 4.37. The transition temperatures are well in agreementwith our recent electrical resistivity measurements (see following subsection) aswell as with the powder X-ray diffraction experiment. The specific heat data of La
85

Figure 4.37: The temperature development of specific heat around the structuralphase transition in CePd2X2 compounds. The arrows mark the structural phasetransition temperatures obtained by electrical resistivity measurements, see Table4.7.
Figure 4.38: The specific heat of LaPd2X2 compounds. The arrows mark thestructural phase transition temperatures obtained by electrical resistivity mea-surements, see Table 4.7.
counterparts are shown in Figure 4.38. Here, one can observe, that the structuralphase transition is bounded with well pronounced anomaly on specific heat datain the case of LaPd2Ga2, whereas LaPd2Al2 reveals almost no sign of structuraltransition. The transition from tetragonal to orthorhombic II structure revealsitself in pronounced anomalies on electrical resistivity and specific heat data. Onthe other hand, the transition to orthorhombic I structure is connected with onlya weak anomaly on polycrystalline sample (compare with single crystal specificheat data in Figures 4.29 and 4.30). The Schottky specific heat calculated for thewhole CePd2(Al,Ga)2 series is presented and discussed in section 4.2.4.
86
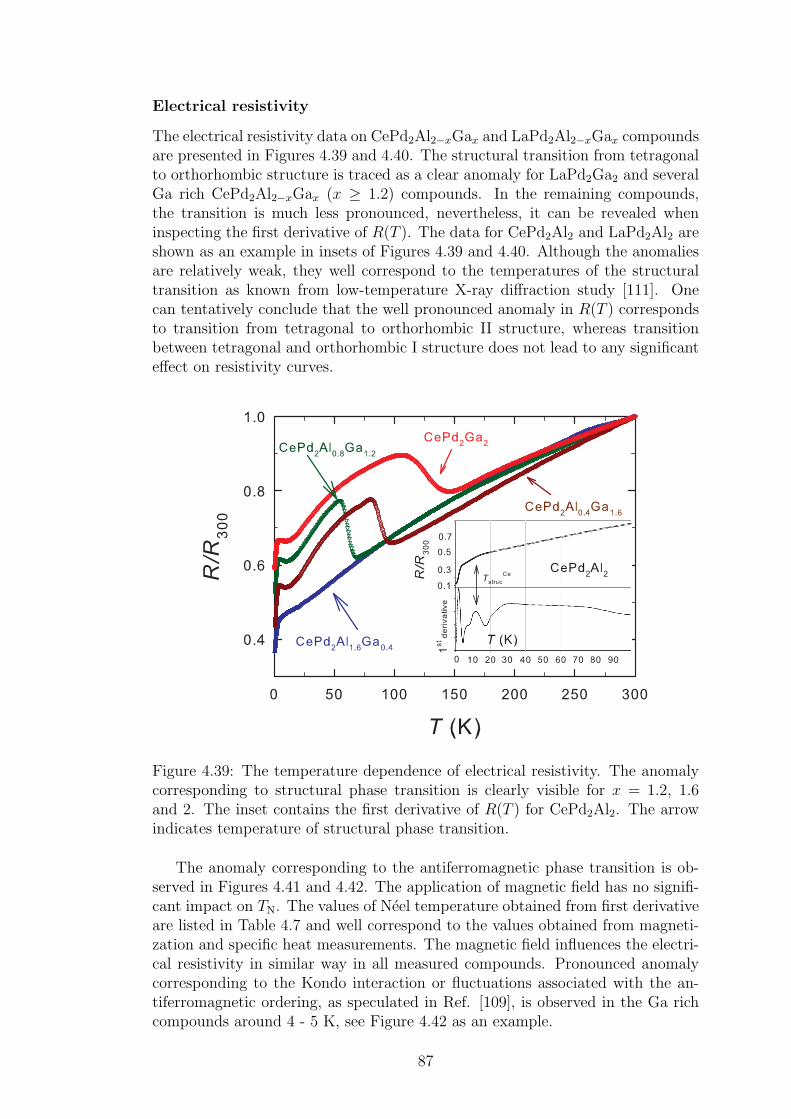
Electrical resistivity
The electrical resistivity data on CePd2Al2−xGax and LaPd2Al2−xGax compoundsare presented in Figures 4.39 and 4.40. The structural transition from tetragonalto orthorhombic structure is traced as a clear anomaly for LaPd2Ga2 and severalGa rich CePd2Al2−xGax (x ≥ 1.2) compounds. In the remaining compounds,the transition is much less pronounced, nevertheless, it can be revealed wheninspecting the first derivative of R(T ). The data for CePd2Al2 and LaPd2Al2 areshown as an example in insets of Figures 4.39 and 4.40. Although the anomaliesare relatively weak, they well correspond to the temperatures of the structuraltransition as known from low-temperature X-ray diffraction study [111]. Onecan tentatively conclude that the well pronounced anomaly in R(T ) correspondsto transition from tetragonal to orthorhombic II structure, whereas transitionbetween tetragonal and orthorhombic I structure does not lead to any significanteffect on resistivity curves.
Figure 4.39: The temperature dependence of electrical resistivity. The anomalycorresponding to structural phase transition is clearly visible for x = 1.2, 1.6and 2. The inset contains the first derivative of R(T ) for CePd2Al2. The arrowindicates temperature of structural phase transition.
The anomaly corresponding to the antiferromagnetic phase transition is ob-served in Figures 4.41 and 4.42. The application of magnetic field has no signifi-cant impact on TN. The values of Neel temperature obtained from first derivativeare listed in Table 4.7 and well correspond to the values obtained from magneti-zation and specific heat measurements. The magnetic field influences the electri-cal resistivity in similar way in all measured compounds. Pronounced anomalycorresponding to the Kondo interaction or fluctuations associated with the an-tiferromagnetic ordering, as speculated in Ref. [109], is observed in the Ga richcompounds around 4 - 5 K, see Figure 4.42 as an example.
87
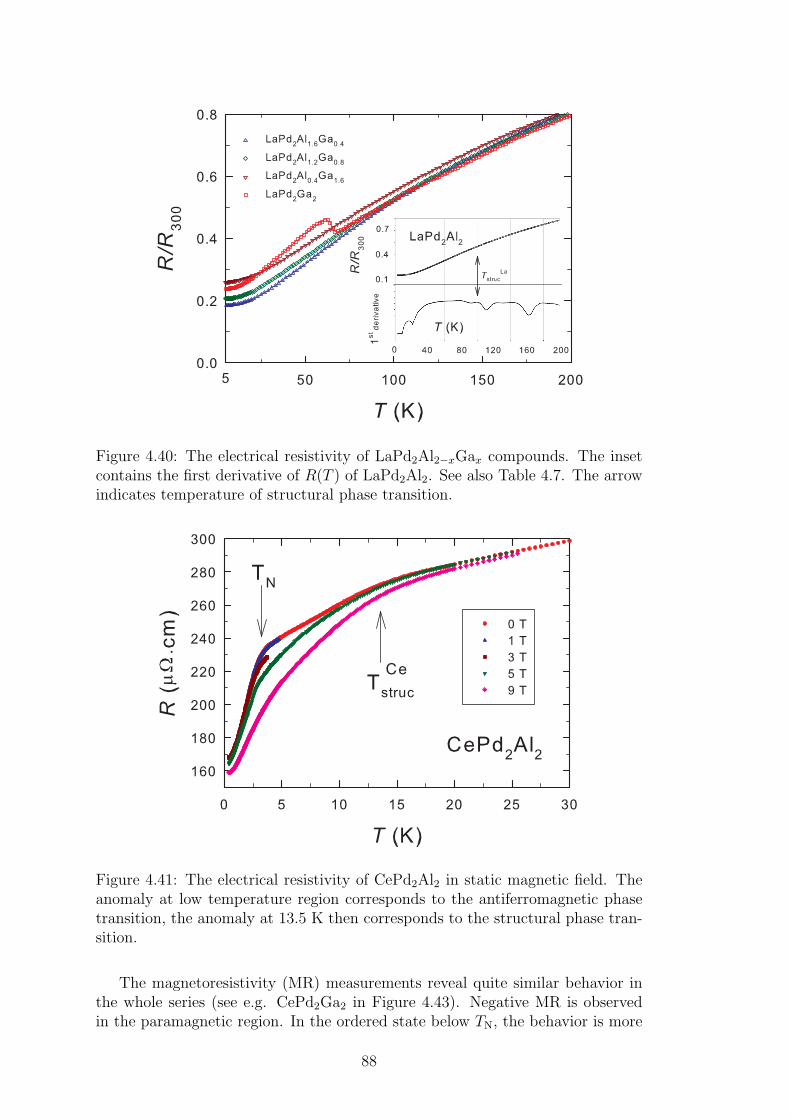
Figure 4.40: The electrical resistivity of LaPd2Al2−xGax compounds. The insetcontains the first derivative of R(T ) of LaPd2Al2. See also Table 4.7. The arrowindicates temperature of structural phase transition.
Figure 4.41: The electrical resistivity of CePd2Al2 in static magnetic field. Theanomaly at low temperature region corresponds to the antiferromagnetic phasetransition, the anomaly at 13.5 K then corresponds to the structural phase tran-sition.
The magnetoresistivity (MR) measurements reveal quite similar behavior inthe whole series (see e.g. CePd2Ga2 in Figure 4.43). Negative MR is observedin the paramagnetic region. In the ordered state below TN, the behavior is more
88
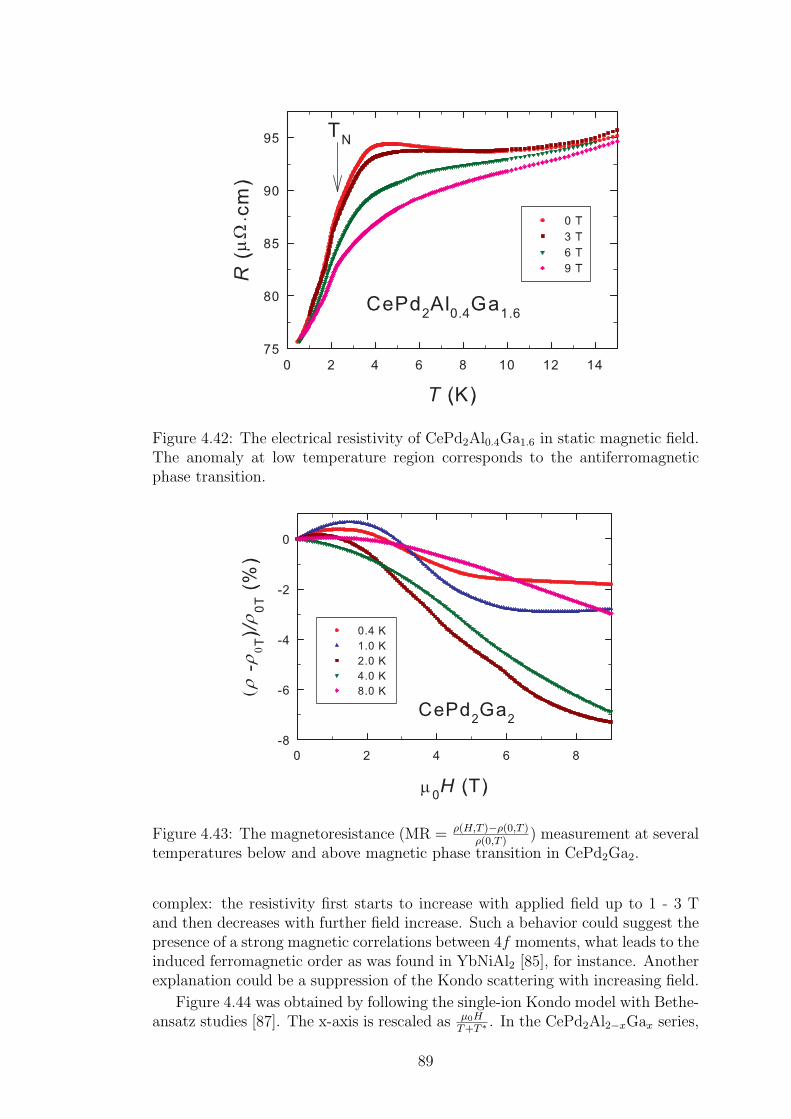
Figure 4.42: The electrical resistivity of CePd2Al0.4Ga1.6 in static magnetic field.The anomaly at low temperature region corresponds to the antiferromagneticphase transition.
Figure 4.43: The magnetoresistance (MR = ρ(H,T )−ρ(0,T )ρ(0,T )
) measurement at severaltemperatures below and above magnetic phase transition in CePd2Ga2.
complex: the resistivity first starts to increase with applied field up to 1 - 3 Tand then decreases with further field increase. Such a behavior could suggest thepresence of a strong magnetic correlations between 4f moments, what leads to theinduced ferromagnetic order as was found in YbNiAl2 [85], for instance. Anotherexplanation could be a suppression of the Kondo scattering with increasing field.
Figure 4.44 was obtained by following the single-ion Kondo model with Bethe-ansatz studies [87]. The x-axis is rescaled as µ0H
T+T ∗. In the CePd2Al2−xGax series,
89

Figure 4.44: The magnetoresistance (MR = ρ(H,T )−ρ(0,T )ρ(0,T )
) in dependence of µ0HT+T ∗
at several temperatures below and above magnetic phase transition in CePd2Al2,CePd2Al1.6Ga0.4 and CePd2Ga2 compounds. See text for more details.
T ∗ slightly increases from parent compound to x = 0.4 and then slowly decreaseswith increasing x (see Table 4.7). The ferromagnetic correlations (i.e. the lowestT ∗ values) are then expected in parent CePd2Ga2, where T ∗ = (0.0 ± 0.4) K.These ferromagnetic correlations in Ga rich compounds are in agreement withmagnetization measurements.
90
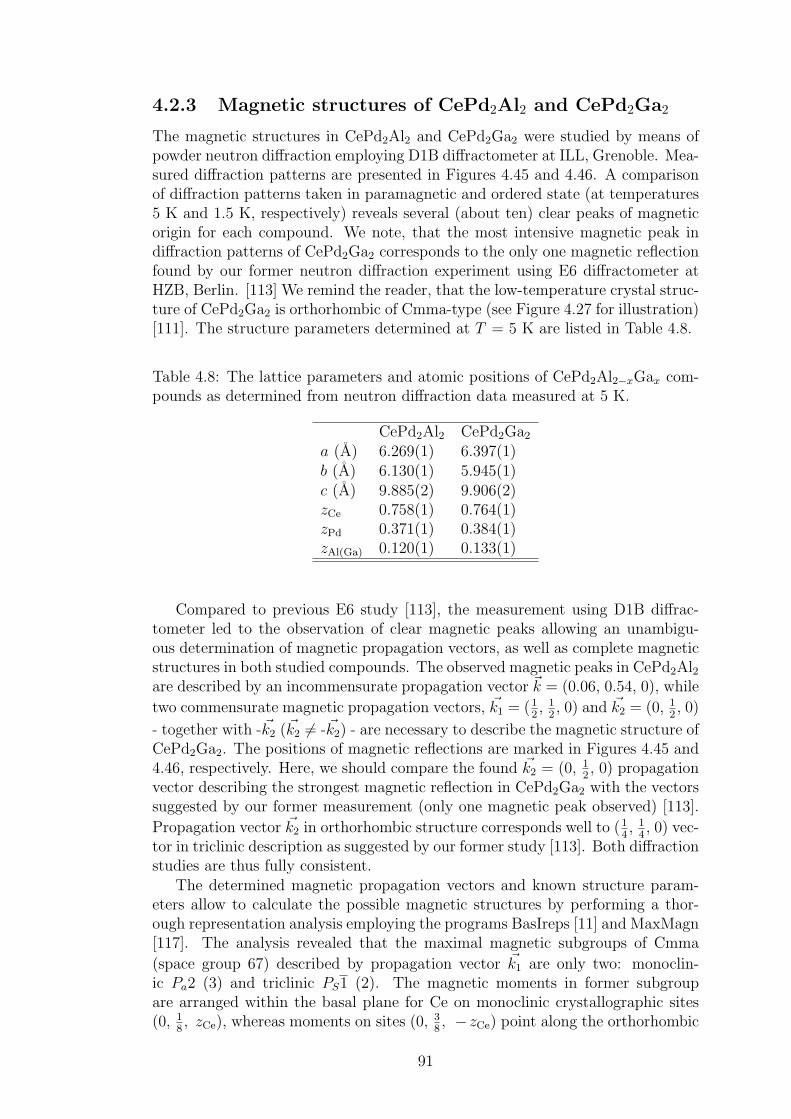
4.2.3 Magnetic structures of CePd2Al2 and CePd2Ga2
The magnetic structures in CePd2Al2 and CePd2Ga2 were studied by means ofpowder neutron diffraction employing D1B diffractometer at ILL, Grenoble. Mea-sured diffraction patterns are presented in Figures 4.45 and 4.46. A comparisonof diffraction patterns taken in paramagnetic and ordered state (at temperatures5 K and 1.5 K, respectively) reveals several (about ten) clear peaks of magneticorigin for each compound. We note, that the most intensive magnetic peak indiffraction patterns of CePd2Ga2 corresponds to the only one magnetic reflectionfound by our former neutron diffraction experiment using E6 diffractometer atHZB, Berlin. [113] We remind the reader, that the low-temperature crystal struc-ture of CePd2Ga2 is orthorhombic of Cmma-type (see Figure 4.27 for illustration)[111]. The structure parameters determined at T = 5 K are listed in Table 4.8.
Table 4.8: The lattice parameters and atomic positions of CePd2Al2−xGax com-pounds as determined from neutron diffraction data measured at 5 K.
CePd2Al2 CePd2Ga2a (A) 6.269(1) 6.397(1)b (A) 6.130(1) 5.945(1)c (A) 9.885(2) 9.906(2)zCe 0.758(1) 0.764(1)zPd 0.371(1) 0.384(1)zAl(Ga) 0.120(1) 0.133(1)
Compared to previous E6 study [113], the measurement using D1B diffrac-tometer led to the observation of clear magnetic peaks allowing an unambigu-ous determination of magnetic propagation vectors, as well as complete magneticstructures in both studied compounds. The observed magnetic peaks in CePd2Al2are described by an incommensurate propagation vector ~k = (0.06, 0.54, 0), while
two commensurate magnetic propagation vectors, ~k1 = (12, 12, 0) and ~k2 = (0, 1
2, 0)
- together with -~k2 (~k2 6= -~k2) - are necessary to describe the magnetic structure ofCePd2Ga2. The positions of magnetic reflections are marked in Figures 4.45 and4.46, respectively. Here, we should compare the found ~k2 = (0, 1
2, 0) propagation
vector describing the strongest magnetic reflection in CePd2Ga2 with the vectorssuggested by our former measurement (only one magnetic peak observed) [113].
Propagation vector ~k2 in orthorhombic structure corresponds well to (14, 14, 0) vec-
tor in triclinic description as suggested by our former study [113]. Both diffractionstudies are thus fully consistent.
The determined magnetic propagation vectors and known structure param-eters allow to calculate the possible magnetic structures by performing a thor-ough representation analysis employing the programs BasIreps [11] and MaxMagn[117]. The analysis revealed that the maximal magnetic subgroups of Cmma
(space group 67) described by propagation vector ~k1 are only two: monoclin-ic Pa2 (3) and triclinic PS1 (2). The magnetic moments in former subgroupare arranged within the basal plane for Ce on monoclinic crystallographic sites(0, 1
8, zCe), whereas moments on sites (0, 3
8, −zCe) point along the orthorhombic
91
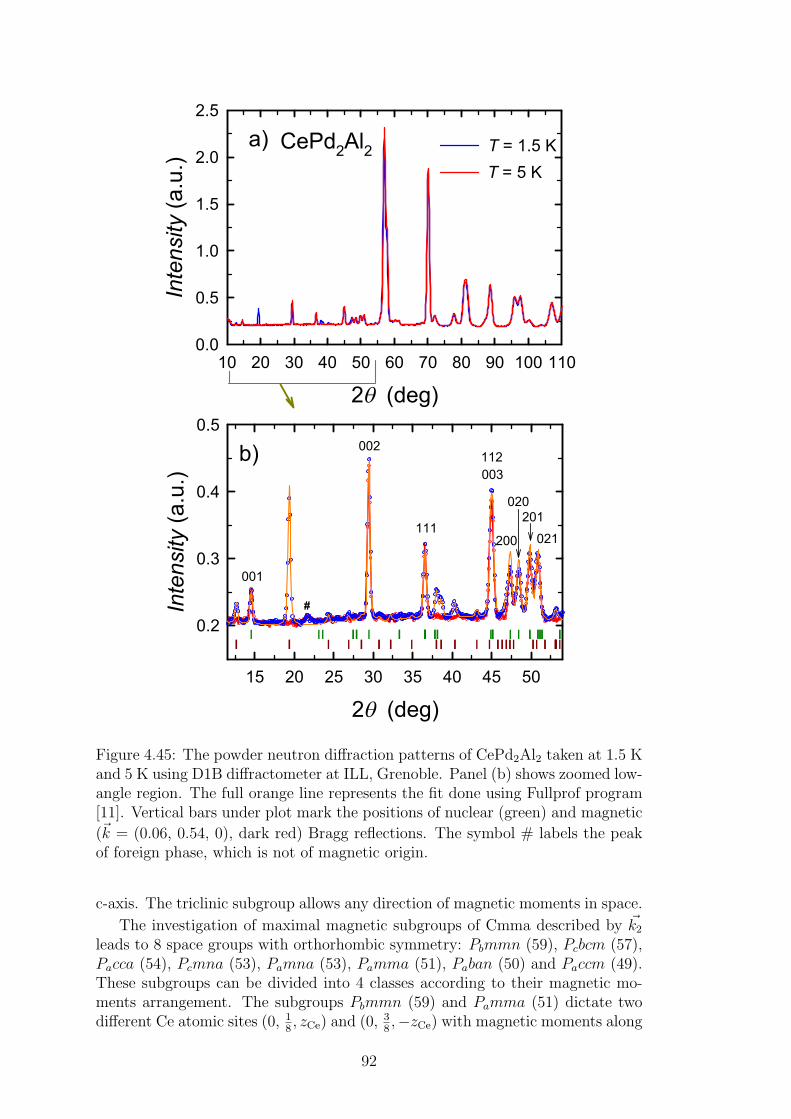
Figure 4.45: The powder neutron diffraction patterns of CePd2Al2 taken at 1.5 Kand 5 K using D1B diffractometer at ILL, Grenoble. Panel (b) shows zoomed low-angle region. The full orange line represents the fit done using Fullprof program[11]. Vertical bars under plot mark the positions of nuclear (green) and magnetic
(~k = (0.06, 0.54, 0), dark red) Bragg reflections. The symbol # labels the peakof foreign phase, which is not of magnetic origin.
c-axis. The triclinic subgroup allows any direction of magnetic moments in space.
The investigation of maximal magnetic subgroups of Cmma described by ~k2leads to 8 space groups with orthorhombic symmetry: Pbmmn (59), Pcbcm (57),Pacca (54), Pcmna (53), Pamna (53), Pamma (51), Paban (50) and Paccm (49).These subgroups can be divided into 4 classes according to their magnetic mo-ments arrangement. The subgroups Pbmmn (59) and Pamma (51) dictate twodifferent Ce atomic sites (0, 1
8, zCe) and (0, 3
8,−zCe) with magnetic moments along
92
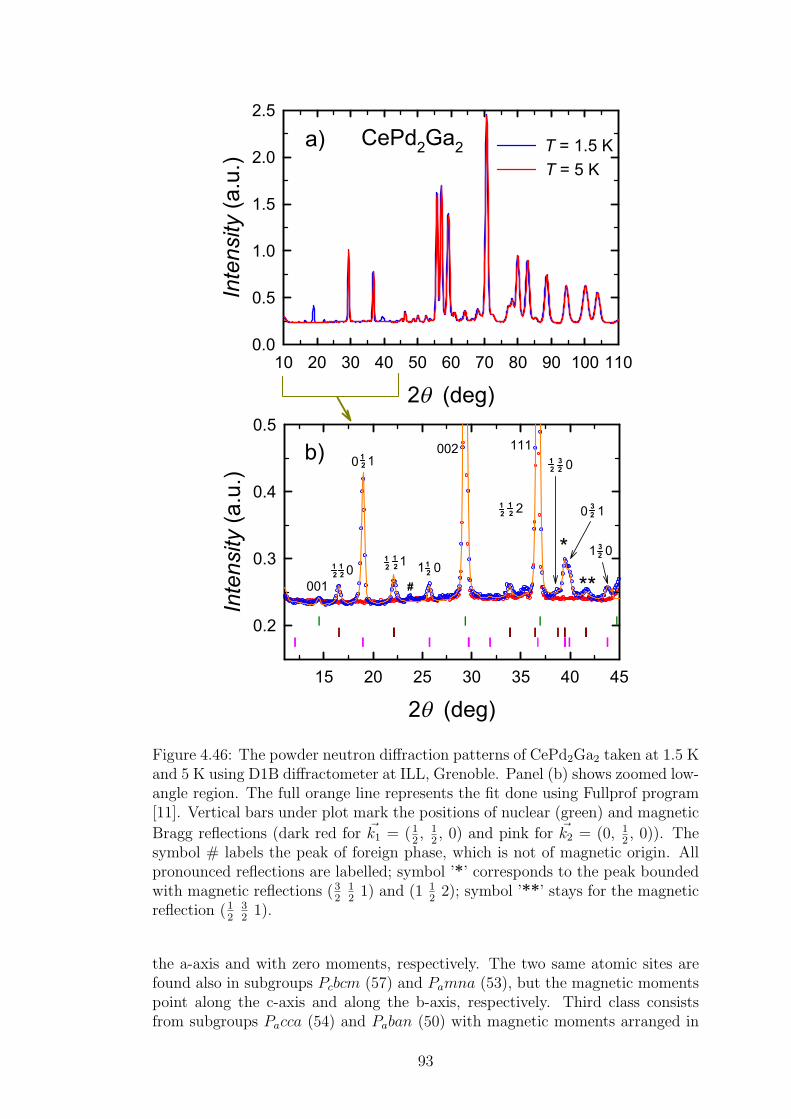
Figure 4.46: The powder neutron diffraction patterns of CePd2Ga2 taken at 1.5 Kand 5 K using D1B diffractometer at ILL, Grenoble. Panel (b) shows zoomed low-angle region. The full orange line represents the fit done using Fullprof program[11]. Vertical bars under plot mark the positions of nuclear (green) and magnetic
Bragg reflections (dark red for ~k1 = (12, 1
2, 0) and pink for ~k2 = (0, 1
2, 0)). The
symbol # labels the peak of foreign phase, which is not of magnetic origin. Allpronounced reflections are labelled; symbol ’*’ corresponds to the peak boundedwith magnetic reflections (3
2121) and (1 1
22); symbol ’**’ stays for the magnetic
reflection (12
321).
the a-axis and with zero moments, respectively. The two same atomic sites arefound also in subgroups Pcbcm (57) and Pamna (53), but the magnetic momentspoint along the c-axis and along the b-axis, respectively. Third class consistsfrom subgroups Pacca (54) and Paban (50) with magnetic moments arranged in
93
the bc-plane. The subgroups Pcmna (53) and Paccm (49) then allow the magneticmoments aligned along the a-axis.
We utilized the calculated magnetic structures in the fitting process of mea-sured diffraction patterns leading to a determination of magnetic structures inboth CePd2Al2 (for the fit, we used maximal magnetic subgroups obtained for~k2 = (0, 1
2, 0)) and CePd2Ga2, although the number of observed magnetic peaks
leaves a certain freedom in the absolute magnetic moments direction.The magnetic moments in CePd2Al2 are described by a propagation vector
~k = (0.06, 0.54, 0) and form an incommensurate amplitude modulated magnet-ic structure. The maximum magnetic moment size approaches 2.05(4) µB/Ce
3+,still slightly lower value than the magnetic moment of Ce3+ free ion. The magnet-ic moments are aligned along one direction which is close to orthorhombic a-axis.The agreement factor Rm = 19.0% for pure a-axis direction of magnetic mo-ments (maximal magnetic subgroups Pcmna (53) and Paccm (49)) is improved(Rm = 13.9%) considering 4o and 24o tilt towards b- and c-axis, respectively.Such a tilt out of [100] is not forbidden by symmetry as the magnetic structure
of CePd2Al2 is described by ~k = (0.06, 0.54, 0). The fit of determined magneticstructure to the measured data is presented in Figure 4.45.
The magnetic moments belonging to each (of two) component in CePd2Ga2are aligned along one direction and order antiferromagneticaly within planesstacked along c-axis. The moments direction is close to the orthorhombic a-axis for both components, similarly as in CePd2Al2. Pure a-axis direction ofmagnetic moments leads to the agreement factors Rm1 = 16.3% and Rm2 = 7.4%for components of magnetic moment described by ~k1 and ~k2, respectively. Thebest agreement was obtained for magnetic moments direction 4o and 14o awayfrom the a-axis to the b- and c-axis directions, respectively (Rm1 = 13.0% andRm2 = 6.5%). Such a magnetic structure supposses the identical direction ofmagnetic moments for both components. Allowing a slightly different momentdirection for each of the two magnetic moment components leads to a negligibleimprovement of the fit.
The value of magnetic moment for component described by propagation vector~k1 is 0.8 µB/Ce
3+. The maximum value of magnetic moment for second compo-
nent (~k2 propagation vector) is then 1.5 µB/Ce3+. While the first component is
fully determined (~k1 ≡ -~k1), the magnetic phase of second component remains
ambiguous (~k2 ∈ 1BZ). Here, we need to mention a significant limitation of neu-
tron scattering for determination of magnetic structures. In the case of multi-~kmagnetic structure, it is not possible to determine the magnetic moments config-uration unambiguously, unless a strong magneto-elastic coupling is present. Thephase between the different Fourier components of magnetic moments cannot bedetermined by diffraction methods. There exist infinitely many structures able toexplain the measured diffraction patterns and diffraction alone is unable to pro-vide a unique solution. Symmetry constrains and, more importantly, restrictionson the amplitude of the magnetic moments can reduce the number of solutions.[118] The magnetic structure of CePd2Ga2 described by two commensurate prop-agation vectors thus cannot be determined unambiguously. The maximal valueof total magnetic moment on Ce atom, which is the sum of the two components,is restricted by magnetic moment value of Ce3+ free ion (2.14 µB). Such a lim-itation plays an important role in a choice of the magnetic phase of the second
94
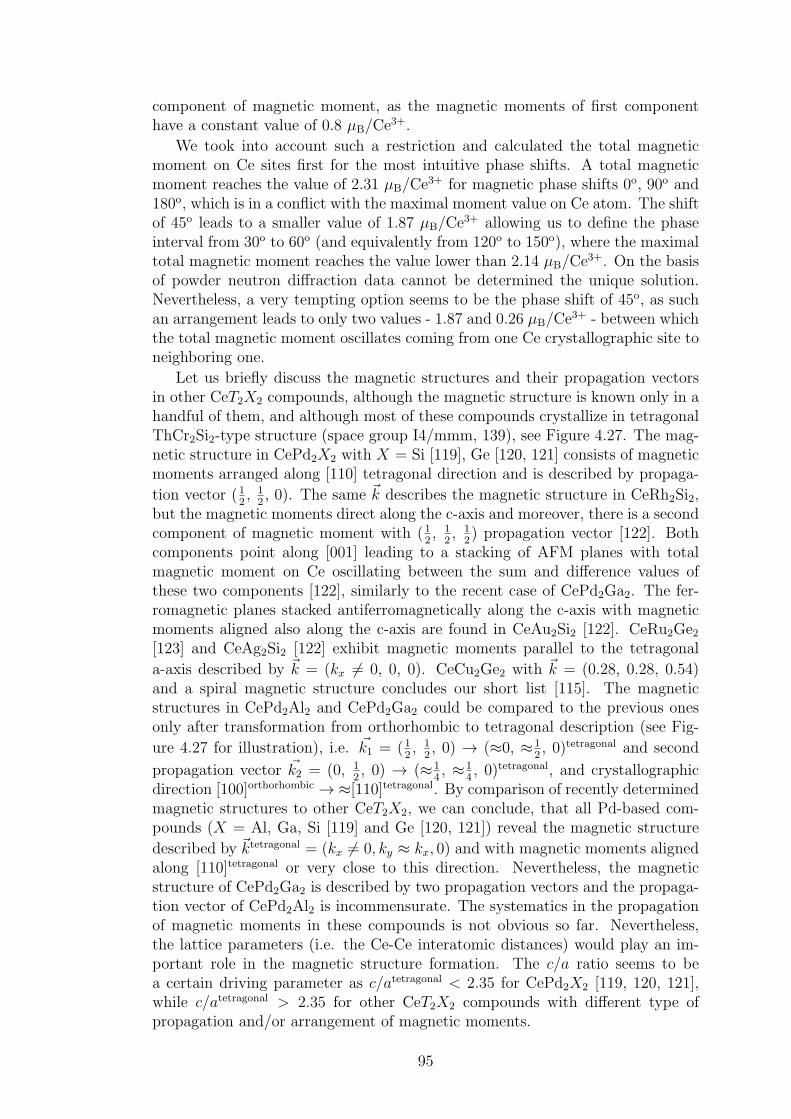
component of magnetic moment, as the magnetic moments of first componenthave a constant value of 0.8 µB/Ce
3+.
We took into account such a restriction and calculated the total magneticmoment on Ce sites first for the most intuitive phase shifts. A total magneticmoment reaches the value of 2.31 µB/Ce
3+ for magnetic phase shifts 0o, 90o and180o, which is in a conflict with the maximal moment value on Ce atom. The shiftof 45o leads to a smaller value of 1.87 µB/Ce
3+ allowing us to define the phaseinterval from 30o to 60o (and equivalently from 120o to 150o), where the maximaltotal magnetic moment reaches the value lower than 2.14 µB/Ce
3+. On the basisof powder neutron diffraction data cannot be determined the unique solution.Nevertheless, a very tempting option seems to be the phase shift of 45o, as suchan arrangement leads to only two values - 1.87 and 0.26 µB/Ce
3+ - between whichthe total magnetic moment oscillates coming from one Ce crystallographic site toneighboring one.
Let us briefly discuss the magnetic structures and their propagation vectorsin other CeT2X2 compounds, although the magnetic structure is known only in ahandful of them, and although most of these compounds crystallize in tetragonalThCr2Si2-type structure (space group I4/mmm, 139), see Figure 4.27. The mag-netic structure in CePd2X2 with X = Si [119], Ge [120, 121] consists of magneticmoments arranged along [110] tetragonal direction and is described by propaga-
tion vector (12, 1
2, 0). The same ~k describes the magnetic structure in CeRh2Si2,
but the magnetic moments direct along the c-axis and moreover, there is a secondcomponent of magnetic moment with (1
2, 1
2, 1
2) propagation vector [122]. Both
components point along [001] leading to a stacking of AFM planes with totalmagnetic moment on Ce oscillating between the sum and difference values ofthese two components [122], similarly to the recent case of CePd2Ga2. The fer-romagnetic planes stacked antiferromagnetically along the c-axis with magneticmoments aligned also along the c-axis are found in CeAu2Si2 [122]. CeRu2Ge2[123] and CeAg2Si2 [122] exhibit magnetic moments parallel to the tetragonal
a-axis described by ~k = (kx 6= 0, 0, 0). CeCu2Ge2 with ~k = (0.28, 0.28, 0.54)and a spiral magnetic structure concludes our short list [115]. The magneticstructures in CePd2Al2 and CePd2Ga2 could be compared to the previous onesonly after transformation from orthorhombic to tetragonal description (see Fig-
ure 4.27 for illustration), i.e. ~k1 = (12, 1
2, 0) → (≈0, ≈1
2, 0)tetragonal and second
propagation vector ~k2 = (0, 12, 0) → (≈1
4, ≈1
4, 0)tetragonal, and crystallographic
direction [100]orthorhombic → ≈[110]tetragonal. By comparison of recently determinedmagnetic structures to other CeT2X2, we can conclude, that all Pd-based com-pounds (X = Al, Ga, Si [119] and Ge [120, 121]) reveal the magnetic structure
described by ~ktetragonal = (kx 6= 0, ky ≈ kx, 0) and with magnetic moments alignedalong [110]tetragonal or very close to this direction. Nevertheless, the magneticstructure of CePd2Ga2 is described by two propagation vectors and the propaga-tion vector of CePd2Al2 is incommensurate. The systematics in the propagationof magnetic moments in these compounds is not obvious so far. Nevertheless,the lattice parameters (i.e. the Ce-Ce interatomic distances) would play an im-portant role in the magnetic structure formation. The c/a ratio seems to bea certain driving parameter as c/atetragonal < 2.35 for CePd2X2 [119, 120, 121],while c/atetragonal > 2.35 for other CeT2X2 compounds with different type ofpropagation and/or arrangement of magnetic moments.
95

4.2.4 Vibron states in (Ce,La)Pd2(Al,Ga)2
Vibron state in CePd2Al2
To study magnetic excitations in CePd2Al2, inelastic neutron scattering exper-iments on IN6 (low-energy region) and IN4 (high energy region) spectrometerswere performed. These experiments revealed three clear magnetic excitationsin the energy spectrum of CePd2Al2 at 1.4 (3.7), 7.8 and 16 meV for tetrago-nal (orthorhombic) structure of CePd2Al2 (Figure 4.47). The magnetic origin ofobserved peaks is proven by comparison to LaPd2Al2 data and by their tempera-ture evolution. The data presented in Figures 4.47b and 4.47d were obtained bysubtracting La analogue data from CePd2Al2 via relation:
SM( ~Q, ω) = SCePd2Al2( ~Q, ω)− α.SLaPd2Al2( ~Q, ω), (4.3)
where α = 0.689 is the ratio of total-scattering cross sections for RPd2Al2 withR = Ce and La, i.e. purely magnetic excitations are shown. The electronicorigin of the peak at around 1.4 meV energy transfer at 20 K in Figure 4.47cis then verified by a comparison to measured 10 K spectrum in Figure 4.47a(where is no peak at low-energy region) as well as by an observation of thesame excitation in the vicinity of an elastic peak on IN4 data (Figure 4.47d).A strong influence of structural phase transition from tetragonal (P4/nmm, 129)to orthorhombic (Cmma, 67) structure, see Figure 4.27 for illustration, on energyschema of CePd2Al2 is also demonstrated. The first CF excitation at 1.4 meVis observed in spectra measured at 20 K, where CePd2Al2 adopts tetragonalstructure (TCePd2Al2
struc = 13 K), while for T = 10 K spectrum the first peak appearsat 3.7 meV. The other two excitations at around 7.8 and 16 meV are almostuntouched by the structural transition. The measurement at 12 K (not shown),i.e. in the vicinity of TCePd2Al2
struc , demonstrates the intermediate stage of first CFexcitation development, as the CF peak is observed at around 3.4 meV.
The energy excitations observed directly by INS measurements are clearlyreflected in the specific heat data. The magnetic part of specific heat in the para-magnetic region well above the magnetic phase transition temperature is generallydescribed by Schottky formula (see equation 2.7) and the crystal field splittingof the multiplet ground state. According to the Kramer’s theorem the groundstate multiplet of the Ce3+ ions (J = 5
2) splits into maximum three doublets (into
doublet and quartet in the case of cubic CF symmetry as discussed e.g. for CeAl2[37, 1]) leading to the maximum two inelastic transitions from the ground stateto first and second excited state. The measured magnetic contribution to specificheat is compared with the Schottky contribution calculated using the energies ofCF levels as obtained by INS for compound adopting tetragonal (T > 13 K) andorthorhombic (T < 13 K) structure, see Figure 4.48a. The calculation clearlyfails to describe the experimental data when only three double-degenerated lev-els with energies 0, 7.8 and 16 meV or 0, 1.4 (3.7) and 7.8 meV are taken intoaccount, even considering somewhat enhanced error of the determined magneticspecific heat. The calculation with CF levels at energies 0, 1.4 and 16 meV leadsto a very good agreement with the measured data, see also section 4.2.1. Far bestagreement is then obtained assuming another energy level at 7.8 meV, see Figure4.48a. The degeneracy of individual levels might be a matter of debate. A verygood agreement is obtained taking double degeneracy of ground state level and
96
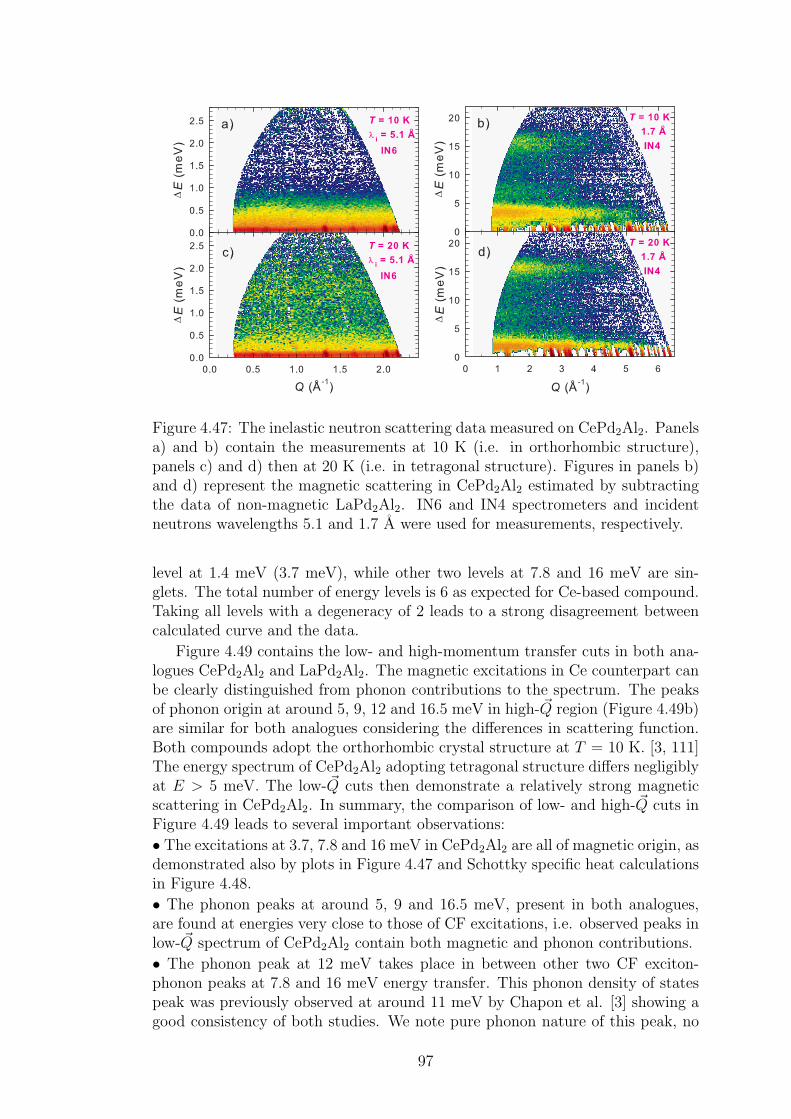
Figure 4.47: The inelastic neutron scattering data measured on CePd2Al2. Panelsa) and b) contain the measurements at 10 K (i.e. in orthorhombic structure),panels c) and d) then at 20 K (i.e. in tetragonal structure). Figures in panels b)and d) represent the magnetic scattering in CePd2Al2 estimated by subtractingthe data of non-magnetic LaPd2Al2. IN6 and IN4 spectrometers and incidentneutrons wavelengths 5.1 and 1.7 A were used for measurements, respectively.
level at 1.4 meV (3.7 meV), while other two levels at 7.8 and 16 meV are sin-glets. The total number of energy levels is 6 as expected for Ce-based compound.Taking all levels with a degeneracy of 2 leads to a strong disagreement betweencalculated curve and the data.
Figure 4.49 contains the low- and high-momentum transfer cuts in both ana-logues CePd2Al2 and LaPd2Al2. The magnetic excitations in Ce counterpart canbe clearly distinguished from phonon contributions to the spectrum. The peaksof phonon origin at around 5, 9, 12 and 16.5 meV in high- ~Q region (Figure 4.49b)are similar for both analogues considering the differences in scattering function.Both compounds adopt the orthorhombic crystal structure at T = 10 K. [3, 111]The energy spectrum of CePd2Al2 adopting tetragonal structure differs negligiblyat E > 5 meV. The low- ~Q cuts then demonstrate a relatively strong magneticscattering in CePd2Al2. In summary, the comparison of low- and high- ~Q cuts inFigure 4.49 leads to several important observations:
• The excitations at 3.7, 7.8 and 16 meV in CePd2Al2 are all of magnetic origin, asdemonstrated also by plots in Figure 4.47 and Schottky specific heat calculationsin Figure 4.48.
• The phonon peaks at around 5, 9 and 16.5 meV, present in both analogues,are found at energies very close to those of CF excitations, i.e. observed peaks inlow- ~Q spectrum of CePd2Al2 contain both magnetic and phonon contributions.
• The phonon peak at 12 meV takes place in between other two CF exciton-phonon peaks at 7.8 and 16 meV energy transfer. This phonon density of statespeak was previously observed at around 11 meV by Chapon et al. [3] showing agood consistency of both studies. We note pure phonon nature of this peak, no
97
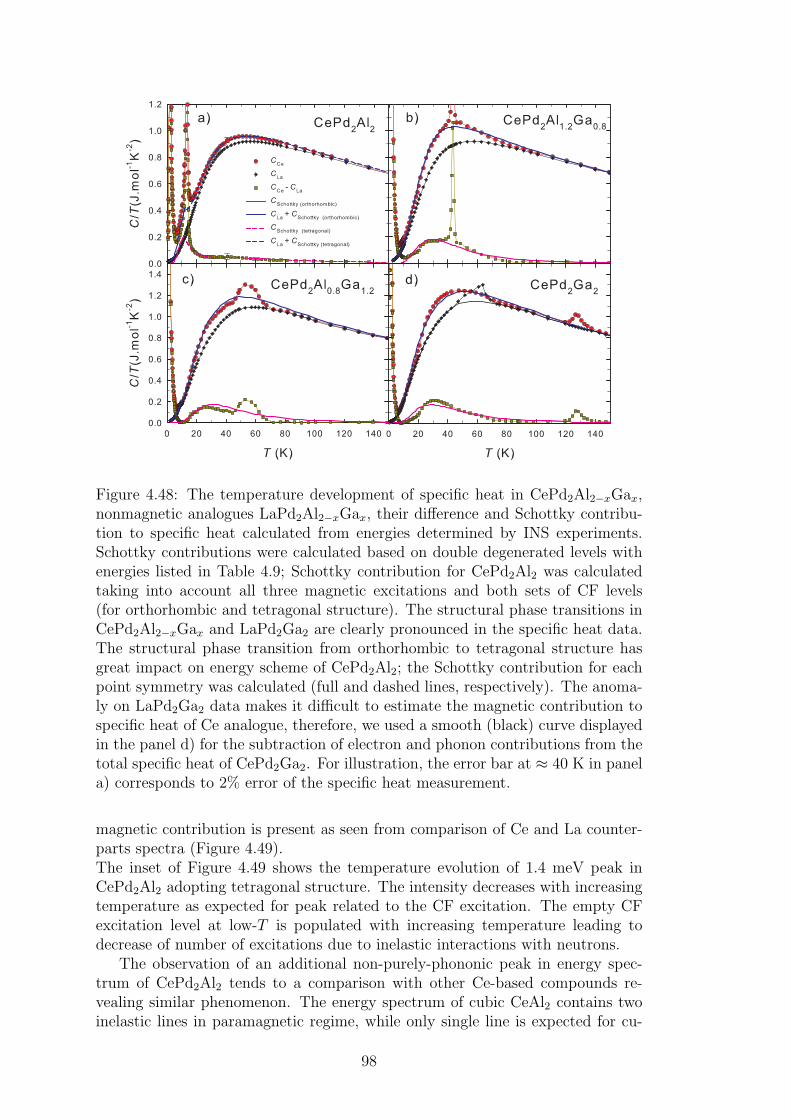
Figure 4.48: The temperature development of specific heat in CePd2Al2−xGax,nonmagnetic analogues LaPd2Al2−xGax, their difference and Schottky contribu-tion to specific heat calculated from energies determined by INS experiments.Schottky contributions were calculated based on double degenerated levels withenergies listed in Table 4.9; Schottky contribution for CePd2Al2 was calculatedtaking into account all three magnetic excitations and both sets of CF levels(for orthorhombic and tetragonal structure). The structural phase transitions inCePd2Al2−xGax and LaPd2Ga2 are clearly pronounced in the specific heat data.The structural phase transition from orthorhombic to tetragonal structure hasgreat impact on energy scheme of CePd2Al2; the Schottky contribution for eachpoint symmetry was calculated (full and dashed lines, respectively). The anoma-ly on LaPd2Ga2 data makes it difficult to estimate the magnetic contribution tospecific heat of Ce analogue, therefore, we used a smooth (black) curve displayedin the panel d) for the subtraction of electron and phonon contributions from thetotal specific heat of CePd2Ga2. For illustration, the error bar at ≈ 40 K in panela) corresponds to 2% error of the specific heat measurement.
magnetic contribution is present as seen from comparison of Ce and La counter-parts spectra (Figure 4.49).The inset of Figure 4.49 shows the temperature evolution of 1.4 meV peak inCePd2Al2 adopting tetragonal structure. The intensity decreases with increasingtemperature as expected for peak related to the CF excitation. The empty CFexcitation level at low-T is populated with increasing temperature leading todecrease of number of excitations due to inelastic interactions with neutrons.
The observation of an additional non-purely-phononic peak in energy spec-trum of CePd2Al2 tends to a comparison with other Ce-based compounds re-vealing similar phenomenon. The energy spectrum of cubic CeAl2 contains twoinelastic lines in paramagnetic regime, while only single line is expected for cu-
98
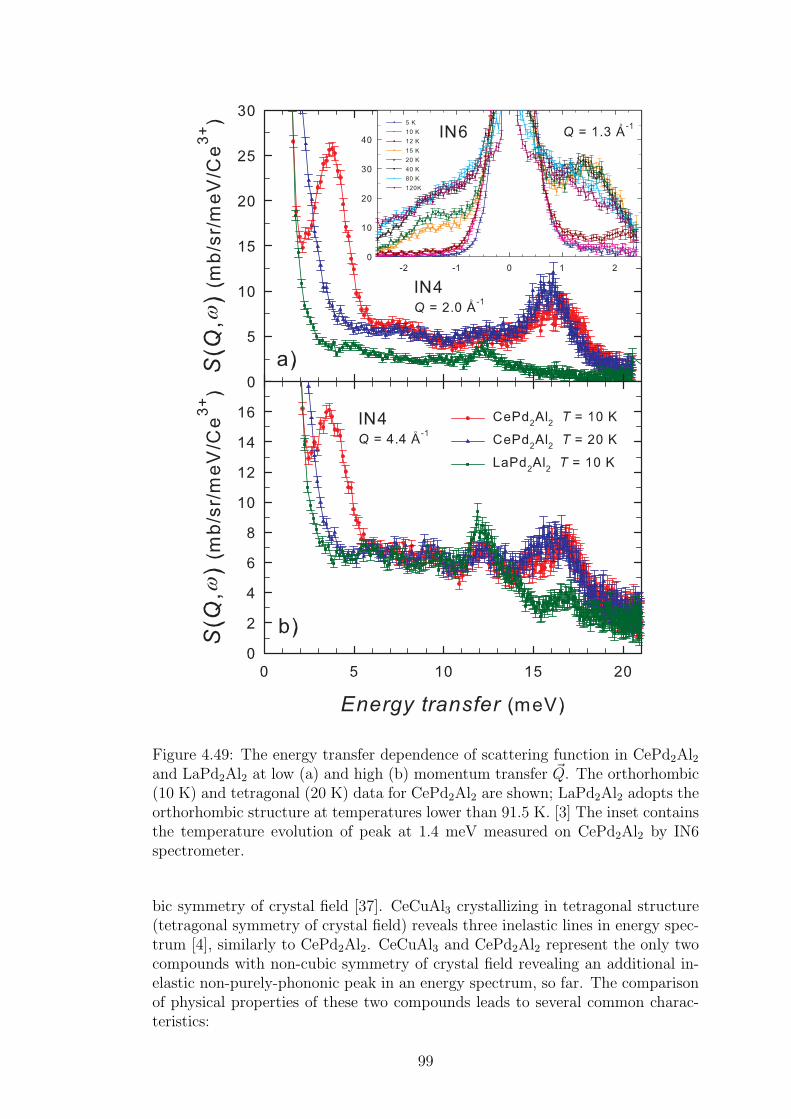
Figure 4.49: The energy transfer dependence of scattering function in CePd2Al2and LaPd2Al2 at low (a) and high (b) momentum transfer ~Q. The orthorhombic(10 K) and tetragonal (20 K) data for CePd2Al2 are shown; LaPd2Al2 adopts theorthorhombic structure at temperatures lower than 91.5 K. [3] The inset containsthe temperature evolution of peak at 1.4 meV measured on CePd2Al2 by IN6spectrometer.
bic symmetry of crystal field [37]. CeCuAl3 crystallizing in tetragonal structure(tetragonal symmetry of crystal field) reveals three inelastic lines in energy spec-trum [4], similarly to CePd2Al2. CeCuAl3 and CePd2Al2 represent the only twocompounds with non-cubic symmetry of crystal field revealing an additional in-elastic non-purely-phononic peak in an energy spectrum, so far. The comparisonof physical properties of these two compounds leads to several common charac-teristics:
99
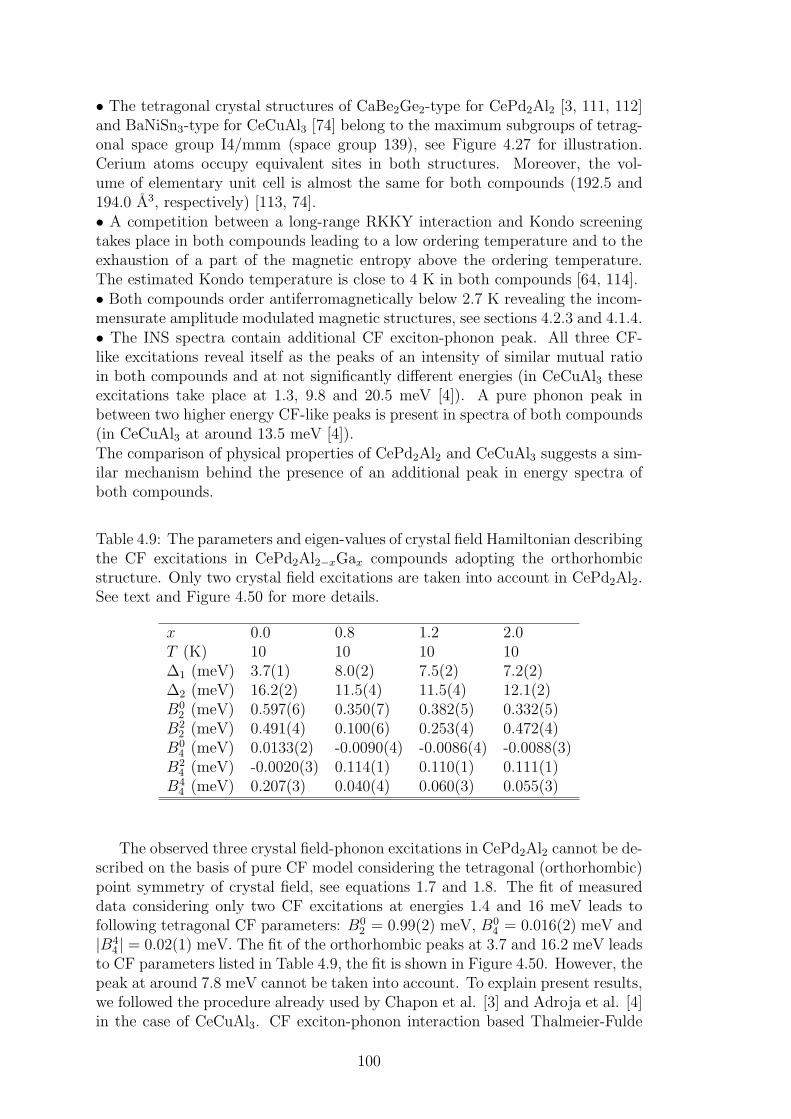
• The tetragonal crystal structures of CaBe2Ge2-type for CePd2Al2 [3, 111, 112]and BaNiSn3-type for CeCuAl3 [74] belong to the maximum subgroups of tetrag-onal space group I4/mmm (space group 139), see Figure 4.27 for illustration.Cerium atoms occupy equivalent sites in both structures. Moreover, the vol-ume of elementary unit cell is almost the same for both compounds (192.5 and194.0 A3, respectively) [113, 74].• A competition between a long-range RKKY interaction and Kondo screeningtakes place in both compounds leading to a low ordering temperature and to theexhaustion of a part of the magnetic entropy above the ordering temperature.The estimated Kondo temperature is close to 4 K in both compounds [64, 114].• Both compounds order antiferromagnetically below 2.7 K revealing the incom-mensurate amplitude modulated magnetic structures, see sections 4.2.3 and 4.1.4.• The INS spectra contain additional CF exciton-phonon peak. All three CF-like excitations reveal itself as the peaks of an intensity of similar mutual ratioin both compounds and at not significantly different energies (in CeCuAl3 theseexcitations take place at 1.3, 9.8 and 20.5 meV [4]). A pure phonon peak inbetween two higher energy CF-like peaks is present in spectra of both compounds(in CeCuAl3 at around 13.5 meV [4]).The comparison of physical properties of CePd2Al2 and CeCuAl3 suggests a sim-ilar mechanism behind the presence of an additional peak in energy spectra ofboth compounds.
Table 4.9: The parameters and eigen-values of crystal field Hamiltonian describingthe CF excitations in CePd2Al2−xGax compounds adopting the orthorhombicstructure. Only two crystal field excitations are taken into account in CePd2Al2.See text and Figure 4.50 for more details.
x 0.0 0.8 1.2 2.0T (K) 10 10 10 10∆1 (meV) 3.7(1) 8.0(2) 7.5(2) 7.2(2)∆2 (meV) 16.2(2) 11.5(4) 11.5(4) 12.1(2)B0
2 (meV) 0.597(6) 0.350(7) 0.382(5) 0.332(5)B2
2 (meV) 0.491(4) 0.100(6) 0.253(4) 0.472(4)B0
4 (meV) 0.0133(2) -0.0090(4) -0.0086(4) -0.0088(3)B2
4 (meV) -0.0020(3) 0.114(1) 0.110(1) 0.111(1)B4
4 (meV) 0.207(3) 0.040(4) 0.060(3) 0.055(3)
The observed three crystal field-phonon excitations in CePd2Al2 cannot be de-scribed on the basis of pure CF model considering the tetragonal (orthorhombic)point symmetry of crystal field, see equations 1.7 and 1.8. The fit of measureddata considering only two CF excitations at energies 1.4 and 16 meV leads tofollowing tetragonal CF parameters: B0
2 = 0.99(2) meV, B04 = 0.016(2) meV and
|B44 | = 0.02(1) meV. The fit of the orthorhombic peaks at 3.7 and 16.2 meV leads
to CF parameters listed in Table 4.9, the fit is shown in Figure 4.50. However, thepeak at around 7.8 meV cannot be taken into account. To explain present results,we followed the procedure already used by Chapon et al. [3] and Adroja et al. [4]in the case of CeCuAl3. CF exciton-phonon interaction based Thalmeier-Fulde
100
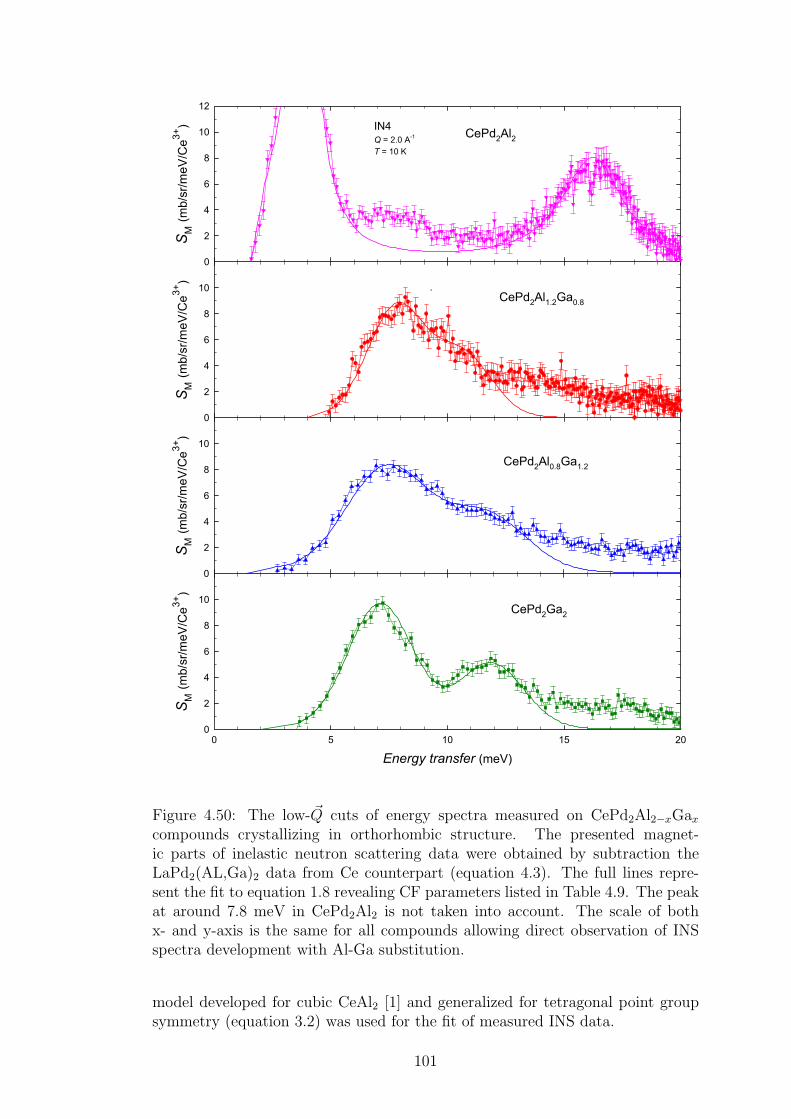
!
"
Figure 4.50: The low- ~Q cuts of energy spectra measured on CePd2Al2−xGaxcompounds crystallizing in orthorhombic structure. The presented magnet-ic parts of inelastic neutron scattering data were obtained by subtraction theLaPd2(AL,Ga)2 data from Ce counterpart (equation 4.3). The full lines repre-sent the fit to equation 1.8 revealing CF parameters listed in Table 4.9. The peakat around 7.8 meV in CePd2Al2 is not taken into account. The scale of bothx- and y-axis is the same for all compounds allowing direct observation of INSspectra development with Al-Ga substitution.
model developed for cubic CeAl2 [1] and generalized for tetragonal point groupsymmetry (equation 3.2) was used for the fit of measured INS data.
101
In analogy with the data analysis of previously investigated tetragonal CeCuAl3[4], we estimated the CF parameters taking into account only two CF excitations:the low-energy one at 1.4 meV and a high-energy hypothetical one close to thehigh phonon density of states near 12 meV. Here, we took into account the calcu-lation of Schottky specific heat, where the best agreement between the data andcalculations was obtained for levels at 7.8 and 16 meV with the single degener-acy. We fixed the CF parameters (in meV: B0
2 = 0.7, B04 = 0.019, |B4
4 | = 0.02)and phonon energy hω0 = 12 meV and started to vary the magneto-elastic pa-rameter g0 in small steps of 0.05 meV in the interval 〈0.05, 2.00〉 meV. Wheng0 ∈ (0.55, 0.8), the peak at around 12 meV was splitted into two peaks with thesecond peak shifted to higher energy. The low-energy peak (1.4 meV) was shiftedto higher energy only slightly. We varied in turns the phonon energy hω0 as wellas the CF parameters to gradually improve the agreement between INS data andcalculated curve. The final fit of the data is presented in Figure 4.51 and refinedparameters are: B0
2 = 0.85(2) meV, B04 = 0.023(2) meV, |B4
4 | = 0.02(1) meV,hω0 = 9.5(5) meV and g0 = 0.35(3) meV. The value of |B4
4 | was determined witha quite high uncertainty as the excitation energies depend on it less significantlythan on other two parameters. Here, we should mention the presence of the peakat -1.4 meV in Figure 4.51b. This peak is the consequence of the principle ofdetailed balance and clearly documents that the excitation annihilation has low-er probability than excitation creation in the material, which is mirroring in themutual intensity of peaks at -1.4 and 1.4 meV.
The whole fitting process was done also taking the starting excitation energies7.8 and 12 meV supposing that the hypothetical excitation at 12 meV was splittedinto excitations at 1.4 and 16 meV under the influence of phonons. We note, thatsuch a scenario is not in agreement with the specific heat analysis, where thebest conformity of data and Schottky specific heat calculation was obtained fordouble degenerated level at 1.4 meV and singlets at 7.8 and 16 meV. Indeed,we were not able to reproduce the data in calculated spectrum: the starting CFparameters (in meV: B0
2 = 0.3, B04 = 0.03, |B4
4 | = 0.03) and hω0 = 12 meV werefixed, while the parameter g0 was varied by 0.05 meV like in the previous case.Around g0 = 0.45 meV, the peak at around 12 meV started to split into twopeaks, whereas the lower energy peak was shifted to lower energy without anysign of splitting. Both processes the shift and splitting continued with increasingg0 leading to relatively good description of peaks at 1.4 and 16 meV. However,the peak at 7.8 meV was not fitted at all, instead the peak at 12 meV remainedalmost untouched by variation of g0. In conclusion, the fitting process proved theformer scenario, which is also in agreement with specific heat analysis, i.e. theCF exciton-phonon interaction leads to the splitting of hypothetical energy levelat 12 meV into two levels at around 7.8 and 16 meV.
We investigated also the energy spectrum of orthorhombic CePd2Al2. The di-rect analysis was not possible as we used the model based on the Thalmeier-Fuldemodel generalized for the tetragonal symmetry of crystal field (not orthorhombicsymmetry). We tried to fit the energy spectrum of orthorhombic compound withtetragonal CF parameters. First, we fitted only the peaks at 3.7 and 16 meVobtaining the values: B0
2 = 0.8 meV, B04 = 0.028 meV and |B4
4 | = 0.03 meV.Afterwards, we undertake the whole fitting process starting with energy levelsat 3.7 and 12 meV. The refined parameters describing the measured data (see
102
Figure 4.51) were in meV: B02 = 0.77(2), B0
4 = 0.029(2), |B44 | = 0.01(1) meV,
hω0 = 9.0(5) and g0 = 0.3(3). We are fully aware, that we fitted actually theorthorhombic structure INS data with tetragonal CF parameters, nevertheless,such a fit could serve as the first estimation of magneto-elastic parameter g0 inthe compound. The generalization of Thalmeier-Fulde model to describe also theorthorhombic symmetry of crystal field is essential for the correct treatment ofthe data.
Crystal field excitations in CePd2Ga2 and Al-Ga substitutions
To follow the evolution of the crystal field excitations (and a possible presence ofan additional magnetic excitation) in the CePd2(Al,Ga)2 system, inelastic neu-tron scattering experiments on IN6 and IN4 spectrometers were performed also forseveral compounds with different Ga content. The measurements in paramagnet-ic state on IN6 instrument did not reveal any excitation in the low-energy regionfor any of Al-Ga substituted compounds. The measurements were done at sev-eral temperatures for both tetragonal and orthorhombic crystal structures. Theinelastic spectra measured employing IN4 spectrometer at low-temperature (or-thorhombic) structure exhibit two broad peaks in the energy interval 5 - 15 meVfor all Al-Ga substitutions, see Figure 4.50. CePd2Ga2 reveals two clear CFpeaks around 7.2 and 12.1 meV, while the Al-Ga substituted compounds exhibitat least two peaks very close in energy. The vicinity of CF peaks at around 8 and11.5 meV in CePd2Al1.2Ga0.8 resembles the case of CeCu2Ge2, [115] where onlyone quasi-quartet in excitation spectrum was speculated about [115]. Neverthe-less, later study [116] showed two doublets close in energy. A possible presenceof third CF-phonon excitation in both Al-Ga substituted compounds cannot beexcluded on the basis of powder data, especially then in CePd2Al1.2Ga0.8. In con-trast with CePd2Al2, where the three CF-like peaks are well separated (see Figure4.51), the vicinity of peaks in substituted compounds do not allow to properlyinvestigate a prospective presence of an additional excitation.
Here, we should mention the differences in the inelastic neutron scatteringspectra for CePd2(Al,Ga)2 compounds adopting orthorhombic and tetragonalstructure. The change in energy scheme is not clearly demonstrated, exceptCePd2Al2, as shown above. There are two factors complicating the investiga-tion of energy scheme in CePd2(Al,Ga)2 adopting tetragonal structure: (i) thebroadness and mutual vicinity of peaks in energy spectra and (ii) the struc-tural transition temperatures for compounds with higher Ga content are quitehigh [113], i.e. the low-lying energy levels are fully populated at temperaturesat which the compounds adopt the tetragonal structure. A reasonable fit oftetragonal CF parameters can be done only for CePd2Al1.2Ga0.8 leading to val-ues: B0
2 = 0.240(5) meV, B04 = 0.030(1) meV and |B4
4 | = 0.029(2) meV, whilethe excitation energies are 7.8 and 10.9 meV (not much different from energiesfor orthorhombic structure). The CF parameters of all compounds adopting theorthorhombic structure are listed in Table 4.9 and corresponding fits are shownas full lines in Figure 4.50. The CF parameters in CePd2Al2 differ significantlyfrom those of Al-Ga substituted compounds; only a negligible difference is thenobserved within CePd2(Al,Ga)2 (see Table 4.9) as anticipated from not too muchdifferent energy spectra in Figure 4.50.
The measurement of specific heat documents the energy scheme in stud-
103
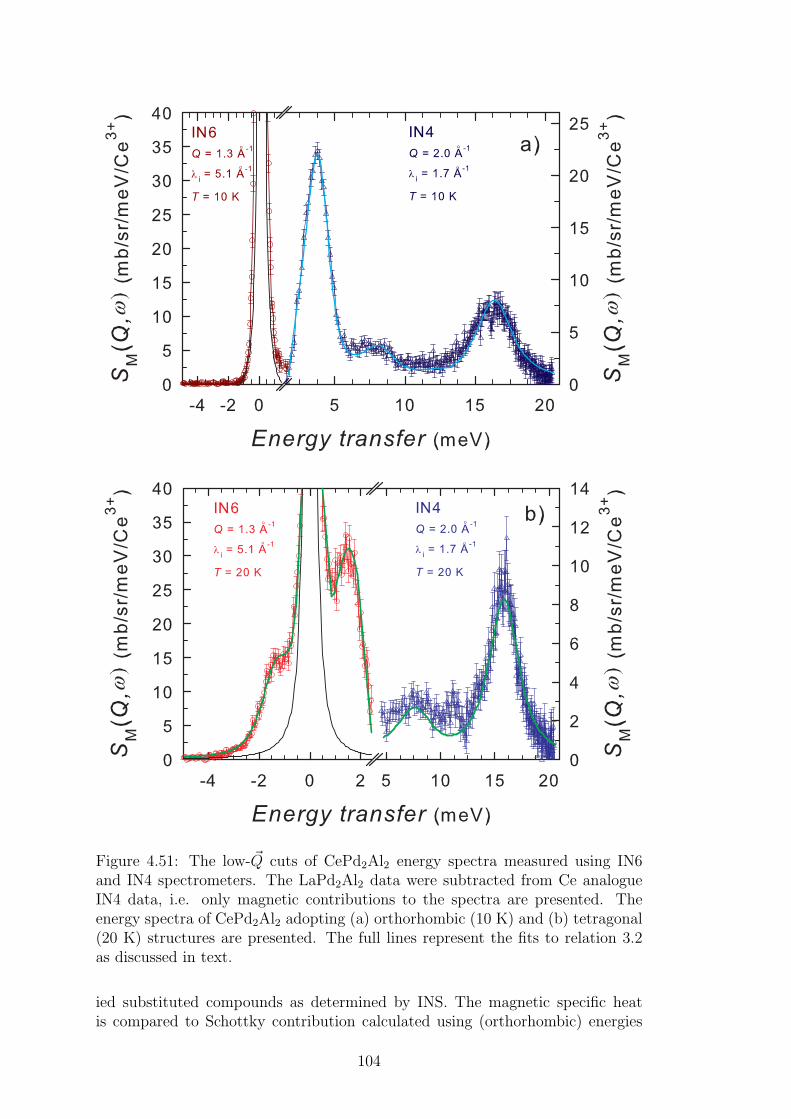
Figure 4.51: The low- ~Q cuts of CePd2Al2 energy spectra measured using IN6and IN4 spectrometers. The LaPd2Al2 data were subtracted from Ce analogueIN4 data, i.e. only magnetic contributions to the spectra are presented. Theenergy spectra of CePd2Al2 adopting (a) orthorhombic (10 K) and (b) tetragonal(20 K) structures are presented. The full lines represent the fits to relation 3.2as discussed in text.
ied substituted compounds as determined by INS. The magnetic specific heatis compared to Schottky contribution calculated using (orthorhombic) energies
104
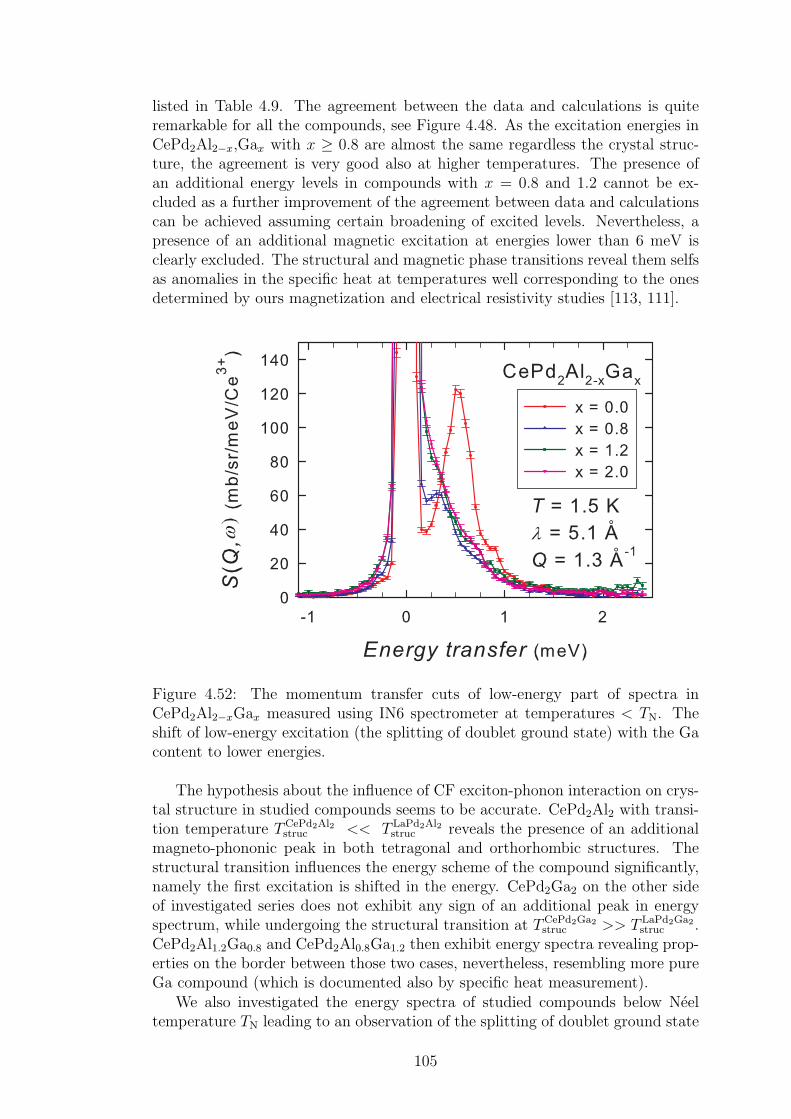
listed in Table 4.9. The agreement between the data and calculations is quiteremarkable for all the compounds, see Figure 4.48. As the excitation energies inCePd2Al2−x,Gax with x ≥ 0.8 are almost the same regardless the crystal struc-ture, the agreement is very good also at higher temperatures. The presence ofan additional energy levels in compounds with x = 0.8 and 1.2 cannot be ex-cluded as a further improvement of the agreement between data and calculationscan be achieved assuming certain broadening of excited levels. Nevertheless, apresence of an additional magnetic excitation at energies lower than 6 meV isclearly excluded. The structural and magnetic phase transitions reveal them selfsas anomalies in the specific heat at temperatures well corresponding to the onesdetermined by ours magnetization and electrical resistivity studies [113, 111].
Figure 4.52: The momentum transfer cuts of low-energy part of spectra inCePd2Al2−xGax measured using IN6 spectrometer at temperatures < TN. Theshift of low-energy excitation (the splitting of doublet ground state) with the Gacontent to lower energies.
The hypothesis about the influence of CF exciton-phonon interaction on crys-tal structure in studied compounds seems to be accurate. CePd2Al2 with transi-tion temperature TCePd2Al2
struc << T LaPd2Al2struc reveals the presence of an additional
magneto-phononic peak in both tetragonal and orthorhombic structures. Thestructural transition influences the energy scheme of the compound significantly,namely the first excitation is shifted in the energy. CePd2Ga2 on the other sideof investigated series does not exhibit any sign of an additional peak in energyspectrum, while undergoing the structural transition at TCePd2Ga2
struc >> T LaPd2Ga2struc .
CePd2Al1.2Ga0.8 and CePd2Al0.8Ga1.2 then exhibit energy spectra revealing prop-erties on the border between those two cases, nevertheless, resembling more pureGa compound (which is documented also by specific heat measurement).
We also investigated the energy spectra of studied compounds below Neeltemperature TN leading to an observation of the splitting of doublet ground state
105

as presented in Figure 4.52. The low-energy peak is clearly visible at around0.5 meV in CePd2Al2 and around 0.3 meV in CePd2Al1.2Ga0.8. For compoundswith higher Ga content, the splitting shifts to lower excitation energies whichmight be related to the change of electronic properties and magnetic structurewith Al-Ga substitution in CePd2(Al,Ga)2 series. Indeed, the bulk studies showrather different magnetic behavior [113] and finally our diffraction experimentsrevealed quite different magnetic structures in parent compounds.
106

Conclusions
We investigated the crystal structures and electronic properties, including mag-netic structures and crystal field and magnetic excitations, in CeCuAl3 andCePd2Al2 compounds and in substituted systems: Ce(Cu,Al)4, Ce(Cu,Au)Al3(not part of the thesis), CeCu(Al,Ga)3 (not part of the thesis), CePd2(Al,Ga)2and their La analogues. The compounds were studied by means of magnetization,specific heat, electrical resistivity, electrical resistivity under hydrostatic pressureand by X-ray, electron and mainly by neutron scattering techniques.
CeCuAl3 was confirmed to crystallize in the ordered non-centrosymmetricBaNiSn3-type of tetragonal structure and undergo the isostructural phase transi-tion at around 300oC. CeCuAl3 orders antiferromagnetically below TN = 2.7(1) Kwithout any further phase transition down to 0.4 K. The amplitude modulatedmagnetic structure in CeCuAl3 is described by propagation vector ~k = (0.4, 0.6, 0).The magnetic moments are arranged within the basal plane along the [110] crys-tallographic direction with a maximum value of 0.28 µB/Ce
3+. The magneticstructure of CeCuAl3 was put into the context of other CeTX3 compounds andthe overall mechanism of the magnetic structure formation was proposed. Theinelastic neutron scattering confirmed the presence of low-energy crystal field ex-citation at around 1.5 meV. The investigation of higher-energy part of spectrumis highly desirable and will be performed in near future.
The crystal field excitations (and possible presence of vibron states) wereinvestigated in Ce(Cu,Al)4 compounds. The refined CF parameters and eigenen-ergies do not differ significantly among the substituted compounds revealing nomagnetic excitation at low-energy part of spectra, in strong contrast with par-ent CeCuAl3. CeCu0.9Al3.1 reveals the macroscopic and microscopic propertiesclose to the ones of parent compound, while CeCu0.75Al3.25 and CeCu1.1Al2.9 differsignificantly.
CePd2Al2 crystallizes in the tetragonal CaBe2Ge2-type structure and under-goes the structural phase transition to orthorhombic structure at 13 K. The anti-ferromagnetic ground state below TN = 2.7 K with the easy magnetization planeperpendicular to the c-axis was observed. The magnetic structure of CePd2Al2is described by an incommensurate propagation vector ~k = (0.06, 0.54, 0). Themagnetic moments on Ce atoms are arranged antiferromagnetically within thebasal plane and point along the direction close to the orthorhombic [100] (orequivalently close to tetragonal basal plane diagonal). The maximum value ofmagnetic moment reaches 2.05 µB/Ce
3+. CePd2Al2 reveals three magnetic ex-citations, while only the two crystal field excitations in energy spectrum areexpected for cerium-based compound. The presence of additional magnetic peakis described within Thalmeier-Fulde CF exciton-phonon model generalized fornon-cubic point symmetry. The additional peak is observed in both tetragonaland orthorhombic structures. The first CF excitation shifts from 1.4 meV fortetragonal structure to 3.7 meV for orthorhombic structure, while the energies ofother two CF-like excitations remain almost unaffected by structural transition.
The vibron state in the rest of the CePd2(Al,Ga)2 series is not observed, nev-ertheless, it cannot be excluded conclusively for CePd2Al1.2Ga0.8. The crystalfield parameters were determined for all studied compounds as well as energies
107
of crystal field excitations. The hypothesis about the influence of CF exciton-phonons interaction on crystal structure in studied compounds seems to be accu-rate. CePd2Al2 with TCePd2Al2
struc << T LaPd2Al2struc reveals the presence of an additional
magneto-phononic peak in both tetragonal and orthorhombic structures. Thestructural transition influences the energy scheme of the compound significant-ly, the first excitation is shifted in the energy. CePd2Ga2 on the other side ofinvestigated series does not exhibit any sign of an additional peak in inelasticspectrum, while undergoing the structural transition at TCePd2Ga2
struc >> T LaPd2Ga2struc .
CePd2Al1.2Ga0.8 and CePd2Al0.8Ga1.2 then exhibit properties on the border be-tween those two cases, nevertheless, the energy spectra resemble more pure Gacompound.
CePd2Ga2 reveals the magnetic structure composed from two components.First of them is described by the propagation vector ~k1 = (1
2, 1
2, 0), while the
second one propagates with ~k2 = (0, 12, 0). The magnetic moments (of both
components) are aligned along the identical direction close to the orthorhombic[100] (or equivalently to tetragonal basal plane diagonal) and the total magneticmoment varies depending on the mutual phase of moments components on eachCe site.
In conclusion, we investigated the physical properties of CeCuAl3 and CePd2Al2compounds in detail including their behaviour under hydrostatic and chemicalpressure. We plan to continue with further studies on these compounds; a greatimportance will be dedicated to the inelastic neutron scattering studies on singlecrystals - the experiment already planned and partly done on CeCuAl3. Alsothe investigation of Ce(Cu,Au)Al3 and CeCu(Al,Ga)3 series by inelastic neutronscattering techniques is desirable and we intend to continue with it in near fu-ture. Another important part of future work will be to find more Ce-based inter-metallics exhibiting a strong magneto-elastic coupling auspiciously leading to thevibron quasi-bound state and investigate them employing the inelastic neutronscattering experiments.
108
Bibliography
[1] Thalmeier, P., Fulde, P., Phys. Rev. Lett. 49, 1588 (1982).
[2] Goremychkin, E.A., Natkaniec, I., Mhle, E., Chistyakov, O.D.,J. Magn.Magn. Mater. 81, 6371 (1989).
[3] Chapon, L.C., Goremychkin, E.A., Osborn, R., Rainford, B.D.,Short, S., Physica B 378380, 819 (2006).
[4] Adroja, D.T., Moral, A. del, Fuente, C. de la, Fraile, A., Goremy-
chkin, E.A., Taylor, J.W., Hillier, A.D., Fernandez-Alonso, F.,Phys. Rev. Lett. 108, 216402 (2012).
[5] Chatterji, T., Neutron Scattering from Magnetic Materials, ElsevierISNB: 978-0-444-51050-1 (2005).
[6] Kondo, J., Prog. Theor. Phys. 32, 37-49 (1964).
[7] Anderson, P.W., Phys. Rev. 124, 41-53 (1961).
[8] Doniach, S., Physica B 91, 231-234 (1977).
[9] Garratt-Reed, A.J., Bell, D.C., Energy-dispersive x-ray analysis in theelectron microscope, Microscopy Handbooks (M. Rainforth, ed.), Oxford,UK (2003).
[10] Agarwal, B.K., X-ray Spectroscopy, Springer-verlag, Berlin (1991).
[11] Rodriguez-Carvajal, J., Physica B 192, 55 (1993).
[12] Ouladdiaf, B., Archer, J., Allibon, J.R., Decarpentrie, P.,Lemee-Cailleau, M.H., Rodriguez-Carvajal, J., Hewat, A.W.,A.W. Hewat, York, S., Brau, D., McIntyre, G.J., J. Appl. Crystall.44, 392-397 (2011).
[13] Tumanski, S., Handbook of Magnetic Measurements, Danver, US (2011),ISBN: 978-1-4398-2951-6.
[14] Schwartz, B.B., Foner, S., Superconductor Applications: SQUIDs andMachines, New York, US (1977).
[15] Soliverez, C.E., IEEE Transactions on Magnetics 17, 1363–4 (1981).
[16] Martin, C.A., J. Phys.: Condens. Matter 3, 5967 (1991).
[17] Hwang, J.S., Lin, K.J., Tien, C., Rev. Sci. Instrum. 68, 94-101 (1997).
[18] Elliot, R.J., Wedgwood, F.A., Proc. Phys. Soc. 81, 864 (1963).
[19] Nozieres, P., J. Low Temp. Phys. 12, 31-42 (1974).
[20] Fujiwara, N., Matsumoto, T., Koyama-Nakazawa, K., Hisada, A.,Uwatoko, Y., Rev. Scient. Instrum. 78, 073905 (2007).
109
[21] Yokogawa, K., Murata, K., Yoshino, H., Aoyama, S., Jpn. J. App.Phys. 46, No. 6A, 3636-3639 (2007).
[22] Waseda, Y., Matsubara, E., Shinoda, K., X-Ray DiffractionCrystallography: Introduction, Examples and Solved Problems ISBN9783642166358, (2011).
[23] Squires, G.L., Introduction to the Theory of Thermal Neutron Scattering,Dover Publications, inc., Mineola, New York, (1978).
[24] Shirane, G., Shapiro, S.M., Tranquada, J.M., Neutron Scatteringwith a Triple-Axis Spectrometer, Dover Publications, inc., Cambridge Uni-versity Press, UK, ISBN 0-511-03732-5, (2002).
[25] McIntyre, G.J., Stansfield, R.F.D., Acta Cryst. 44, 257-262 (1988).
[26] Zachariasen, W.H., Acta Cryst. 16, 1139-1144 (1963).
[27] Marshall, W., Lowde, R.D., Rept. Progr. Phys. 31, 705 (1968).
[28] Lovesey, S.W., Theory of Neutron Scattering from Condensed Matter,Clarendon Press, Oxford, (1984).
[29] Steglich, F., Bredl, C.D., Loewenhaupt, M., Schotte, K.D.,J. Physique, Colloque C5 40, 301 (1979).
[30] Loewenhaupt,M.,Witte, U., J. Phys.: Condens. Matter 15, S519-S536(2003).
[31] Murani, A.P., Eccleston, R.S., Physica B 234-236, 888-890 (1997).
[32] Park, J.-G., Murani, A.P., J. Phys.: Condens. Matter 15, 6835-6844(2003).
[33] Reichardt, W., Nucker, N., J. Phys. F: Met. Phys. 14, L135-L140(1984).
[34] Barbara, B., Boucherle, J.X., Buevoz, J.L., Rossignol, M.F.,Schweizer, J., J. Physique, Colloque C5 40, 321 (1979).
[35] Schweizer, J., Givord, F., Boucherle, J.X., Bourdarot, F.,Ressouche, E., J. Phys.: Condens. Matter 20, 135204 (2008).
[36] Thalmeier, P., J. Phys. C: Solid State Phys. 17, 4153-4177 (1984).
[37] Loewenhaupt, M., Rainford, F., Steglich, F., Phys. Rev. Lett. 25,1709 (1979).
[38] Lipinski, S., J. Magn. Magn. Matter. 192, 553-563 (1999).
[39] Hillier, A.D., Adroja, D.T., Manuel, P., Anand, V.K., Tay-
lor, J.W., McEwen, K.A., Rainford, B.D., Koza, M.M., Phys. Rev.B 85, 134405 (2012).
[40] Pashen, S., Felder, E., Ott, H.R., Eur. Phys. J. B 2, 169 (1998).
110
[41] Smidman, M., Adroja, D.T., Hillier, A.D., Chapon, L.C., Tay-
lor, J.W., Anand, V.K., Singh, R.P., Lees, M.R., Goremy-
chkin, E.A., Koza, M.M., Krishnamurthy, V.V., Paul, D.M., Bal-
akrishnan, G., Phys. Rev. B 88, 134416 (2013).
[42] Muranaka, T., Akimitsu, J., Physica C 460–462, 688–690 (2007).
[43] Joshi, D.A., Burger, P., Adelmann, P., Ernst, D., Wolf, T., Spar-ta, K., Roth, G., Grube, K., Meingast, C., Lohneysen, H.v., Phys.Rev. B 86, 035144 (2012).
[44] Haen, P., Lejay, P., Chevalier, B., Lloret, B., Etourneau, J.,Sera, M., J. Less-Common Met. 110, 321 (1985).
[45] Mock, S., Pfleiderer, C., Lohneysen, H.v., J. Low Temp. Phys. 115,1 (1999).
[46] Martin, J.M., Paul, D.M., Lees, M.R., Werner, D., Bauer, E.,J. Magn. Magn. Mater. 159, 223-226 (1996).
[47] Martin, J.M., Lees, M.R., Paul, D.M., Dai, P., Ritter, C., Bi, Y.J.,Phys. Rev. B 57, 7419 (1998).
[48] Nimura, N., Ito, K., Saitoh, K., Umeda, Y., Aoki, H.,Terashima, T., Phys. Rev. B 95, 247004 (2005).
[49] Sugitani, I., Okuda, Y., Shishido, H., Yamada, T., Thamhavel, A.,Yamamoto, E., Matsuda, T.D., Haga, Y., Takeuchi, T., Settai, R.,Onuki, Y., J. Phys. Soc. Japan 75, 043703 (2006).
[50] Bauer, E., Pillmayr, N., Gratz, E., Hilscher, G., Gignoux, D.,Schmitt, D., Z. Phys. B 67, 205 (1987).
[51] Kontani, M., Ido, H., Ando, H., Nishioka, T., Yamaguchi, Y.,J. Phys. Soc. Japan 63, 1652 (1994).
[52] Nishioka, T., Kawamura, Y., Kato, H., Matsumura, M., Ko-
dama, K., Sato, N.K., J. Magn. Magn. Mater. 310, e12-e14 (2007).
[53] Mentink, S.A.M., Bos, N.M., Rossum, F.J. van, Nieuwenhuys, G.J.,Mydosh, J.A., Buschow, K.H.J., J. Appl. Phys. 73, 6625 (1993).
[54] Kontani, M., Motoyama, G., Nishioka, T., Murase, K., Physica B259-261, 24 (1999).
[55] Oohara, Y., Motoyama, G., Nishioka, T., Kontani, M., TechnicalReport of ISSP, Ser. A, 3526 (1999).
[56] Zarechnyuk, O.S., Kripyakevic, P.L., Gladyshevskii, E.L., Sov.Phys. Crystallogr. 9, 706 (1965).
[57] Moze, O., Buschow, K.H.J., J. Alloys Comp. 245, 112 (1996).
111
[58] Hu, X.D., Zhou, H.Y., Li, J.B., Pan, S.K., Wang, T., Yao, Q.R., Du-
an, L.B., Wang, Y.C., Chen, X.J., Rao, G.H., Intermetallics 17, 775(2009).
[59] Adroja, D.T., private communication.
[60] Klicpera, M., Javorsky, P., J. Magn. Magn. Mater. 363, 88-94 (2014).
[61] Klicpera, M., Javorsky, P., J. Alloys Comp. 621, 78-85 (2015).
[62] Dolezal, P., Master thesis, Charles university in Prague, Faculty of Math-amtics and Physics (2015), in czech language.
[63] Dolezal, P., Klicpera, M., Prchal, J., Javorsky, P., Phys. Poloni-ca A 127, 219-221 (2015).
[64] Klicpera, M., Dolezal, P., Prokleska, J., Prchal, J., Ja-
vorsky, P., J. Alloys Comp. 639, 51-59 (2015).
[65] Klicpera, M., Javorsky, P., Pasztorova, J., Supercond. Scien. Tech-nol. 27, 085001 (2014).
[66] Eisenmann, B., Schafer, J., J. Less-Common Metals 123, 89-94 (1986).
[67] Anand, V.K., Adroja, D.T., Hillier, A.D., Kockelmann, W.,Fraile, A., Strydom, A.M., J. Phys.: Cond. Matter 23, 276001 (2011).
[68] Seropegin, Yu.D., Shapiev, B.I., Gribanov, A.V., Bodak, O.I., J. Al-loys Comp. 288, 155-158 (1999).
[69] Pikul, A.P., Kaczorowski, D., Plackowski, T., Czopnik, A., Mi-
chor, H., Bauer, E., Hilscher, G., Rogl, P., Grin, Yu., Phys. Rev. B67, 224417 (2003).
[70] Franz, Ch., Ph.D. thesis, Untersuchung von Quantenphasenubergangenbei fehlender Inversionssymmetrie, Technische Universitat Munchen,(2014).
[71] Kim, J.W., Kwon, Y.S., Physica B 378–380, 833–834 (2006).
[72] Grin, Yu.N., Rogl, P., Hiebl, K., J. Less-Common Metals 136, 329-338(1988).
[73] Hulliger, F., J. Alloys Comp. 218, 255-258 (1995).
[74] Klicpera, M., Javorsky, P., Cermak, P., Rudajevova, A., Danis, S.,Brunatova, T., Cısarova, I., Intermeral. 46, 126-130 (2014).
[75] Yamamoto, H., Sawa, H., Ishikawa, M., Phys. Lett. A 196, 83-86(1994).
[76] Seropegin, Yu.D., Shapiev, B.I., Gribanov, A.V., Bodak, O.I., J. Al-loys Comp. 288, 147-150 (1999).
112

[77] Hong, J.B., Kim, J.W., Lee, K.E., Lee, N.A., Jang, K.H., Park, J.-G.,Kwon, Y.S., J. Magn. Magn. Mater. 310, 292–294 (2007).
[78] Aso, N., Miyano, H., Yoshizawa, H., Kimura, N., Komatsubara, T.,Aoki, H., J. Magn. Magn. Mater. 310, 602-604 (2007).
[79] Aso, N., Takahashi, M., Yoshizawa, H., Iida, H., Kimura, N., Ao-
ki, H., J. Phys.: Conf. Series 400, 022003 (2012).
[80] Kawai, T., Muranaka, H., Measson, M.-A., Shimoda, T., Doi, Y.,Matsuda, T.D., Haga, Y., Knebel, G., Lapertot, G., Aoki, D.,Flouquet, J., Takeuchi, T., Settai, R., Onuki, Y., J. Phys. Soc.Japan 77, 064716 (2008).
[81] Cava, R.J., Ramirez, A.P., Takagi, H., Krajewski, J.J.,Peck, W.F. Jr., J. Magn. Magn. Mater. 128, 124-128 (1993).
[82] Seropegin, Yu.D., Gribanov, A.V., Kubarev, O.L., Tursina, A.I.,Bodak, O.I., J. Alloys Comp. 317-318, 320-323 (2001).
[83] Kawai, T., Okuda, Y., Shishido, H., Thamizhavel, A., Matsu-
da, T.D., Haga, Y., Nakashima, M., Takeuchi, T., Hedo, M., Uwa-
toko, Y., Settai, R., Onuki, Y., J. Phys. Soc. Japan 76, 014710 (2007).
[84] Adroja, D.T., Fuente, C. de la, Fraile, A., Hillier, A.D., Daoud-
Aladine, A., Kockelmann, W., Taylor, J.W., Murani, A.P.,Koza, M.M., Burzurı, E., Luis, F., Arnaudas, J.I., Moral, A. del,http://arxiv.org/, arXiv: 1501.00286.
[85] Rojas, D.P., Rodrıguez Fernandez, J., Espeso, J.I., Gomez
Sal, J.C., J. Alloys Comp. 502, 275-278 (2010).
[86] Werner, D., Bauer, E., Martin, J.M., Lees, M.R., Physica B 259-261, 10-11 (1999).
[87] Schlottmann, P., Z. Phys. B - Condens. Matt. 51, 223-235 (1983).
[88] Pietri, R., Andraka, B., Kaczorowski, D., Leithe-Jasper, A.,Rogl, P., Phys. Rev. B 61, 12169 (2000).
[89] Ouladdiaf, B., Archer, J., Allibon, J.R., Decarpentrie, P.,Lemee-Cailleau, M.H., Rodriguez-Carvajal, J., Hewat, A.W.,York, S., Brau, D., McIntyre, J., Appl. Crystall. 44, 392-397 (2011).
[90] Rodriguez-Carvajal, J., Fuentes-Montero, L., Cermak, P., to bepublished. See the web page http://lauesuite.com/
[91] Brush, G.S., Rev. Mod. Phys. 39, 883 (1967).
[92] Matsumura, M., Kawamura, Y., Yoshina, M., Nishioka, T., Ka-
to, H., J. Phys.: Confer. Series 150, 042122 (2009).
[93] Vonlanthen, P., Gavilano, J.L., Ambrosini, B., Ott, H.R., Eur.Phys. J. B 7, 9-17 (1999).
113
[94] Knafo, W., Raymond, S., J. Phys.: Cond. Matter15, 3741-3749 (2003).
[95] Oe, K., Kobayashi, R., Nishioka, T., Kato, H., Matsumura, M.,Kodama, K., J. Phys. Conf. Ser. 150, 042146 (2009).
[96] Cermak, P., Uhlırova, K., Javorsky, P., Physica B: Conden. Matt.405, 2294 (2010).
[97] Yao, Q.R., Hu, X.D., Chen, X.J., Pan, S.K., Zou, W., Wang, H.L.,Wang, Y.C., Wang, P.P., Liu, F., Wang, Z.M., Zhou, H.Y.,Tang, C.Y., J. Alloys Comp. 484, 86 (2009).
[98] Andersen, N.H., Smith, H., Phys. Rev. B 19, 384 (1979).
[99] Blanco, J.A., Podesta, M. de, Espeso, J.I., Gomez Sal, J.C.,Lester, C., McEwan, K.A., Patrikios, N., Rodriguez Fernan-
dez, J., Phys. Rev. B 49, 15126 (1994).
[100] Fernandez-Baca, J.A., Hill, P., Chakoumalos, B.C., Ali, N., J. Ap-pl. Phys. 79, 5398 (1996).
[101] Lalic, M.V., Mestnik-Filho, J., Carbonari, A.W., Saxena, R.N.,J. Magn. Magn. Mater. 272-276, 633-634 (2004).
[102] Tolinski, T., Synoradzki, K., Koterlyn, M., Koterlyn, G., Yas-nitskii, R., J. Alloys Comp. 580, 512-516 (2013).
[103] Steglich, F., Aarts, J., Bredl, C.D., Lieke, W., Meshede, D.,Franz, W., Schafer, H., Phys. Rev. Lett. 43, 1892 (1979).
[104] Groshe, F.M., Julian, S.R., Mather, N.D., Lonzarich, G.G., Physi-ca B 223-224, 50 (1996).
[105] Yamaoka, H., Zekko, Y., Kotani, A., Jarrige, I., Tsujii, N., Lin, J.,Mizuki, J., Abe, H., Kitazawa, H., Ishii, H., Tsuei, K., Phys. Rev. B86, 235131 (2012).
[106] Movshovich, R., Graf, T., Mandrus, D., Hundley, M.F., Thomp-
son, J.D., Fisher, R.A., Smith, J.L., Physica B 223-224, 126 (1996).
[107] Jaccard, D., Behnia, K., Sierro, J., Phys. Lett. A 163, 475 (1992).
[108] Beyermann, W.P., Hundley, M.F., Canfield, P.C.,Godart, C., Sel-sane, M., Fisk, Z., Smith, J.L., Thompson, J.D., Physica B 171, 373(1991).
[109] Kitagawa, J., Ishikawa, M., J. Phys. Soc. Japan 68, 2380-2383 (1999).
[110] Takabatake, T., Tanaka, T., Bando, Y.,Fujii, H., Takeda, N.,Ishikawa, M., Oguro, I., Physica B 230-232, 223-225 (1997).
[111] Dolezal, P., Klicpera, M., et al. will be published.
[112] Tursina, A., Khamitcaeva, E., Gribanov, A., Gnida, D., Kac-
zorowski, D., Inorg. Chem., DOI: 10.1021/ic503110c
114
[113] Klicpera, M., Javorsky, P., Hoser, A., J. Alloys Comp. 596, 167-172(2014).
[114] Javorsky, P., Klicpera, M., J. Magn. Magn. Mater. 342, 152-155(2013).
[115] Knopp, G., Loidl, A., Knorr, K., Pawlak, L., Duczmal, M., Cas-
pary, R., Gottwick, U., Spille, H., Steglich, F., Murani, A.P.,Z. Phys. B - Conden. Matter 77, 95-104 (1989).
[116] Loewenhaupt, M., Faulhaber, E., Schneidewind, A., Deppe, M.,Hradil, K., J. Applied Phys. 111, 07E124 (2012).
[117] Perez-Mato, J.M., Gallego, S.V., Tasci, E.S., Elcoro, L.,Flor, G. de la, Aroyo, M.I., Annu. Rev. Mater. Res. 45, 13.1-13.32(2015).
[118] Rodrıguez-Carvajal, J., Bouree, F., EPJ Web of Conferences 22,00010-p.24 (2012), DOI: 10.1051/epjconf/20122200010
[119] Steeman, R.A., Frikkee, E., Helmholdt, R.B., Menovsky, A.A.,Berg, J. van den, Nieuwenhuys, G.J., Mydosh, J.A., Solid StateComm. 66, 103-107 (1988).
[120] Feyerherm, R., Becker, B., Collins, M.F., Mydosh, J., Nieuwen-
huys, G.J., Ramakrishnan, S., Physica B 241-243, 643-645 (1998).
[121] Fak, B., Ressouche, E., Knebel, G., Flouquet, J., Lejay, P., SolidState Comm. 115, 407-410 (2000).
[122] Grier, B.H., Lawrence, J.M., Murgai, V., Parks, R.D., Phys. Rev. B29, 2664 (1984).
[123] Raymond, S., Haen, P., Calemczuk, R., Kambe, S., Fak, B., Le-
jay, P., Fukuhara, T., Flouquet, J., J. Phys.: Condens. Matter 11,5547-5560 (1999).
115

116

List of Tables
Table 2.1 The purity of elements used for the preparation of studied com-pounds.
Table 4.1 The crystal structure types and lattice parameters of previouslystudied CeTX3 compounds.
Table 4.2 Structure parameters of CeCuAl3 single crystal determined fromX-ray diffraction patterns taken at 296 K and 150 K.
Table 4.3 Interatomic distances in CeCuAl3.
Table 4.4 The integrated intensity on magnetic reflections in CeCuAl3measured on D10 dffractometer.
Table 4.5 Structural parameters of CeCuxAl4−x compounds and character-istics derived from specific heat data.
Table 4.6 Energies of crystal field excitations and CF parameters deter-mined from INS data for CeCuxAl4−x compounds.
Table 4.7 The basic structural and magnetic properties of(Ce,La)Pd2Al2−xGax compounds.
Table 4.8 The structural parameters of CePd2Al2 and CePd2Ga2 deter-mined by neutron diffraction at 5 K.
Table 4.9 The parameters and eigen-values of crystal field Hamiltoniandescribing the CF excitations in CePd2Al2−xGax compoundsadopting the orthorhombic structure.
117

118
List of Abbreviations
a lattice parameter of tetragonal structure (if not stated otherwise)A absorptionA Angstroemac- alternate current (susceptiblity)AFM antiferromagnetic state of materialbj scattering lengthBn
m crystal electric field parameterBSE back-scattered electronsc lattice parameter of tetragonal structure (if not stated otherwise)Cel electronic contribution to the specific heatCmag magnetic contribution to the specific heatCp total specific heatCph phonon contribution to the specific heatCSchottky Schottky contribution to the specific heatCEF (CF) crystalline electric field (crystal field)CYCLOPS CYlindrical Ccd Laue Octagonal Photo ScintillatorDSC differential scanning calorimetryDTA differential thermal analysisE energyEx extinctionEDX Energy Dispersive X-ray (diffraction)
fj( ~Q) magnetic formfactorF structure factorFN nuclear structure factorFM magnetic structure factorFC field cooled (regime of magnetization measurement)gJ Lande g-factor~G reciprocal space vectorh reduced Planck constant (= h
2π= 6.58211928(15) .10−16 eV.s)
H magnetic field
H Hamiltonian
HCEF Hamiltonian of crystal electric fieldHZB Helmholz Zentrum Berlin, GermanyI intensity (of radiation)ILL Institute Laue-Langevin, Grenoble, France
119
INS inelastic neutron scatteringISIS pulsed neutron and muon source at the Rutherford Appleton
Laboratory, Oxfordshire, Great Britainj, jel electrical currentJ total angular momentumJex exchange constant (of RKKY and Kondo interaction)~k propagation vector of magnetic structure~k1, ~k2 wave vectors of incident and scattered neutron, respectivelykB Boltzmann constant (= 8.6173324(78) .10−5 eV.K−1)K Kelvin (unit of temperature and energy)L orbital momentumLf Lorentz factorm neutron mass (= 1.674927351(74) .10−27 kg)M magnetizationmeV milielectronvolt (energy unit; 1 eV = 1.602176565(35) .10−19 J)MLTL Magnetism and Low Temperatures Laboratories, Prague, Czech
Republic (http://mltl.eu/)MPMS Magnetic Property Measurement System (Quantum Design)MR magneto-resistance, magnetoresistancen(EF) density of states at Fermi levelNA Avogadro constant (= 6.02214129(27) .1023 mol−1)nFL non-Fermi-liquid
Onm Steven’s operator
P preferential orientationPPMS Physical Property Measurement System (Quantum Design)q latent heat
~q relative momentum ( ~Q = ~G+ ~q)~Q scattering vector (vector from reciprocal space)R gas constant (= 8.3144621(75) J.K−1.mol−1)R(T ), R(H) electrical resistivity (measured in dependence on tempera-
ture/magnetic field)R0 residual electrical resistivityRel electron-electron part of electrical resistivity~Rj lattice vector (vector from real space), position of jth atomRph electron-phonon part of electrical resistivityRKKY Ruderman-Kittel-Kasuya-Yosida indirect interaction
120
S spin momentumSmag magnetic entropySmagord , STN
magnetic entropy at ordering (Neel) temperatureSC superconductivity, superconducting stateTC Curie temperatureTK strength of Kondo interaction, Kondo temperatureTN Neel temperatureTRKKY strength of RKKY interactionTSC temperature of superconducting state transitionv(1), v(2) molar volume before and after transition, respectivelyvF Fermi velocityV volume of elementary unit cellWj temperature factor (exponent in Debye-Waller factor)z... fraction atomic coordinate of tetragonal structure (along tetrag-
onal c-axis)ZFC zero field cooled (regime of magnetization measurement)α ratio of total-scattering cross sections of Ce- and La-based com-
pounds analoguesβ specific heat coefficient related to energy of acoustic phononsγel Sommerfeld coefficient of electronic contribution to specific heat∆1, ∆2 excitation energies in compound due to the influence of crystal
field∆Cel size of the specific heat jump at superconducting transitionλ wavelength of radiationµ0 magnetic permeability of vacuum (= 4π .10−7 W
A.m)
µB Bohr magneton (= eh2m
= 5.7883818066(38) .10−5 eV.T−1)µeff effective magnetic momentµj magnetic moment on jth atomµj⊥ perpendicular component of magnetic moment (component of
magnetic moment perpendicular to the scattering vector ~Q)µord ordered magnetic momentθD Debye temperatureθRD Debye temperature determined from electrical resistivityθE Einstein temperature
121

122

The results presented in this thesis have been published in peer re-viewed journals cited below:
Neutron scattering study of magnetic order in CeCuAl3 single crystal
Klicpera, M., Javorsky, P., Cermak, P., Schneidewind, A., Ouladdi-
af, B., Divis, M.
Phys. Rev. B 91, 224419 (2015)
DOI: 10.1103/PhysRevB.91.224419
Structural phase transition in CePd2Ga2 under hydrostatic pressure
Dolezal, P., Klicpera, M., Prchal, J., Javorsky, P.
Acta Phys. Pol. A 127, 219-221 (2015)
DOI: 10.12693/APhysPolA.127.219
Magnetic and transport properties of CePd2Al2 single crystal
Klicpera, M., Dolezal, P., Prokleska, J., Prchal, J., Javorsky, P.
J. Alloys Comp. 639, 51-59 (2015)
DOI: 10.1016/j.jallcom.2015.03.095
Magnetization and electrical resistivity measurements on CeCuAl3 single crystal
Klicpera, M., Javorsky, P., Divis, M.
J. Phys.: Conf. Ser. 592, 012014 (2015)
DOI: 10.1088/1742-6596/592/1/012014
Development of crystal structure and magnetism in RCuAl3−xGax solid solutions
Klicpera, M., Javorsky, P.
J. Alloys Comp. 621, 78-85 (2015)
DOI: 10.1016/j.jallcom.2014.09.188
Specific heat study in (Ce,La)Pd2X2 compounds (X = Al, Ga)
Klicpera, M., Pastzorova, J., Javorsky, P.
J. Supercond. Nov. Magn. 28, 859-862 (2015)
DOI: 10.1007/s10948-014-2692-z
Superconductivity in LaPd2Al2−xGax compounds
Klicpera, M., Javorsky, P., Pastzorova, J.
Supercond. Scien. Techno. 27, 085001 (2014).
DOI: 10.1088/0953-2048/27/8/085001
Structural phase transition in CeCuAl3 single crystal
Klicpera, M., Javor-sky, P., Danis, S., Brunatova, T.
Acta Phys. Pol. A 126, 290 (2014)
DOI: 10.12693/APhysPolA.126.290
Study of electronic properties in RCu1−xAuxAl3 compounds, where R = Ce, La
Klicpera, M., Javorsky, P.
J. Magn. Magn. Mater. 363, 88-94 (2014)
DOI: 10.1016/j.jmmm.2014.03.071
123
Structural and electronic properties of RPd2Al2−xGax (R = Ce and La) com-poundsKlicpera, M., Javorsky, P., Hoser, A.J. Alloys Comp. 596, 167-172 (2014)DOI: 10.1016/j.jallcom.2014.01.039
Crystal structure and its stability in CeCuAl3 single crystalKlicpera, M., Javorsky, P., Cermak, P., Rudajevova, A., Danis, S.,Brunatova, T., Cısarova, I.Intermetall. 46, 126-130 (2014)DOI: 10.1016/j.intermet.2013.11.004
Specific-heat study of Ce(Cu,Al)4 compoundsJavorsky, P., Klicpera, M.J. Magn. Magn. Mater. 342, 152-155 (2013)DOI: 10.1016/j.jmmm.2013.04.043
124