Embed Size (px)
Citation preview
©20
17 M
acm
illan
Pu
blis
her
s L
imit
ed, p
art
of
Sp
rin
ger
Nat
ure
. All
rig
hts
res
erve
d.
© 2017 Macmillan Publishers Limited, part of Springer Nature. All rights reserved.
protocol
1792 | VOL.12 NO.9 | 2017 | nature protocols
© 2017 Macmillan Publishers Limited, part of Springer Nature. All rights reserved.
IntroDuctIonMicroscopy is an essential cell biology tool that reveals the intracel-lular locations of specific biomolecules, contributing to the eluci-dation of their roles in cell structure and function. Fluorescence microscopy is especially powerful because it is rapid and con-venient, and an extensive toolbox of fluorescent probes has been developed1. Genetically targetable fluorescent protein (FP) tags, in particular, have revolutionized cell biology. However, the spa-tial resolution of fluorescence microscopy is ~200–300 nm (see Fernandez-Suarez and Ting2), which represents a serious limitation because most biomolecules are much smaller than these dimen-sions. In recent years, super-resolution fluorescence microscopy techniques have greatly improved upon the resolution of conven-tional light microscopy, but these techniques require specialized fluorophores and equipment, and they do not yet routinely pro-vide spatial resolution in the sub-10-nm regime3,4. Furthermore, fluorescence microscopy approaches label a specific molecule of interest while failing to highlight the ultrastructural surroundings, limiting their capability to localize the molecule relative to other subcellular structures. Compared with fluorescence microscopy, EM achieves far superior spatial resolution (~1 nm in biologi-cal samples2). Moreover, heavy-metal staining of cells before EM reveals the entire cellular ultrastructure, including membranes, large proteinaceous complexes, and subcellular organelles.
Despite its potential, EM of biological samples has been ham-pered by a lack of tools to label and identify specific proteins of interest. Traditionally, specific proteins are labeled for EM by antibody-based recruitment of an exogenous electron-dense moi-ety5,6 or a catalyst capable of generating EM contrast in situ7,8. However, these approaches require permeabilizing treatments to facilitate reagent entry into cells and the use of mild fixatives to retain antigenicity, both of which lead to less-than-optimal preservation of cellular ultrastructure9. Furthermore, antibodies
against a particular protein of interest may not be available, and available antibodies often fail to recognize the target in fixed cells or suffer from off-target binding. The Tokuyasu method of ultracryosectioning of sucrose-cryoprotected samples removes the need for permeabilizing reagents, but this approach is techni-cally demanding and requires antibody staining of each individual section10. Another approach involves the preservation and imaging of FP signal following high-pressure freezing, freeze-substitution, resin-embedding, and sectioning11. Although this approach does not require affinity labeling, it fails to generate an EM-visible label, and its localization accuracy was described as <100 nm and not <10 nm.
Genetic tags offer substantial advantages over antibody-based methods because they do not require permeabilizing treatments. Instead, a gene encoding a tagged fusion construct is introduced, leading to expression of a fusion protein in which the tag is attached to the protein of interest with perfect specificity. The advantages of genetic tags are exemplified by the robust and easy-to-use FPs that have revolutionized fluorescence microscopy of biological samples1. However, all previous genetically encoded EM probes suffer from major drawbacks that have prevented their widespread adoption. Some tags, such as horseradish peroxidase (HRP), fail to function in most subcellular compartments because they require multiple post-translational modifications12, whereas others, such as miniSOG (mini singlet oxygen generator), require intense light exposure, restricting their use to narrow fields of view and making them less straightforward to implement13 (see ‘Comparison of APEX2 with other genetically encoded EM tags’ for a detailed discussion).
To overcome the limitations of existing methods, we devel-oped APEX (enhanced ascorbate peroxidase), a genetic tag that generates strong EM contrast in all cellular compartments using
Electron microscopy using the genetically encoded APEX2 tag in cultured mammalian cellsJeffrey D Martell1, Thomas J Deerinck2, Stephanie S Lam1, Mark H Ellisman2–4 & Alice Y Ting1,5–7
1Department of Chemistry, Massachusetts Institute of Technology, Cambridge, Massachusetts, USA. 2National Center for Microscopy and Imaging Research, University of California at San Diego, La Jolla, California, USA. 3Department of Neurosciences, University of California at San Diego, La Jolla, California, USA. 4Department of Bioengineering, University of California at San Diego, La Jolla, California, USA. 5Department of Genetics, Stanford University, Stanford, California, USA. 6Department of Biology, Stanford University, Stanford, California, USA. 7Department of Chemistry, Stanford University, Stanford, California, USA. Correspondence should be addressed to M.H.E. ([email protected]) or A.Y.T. ([email protected]).
Published online 10 August 2017; doi:10.1038/nprot.2017.065
electron microscopy (eM) is the premiere technique for high-resolution imaging of cellular ultrastructure. unambiguous identification of specific proteins or cellular compartments in electron micrographs, however, remains challenging because of difficulties in delivering electron-dense contrast agents to specific subcellular targets within intact cells. We recently reported enhanced ascorbate peroxidase 2 (apeX2) as a broadly applicable genetic tag that generates eM contrast on a specific protein or subcellular compartment of interest. this protocol provides guidelines for designing and validating apeX2 fusion constructs, along with detailed instructions for cell culture, transfection, fixation, heavy-metal staining, embedding in resin, and eM imaging. although this protocol focuses on eM in cultured mammalian cells, apeX2 is applicable to many cell types and contexts, including intact tissues and organisms, and is useful for numerous applications beyond eM, including live-cell proteomic mapping. this protocol, which describes procedures for sample preparation from cell monolayers and cell pellets, can be completed in 10 d, including time for apeX2 fusion construct validation, cell growth, and solidification of embedding resins. notably, the only additional steps required relative to a standard eM sample preparation are cell transfection and a 2- to 45-min staining period with 3,3'-diaminobenzidine (DaB) and hydrogen peroxide (H2o2).
©20
17 M
acm
illan
Pu
blis
her
s L
imit
ed, p
art
of
Sp
rin
ger
Nat
ure
. All
rig
hts
res
erve
d.
© 2017 Macmillan Publishers Limited, part of Springer Nature. All rights reserved. © 2017 Macmillan Publishers Limited, part of Springer Nature. All rights reserved.
protocol
nature protocols | VOL.12 NO.9 | 2017 | 1793
a straightforward procedure that does not require light12. APEX, a monomeric heme enzyme, is the same size as GFP (27 kDa). Cells expressing APEX fusion constructs are fixed using aldehydes, and then stained with DAB and H2O2, which diffuse readily into the nonpermeabilized cells and are converted by APEX into an insoluble polymer (Fig. 1). Upon treatment with osmium tetrox-ide (OsO4), this polymer becomes EM-visible. Importantly, APEX remains active after cell fixation with glutaraldehyde, a reagent that yields excellent preservation of ultrastructure. The DAB polymer, which is efficiently generated by APEX at 4 °C, remains tightly localized to the site of production14 and does not cross membranes, enabling very high spatial resolution. This mini-mal diffusion of the reaction product represents a key difference between APEX and the immunoperoxidase method7 (antibody-based tagging with HRP), which suffers from substantial diffu-sion of the DAB reaction product. APEX generates a reaction product within well-preserved, tightly cross-linked cells, whereas the immunoperoxidase method creates a permeabilized cellular ultrastructure that fails to contain the DAB reaction product.
The original APEX tag enabled EM imaging of numerous proteins, but in some cases—especially for fusion constructs expressed at low levels—APEX failed to produce EM contrast. Using directed evolution, we developed APEX2, a single mutant of APEX (A134P) that has the same advantages of APEX while pro-ducing the DAB polymer with faster kinetics and incorporating the heme cofactor more efficiently within cells15. In all cases tested to date, APEX2 has produced stronger EM contrast than APEX. We therefore recommend APEX2 for all EM applications.
Although APEX2 has been successfully used for EM imag-ing by many research groups, the published EM images have not always exhibited clear APEX2 staining above endogenous contrast and optimal preservation of cellular fine structure. Furthermore, careful comparisons with control samples have been lacking in many cases, hampering proper interpretation of the APEX2 staining. In this Protocol, we provide detailed guide-lines for each step, including instructions that are more explicit than those in our prior publications on APEX2. We emphasize careful examination of both bright-field and EM images and
provide several examples, including demonstrations of improper staining and damaged cellular fine structure, so that researchers can avoid such problems in the future. Although this Protocol focuses on cultured mammalian cells, it can be readily adapted to other contexts, and we provide recommendations and references in the ‘Experimental design’ and ‘Procedure’ sections. We hope this detailed guide will make the APEX2 EM methodology broadly accessible to all researchers, regardless of how experienced they are with EM techniques.
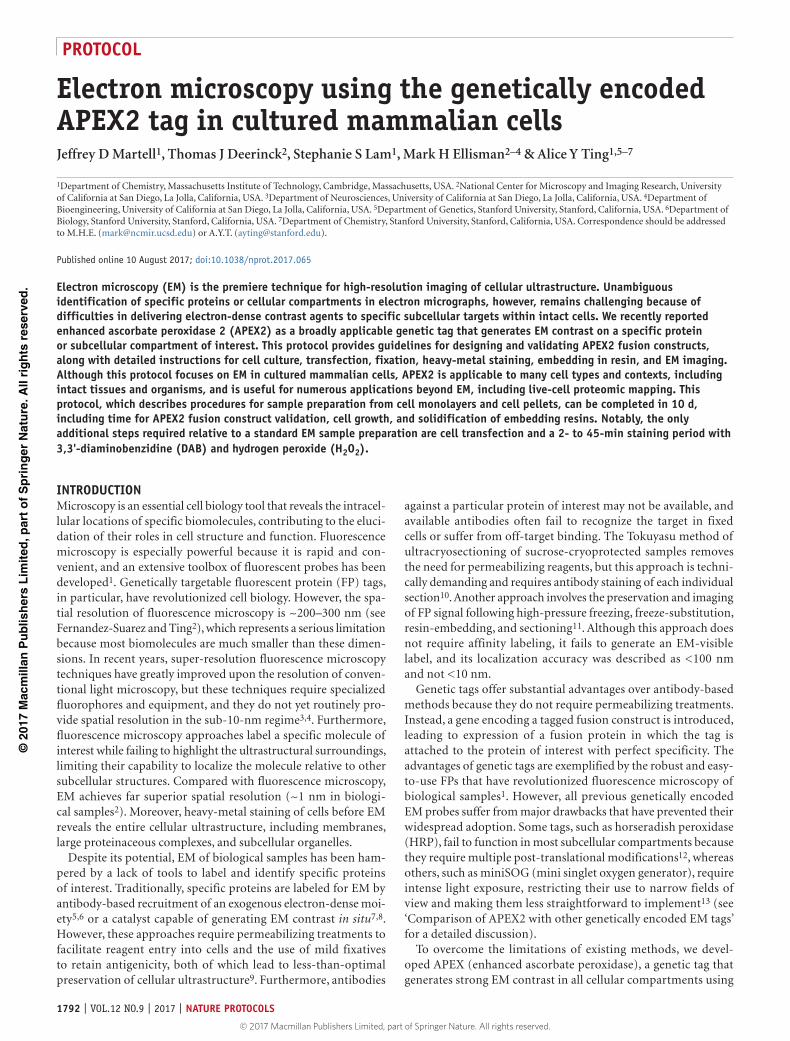
Applications of the methodWe and others have successfully used APEX and APEX2 for EM imaging of a wide array of proteins (Fig. 2), including proteins in the cytoskeleton12,15 (vimentin, tubulin, and actin), gap junc-tions (Connexin43)12, chromatin (histone 2B)12, plasma mem-brane14,16,17, Golgi apparatus18, exosomes19, endosomes14, lipid droplets14, cytoplasm14, and a variety of mitochondrial sub-compartments (matrix, intermembrane space, and outer mem-brane)12,15,20–26. Because the DAB reaction product does not cross membranes, APEX2 can be used to elucidate the topology of transmembrane proteins, as we have demonstrated for several mitochondrial proteins12,15,21. APEX2 is not intrinsically fluores-cent, but it generates strong EM contrast when fused in tandem with a FP12,16,18,27–29, making it useful for correlated light and EM30 (Fig. 3). APEX2 is also useful as an EM marker of sub-cellular organelles, including the mitochondrial matrix12,31,32, mitochondrial intermembrane space12,20, mitochondrial outer membrane15, endoplasmic reticulum (ER) lumen12,33, ER mem-brane15, nucleus14,32, and plasma membrane15. The utility of APEX2 as an organelle marker makes it valuable for semiauto-matic segmentation of large image sets34 and localization of rare structures within large specimens using X-ray microscopy35. APEX2-containing organelles, such as exosomes36 and mitochon-dria37, can be purified and transferred to recipient cells, which are subsequently examined by EM to determine the fate of the exogenously delivered organelles. APEX2 has been used both in immortalized cell lines and in primary cells such as dissociated cultured neurons15,25,32.
EM image
200 nm
Steps 17–19: heavy metal staining
Steps 20–29: embedding in resin
Steps 30–35: cutting of thin sections
Steps 12–15: cell fixation
Step 16: DAB staining
Step 11: introductionof APEX2 fusion
protein DAB polymer
(visible bybright-field
microscopy)
Cytosol
IMS
Matrix
Figure 1 | Overview of targeted EM using APEX2 and its variants in cultured cells. Schematic depiction of the APEX2 methodology. APEX2 is introduced genetically as a fusion to a protein of interest or a targeting peptide. Cells are then fixed chemically, as in a normal EM preparation, followed by staining with DAB and H2O2 for 5–45 min. The DAB reaction product can be visualized by bright-field microscopy to conveniently ascertain whether the staining was successful. Samples are then processed for EM via heavy-metal staining, dehydration, embedding, and sectioning. IMS, mitochondrial intermembrane space.
©20
17 M
acm
illan
Pu
blis
her
s L
imit
ed, p
art
of
Sp
rin
ger
Nat
ure
. All
rig
hts
res
erve
d.
© 2017 Macmillan Publishers Limited, part of Springer Nature. All rights reserved.
protocol
1794 | VOL.12 NO.9 | 2017 | nature protocols
© 2017 Macmillan Publishers Limited, part of Springer Nature. All rights reserved.
Although this Protocol focuses on EM imaging in cultured mammalian cells, APEX2 can be used in essentially any cell type, including bacteria38, the eukaryotic parasite Giardia lamblia39, and yeast18, as well as complex tissues and organisms, including zebrafish14,28, Caenorhabditis elegans19, Drosophila40, and mice41. APEX2 is especially useful for EM applications in vivo because, unlike existing genetic tags (see below), APEX2 does not require irradiation with light or exogenous delivery of large molecules such as antibodies and nanoparticles. APEX2 has also been used to label viral proteins after infection of cultured mammalian cells42,43 and to study the impact of an infectious intracellular
bacterium on ER morphology29. It is unclear whether APEX2 can be used in plants, which contain abundant endogenous peroxi-dases that may create strong background staining44.
APEX2 is a multifunctional tag that has been demonstrated for numerous applications beyond EM, including live-cell pro-teomic mapping20,21,45–47, H2O2-sensing48,49, and fluorescent signal amplification12,50,51. The multifunctional capabilities of APEX2 enhance its utility for each of its individual appli-cations. For example, in live-cell proteomic mapping studies, APEX2 is targeted to a subcellular region of interest by genetic fusion to a specific protein or peptide, followed by promiscuous
MCU
Histone2B
Tubulin
Actin
Mitochondrialmatrix
Nucleus
Plasmamembrane
ER
Bright-field EM EM (high mag) Bright-field EM EM (high mag)
10 µm 200 nm
*
*
*
*
*
*
*
*
*
*
*
SVs
1 µm
1 µm
200 nm
200 nm
5 µm
1 µm 200 nm
200 nm
200 nm
1 µm
1 µm
200 nm 200 nm
1 µm 200 nm
10 µm
10 µm
10 µm
10 µm
10 µm
10 µm 10 µm
b ca
e fd
h ig
k lj
n om
q rp
t us
w xv
*
*
*
**
Figure 2 | Bright-field and electron microscopy (EM) images of cultured cells stained by APEX2 and its variants. Asterisks indicate the locations of cells lacking APEX2 staining. In some images, earlier versions of APEX2 (such as APEX or dimeric APXW41F) were used, and these cases are explicitly stated. Except where indicated, bright-field images show cells immediately after DAB staining, but before OsO4 staining. All cells were fixed using 2% (vol/vol) glutaraldehyde. (a–c) APEX targeted to the mitochondrial matrix via fusion to an N-terminal-targeting peptide in COS-7 cells. Mitochondria in untransfected cells are visible in b, but lack contrast in the matrix. (d–f) APEX targeted to the nucleus via fusion to a nuclear localization sequence (NLS). (d) COS-7 cells; (e,f) HEK293T cells. The arrowhead in f points to the nuclear membrane. (g–i) Dimeric APXW41F attached to the plasma membrane, facing cytosol, via fusion to the palmitoylation sequence of GAP-43. Expression in cultured rat hippocampal neurons. The neuronal processes in h appear discontinuous because the neuron is not contained within a single thin section. The arrowhead in i points to an APX-stained plasma membrane. (j–l) APEX targeted to the ER lumen via a KDEL localization sequence in COS-7 cells. The EM images show staining from APEX, whereas the bright-field image shows staining from horseradish peroxidase (HRP). This bright-field image of HRP-stained cells was selected because it clearly demonstrates ER morphology. Similar bright-field results can be obtained with APEX2. The arrowhead in l, which is an enlargement of the red box in k, points to DAB-stained ER. The images shown in k and l are from a sample that was published previously12. (m–o) APEX fused to the N-terminal end of the mitochondrial calcium uniporter (MCU), a transmembrane protein of the mitochondrial inner membrane expressed in COS-7 cells. APEX faces the mitochondrial matrix. The arrowhead in o, which is an enlargement of the red box in n, points to APEX staining, which is confined to a subset of sites located between cristae. The images shown in n and o are from a sample that was published previously12. (p–r) APEX fused to histone H2B, a chromatin protein in COS-7 cells. (p) The three APEX-stained nuclei exhibit a range of staining intensities because of variability in expression levels with transient transfection. The arrowhead in r points to a nuclear pore complex. APEX staining of chromatin is visible in the nucleus on the left in r. (s–u) APEX2 fused to α-tubulin expressed in cultured rat hippocampal neurons by lentiviral infection. APEX2 is fused to the N-terminal end of α-tubulin and faces the hollow core of the microtubule polymer. (s) A bright-field image after OsO4 staining and embedding in resin; the OsO4 staining causes APEX2-negative cells to become slightly dark. (t) A neuron with high APEX2 expression and dark staining is visible. (u) In an enlargement of the red box in t, APEX2-stained microtubules are visible in the dendrite at the center (arrowhead), and microtubules lacking contrast from APEX2 are visible at the top (asterisk). The images shown in t and u are from a sample that was published previously15. (v–x) APEX2 fused to β-actin, expressed in cultured hippocampal rat neurons by lentiviral infection. (v) Punctate staining on dendritic spines is visible in a bright-field image after OsO4 staining and embedding in resin; the OsO4 staining causes APEX2-negative cells to become slightly dark. (w) APEX2-stained spines are visible along the dendrite at the center. (x) An APEX2-stained spine at high magnification (enlargement of the red box in w), with synaptic vesicles (SVs) visible in the axon on the left. The images shown in w and x are from a sample that was published previously15. mag, magnification.
©20
17 M
acm
illan
Pu
blis
her
s L
imit
ed, p
art
of
Sp
rin
ger
Nat
ure
. All
rig
hts
res
erve
d.
© 2017 Macmillan Publishers Limited, part of Springer Nature. All rights reserved. © 2017 Macmillan Publishers Limited, part of Springer Nature. All rights reserved.
protocol
nature protocols | VOL.12 NO.9 | 2017 | 1795
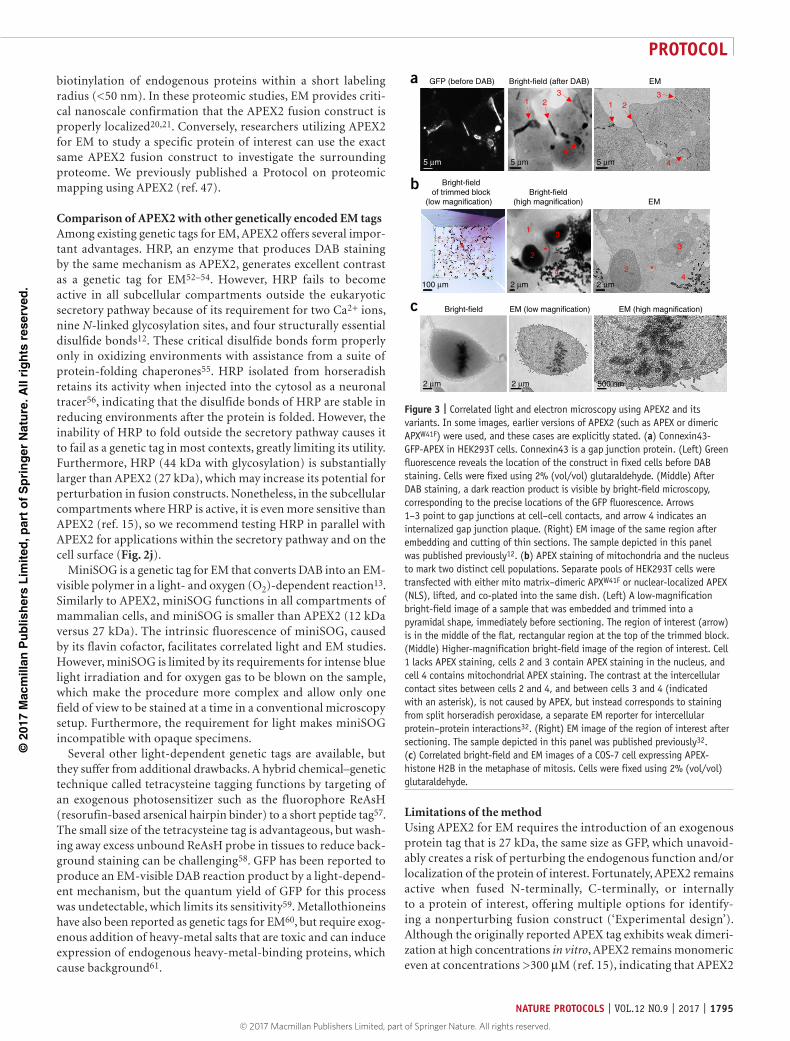
biotinylation of endogenous proteins within a short labeling radius (<50 nm). In these proteomic studies, EM provides criti-cal nanoscale confirmation that the APEX2 fusion construct is properly localized20,21. Conversely, researchers utilizing APEX2 for EM to study a specific protein of interest can use the exact same APEX2 fusion construct to investigate the surrounding proteome. We previously published a Protocol on proteomic mapping using APEX2 (ref. 47).
Comparison of APEX2 with other genetically encoded EM tagsAmong existing genetic tags for EM, APEX2 offers several impor-tant advantages. HRP, an enzyme that produces DAB staining by the same mechanism as APEX2, generates excellent contrast as a genetic tag for EM52–54. However, HRP fails to become active in all subcellular compartments outside the eukaryotic secretory pathway because of its requirement for two Ca2+ ions, nine N-linked glycosylation sites, and four structurally essential disulfide bonds12. These critical disulfide bonds form properly only in oxidizing environments with assistance from a suite of protein-folding chaperones55. HRP isolated from horseradish retains its activity when injected into the cytosol as a neuronal tracer56, indicating that the disulfide bonds of HRP are stable in reducing environments after the protein is folded. However, the inability of HRP to fold outside the secretory pathway causes it to fail as a genetic tag in most contexts, greatly limiting its utility. Furthermore, HRP (44 kDa with glycosylation) is substantially larger than APEX2 (27 kDa), which may increase its potential for perturbation in fusion constructs. Nonetheless, in the subcellular compartments where HRP is active, it is even more sensitive than APEX2 (ref. 15), so we recommend testing HRP in parallel with APEX2 for applications within the secretory pathway and on the cell surface (Fig. 2j).
MiniSOG is a genetic tag for EM that converts DAB into an EM-visible polymer in a light- and oxygen (O2)-dependent reaction13. Similarly to APEX2, miniSOG functions in all compartments of mammalian cells, and miniSOG is smaller than APEX2 (12 kDa versus 27 kDa). The intrinsic fluorescence of miniSOG, caused by its flavin cofactor, facilitates correlated light and EM studies. However, miniSOG is limited by its requirements for intense blue light irradiation and for oxygen gas to be blown on the sample, which make the procedure more complex and allow only one field of view to be stained at a time in a conventional microscopy setup. Furthermore, the requirement for light makes miniSOG incompatible with opaque specimens.
Several other light-dependent genetic tags are available, but they suffer from additional drawbacks. A hybrid chemical–genetic technique called tetracysteine tagging functions by targeting of an exogenous photosensitizer such as the fluorophore ReAsH (resorufin-based arsenical hairpin binder) to a short peptide tag57. The small size of the tetracysteine tag is advantageous, but wash-ing away excess unbound ReAsH probe in tissues to reduce back-ground staining can be challenging58. GFP has been reported to produce an EM-visible DAB reaction product by a light-depend-ent mechanism, but the quantum yield of GFP for this process was undetectable, which limits its sensitivity59. Metallothioneins have also been reported as genetic tags for EM60, but require exog-enous addition of heavy-metal salts that are toxic and can induce expression of endogenous heavy-metal-binding proteins, which cause background61.
Limitations of the methodUsing APEX2 for EM requires the introduction of an exogenous protein tag that is 27 kDa, the same size as GFP, which unavoid-ably creates a risk of perturbing the endogenous function and/or localization of the protein of interest. Fortunately, APEX2 remains active when fused N-terminally, C-terminally, or internally to a protein of interest, offering multiple options for identify-ing a nonperturbing fusion construct (‘Experimental design’). Although the originally reported APEX tag exhibits weak dimeri-zation at high concentrations in vitro, APEX2 remains monomeric even at concentrations >300 µM (ref. 15), indicating that APEX2
c
EMa GFP (before DAB) Bright-field (after DAB)
Bright-field
b Bright-fieldof trimmed block
(low magnification) Bright-field
(high magnification) EM
EM (low magnification) EM (high magnification)
2
3
4
1
2
3
4
1
32
4
1
5 µm
32
4
1
5 µm 5 µm
500 nm
*
*
100 µm 2 µm
2 µm 2 µm
2 µm
Figure 3 | Correlated light and electron microscopy using APEX2 and its variants. In some images, earlier versions of APEX2 (such as APEX or dimeric APXW41F) were used, and these cases are explicitly stated. (a) Connexin43-GFP-APEX in HEK293T cells. Connexin43 is a gap junction protein. (Left) Green fluorescence reveals the location of the construct in fixed cells before DAB staining. Cells were fixed using 2% (vol/vol) glutaraldehyde. (Middle) After DAB staining, a dark reaction product is visible by bright-field microscopy, corresponding to the precise locations of the GFP fluorescence. Arrows 1–3 point to gap junctions at cell–cell contacts, and arrow 4 indicates an internalized gap junction plaque. (Right) EM image of the same region after embedding and cutting of thin sections. The sample depicted in this panel was published previously12. (b) APEX staining of mitochondria and the nucleus to mark two distinct cell populations. Separate pools of HEK293T cells were transfected with either mito matrix–dimeric APXW41F or nuclear-localized APEX (NLS), lifted, and co-plated into the same dish. (Left) A low-magnification bright-field image of a sample that was embedded and trimmed into a pyramidal shape, immediately before sectioning. The region of interest (arrow) is in the middle of the flat, rectangular region at the top of the trimmed block. (Middle) Higher-magnification bright-field image of the region of interest. Cell 1 lacks APEX staining, cells 2 and 3 contain APEX staining in the nucleus, and cell 4 contains mitochondrial APEX staining. The contrast at the intercellular contact sites between cells 2 and 4, and between cells 3 and 4 (indicated with an asterisk), is not caused by APEX, but instead corresponds to staining from split horseradish peroxidase, a separate EM reporter for intercellular protein–protein interactions32. (Right) EM image of the region of interest after sectioning. The sample depicted in this panel was published previously32. (c) Correlated bright-field and EM images of a COS-7 cell expressing APEX-histone H2B in the metaphase of mitosis. Cells were fixed using 2% (vol/vol) glutaraldehyde.
©20
17 M
acm
illan
Pu
blis
her
s L
imit
ed, p
art
of
Sp
rin
ger
Nat
ure
. All
rig
hts
res
erve
d.
© 2017 Macmillan Publishers Limited, part of Springer Nature. All rights reserved.
protocol
1796 | VOL.12 NO.9 | 2017 | nature protocols
© 2017 Macmillan Publishers Limited, part of Springer Nature. All rights reserved.
is unlikely to induce oligomerization artifacts, especially if the APEX2 fusion construct is expressed at low levels.
APEX2 produces an enzymatic DAB reaction product, which could potentially spread beyond the dimensions of the protein of interest. However, we12 and others14 have found that the APEX2 reaction product diffuses minimally when cells are well preserved using strong aldehyde fixation and when the DAB staining is brief and performed at 4 °C. Although antibody-based techniques label the protein of interest with nanoparticles of defined dimensions, resulting in EM contrast that cannot spread, the antibody– nanoparticle conjugates themselves have dimensions >10 nm, which inherently limits the resolution. The requirement for the exogenous labeling reagents, DAB and H2O2, is an unavoidable aspect of APEX2 staining, but these reagents diffuse readily into cultured cells and even complex tissues14,19,28,40,41, indicating that reagent delivery should not limit the application of APEX2 in most systems. Another drawback inherent to APEX2 is that the electron-dense DAB reaction product can potentially obscure endogenous contrast from the labeled structure and its immediate surrounding environment.
APEX2 requires a heme cofactor for activity. Fortunately, most organisms from bacteria to humans produce the form of heme, ‘heme b’, required by APEX2 for activity. In virtually all cell types tested to date, APEX2 has produced detectable activity, indicating that heme was incorporated into the APEX2 active site from endogenous sources. However, there may be cell types or physiological circumstances in which heme biosynthesis is
limited, in which case APEX2 will be inactive unless exogenous heme is supplied.
We have widely observed that EM staining by APEX2 is less sensitive than fluorescence-based detection. This lower sensitiv-ity is inherent to EM because EM provides only one ‘color’. Many endogenous cellular structures are visible after heavy-metal stain-ing, and high levels of APEX2 staining are required for detection above this endogenous background. Fluorescence techniques, on the other hand, produce a bright signal exclusively on the cellular target of interest. As a result, APEX2 in some cases produces clear signal using fluorescent substrates but fails to show contrast by EM. We note, however, that the EM visibility of the endogenous ultrastructure also represents an advantage of EM imaging, as it allows the protein of interest to be visualized relative to other cellular structures.
Experimental designAPEX2 construct design. Several APEX2 constructs for mamma-lian expression are available through Addgene, including APEX2 constructs localized to the cytosol, a variety of mitochondrial subcompartments, and the ER membrane (facing cytosol), along with APEX2 fusions to cytoskeletal proteins (tubulin, actin, and vimentin) and Connexin43-GFP-APEX2, which is a useful cloning template for correlated fluorescence and EM (see Reagents section for a full list of APEX2 constructs available on Addgene).
New APEX2 constructs are typically prepared by appending APEX2 to a targeting peptide (for localization to a particular organelle)
Box 1 | Amplex UltraRed labeling ● TIMING 1 hAmplex UltraRed is an extremely sensitive fluorogenic peroxidase substrate that can be used to detect low levels of APEX2 activity within cells12,15. Peroxidases catalyze the H2O2-dependent conversion of Amplex UltraRed into a derivative of resorufin, a bright red fluorophore. In cases in which it is unclear by light microscopy whether DAB staining is successful, Amplex UltraRed labeling is use-ful to clarify whether APEX2 activity is absent or present at low levels. The most rapid and sensitive procedure for Amplex UltraRed labeling is to submerge living cells in an ice-cold solution of Amplex UltraRed containing H2O2, followed by a brief wash and imaging of the live cells. At temperatures close to 0 °C, a large amount of fluorescent product remains trapped inside the cells, leading to ex-tremely sensitive fluorescence detection of APEX2 activity in individual cells. It is critical to stain negative-control cells lacking APEX2 and compare the fluorescence intensities, as some background fluorescence is visible in cells lacking APEX2. The detailed steps for this procedure are as follows:1. Prepare 10 mM aliquots of Amplex UltraRed in DMSO according to the manufacturer’s instructions. Store them at −20 °C and protect them from light. The aliquots may be stored for at least 12 months.2. Immediately before the experiment, thaw an aliquot of Amplex UltraRed at room temperature, and then dilute to a concentration of 50 µM using cold DPBS and add H2O2 to a concentration of 10 mM.3. Remove the cells plated on a 48-well plate from the incubator and immediately place them on ice. Incubate the cells on ice until the temperature of the medium has equilibrated (~3–5 min).4. Gently remove the medium by aspiration and replace it with 200 µl of ice-cold 50 µM Amplex UltraRed solution with H2O2.5. After ~2–15 min, gently remove the Amplex solution by aspiration and replace it with fresh ice-cold DPBS. A range of labeling times can be tested for new constructs. For confluent cultures with high transfection efficiencies, the cells sometimes appear pink to the eye, and the solution above the cells may also turn pink because of fluorescent product leaking out of the cells.6. Image the living cells using a fluorescence microscope (excitation 490–550 nm; emission 580–590 nm). It is acceptable to wait up to ~10 min before imaging, but cells should be kept on ice before imaging to minimize resorufin leakage from cells.? trouBlesHootInGIt is also possible to proceed to cell fixation and immunostaining after these procedures, allowing APEX2 expression and activity to be visualized simultaneously. Formaldehyde fixation, methanol permeabilization, and immunostaining can be performed as described previously47. After fixation and permeabilization, bright Amplex UltraRed fluorescence remains trapped inside the cells with a localiza-tion pattern matching the subcellular compartment in which APEX2 was expressed. Note, however, that the fluorescence diffuses away from the site where APEX2 is located to completely fill the subcellular compartment. For example, if APEX2 is localized to the plasma membrane and facing the cytosol, the fluorescence signal will fill the entire cytosol, even after cell fixation and washing.
©20
17 M
acm
illan
Pu
blis
her
s L
imit
ed, p
art
of
Sp
rin
ger
Nat
ure
. All
rig
hts
res
erve
d.
© 2017 Macmillan Publishers Limited, part of Springer Nature. All rights reserved. © 2017 Macmillan Publishers Limited, part of Springer Nature. All rights reserved.
protocol
nature protocols | VOL.12 NO.9 | 2017 | 1797
or a specific protein via a flexible ~10-aa linker. Detailed guidelines for design of APEX2 constructs can be found in the next paragraphs. We note that Parton and co-workers recently published an alternative APEX2 targeting strategy of appending APEX2 to a GFP-binding peptide (GBP) and then introducing this chimera into cells already expressing a GFP fusion construct14. A potential concern with this GBP approach is off-target binding, which could lead to nonspecific EM stain-ing, but Parton and co-workers demonstrated good specificity for several subcellular targets. This APEX2-GBP approach should prove useful for screening the localization of proteins in existing GFP-fusion cell lines.
For the design of new APEX2 constructs, we recommend mak-ing fusion constructs with APEX2 (ref. 15) over both the original APEX (ref. 12) and wild-type ascorbate peroxidase (APX) because of its monomericity, superior catalytic activity, resistance to H2O2-induced inactivation, and efficiency of heme incorporation within cells15. For applications in the eukaryotic secretory path-way and on the cell surface, we recommend testing both HRP52,53 and APEX2. HRP (Addgene, cat. no. 44441) does not become active outside the secretory pathway12, but within the secretory pathway; HRP is more catalytically active than APEX2 and gen-erates stronger staining15. On the other hand, HRP is a 44-kDa glycoprotein that is larger than APEX2 (27 kDa) and hence may be
more perturbing in some cases. It is therefore difficult to predict which tag will perform better within the secretory pathway, which is why we recommend testing both.
Search the literature to determine whether the protein or pep-tide of interest tolerates fusion of genetic tags at specific sites. It is preferable to find literature precedence indicating that attach-ment of large tags, such as GFP, is tolerated. Avoid fusion to sites where genetic tags have been shown to perturb the protein of interest. If literature precedent is unavailable, fuse APEX2 to the N or C terminus of the protein of interest, or internally within a long, flexible loop region that is not essential for protein function. APEX2 is active as an N-terminal, C-terminal, or internal fusion. The N and C termini of APEX2 are very close to each other (~5 Å apart, based on crystal structures of APX, the enzyme from which APEX2 is derived62,63), which means it is feasible to fuse APEX2 internally within a short loop region of a protein of interest with-out perturbing its structure. If the protein of interest contains an N-terminal targeting sequence that is post-translationally cleaved by proteolysis, ensure that APEX2 is positioned C-terminally to the cleavage site. If multiple candidate insertion sites are identi-fied, we recommend testing multiple APEX2 fusion constructs, as it is difficult to predict which one(s) will perform best. Include long, flexible linkers separating APEX2 from the protein of inter-est, and for internal insertion constructs include linkers on both
Box 2 | Embedding and sectioning of cells as a pellet instead of a monolayer ● TIMING 5–6 dProcessing cells as a pellet as opposed to a monolayer may be preferred because it is less technically demanding to cut thin sections of the much thicker pellet. In addition, for cells that grow as a suspension, it may be necessary to process the cells as a pellet. The protocol for embedding and sectioning cells as a pellet is very similar to the main Procedure for cell monolayers. Exactly the same reagents are used, but there are some slight differences in amounts and method of application to the cells. This box provides a step-by-step protocol for processing of cells as a pellet. The steps below serve as a substitute for Steps 10–35 of the main Procedure. We reference extensively specific steps of the main Procedure while highlighting the differences.1. Follow the instructions of Step 10 of the main Procedure, except plate the cells on any convenient growth surface, such as a well of a six-well plate. To ensure that sufficient cells are plated to generate a large pellet after scraping, we recommend plating cells in two wells of a six-well plate in the case of HEK293T cells (growth area = 9.5 cm2 per well). Pipette a cell suspension into each well. The volume of cell suspension added to each well should be 2–3 ml, and the density of cells within the suspension should be optimized based on desired timing and confluency for transfection.2. Once the cells are sufficiently confluent, transiently transfect them (including replicate wells) as described in Step 11 of the main Procedure, but scale up the amounts of transfection reagent and DNA to match the larger volume in the wells.3. Fix and stain the cells using the exact same reagents outlined in Steps 12–19 of the main Procedure. The only difference is that larger volumes of each solution will be required to completely cover the larger cell growth surface. We typically use at least 1.5 ml of each staining and washing solution per single well of a six-well plate.4. After the last wash with water (corresponding to Step 19 of the main Procedure), gently remove the water by aspiration and replace it with ~500 µl of fresh water. Use a cell scraper to gently scrape the cells from their growth surface. Ideally, the cells should roll off the plastic in large sheets. Use a razor blade to cut off the end (~2 mm) of a 1,000-µl pipette tip, and then place this truncated tip onto a Pipetman and gently pipette the detached cells into a 1.5-ml Eppendorf microcentrifuge tube. The cell suspensions from the two wells should be combined into a single tube at this point.5. Prepare fresh Durcupan resin mixture and ethanol solutions as described in Step 20 of the main Procedure.6. Centrifuge the cells at 1,000g for 1 min at 4 °C. If a clean cell pellet is not obtained, centrifuge for an additional 1 min at the same speed. To avoid cell damage, do not exceed 1,000g.7. Dehydrate the cells and transfer into resin by submerging them in the same sequence of solutions described in Steps 21–26 of the main Procedure. When changing solutions, gently remove the supernatant liquid by aspiration and gently add fresh liquid while trying not to disperse the cell pellet. Allow the cells to sit in each solution for 10 min. If the cell pellet remains tight at the bottom of the tube after 10 min, simply remove the supernatant liquid and proceed to the next solution. If the pellet has become dispersed after 10 min, centrifuge at 1,000g for 1 min at 4 °C before removing the solution by aspiration.8. Place the Eppendorf microcentrifuge tube in a 60 °C oven for 48 h.9. Cut away the plastic microcentrifuge tube, and then trim and section the block as described in Steps 33–35 of the main Procedure.
©20
17 M
acm
illan
Pu
blis
her
s L
imit
ed, p
art
of
Sp
rin
ger
Nat
ure
. All
rig
hts
res
erve
d.
© 2017 Macmillan Publishers Limited, part of Springer Nature. All rights reserved.
protocol
1798 | VOL.12 NO.9 | 2017 | nature protocols
© 2017 Macmillan Publishers Limited, part of Springer Nature. All rights reserved.
termini of APEX2. We always include linkers that are at least 10 aa long, such as KGSGSTSGSG or GGGGSGGGGS. If an even longer linker is required, the two 10-aa linkers listed above may be concatenated into a single 20-aa linker. We have not observed any deleterious effects from including a variety of additional 2- to 3-aa motifs (for cloning purposes) on either terminus of the flexible linker.
We strongly recommend attaching an epitope or FP tag in tandem with APEX2 to facilitate characterization of expression levels. Small 10- to 20-aa epitope tags are less likely to perturb the protein of interest than are FPs. We prefer the V5 epitope tag (GKPIPNPLLGLDST) because the mouse anti-V5 antibody from Thermo Fisher Scientific (cat. no. R960-25) enables highly sensi-tive detection by immunofluorescence. We also often use the FLAG epitope tag (DYKDDDDK). Although the V5 and FLAG epitope tags contain lysine residues, which could potentially react with aldehydes during fixation, these tags retain antigenicity when cells are fixed using formaldehyde before immunostaining, following our published procedure47. We have not examined whether these epitope tags retain antigenicity after fixation with glutaraldehyde. The HA epitope tag (YPYDVPDYA) should be avoided because APEX2 can cause oxidative damage to tyrosine residues. In con-trast to small epitope tags, FP tags enable convenient visualization in living cells without the need for cell fixation and immunos-taining. This capability can be indispensable for time-course- correlated light microscopy–EM studies. However, the large size (>54 kDa) of the combined FP-APEX2 fusion increases the likeli-hood of perturbation of the protein of interest, so the localization of the tandem FP-APEX2 fusion should be compared with that of a non-FP fusion construct whenever possible. A flexible 10-aa linker should be included between the FP and APEX2. An alterna-tive strategy is to link the APEX2 fusion construct to an FP via a self-cleaving P2A peptide64, leading to whole-cell fluorescence in transfected cells without increasing the size of the APEX2 fusion to the protein of interest. We note that a chicken IgY antibody
against APEX2 has been produced and can be requested from Innovagen. This antibody enables expression of APEX2 to be visu-alized even in constructs lacking an additional epitope tag.
For cultured mammalian cells, we recommend initially clon-ing the construct into pcDNA3 (or a similar plasmid) because it drives high protein expression under the cytomegalovirus promoter. Other promoters may be necessary depending on the cell type. We recommend transient transfection for preliminary experiments because it enables fast and convenient evaluation of multiple fusion constructs. If transient overexpression produces strong DAB staining, but also displays evidence of mislocalization, it is worthwhile to test that same construct under more physi-ologically appropriate expression levels, as improper localization may be an artifact of overexpression. Promising constructs can be introduced at lower expression levels using several different strategies. One approach is to transiently transfect the construct under a weaker promoter. Another option is lentiviral infection65, which stably integrates the construct DNA into the cell genome, resulting in controlled levels of expression in a very high percent-age of cells. APEX2 produces easily detectable DAB staining in a variety of contexts when introduced at low expression levels by lentiviral infection15. Note that, in our experience, lentiviral infection can produce a wide range of APEX2 staining intensities within a single sample, as shown in Figure 2s and v. In an ideal experiment, the construct should be introduced by knock-in to cells lacking the endogenous protein.
Validating APEX2 constructs by light microscopy The DAB reaction product generated by APEX2 can be visualized using light microscopy. We advise validating constructs by light micro-scopy before proceeding to EM because EM sample preparation is more labor-intensive and time-consuming. In our experience, APEX2 staining that can be detected by bright-field microscopy can always be detected by EM. Overstaining with DAB/H2O2 can potentially damage the cellular ultrastructure in some contexts
Box 3 | Heme supplementation ● TIMING 1–17 hThe heme b cofactor required for APEX2 activity is produced endogenously in most organisms ranging from bacteria to humans to plants to yeast. It is therefore not necessary in most cases to supplement heme exogenously. However, there may be cell types in which en-dogenous heme levels are too low to drive high heme occupancy in heterologously expressed APEX2, and supplementation of exogenous heme may boost DAB staining intensity in these cases. If you are convinced that the APEX2 construct is expressed and has not been truncated by proteolysis (as determined by western blotting), but fails to produce staining (while a positive-control APEX2 construct in another cell type does produce staining), it is worthwhile to try heme supplementation. The detailed procedure is as follows:1. Prepare a 483 µM heme stock solution. Add 6.3 mg of hemin chloride and 20 ml of 0.01 M sodium hydroxide solution to a 50-ml conical tube. Vortex thoroughly until all of the solid has dissolved.2. Filter-sterilize the solution using a 0.22-µm filter crItIcal step Prepare the solution immediately before use. Do not store this solution.3. Dilute the heme into the appropriate medium to your desired final concentration. Test concentrations range from ~0.5 to 7 µM. crItIcal step If the medium contains serum, we have found these concentrations of heme to be nontoxic to cultured mammalian cells, including dissociated rat hippocampal neurons32. However, if your medium lacks serum, the toxicity of heme at these concentra-tions should be reassessed.4. Submerge the cells in prewarmed heme-containing medium. Allow them to incubate for 0.2–16 h. Heme incubation time should be optimized for each cell type and construct. In general, incubating with heme for longer than 16 h does not lead to further improve-ment in APEX2 staining intensity. crItIcal step Heme supplementation can substantially increase background staining in some cell types, so it is critical to incubate separate negative-control cells (lacking APEX2) with heme and proceed with an identical staining procedure to check for endogenous background staining.
©20
17 M
acm
illan
Pu
blis
her
s L
imit
ed, p
art
of
Sp
rin
ger
Nat
ure
. All
rig
hts
res
erve
d.
© 2017 Macmillan Publishers Limited, part of Springer Nature. All rights reserved. © 2017 Macmillan Publishers Limited, part of Springer Nature. All rights reserved.
protocol
nature protocols | VOL.12 NO.9 | 2017 | 1799
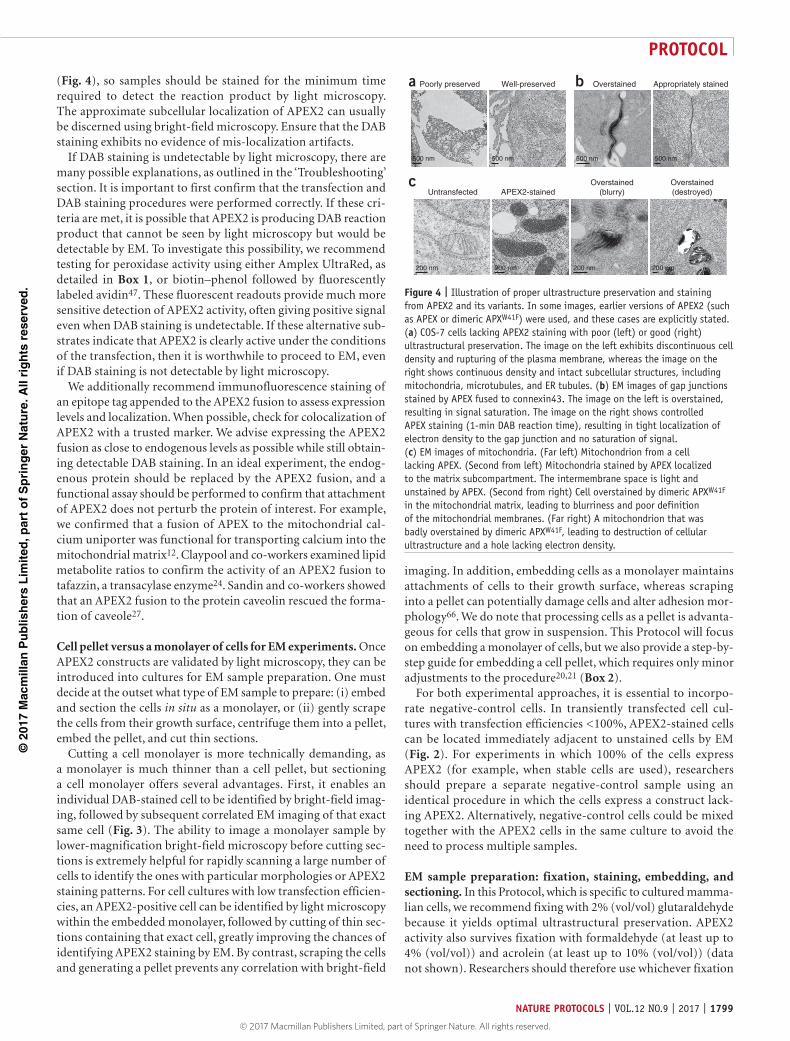
(Fig. 4), so samples should be stained for the minimum time required to detect the reaction product by light microscopy. The approximate subcellular localization of APEX2 can usually be discerned using bright-field microscopy. Ensure that the DAB staining exhibits no evidence of mis-localization artifacts.
If DAB staining is undetectable by light microscopy, there are many possible explanations, as outlined in the ‘Troubleshooting’ section. It is important to first confirm that the transfection and DAB staining procedures were performed correctly. If these cri-teria are met, it is possible that APEX2 is producing DAB reaction product that cannot be seen by light microscopy but would be detectable by EM. To investigate this possibility, we recommend testing for peroxidase activity using either Amplex UltraRed, as detailed in Box 1, or biotin–phenol followed by fluorescently labeled avidin47. These fluorescent readouts provide much more sensitive detection of APEX2 activity, often giving positive signal even when DAB staining is undetectable. If these alternative sub-strates indicate that APEX2 is clearly active under the conditions of the transfection, then it is worthwhile to proceed to EM, even if DAB staining is not detectable by light microscopy.
We additionally recommend immunofluorescence staining of an epitope tag appended to the APEX2 fusion to assess expression levels and localization. When possible, check for colocalization of APEX2 with a trusted marker. We advise expressing the APEX2 fusion as close to endogenous levels as possible while still obtain-ing detectable DAB staining. In an ideal experiment, the endog-enous protein should be replaced by the APEX2 fusion, and a functional assay should be performed to confirm that attachment of APEX2 does not perturb the protein of interest. For example, we confirmed that a fusion of APEX to the mitochondrial cal-cium uniporter was functional for transporting calcium into the mitochondrial matrix12. Claypool and co-workers examined lipid metabolite ratios to confirm the activity of an APEX2 fusion to tafazzin, a transacylase enzyme24. Sandin and co-workers showed that an APEX2 fusion to the protein caveolin rescued the forma-tion of caveole27.
Cell pellet versus a monolayer of cells for EM experiments. Once APEX2 constructs are validated by light microscopy, they can be introduced into cultures for EM sample preparation. One must decide at the outset what type of EM sample to prepare: (i) embed and section the cells in situ as a monolayer, or (ii) gently scrape the cells from their growth surface, centrifuge them into a pellet, embed the pellet, and cut thin sections.
Cutting a cell monolayer is more technically demanding, as a monolayer is much thinner than a cell pellet, but sectioning a cell monolayer offers several advantages. First, it enables an individual DAB-stained cell to be identified by bright-field imag-ing, followed by subsequent correlated EM imaging of that exact same cell (Fig. 3). The ability to image a monolayer sample by lower-magnification bright-field microscopy before cutting sec-tions is extremely helpful for rapidly scanning a large number of cells to identify the ones with particular morphologies or APEX2 staining patterns. For cell cultures with low transfection efficien-cies, an APEX2-positive cell can be identified by light microscopy within the embedded monolayer, followed by cutting of thin sec-tions containing that exact cell, greatly improving the chances of identifying APEX2 staining by EM. By contrast, scraping the cells and generating a pellet prevents any correlation with bright-field
imaging. In addition, embedding cells as a monolayer maintains attachments of cells to their growth surface, whereas scraping into a pellet can potentially damage cells and alter adhesion mor-phology66. We do note that processing cells as a pellet is advanta-geous for cells that grow in suspension. This Protocol will focus on embedding a monolayer of cells, but we also provide a step-by-step guide for embedding a cell pellet, which requires only minor adjustments to the procedure20,21 (Box 2).
For both experimental approaches, it is essential to incorpo-rate negative-control cells. In transiently transfected cell cul-tures with transfection efficiencies <100%, APEX2-stained cells can be located immediately adjacent to unstained cells by EM (Fig. 2). For experiments in which 100% of the cells express APEX2 (for example, when stable cells are used), researchers should prepare a separate negative-control sample using an identical procedure in which the cells express a construct lack-ing APEX2. Alternatively, negative-control cells could be mixed together with the APEX2 cells in the same culture to avoid the need to process multiple samples.
EM sample preparation: fixation, staining, embedding, and sectioning. In this Protocol, which is specific to cultured mamma-lian cells, we recommend fixing with 2% (vol/vol) glutaraldehyde because it yields optimal ultrastructural preservation. APEX2 activity also survives fixation with formaldehyde (at least up to 4% (vol/vol)) and acrolein (at least up to 10% (vol/vol)) (data not shown). Researchers should therefore use whichever fixation
a Overstained
500 nm
Appropriately stainedbPoorly preserved
500 nm
Well-preserved
500 nm 500 nm
cUntransfected
Overstained(destroyed)
200 nm
APEX2-stainedOverstained
(blurry)
200 nm 200 nm 200 nm
Figure 4 | Illustration of proper ultrastructure preservation and staining from APEX2 and its variants. In some images, earlier versions of APEX2 (such as APEX or dimeric APXW41F) were used, and these cases are explicitly stated. (a) COS-7 cells lacking APEX2 staining with poor (left) or good (right) ultrastructural preservation. The image on the left exhibits discontinuous cell density and rupturing of the plasma membrane, whereas the image on the right shows continuous density and intact subcellular structures, including mitochondria, microtubules, and ER tubules. (b) EM images of gap junctions stained by APEX fused to connexin43. The image on the left is overstained, resulting in signal saturation. The image on the right shows controlled APEX staining (1-min DAB reaction time), resulting in tight localization of electron density to the gap junction and no saturation of signal. (c) EM images of mitochondria. (Far left) Mitochondrion from a cell lacking APEX. (Second from left) Mitochondria stained by APEX localized to the matrix subcompartment. The intermembrane space is light and unstained by APEX. (Second from right) Cell overstained by dimeric APXW41F in the mitochondrial matrix, leading to blurriness and poor definition of the mitochondrial membranes. (Far right) A mitochondrion that was badly overstained by dimeric APXW41F, leading to destruction of cellular ultrastructure and a hole lacking electron density.
©20
17 M
acm
illan
Pu
blis
her
s L
imit
ed, p
art
of
Sp
rin
ger
Nat
ure
. All
rig
hts
res
erve
d.
© 2017 Macmillan Publishers Limited, part of Springer Nature. All rights reserved.
protocol
1800 | VOL.12 NO.9 | 2017 | nature protocols
© 2017 Macmillan Publishers Limited, part of Springer Nature. All rights reserved.
reagents yield optimal ultrastructural preservation for their partic-ular cell type. APEX2 is likely to retain activity regardless of which aldehyde fixatives are used. We caution that organic solvents such as methanol and acetone should be avoided because they abolish APEX2 activity. To our knowledge, APEX2 has not been tested for compatibility with high-pressure freezing procedures, but APEX2 activity does survive fixation with paraformaldehyde, immersion in high concentrations of sucrose followed by optimal cutting temperature compound, rapid freezing, and cryosectioning (M. Yamagata and J.R. Sanes (Harvard University), personal com-munication).
After fixation, cells are stained with DAB and H2O2, which dif-fuse readily into fixed cells. The concentrations and staining times presented in this Protocol are specific for monolayers of cultured mammalian cells. For thick tissue specimens, higher concentra-tions and/or longer staining times may be required to facilitate diffusion of DAB and H2O2 into the sample. Some tissue samples contain endogenous peroxidases that generate background DAB staining, and a common procedure to inactivate these peroxi-dases, thus blocking background staining, is pretreatment with high concentrations of H2O2. APEX2 should be fully compatible with such preblocking procedures; although APEX2 is inhibited by high concentrations of H2O2, this inhibition is reversible15.
Samples are next stained with OsO4, which reacts with the DAB polymer and deposits electron-dense osmium to produce EM contrast. OsO4 also stains biological membranes and other biomolecules, making this step important for visualization
of the ultrastructural context, not just the location of APEX2. After OsO4, samples are stained with uranyl acetate to gener-ate additional contrast. As noted in the Procedure section, some groups have used alternative heavy-metal reagents, or omitted heavy-metal staining altogether, and still obtained successful results using APEX2.
After staining, samples are dehydrated and embedded in plastic resin using standard techniques. This Protocol uses Durcupan ACM resin, but most alternative resins are compatible with APEX2 samples, including CY212 (ref. 31), Epon19,24, Spurr’s, or Procure 812 (ref. 42). Once the cells have been embedded in plastic, they are stable indefinitely and can be conveniently trans-ported. Embedded cell monolayers can be visualized under a light microscope to identify individual APEX2-stained cells of interest (Fig. 3). These specific regions of interest are marked, excised using a jeweler’s saw, trimmed, and cut into ultrathin sections.
Sectioning for EM requires extensive training that is beyond the scope of this Protocol. For a detailed practical manual, see Bozzola and Russell67. For researchers unfamiliar with sectioning, we strongly recommend working with a collaborator or core facil-ity. We suggest clarifying with the microscopist whether he or she is familiar with sectioning cell monolayers and/or cell pellets.
At the end of the Procedure section, we describe the placement of individual thin sections on grids followed by EM imaging. We present detailed guidelines for EM imaging and comparisons with negative-control samples to unambiguously identify contrast generated by APEX2 (Anticipated Results).
MaterIalsREAGENTS
Cell line of interest; for example, human embryonic kidney (HEK) 293T cells15 (ATCC, cat. no. CRL-11268) or COS-7 cells12 (ATCC, cat. no. CRL-1651) ! cautIon The cell lines used in your research should be regularly checked to ensure that they are authentic and that they are not infected with mycoplasma.Standard reagents for mammalian cell culture, including media, along with any serum and antibiotics appropriate for the cell line of interestHuman fibronectin (Millipore, cat. no. FC010)Lipofectamine 2000 (or equivalent transfection reagent)Plasmid encoding a positive-control APEX2 construct, such as APEX2-NES (Addgene, cat. no. 49386) or mito-V5-APEX2 (Addgene, cat. no. 72480)Highly purified water that meets ASTM standard D1193-06(2011) Type I. Throughout this article, ‘water’ refers to highly purified water meeting this standardGlutaraldehyde, 8% (wt/wt), in sealed 2-ml glass ampules (Electron Microscopy Sciences, cat. no. 16019) ! cautIon Glutaraldehyde is toxic and should be handled inside a fume hood.Glycine (VWR International, cat. no. 470301-176)3,3′-Diaminobenzidine (DAB; Sigma-Aldrich, cat. no. D8001) ! cautIon Some safety data sheets for DAB state that it is suspected of causing cancer. DAB should therefore be handled with caution. Wear full personal protective equipment and treat DAB solid and solutions as hazardous. crItIcal We use DAB from Sigma-Aldrich, and strongly recommend that other researchers do so, as we have noted batch variability in DAB from other suppliers.Hydrogen peroxide (H2O2), 30% (wt/wt) (Sigma-Aldrich, cat. no. H1009) ! cautIon H2O2 is corrosive.Sodium cacodylate, trihydrate (Electron Microscopy Sciences, cat. no. 12300) ! cautIon Sodium cacodylate is toxic and should be handled inside a fume hood.Calcium chloride, dihydrate (VWR International, cat. no. 0556-500G)Osmium tetroxide, 4% (wt/wt), in sealed 2-ml glass ampules (Electron Microscopy Sciences, cat. no. 19150) ! cautIon OsO4 is a highly reactive and harmful substance. Wear full personal protective equipment and avoid all contact with OsO4-containing solutions. OsO4 is a volatile compound
•
•
•••
•
•
••
•
•
••
that generates harmful and reactive vapors, so it must be kept inside a properly functioning fume hood at all times before quenching.Sodium sulfite (Sigma-Aldrich, cat. no. 239321)Uranyl acetate (Electron Microscopy Sciences, cat. no. 22400) ! cautIon Wear full personal protective equipment and avoid all contact with uranyl acetate powder and solution. Uranyl acetate is a radioactive sub-stance that does not cause noticeable harm if kept external to the body, but it is very toxic if ingested or inhaled. Be particularly careful with powders.Hydrochloric acid, 12 M (VWR International, cat. no. 470301-256) ! cautIon Concentrated hydrochloric acid is corrosive and causes severe burns. Wear full personal protective equipment.Ethanol, 94–96% (vol/vol) (VWR International, cat. no. AA33361)Ethanol, pure, 200 proof, for the last dehydration washes before resin infiltration (VWR International, cat. no. 71006-012)Hemin chloride from bovine (Sigma-Aldrich, cat. no. H9039)Sodium hydroxide (VWR International, cat. no. SS0550) ! cautIon Sodium hydroxide is caustic and causes burns. Wear full personal protective equipment.Durcupan ACM single component A, M epoxy resin (Sigma-Aldrich, cat. no. 44611)Durcupan ACM single component B, hardener 964 (Sigma-Aldrich, cat. no. 44612)Durcupan ACM single component C, accelerator 960 (DY 060) (Sigma-Aldrich, cat. no. 44613)Durcupan ACM single component D (Sigma-Aldrich, cat. no. 44614) ! cautIon Handle the Durcupan ACM components inside a fume hood. Avoid breathing vapors and all skin contact, which can cause irritation and allergic reactions. Wear full personal protective equipment while working with Durcupan ACM components.Dulbecco’s PBS (DPBS; Sigma-Aldrich, cat. no. D5773)BSA (Thermo Fisher Scientific, cat. no. BP1600)Methanol (Sigma-Aldrich cat. no. 34966) ! cautIon Methanol is toxic and should be handled inside a fume hood.Mouse anti-V5 antibody (Thermo Fisher Scientific, cat. no. R960-25)Goat anti-mouse IgG (H+L) secondary antibody, Alexa Fluor 488 (Thermo Fisher Scientific, cat. no. A-11001)
••
•
••
••
•
•
•
•
•••
••
©20
17 M
acm
illan
Pu
blis
her
s L
imit
ed, p
art
of
Sp
rin
ger
Nat
ure
. All
rig
hts
res
erve
d.
© 2017 Macmillan Publishers Limited, part of Springer Nature. All rights reserved. © 2017 Macmillan Publishers Limited, part of Springer Nature. All rights reserved.
protocol
nature protocols | VOL.12 NO.9 | 2017 | 1801
Anti-APEX2 antibody, chicken IgY (Innovagen, custom order; available as a catalog item in the near future)Amplex UltraRed Reagent (Thermo Fisher Scientific, cat. no. A36006)Biotin-phenol (BP; (3aS,4S,6aR)-hexahydro-N-[2-(4-hydroxyphenyl)ethyl]-2-oxo-1H-thieno[3,4-d]imidazole-4-pentanamide): synthesize or purchase from Iris-Biotech (CAS no. 41994-02-9)NeutrAvidin–Alexa Fluor 647 conjugate. This reagent is prepared by conju-gating NeutrAvidin biotin-binding protein (Invitrogen, cat. no. A-2666) to Alexa Fluor 647 succinimidyl ester (Invitrogen, cat. no. A-20006) per Invitrogen’s instructionsPhysiological buffer, e.g., Dulbecco’s PBS (DPBS; Invitrogen, cat. no. 21300025)CaCl2·2H2O (VWR International, cat. no. BDH9224-1KG)Dimethylsulfoxide (DMSO; VWR International, cat. no. 97061-250)
Plasmid encoding APEX2 construct of interest crItIcal Listed below are the APEX2 constructs available through Addgene. All of these plasmids can be used directly for transient transfection of mammalian cells. If you need to prepare a new construct, see ‘Experimen-tal design’ section for guidelines.
mito-V5-APEX2: APEX2 localized to the mitochondrial matrix (Addgene, cat. no. 72480)APEX2-NES: APEX2 localized to the cytosol, but excluded from the nucleus (Addgene, cat. no. 49386)IMS-APEX2: APEX2 localized to mitochondrial intermembrane space (Addgene, cat. no. 79058)APEX2-OMM: APEX2 localized to the mitochondrial outer membrane, facing cytosol (Addgene, cat. no. 79056)ERM-APEX2: APEX2 localized to the ER membrane, facing cytosol (Addgene, cat. no. 79055)MICU1-APEX2: APEX2 fused to the mitochondrial intermembrane space protein MICU1 (Addgene, cat. no. 79057)Vimentin-APEX2: APEX2 fused to the cytoskeletal protein vimentin (Addgene, cat. no. 66170)APEX2-Tubulin: APEX2 fused to the cytoskeletal protein tubulin (Addgene, cat. no. 66171)APEX2-Actin: APEX2 fused to the cytoskeletal protein actin (Addgene, cat. no. 66172)Connexin43-GFP-APEX2: APEX2 fused in tandem with GFP to the gap junction protein connexin43 (Addgene, cat. no. 49385)
EQUIPMENTStandard equipment for mammalian cell cultureNo. 1 glass coverslips, cut into 7 × 7 mm squares and UV-sterilized for at least 20 min, for light microscopy imaging of cells in preliminary validation experiments18-gauge needle for picking up coverslipsTweezers for transferring coverslipsBiology-grade anti-capillary tweezers for transferring thin sections (Ted Pella, product no. 510-4NM)48-Well plateGlass-bottom dishes, poly-d-lysine coated (MatTek, part no. P35GC-0-14-C) crItIcal As a less expensive alternative to MatTek dishes, one can cut a sheet of Alcar (Electron Microscopy Sciences) into squares that fit in the bottom of a regular Petri dish. The disadvantage of this approach is that it increases the working distance so that only low-power magnification can be used for light microscopy imaging.Properly calibrated balance for weighing out reagents, including Durcupan resin componentsStereomicroscope for bright-field imaging to detect DAB polymer during stainingHigh-magnification microscope with bright-field imaging capabilityFluorescence microscope with appropriate filter sets (for validation of expression and activity using immunostaining and Amplex UltraRed labeling, respectively)Rocking plateNalgene beaker for mixing of Durcupan resin components (for example, Thermo Fisher Scientific, cat. no.1201-0250)Transfer pipettesWeighing boatsPlastic dropper for transferring resinRubber policeman for removing resin from dishes during resin washes (VWR International, cat. no. 470104-462)
•
••
•
•
••
•
•
•
•
•
•
•
•
•
•
••
•••
••
•
•
••
••
••••
Oven with temperature set to 60 °C for polymerizing resin in dishesParafilm (VWR International, cat. no. S37440)Pipetman (VWR International, cat. no. 89079-974)Microcentrifuge tubes, 1.5 ml (Eppendorf, cat. no. 022363514)
Equipment for EM specialist steps:Jeweler’s saw with spare blades (Ted Pella, cat. no. 5570)ViseAcrylic mounting cylinders (Ted Pella, cat. no. 10580)Cyanoacrylic glue; for example, Krazy Glue (Elmer’s Products)Ultramicrotome (Leica, RMC, or Diatome)45° ultra diamond knife (Diatome) for cutting thin sectionsGlass knife (Leica) for fine trimmingRazor bladeSyringe and sterile filter with 0.22-µm pore size (Millipore)Compressed air200–300 mesh thin-bar copper grids (Electron Microscopy Sciences)Whatman no. 1 filter paper (GE Healthcare)Transmission electron microscope (TEM; JEOL, model no. 1200 TEM or similar, operating at 80 keV)
REAGENT SETUPHuman fibronectin (50 mg/ml) Follow the manufacturer’s instructions for preparing a 1 mg/ml stock solution. For large vials (100 mg), this requires reconstitution of lyophilized human fibronectin using deionized water. The resulting 1 mg/ml stock solution can be stored at 2–8 °C for up to 6 months. To coat one glass coverslip in a single well of a 48-well plate, mix 12.5 µl of 1 mg/ml human fibronectin stock solution with 237.5 µl of physiological buffer, such as Dulbecco’s PBS (DPBS). Prepare the 50 µg/ml solution immediately before use. Coat the glass coverslips by ensuring they are com-pletely submerged in the 50 µg/ml solution, incubating at 37 °C for 20–60 min, and then rinsing twice with physiological buffer at room temperature (~25 °C) before addition of cell suspension to the glass coverslips.3× Sodium cacodylate solution (300 mM sodium cacodylate, pH 7.4, with 6 mM calcium chloride) This recipe is for 500 ml, but it can be scaled as needed. Dissolve 32.103 g of sodium cacodylate · 3 H2O with stirring in 450 ml of room-temperature (~25 °C) water. Add concentrated hydrochloric acid (HCl) dropwise until the pH is 7.4 (it will start ~pH 8.2). After the pH has been adjusted, add 0.441 g of CaCl2·2H2O. After the CaCl2·2H2O is dissolved, add water to a final volume of 500 ml. Make sure that the solution is completely clear, with no evidence of precipitates. If small amounts of pre-cipitates do not disappear even after prolonged stirring, the precipitates can be removed by filtration with a 0.2-µm bottle-top filter. This solution can be stored at 4 °C and used again for several years, as long as it remains complete-ly clear, with no evidence of precipitates. Note that for samples that will not be processed for EM, it is acceptable to use PBS, which is nontoxic, instead of 1× sodium cacodylate. For EM experiments, sodium cacodylate is preferred because it does not form precipitates with 3 mM calcium chloride, which we include in the solution for staining and preservation of membranes. Sodium cacodylate is also a much more effective buffer in the pH range of 6.4–7.4 than is PBS. Another advantage is that sodium cacodylate is resistant to bacterial contamination when stock solutions are stored. ! cautIon Sodium cacodylate is toxic and should be handled inside a fume hood.1× Sodium cacodylate solution (100 mM sodium cacodylate, pH 7.4, with 2 mM calcium chloride) Dilute the 3× sodium cacodylate solution threefold using water. This solution can be stored at 4 °C and used for several years, as long as it remains completely clear, with no evidence of precipitates. ! cautIon Sodium cacodylate is toxic and should be handled inside a fume hood.2% (vol/vol) glutaraldehyde Inside a fume hood, break open a glass ampule containing 2 ml of 8% (vol/vol) glutaraldehyde. Within a sealable container, mix the entire 2-ml contents of the ampule with 2.66 ml of 3× sodium cacodylate solution and 3.34 ml of water. Tightly seal the container and place the solution in a 37 °C incubator for 5–10 min to prewarm before addi-tion to cells. Use the solution within 1–2 h after preparation. For samples that will not be processed for EM, it is acceptable to use PBS instead of 1× sodium cacodylate. If fixatives other than 2% (vol/vol) glutaraldehyde are known to yield better ultrastructural preservation in the particular system being studied, then those alternative fixatives may be used—they are likely to work, as APEX2 activity survives formaldehyde, acrolein, and glutaraldehyde. ! cautIon Glutaraldehyde is toxic and should be handled inside a fume
••••
•••••••••••••
©20
17 M
acm
illan
Pu
blis
her
s L
imit
ed, p
art
of
Sp
rin
ger
Nat
ure
. All
rig
hts
res
erve
d.
© 2017 Macmillan Publishers Limited, part of Springer Nature. All rights reserved.
protocol
1802 | VOL.12 NO.9 | 2017 | nature protocols
© 2017 Macmillan Publishers Limited, part of Springer Nature. All rights reserved.
hood. crItIcal Prepare this solution freshly before use. crItIcal An alternative buffer that can be used in place of sodium cacodylate for primary fixation of EM samples is 0.1 M PHEM buffer (PIPES, HEPES, EGTA, and MgCl2). PHEM is nontoxic and does not lead to formation of precipitates, unlike PBS. Note that PHEM does not necessarily yield good ultrastructural preservation in tissue systems, so researchers working with tissues should use sodium cacodylate, or whatever buffer is well established, for high-quality preservation of their tissue type.20 mM glycine solution Dissolve 75.1 mg of glycine (molecular weight (MW) = 75.1 g / mol) in 50 ml of 1× sodium cacodylate buffer with CaCl2. The glycine should dissolve after vortexing for 1 min at room temperature. Glycine solution can be stored at 4 °C for up to several years. Do not use it unless it is crystal clear (no precipitates). Note that for samples that will not be processed for EM it is acceptable to use PBS instead of 1× sodium cacodylate. ! cautIon Sodium cacodylate is toxic and should be handled inside a fume hood. crItIcal Do not add potassium cyanide, aminotriazole, or any other peroxidase inhibitors that are commonly used for photo-oxidation-based EM tags. APEX2 is a peroxidase, and it will be inhibited by these compounds.2% (wt/vol) aqueous uranyl acetate Dissolve 4 g of uranyl acetate in room-temperature water (~190 ml). Stir vigorously until the uranyl acetate is all dissolved. This may take ~30–60 min. Once almost all the uranyl acetate has dissolved, add enough water to bring the final volume up to 200 ml. If there is any remaining solid material that does not dissolve, even after prolonged stirring, filter the solution using a 0.2-µm bottle-top filter. This solution can be stored in the dark at 4 °C and used for several years, as long as it remains completely clear, with no evidence of precipitates. Uranyl acetate solutions should be protected from light as much as possible, both before and after addition to cells, to avoid the formation of unwanted precipitates. ! cautIon Wear full personal protective equipment and avoid all contact with uranyl acetate powder and solution. Uranyl acetate is a radioactive substance that does not cause noticeable harm if kept external to the body, but it is very toxic if ingested or inhaled. Be particularly careful with powders.10× DAB Dissolve 50 mg of DAB in 10.0 ml of 0.1 M HCl at room temperature. This may require extensive vortexing. If not all of the solid dissolves, centrifuge at 11,000g at room temperature for 10 min to remove the undissolved material. Prepare ten 1-ml aliquots of the resulting solution, flash-freeze the aliquots, and store them at −80 °C. Aliquots can be stored for several months at this temperature. Once an aliquot has been thawed, use it within 30 min and throw away afterward (do not re-freeze). This recipe can be scaled up as needed to make more (or larger) aliquots. Note that DAB tetrahydrochloride and various DAB-containing peroxidase staining kits are commercially available, but we recommend starting with the free base DAB, freshly preparing the tetrahydrochloride, and immediately storing at −80 °C, as described above, to ensure consistency and to minimize degradation of the compound. ! cautIon Some safety data sheets for DAB state that it is suspected of causing cancer. DAB should therefore be handled with caution. Wear full personal protective equipment and treat DAB solid and solutions as hazardous.
1× DAB solution with H2O2 Thaw a 1-ml aliquot of 10× DAB on ice, and then mix it with 3.33 ml of cold (0–4 °C) 3× sodium cacodylate solution, 5.67 ml of cold water, and 10 µl of 30% (wt/wt) H2O2. This procedure will yield a DAB solution with an H2O2 concentration of 10 mM. We recommend testing a range of H2O2 concentrations (from 0.1 to 10 mM) to identify the optimal concentration. In thick tissue samples, concentrations of H2O2 even higher than 10 mM may be required. For samples that will not be processed for EM, it is acceptable to use PBS instead of 1× sodium cacodylate. crItIcal Prepare this solution freshly before use. crItIcal Do not add potassium cyanide, aminotriazole, or any other peroxidase inhibitors that are commonly used for photo-oxidation-based EM tags. APEX2 is a peroxidase, and it will be inhibited by these compounds.Durcupan resin This recipe yields sufficient resin for infiltration and embedding of six MatTek dishes. Onto a properly calibrated balance inside a fume hood, place a 250-ml Nalgene beaker on top of a plastic weighing boat (to catch drippings) and reset the mass on the balance to zero. Us-ing a 10-ml transfer pipette with the tip broken off (and holding a paper towel at the ready to catch drippings), add Durcupan component A to the beaker until the mass reaches 34.2 g (the liquid will need to be transferred in multiple portions). Reset the mass to zero again, and then add 30.0 g of Durcupan component B using a clean 10-ml transfer pipette. Be very careful not to surpass 30.0 g, as components A and B are now mixed and cannot be selectively removed. Reset the balance mass to zero again, and then add 0.9 g of Durcupan component C using a plastic dropper with the top cut off by a razor blade. Reset the balance yet again, and then add 0.3 g of Durcupan component D using a plastic dropper. Stir the resin mixture vigorously for 2–3 min using a small plastic pipette tip and let it stand at room temperature for at least 15 min before use. crItIcal Freshly prepare the resin mixture right before embedding. It will stay good at room temperature for at least 6 h, but should be used on the same day. ! cautIon Handle the Durcupan ACM components inside a fume hood. Avoid breathing vapors and all skin contact, which can cause irritation and allergic reactions. Wear full personal protec-tive equipment while working with Durcupan ACM components.Sodium sulfite quenching solution (500 mM) Mix 6.3 g of sodium sulfite with 100 ml of room-temperature water and swirl until dissolved. crItIcal Prepare this solution freshly before use.2% (wt/vol) OsO4 solution Inside a well-ventilated fume hood with a sodium sulfite quenching solution already prepared, open a 2-ml ampule of 4% (wt/vol) OsO4, taking care not to allow any liquid to splash onto skin or gloves, and mix the entire 2 ml with 1.33 ml of 3× sodium cacodylate solu-tion and 0.67 ml of cold water. Place the resulting 2% (wt/vol) OsO4 on ice to cool before use. After the solution is prepared, rinse the glass ampule and detached cap with sodium sulfite quenching solution and dispose of the rinse waste as hazardous, but not reactive. crItIcal Prepare the solution immediately before use. Do not store this solution. ! cautIon OsO4 is a highly reactive and harmful substance. Wear full personal protective equip-ment and avoid all contact with OsO4-containing solutions. OsO4 is a volatile compound that generates harmful and reactive vapors, so it must be kept inside a properly functioning fume hood at all times before quenching.
proceDureGeneration of apeX2 fusion constructs ● tIMInG 1–2 weeks1| If necessary, prepare a new APEX2 fusion construct (Experimental design). Several APEX2 constructs are available through Addgene (Reagents).
Validation of activity and localization of apeX2 fusion constructs by light microscopy ● tIMInG 2.5–3.5 d2| Plate the cells on sterile 7 × 7 mm glass coverslips inside the wells of a 48-well plate. Alternatively, cells can be plated on any convenient growth surface compatible with high-magnification bright-field imaging. For HEK293T cells, plate ~300,000 cells. For poorly adherent cells such as HEK293T, precoat the glass slips with 50 µg/ml human fibronectin (or whatever substrate is most compatible) for at least 10 min. Plate extra wells for negative- and positive-control constructs (see Step 7 below) and for optional immunostaining (Step 8) as needed. If necessary, supplement heme into the media at this step (Box 3).
3| Introduce the APEX2 construct into the cells when they have grown to 60–90% confluency. For preliminary construct validation, it is most convenient and rapid to use transient transfection of a plasmid using Lipofectamine 2000 or a
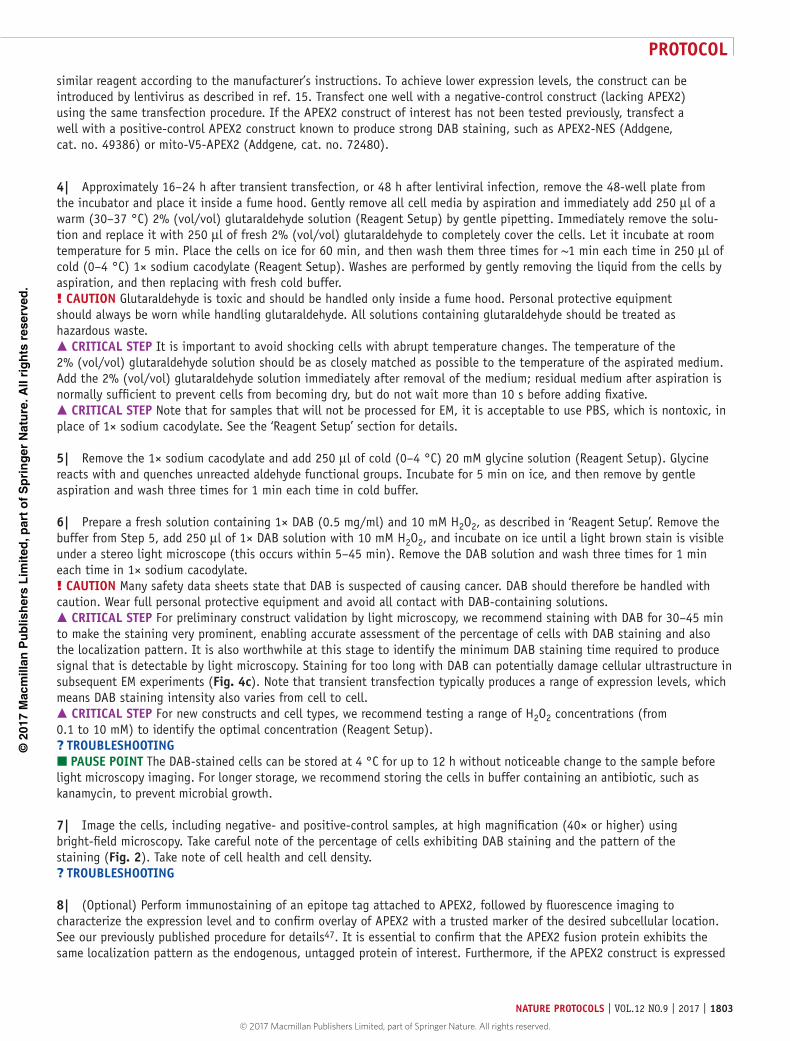
©20
17 M
acm
illan
Pu
blis
her
s L
imit
ed, p
art
of
Sp
rin
ger
Nat
ure
. All
rig
hts
res
erve
d.
© 2017 Macmillan Publishers Limited, part of Springer Nature. All rights reserved. © 2017 Macmillan Publishers Limited, part of Springer Nature. All rights reserved.
protocol
nature protocols | VOL.12 NO.9 | 2017 | 1803
similar reagent according to the manufacturer’s instructions. To achieve lower expression levels, the construct can be introduced by lentivirus as described in ref. 15. Transfect one well with a negative-control construct (lacking APEX2) using the same transfection procedure. If the APEX2 construct of interest has not been tested previously, transfect a well with a positive-control APEX2 construct known to produce strong DAB staining, such as APEX2-NES (Addgene, cat. no. 49386) or mito-V5-APEX2 (Addgene, cat. no. 72480).
4| Approximately 16–24 h after transient transfection, or 48 h after lentiviral infection, remove the 48-well plate from the incubator and place it inside a fume hood. Gently remove all cell media by aspiration and immediately add 250 µl of a warm (30–37 °C) 2% (vol/vol) glutaraldehyde solution (Reagent Setup) by gentle pipetting. Immediately remove the solu-tion and replace it with 250 µl of fresh 2% (vol/vol) glutaraldehyde to completely cover the cells. Let it incubate at room temperature for 5 min. Place the cells on ice for 60 min, and then wash them three times for ~1 min each time in 250 µl of cold (0–4 °C) 1× sodium cacodylate (Reagent Setup). Washes are performed by gently removing the liquid from the cells by aspiration, and then replacing with fresh cold buffer.! cautIon Glutaraldehyde is toxic and should be handled only inside a fume hood. Personal protective equipment should always be worn while handling glutaraldehyde. All solutions containing glutaraldehyde should be treated as hazardous waste. crItIcal step It is important to avoid shocking cells with abrupt temperature changes. The temperature of the 2% (vol/vol) glutaraldehyde solution should be as closely matched as possible to the temperature of the aspirated medium. Add the 2% (vol/vol) glutaraldehyde solution immediately after removal of the medium; residual medium after aspiration is normally sufficient to prevent cells from becoming dry, but do not wait more than 10 s before adding fixative. crItIcal step Note that for samples that will not be processed for EM, it is acceptable to use PBS, which is nontoxic, in place of 1× sodium cacodylate. See the ‘Reagent Setup’ section for details.
5| Remove the 1× sodium cacodylate and add 250 µl of cold (0–4 °C) 20 mM glycine solution (Reagent Setup). Glycine reacts with and quenches unreacted aldehyde functional groups. Incubate for 5 min on ice, and then remove by gentle aspiration and wash three times for 1 min each time in cold buffer.
6| Prepare a fresh solution containing 1× DAB (0.5 mg/ml) and 10 mM H2O2, as described in ‘Reagent Setup’. Remove the buffer from Step 5, add 250 µl of 1× DAB solution with 10 mM H2O2, and incubate on ice until a light brown stain is visible under a stereo light microscope (this occurs within 5–45 min). Remove the DAB solution and wash three times for 1 min each time in 1× sodium cacodylate.! cautIon Many safety data sheets state that DAB is suspected of causing cancer. DAB should therefore be handled with caution. Wear full personal protective equipment and avoid all contact with DAB-containing solutions. crItIcal step For preliminary construct validation by light microscopy, we recommend staining with DAB for 30–45 min to make the staining very prominent, enabling accurate assessment of the percentage of cells with DAB staining and also the localization pattern. It is also worthwhile at this stage to identify the minimum DAB staining time required to produce signal that is detectable by light microscopy. Staining for too long with DAB can potentially damage cellular ultrastructure in subsequent EM experiments (Fig. 4c). Note that transient transfection typically produces a range of expression levels, which means DAB staining intensity also varies from cell to cell. crItIcal step For new constructs and cell types, we recommend testing a range of H2O2 concentrations (from 0.1 to 10 mM) to identify the optimal concentration (Reagent Setup).? trouBlesHootInG pause poInt The DAB-stained cells can be stored at 4 °C for up to 12 h without noticeable change to the sample before light microscopy imaging. For longer storage, we recommend storing the cells in buffer containing an antibiotic, such as kanamycin, to prevent microbial growth.
7| Image the cells, including negative- and positive-control samples, at high magnification (40× or higher) using bright-field microscopy. Take careful note of the percentage of cells exhibiting DAB staining and the pattern of the staining (Fig. 2). Take note of cell health and cell density.? trouBlesHootInG
8| (Optional) Perform immunostaining of an epitope tag attached to APEX2, followed by fluorescence imaging to characterize the expression level and to confirm overlay of APEX2 with a trusted marker of the desired subcellular location. See our previously published procedure for details47. It is essential to confirm that the APEX2 fusion protein exhibits the same localization pattern as the endogenous, untagged protein of interest. Furthermore, if the APEX2 construct is expressed
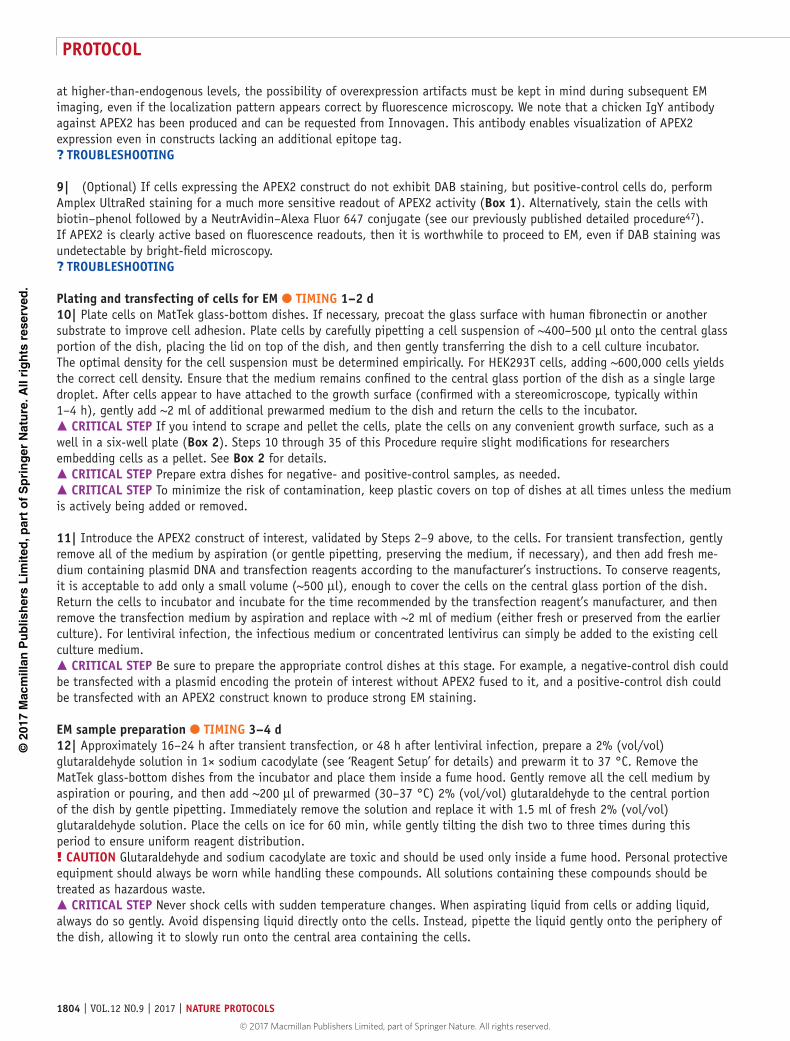
©20
17 M
acm
illan
Pu
blis
her
s L
imit
ed, p
art
of
Sp
rin
ger
Nat
ure
. All
rig
hts
res
erve
d.
© 2017 Macmillan Publishers Limited, part of Springer Nature. All rights reserved.
protocol
1804 | VOL.12 NO.9 | 2017 | nature protocols
© 2017 Macmillan Publishers Limited, part of Springer Nature. All rights reserved.
at higher-than-endogenous levels, the possibility of overexpression artifacts must be kept in mind during subsequent EM imaging, even if the localization pattern appears correct by fluorescence microscopy. We note that a chicken IgY antibody against APEX2 has been produced and can be requested from Innovagen. This antibody enables visualization of APEX2 expression even in constructs lacking an additional epitope tag.? trouBlesHootInG
9| (Optional) If cells expressing the APEX2 construct do not exhibit DAB staining, but positive-control cells do, perform Amplex UltraRed staining for a much more sensitive readout of APEX2 activity (Box 1). Alternatively, stain the cells with biotin–phenol followed by a NeutrAvidin–Alexa Fluor 647 conjugate (see our previously published detailed procedure47). If APEX2 is clearly active based on fluorescence readouts, then it is worthwhile to proceed to EM, even if DAB staining was undetectable by bright-field microscopy.? trouBlesHootInG
plating and transfecting of cells for eM ● tIMInG 1–2 d10| Plate cells on MatTek glass-bottom dishes. If necessary, precoat the glass surface with human fibronectin or another substrate to improve cell adhesion. Plate cells by carefully pipetting a cell suspension of ~400–500 µl onto the central glass portion of the dish, placing the lid on top of the dish, and then gently transferring the dish to a cell culture incubator. The optimal density for the cell suspension must be determined empirically. For HEK293T cells, adding ~600,000 cells yields the correct cell density. Ensure that the medium remains confined to the central glass portion of the dish as a single large droplet. After cells appear to have attached to the growth surface (confirmed with a stereomicroscope, typically within 1–4 h), gently add ~2 ml of additional prewarmed medium to the dish and return the cells to the incubator. crItIcal step If you intend to scrape and pellet the cells, plate the cells on any convenient growth surface, such as a well in a six-well plate (Box 2). Steps 10 through 35 of this Procedure require slight modifications for researchers embedding cells as a pellet. See Box 2 for details. crItIcal step Prepare extra dishes for negative- and positive-control samples, as needed. crItIcal step To minimize the risk of contamination, keep plastic covers on top of dishes at all times unless the medium is actively being added or removed.
11| Introduce the APEX2 construct of interest, validated by Steps 2–9 above, to the cells. For transient transfection, gently remove all of the medium by aspiration (or gentle pipetting, preserving the medium, if necessary), and then add fresh me-dium containing plasmid DNA and transfection reagents according to the manufacturer’s instructions. To conserve reagents, it is acceptable to add only a small volume (~500 µl), enough to cover the cells on the central glass portion of the dish. Return the cells to incubator and incubate for the time recommended by the transfection reagent’s manufacturer, and then remove the transfection medium by aspiration and replace with ~2 ml of medium (either fresh or preserved from the earlier culture). For lentiviral infection, the infectious medium or concentrated lentivirus can simply be added to the existing cell culture medium. crItIcal step Be sure to prepare the appropriate control dishes at this stage. For example, a negative-control dish could be transfected with a plasmid encoding the protein of interest without APEX2 fused to it, and a positive-control dish could be transfected with an APEX2 construct known to produce strong EM staining.
eM sample preparation ● tIMInG 3–4 d12| Approximately 16–24 h after transient transfection, or 48 h after lentiviral infection, prepare a 2% (vol/vol) glutaraldehyde solution in 1× sodium cacodylate (see ‘Reagent Setup’ for details) and prewarm it to 37 °C. Remove the MatTek glass-bottom dishes from the incubator and place them inside a fume hood. Gently remove all the cell medium by aspiration or pouring, and then add ~200 µl of prewarmed (30–37 °C) 2% (vol/vol) glutaraldehyde to the central portion of the dish by gentle pipetting. Immediately remove the solution and replace it with 1.5 ml of fresh 2% (vol/vol) glutaraldehyde solution. Place the cells on ice for 60 min, while gently tilting the dish two to three times during this period to ensure uniform reagent distribution.! cautIon Glutaraldehyde and sodium cacodylate are toxic and should be used only inside a fume hood. Personal protective equipment should always be worn while handling these compounds. All solutions containing these compounds should be treated as hazardous waste. crItIcal step Never shock cells with sudden temperature changes. When aspirating liquid from cells or adding liquid, always do so gently. Avoid dispensing liquid directly onto the cells. Instead, pipette the liquid gently onto the periphery of the dish, allowing it to slowly run onto the central area containing the cells.
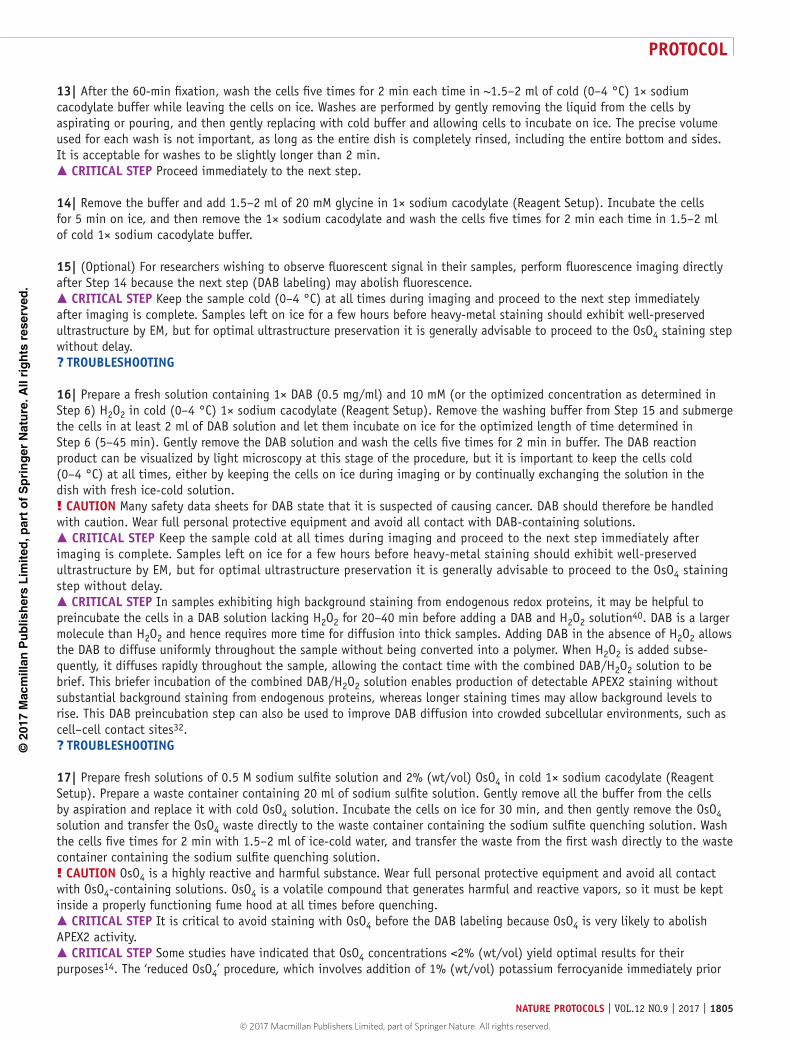
©20
17 M
acm
illan
Pu
blis
her
s L
imit
ed, p
art
of
Sp
rin
ger
Nat
ure
. All
rig
hts
res
erve
d.
© 2017 Macmillan Publishers Limited, part of Springer Nature. All rights reserved. © 2017 Macmillan Publishers Limited, part of Springer Nature. All rights reserved.
protocol
nature protocols | VOL.12 NO.9 | 2017 | 1805
13| After the 60-min fixation, wash the cells five times for 2 min each time in ~1.5–2 ml of cold (0–4 °C) 1× sodium cacodylate buffer while leaving the cells on ice. Washes are performed by gently removing the liquid from the cells by aspirating or pouring, and then gently replacing with cold buffer and allowing cells to incubate on ice. The precise volume used for each wash is not important, as long as the entire dish is completely rinsed, including the entire bottom and sides. It is acceptable for washes to be slightly longer than 2 min. crItIcal step Proceed immediately to the next step.
14| Remove the buffer and add 1.5–2 ml of 20 mM glycine in 1× sodium cacodylate (Reagent Setup). Incubate the cells for 5 min on ice, and then remove the 1× sodium cacodylate and wash the cells five times for 2 min each time in 1.5–2 ml of cold 1× sodium cacodylate buffer.
15| (Optional) For researchers wishing to observe fluorescent signal in their samples, perform fluorescence imaging directly after Step 14 because the next step (DAB labeling) may abolish fluorescence. crItIcal step Keep the sample cold (0–4 °C) at all times during imaging and proceed to the next step immediately after imaging is complete. Samples left on ice for a few hours before heavy-metal staining should exhibit well-preserved ultrastructure by EM, but for optimal ultrastructure preservation it is generally advisable to proceed to the OsO4 staining step without delay.? trouBlesHootInG
16| Prepare a fresh solution containing 1× DAB (0.5 mg/ml) and 10 mM (or the optimized concentration as determined in Step 6) H2O2 in cold (0–4 °C) 1× sodium cacodylate (Reagent Setup). Remove the washing buffer from Step 15 and submerge the cells in at least 2 ml of DAB solution and let them incubate on ice for the optimized length of time determined in Step 6 (5–45 min). Gently remove the DAB solution and wash the cells five times for 2 min in buffer. The DAB reaction product can be visualized by light microscopy at this stage of the procedure, but it is important to keep the cells cold (0–4 °C) at all times, either by keeping the cells on ice during imaging or by continually exchanging the solution in the dish with fresh ice-cold solution.! cautIon Many safety data sheets for DAB state that it is suspected of causing cancer. DAB should therefore be handled with caution. Wear full personal protective equipment and avoid all contact with DAB-containing solutions. crItIcal step Keep the sample cold at all times during imaging and proceed to the next step immediately after imaging is complete. Samples left on ice for a few hours before heavy-metal staining should exhibit well-preserved ultrastructure by EM, but for optimal ultrastructure preservation it is generally advisable to proceed to the OsO4 staining step without delay. crItIcal step In samples exhibiting high background staining from endogenous redox proteins, it may be helpful to preincubate the cells in a DAB solution lacking H2O2 for 20–40 min before adding a DAB and H2O2 solution40. DAB is a larger molecule than H2O2 and hence requires more time for diffusion into thick samples. Adding DAB in the absence of H2O2 allows the DAB to diffuse uniformly throughout the sample without being converted into a polymer. When H2O2 is added subse-quently, it diffuses rapidly throughout the sample, allowing the contact time with the combined DAB/H2O2 solution to be brief. This briefer incubation of the combined DAB/H2O2 solution enables production of detectable APEX2 staining without substantial background staining from endogenous proteins, whereas longer staining times may allow background levels to rise. This DAB preincubation step can also be used to improve DAB diffusion into crowded subcellular environments, such as cell–cell contact sites32.? trouBlesHootInG
17| Prepare fresh solutions of 0.5 M sodium sulfite solution and 2% (wt/vol) OsO4 in cold 1× sodium cacodylate (Reagent Setup). Prepare a waste container containing 20 ml of sodium sulfite solution. Gently remove all the buffer from the cells by aspiration and replace it with cold OsO4 solution. Incubate the cells on ice for 30 min, and then gently remove the OsO4 solution and transfer the OsO4 waste directly to the waste container containing the sodium sulfite quenching solution. Wash the cells five times for 2 min with 1.5–2 ml of ice-cold water, and transfer the waste from the first wash directly to the waste container containing the sodium sulfite quenching solution.! cautIon OsO4 is a highly reactive and harmful substance. Wear full personal protective equipment and avoid all contact with OsO4-containing solutions. OsO4 is a volatile compound that generates harmful and reactive vapors, so it must be kept inside a properly functioning fume hood at all times before quenching. crItIcal step It is critical to avoid staining with OsO4 before the DAB labeling because OsO4 is very likely to abolish APEX2 activity. crItIcal step Some studies have indicated that OsO4 concentrations <2% (wt/vol) yield optimal results for their purposes14. The ‘reduced OsO4’ procedure, which involves addition of 1% (wt/vol) potassium ferrocyanide immediately prior
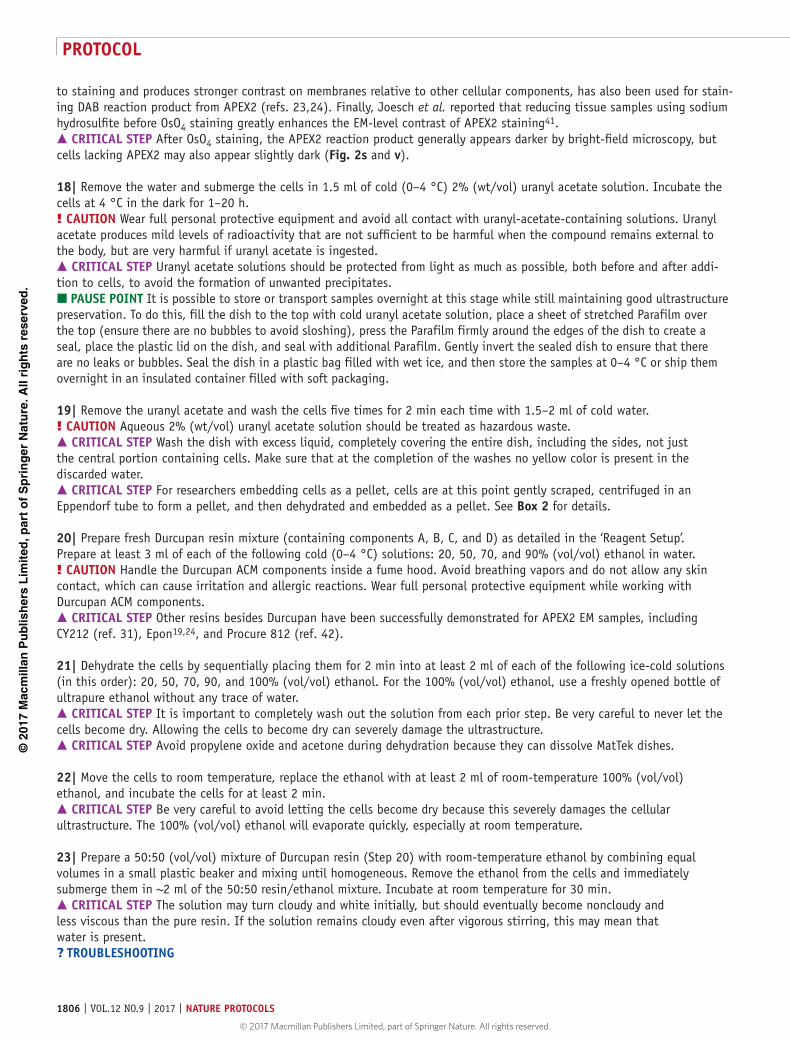
©20
17 M
acm
illan
Pu
blis
her
s L
imit
ed, p
art
of
Sp
rin
ger
Nat
ure
. All
rig
hts
res
erve
d.
© 2017 Macmillan Publishers Limited, part of Springer Nature. All rights reserved.
protocol
1806 | VOL.12 NO.9 | 2017 | nature protocols
© 2017 Macmillan Publishers Limited, part of Springer Nature. All rights reserved.
to staining and produces stronger contrast on membranes relative to other cellular components, has also been used for stain-ing DAB reaction product from APEX2 (refs. 23,24). Finally, Joesch et al. reported that reducing tissue samples using sodium hydrosulfite before OsO4 staining greatly enhances the EM-level contrast of APEX2 staining41. crItIcal step After OsO4 staining, the APEX2 reaction product generally appears darker by bright-field microscopy, but cells lacking APEX2 may also appear slightly dark (Fig. 2s and v).
18| Remove the water and submerge the cells in 1.5 ml of cold (0–4 °C) 2% (wt/vol) uranyl acetate solution. Incubate the cells at 4 °C in the dark for 1–20 h.! cautIon Wear full personal protective equipment and avoid all contact with uranyl-acetate-containing solutions. Uranyl acetate produces mild levels of radioactivity that are not sufficient to be harmful when the compound remains external to the body, but are very harmful if uranyl acetate is ingested. crItIcal step Uranyl acetate solutions should be protected from light as much as possible, both before and after addi-tion to cells, to avoid the formation of unwanted precipitates. pause poInt It is possible to store or transport samples overnight at this stage while still maintaining good ultrastructure preservation. To do this, fill the dish to the top with cold uranyl acetate solution, place a sheet of stretched Parafilm over the top (ensure there are no bubbles to avoid sloshing), press the Parafilm firmly around the edges of the dish to create a seal, place the plastic lid on the dish, and seal with additional Parafilm. Gently invert the sealed dish to ensure that there are no leaks or bubbles. Seal the dish in a plastic bag filled with wet ice, and then store the samples at 0–4 °C or ship them overnight in an insulated container filled with soft packaging.
19| Remove the uranyl acetate and wash the cells five times for 2 min each time with 1.5–2 ml of cold water.! cautIon Aqueous 2% (wt/vol) uranyl acetate solution should be treated as hazardous waste. crItIcal step Wash the dish with excess liquid, completely covering the entire dish, including the sides, not just the central portion containing cells. Make sure that at the completion of the washes no yellow color is present in the discarded water. crItIcal step For researchers embedding cells as a pellet, cells are at this point gently scraped, centrifuged in an Eppendorf tube to form a pellet, and then dehydrated and embedded as a pellet. See Box 2 for details.
20| Prepare fresh Durcupan resin mixture (containing components A, B, C, and D) as detailed in the ‘Reagent Setup’. Prepare at least 3 ml of each of the following cold (0–4 °C) solutions: 20, 50, 70, and 90% (vol/vol) ethanol in water.! cautIon Handle the Durcupan ACM components inside a fume hood. Avoid breathing vapors and do not allow any skin contact, which can cause irritation and allergic reactions. Wear full personal protective equipment while working with Durcupan ACM components. crItIcal step Other resins besides Durcupan have been successfully demonstrated for APEX2 EM samples, including CY212 (ref. 31), Epon19,24, and Procure 812 (ref. 42).
21| Dehydrate the cells by sequentially placing them for 2 min into at least 2 ml of each of the following ice-cold solutions (in this order): 20, 50, 70, 90, and 100% (vol/vol) ethanol. For the 100% (vol/vol) ethanol, use a freshly opened bottle of ultrapure ethanol without any trace of water. crItIcal step It is important to completely wash out the solution from each prior step. Be very careful to never let the cells become dry. Allowing the cells to become dry can severely damage the ultrastructure. crItIcal step Avoid propylene oxide and acetone during dehydration because they can dissolve MatTek dishes.
22| Move the cells to room temperature, replace the ethanol with at least 2 ml of room-temperature 100% (vol/vol) ethanol, and incubate the cells for at least 2 min. crItIcal step Be very careful to avoid letting the cells become dry because this severely damages the cellular ultrastructure. The 100% (vol/vol) ethanol will evaporate quickly, especially at room temperature.
23| Prepare a 50:50 (vol/vol) mixture of Durcupan resin (Step 20) with room-temperature ethanol by combining equal volumes in a small plastic beaker and mixing until homogeneous. Remove the ethanol from the cells and immediately submerge them in ~2 ml of the 50:50 resin/ethanol mixture. Incubate at room temperature for 30 min. crItIcal step The solution may turn cloudy and white initially, but should eventually become noncloudy and less viscous than the pure resin. If the solution remains cloudy even after vigorous stirring, this may mean that water is present.? trouBlesHootInG
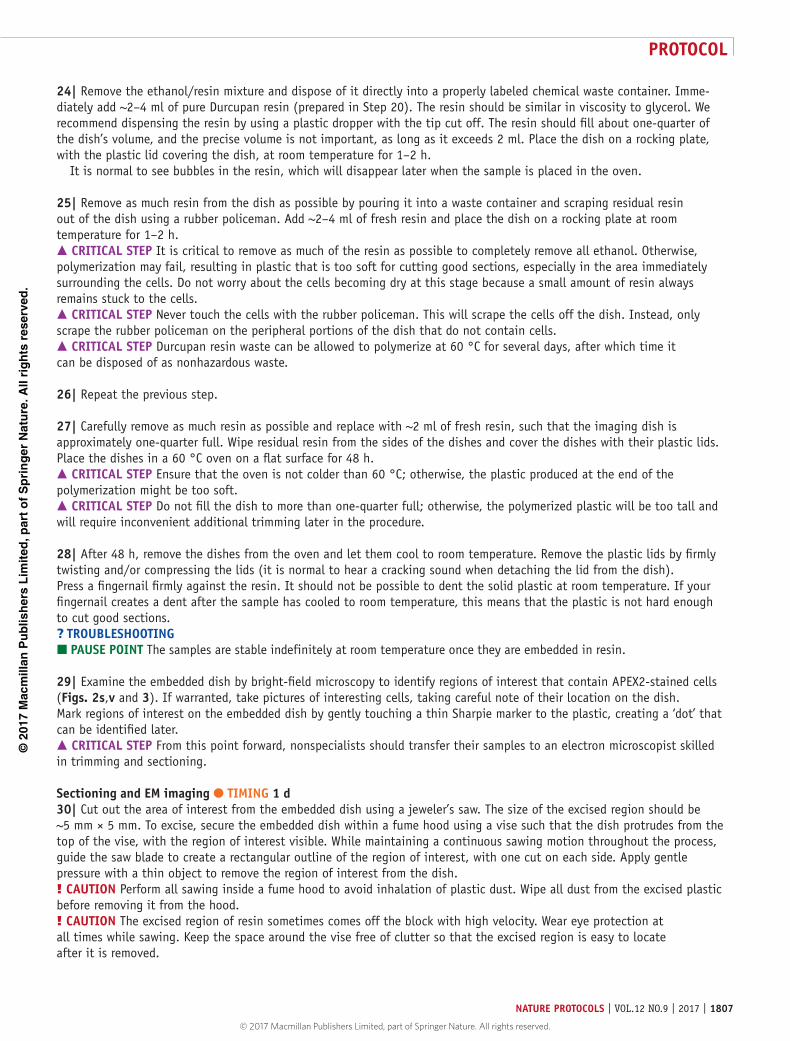
©20
17 M
acm
illan
Pu
blis
her
s L
imit
ed, p
art
of
Sp
rin
ger
Nat
ure
. All
rig
hts
res
erve
d.
© 2017 Macmillan Publishers Limited, part of Springer Nature. All rights reserved. © 2017 Macmillan Publishers Limited, part of Springer Nature. All rights reserved.
protocol
nature protocols | VOL.12 NO.9 | 2017 | 1807
24| Remove the ethanol/resin mixture and dispose of it directly into a properly labeled chemical waste container. Imme-diately add ~2–4 ml of pure Durcupan resin (prepared in Step 20). The resin should be similar in viscosity to glycerol. We recommend dispensing the resin by using a plastic dropper with the tip cut off. The resin should fill about one-quarter of the dish’s volume, and the precise volume is not important, as long as it exceeds 2 ml. Place the dish on a rocking plate, with the plastic lid covering the dish, at room temperature for 1–2 h. It is normal to see bubbles in the resin, which will disappear later when the sample is placed in the oven.
25| Remove as much resin from the dish as possible by pouring it into a waste container and scraping residual resin out of the dish using a rubber policeman. Add ~2–4 ml of fresh resin and place the dish on a rocking plate at room temperature for 1–2 h. crItIcal step It is critical to remove as much of the resin as possible to completely remove all ethanol. Otherwise, polymerization may fail, resulting in plastic that is too soft for cutting good sections, especially in the area immediately surrounding the cells. Do not worry about the cells becoming dry at this stage because a small amount of resin always remains stuck to the cells. crItIcal step Never touch the cells with the rubber policeman. This will scrape the cells off the dish. Instead, only scrape the rubber policeman on the peripheral portions of the dish that do not contain cells. crItIcal step Durcupan resin waste can be allowed to polymerize at 60 °C for several days, after which time it can be disposed of as nonhazardous waste.
26| Repeat the previous step.
27| Carefully remove as much resin as possible and replace with ~2 ml of fresh resin, such that the imaging dish is approximately one-quarter full. Wipe residual resin from the sides of the dishes and cover the dishes with their plastic lids. Place the dishes in a 60 °C oven on a flat surface for 48 h. crItIcal step Ensure that the oven is not colder than 60 °C; otherwise, the plastic produced at the end of the polymerization might be too soft. crItIcal step Do not fill the dish to more than one-quarter full; otherwise, the polymerized plastic will be too tall and will require inconvenient additional trimming later in the procedure.
28| After 48 h, remove the dishes from the oven and let them cool to room temperature. Remove the plastic lids by firmly twisting and/or compressing the lids (it is normal to hear a cracking sound when detaching the lid from the dish). Press a fingernail firmly against the resin. It should not be possible to dent the solid plastic at room temperature. If your fingernail creates a dent after the sample has cooled to room temperature, this means that the plastic is not hard enough to cut good sections.? trouBlesHootInG pause poInt The samples are stable indefinitely at room temperature once they are embedded in resin.
29| Examine the embedded dish by bright-field microscopy to identify regions of interest that contain APEX2-stained cells (Figs. 2s,v and 3). If warranted, take pictures of interesting cells, taking careful note of their location on the dish. Mark regions of interest on the embedded dish by gently touching a thin Sharpie marker to the plastic, creating a ‘dot’ that can be identified later. crItIcal step From this point forward, nonspecialists should transfer their samples to an electron microscopist skilled in trimming and sectioning.
sectioning and eM imaging ● tIMInG 1 d30| Cut out the area of interest from the embedded dish using a jeweler’s saw. The size of the excised region should be ~5 mm × 5 mm. To excise, secure the embedded dish within a fume hood using a vise such that the dish protrudes from the top of the vise, with the region of interest visible. While maintaining a continuous sawing motion throughout the process, guide the saw blade to create a rectangular outline of the region of interest, with one cut on each side. Apply gentle pressure with a thin object to remove the region of interest from the dish.! cautIon Perform all sawing inside a fume hood to avoid inhalation of plastic dust. Wipe all dust from the excised plastic before removing it from the hood.! cautIon The excised region of resin sometimes comes off the block with high velocity. Wear eye protection at all times while sawing. Keep the space around the vise free of clutter so that the excised region is easy to locate after it is removed.
©20
17 M
acm
illan
Pu
blis
her
s L
imit
ed, p
art
of
Sp
rin
ger
Nat
ure
. All
rig
hts
res
erve
d.
© 2017 Macmillan Publishers Limited, part of Springer Nature. All rights reserved.
protocol
1808 | VOL.12 NO.9 | 2017 | nature protocols
© 2017 Macmillan Publishers Limited, part of Springer Nature. All rights reserved.
31| Mount the excised plastic region onto a dummy block using cyanoacrylic glue, with the glass coverslip opposite the dummy block. This is achieved by covering the non-glass side of the excised plastic cube with a thin layer of cyanoacrylic glue, and then firmly pressing it into the flat surface of a dummy block for at least 10 s.
32| Remove the glass coverslip from plastic region of interest. This is achieved by securing the dummy block on an ultramicrotome in the manual block trimming configuration, with the glass coverslip of the embedded sample pointing up. Dispense a small drop of water directly onto the glass coverslip using a syringe with a 0.22-µm sterile filter on the outlet, such that water completely covers the glass coverslip. Position a razor blade under a corner of the glass coverslip, with the blade plane offset by ~10° from the plane of the glass slip. Apply gradually increasing force to the glass coverslip to pry it from the plastic. Maintain a steady force while water flows under the glass. In some cases, the entire glass slip can be removed in one piece. In other cases, the glass will break, leaving a part of the plastic exposed and pieces of glass still on top of the block. If this happens, use compressed air to clear the block of residual glass and water, dispense fresh water from the sterile filter syringe onto the glass, and systematically continue to remove the glass in sections from the edges until no glass remains on the top of the block. crItIcal step Never directly touch the plastic block with the razor blade. This will damage the top portion of the block, which is the critical thin layer that contains the cells.? trouBlesHootInG
33| Use a combination of rough trimming (with a razor blade) and fine trimming (using an ultramicrotome and glass knife) to generate a pyramid-shaped block, with a square, rectangular, or trapezoidal block face surface with dimensions of ~1 × 1 mm. See Figure 3b for an example of a properly trimmed block. During trimming, periodically examine the top face of the block under a stereomicroscope to ensure that the DAB-stained region of interest remains close to the center of the remaining material.
34| Ensure that the block is oriented perfectly parallel to the diamond knife blade and that the reservoir next to the knife edge is filled with water to the proper level. Cut ~10–15 thin sections (with 60- to 80-nm thickness) from the block. The sections should float on the water and gradually move away from the knife edge as additional sections are cut. Keep the block mounted on the ultramicrotome in case you did not cut deep enough into the cells. crItIcal step Sectioning with an ultramicrotome is an advanced technique that requires extensive training. Researchers not already familiar with this technique are advised to work with a collaborator or core facility to perform the sectioning. We do not provide a comprehensive tutorial for sectioning, but simply highlight a few important technical considerations. An excellent, detailed guide on sectioning technique is provided by Bozzola and Russell67.
35| Using biology-grade anti-capillary tweezers, carefully use a grid and lift the sections from the water in the knife trough, so that they lay flat on the grid. Carefully dry the grids using a wedge of clean Whatman no. 1 filter paper and place them into a grid box. crItIcal step Never touch the filter paper directly to the section. crItIcal step Post-section staining is not necessary. All of the images in the figures were obtained without post-section staining. If desired, standard to light on-grid staining with uranyl acetate and/or lead citrate may be used25,31. In most cases, post-section staining will not obscure the APEX2 reaction product. pause poInt Samples can be stored in the grid box indefinitely at room temperature before imaging.
36| Place the grid in the specimen holder of a TEM. Scan across the grid at low magnification (500–1,000×) initially, at a voltage of 80 keV. If a region of interest is identified at low magnification, maintain focus at low magnification for a few seconds, and then increase the magnification. Imaging a fresh portion of the section at high magnification can disin-tegrate the section, but brief exposure to the electron beam at low magnification causes the section to stabilize, making it more resistant to degradation upon subsequent high-magnification imaging. If a region of interest is identified, ensure that the cells are in focus and capture an image. Capture images at both low and high magnification. If APEX2-negative cells are present within the section, capture images showing APEX2-positive cells immediately adjacent to the negative cells, prefer-ably at both high and low magnification. See the ‘Anticipated Results’ section for essential guidelines for distinguishing endogenous EM contrast from APEX2 staining.? trouBlesHootInG
? trouBlesHootInGTroubleshooting advice can be found in table 1.
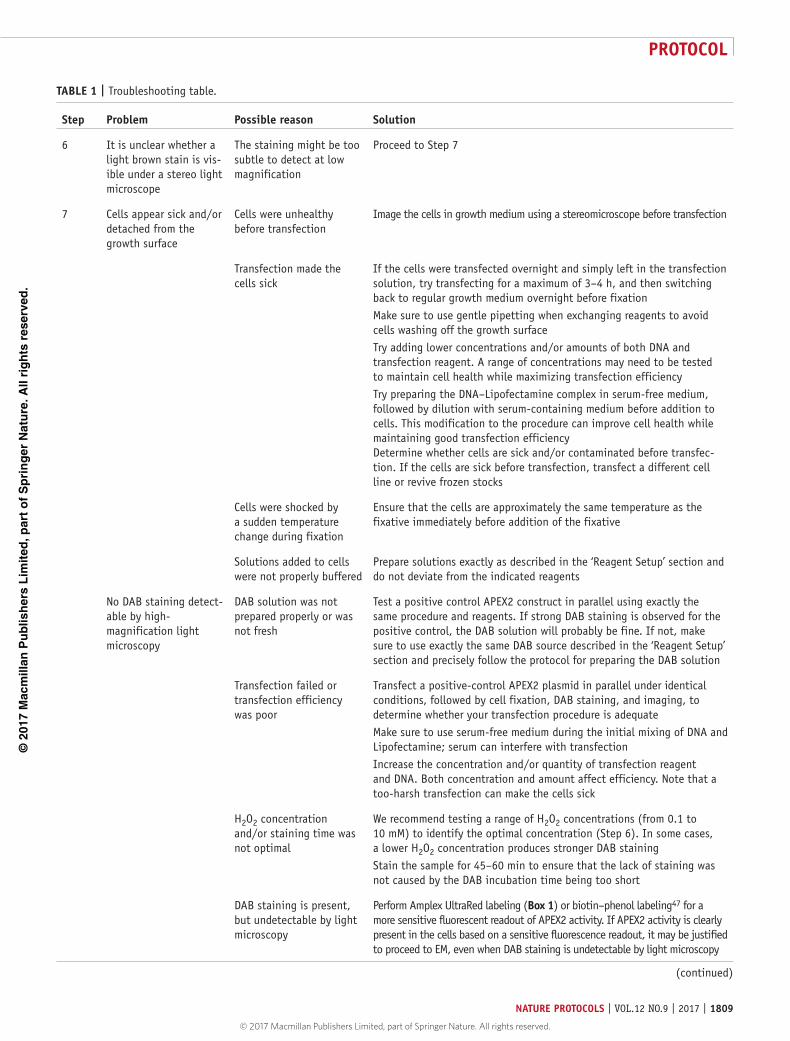
©20
17 M
acm
illan
Pu
blis
her
s L
imit
ed, p
art
of
Sp
rin
ger
Nat
ure
. All
rig
hts
res
erve
d.
© 2017 Macmillan Publishers Limited, part of Springer Nature. All rights reserved. © 2017 Macmillan Publishers Limited, part of Springer Nature. All rights reserved.
protocol
nature protocols | VOL.12 NO.9 | 2017 | 1809
taBle 1 | Troubleshooting table.
step problem possible reason solution
6 It is unclear whether a light brown stain is vis-ible under a stereo light microscope
The staining might be too subtle to detect at low magnification
Proceed to Step 7
7 Cells appear sick and/or detached from the growth surface
Cells were unhealthy before transfection
Image the cells in growth medium using a stereomicroscope before transfection
Transfection made the cells sick
If the cells were transfected overnight and simply left in the transfection solution, try transfecting for a maximum of 3–4 h, and then switching back to regular growth medium overnight before fixation Make sure to use gentle pipetting when exchanging reagents to avoid cells washing off the growth surfaceTry adding lower concentrations and/or amounts of both DNA and transfection reagent. A range of concentrations may need to be tested to maintain cell health while maximizing transfection efficiency Try preparing the DNA–Lipofectamine complex in serum-free medium, followed by dilution with serum-containing medium before addition to cells. This modification to the procedure can improve cell health while maintaining good transfection efficiency Determine whether cells are sick and/or contaminated before transfec-tion. If the cells are sick before transfection, transfect a different cell line or revive frozen stocks
Cells were shocked by a sudden temperature change during fixation
Ensure that the cells are approximately the same temperature as the fixative immediately before addition of the fixative
Solutions added to cells were not properly buffered
Prepare solutions exactly as described in the ‘Reagent Setup’ section and do not deviate from the indicated reagents
No DAB staining detect-able by high- magnification light microscopy
DAB solution was not prepared properly or was not fresh
Test a positive control APEX2 construct in parallel using exactly the same procedure and reagents. If strong DAB staining is observed for the positive control, the DAB solution will probably be fine. If not, make sure to use exactly the same DAB source described in the ‘Reagent Setup’ section and precisely follow the protocol for preparing the DAB solution
Transfection failed or transfection efficiency was poor
Transfect a positive-control APEX2 plasmid in parallel under identical conditions, followed by cell fixation, DAB staining, and imaging, to determine whether your transfection procedure is adequate Make sure to use serum-free medium during the initial mixing of DNA and Lipofectamine; serum can interfere with transfection Increase the concentration and/or quantity of transfection reagent and DNA. Both concentration and amount affect efficiency. Note that a too-harsh transfection can make the cells sick
H2O2 concentration and/or staining time was not optimal
We recommend testing a range of H2O2 concentrations (from 0.1 to 10 mM) to identify the optimal concentration (Step 6). In some cases, a lower H2O2 concentration produces stronger DAB staining Stain the sample for 45–60 min to ensure that the lack of staining was not caused by the DAB incubation time being too short
DAB staining is present, but undetectable by light microscopy
Perform Amplex UltraRed labeling (Box 1) or biotin–phenol labeling47 for a more sensitive fluorescent readout of APEX2 activity. If APEX2 activity is clearly present in the cells based on a sensitive fluorescence readout, it may be justified to proceed to EM, even when DAB staining is undetectable by light microscopy
(continued)
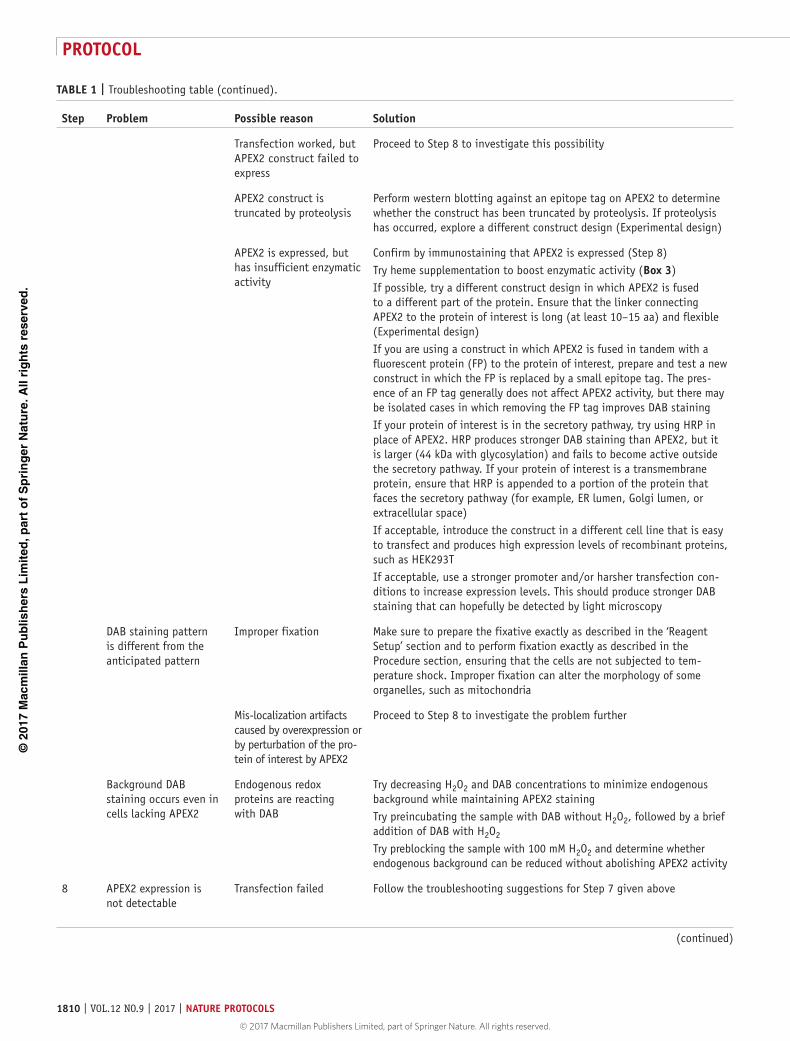
©20
17 M
acm
illan
Pu
blis
her
s L
imit
ed, p
art
of
Sp
rin
ger
Nat
ure
. All
rig
hts
res
erve
d.
© 2017 Macmillan Publishers Limited, part of Springer Nature. All rights reserved.
protocol
1810 | VOL.12 NO.9 | 2017 | nature protocols
© 2017 Macmillan Publishers Limited, part of Springer Nature. All rights reserved.
taBle 1 | Troubleshooting table (continued).
step problem possible reason solution
Transfection worked, but APEX2 construct failed to express
Proceed to Step 8 to investigate this possibility
APEX2 construct is truncated by proteolysis
Perform western blotting against an epitope tag on APEX2 to determine whether the construct has been truncated by proteolysis. If proteolysis has occurred, explore a different construct design (Experimental design)
APEX2 is expressed, but has insufficient enzymatic activity
Confirm by immunostaining that APEX2 is expressed (Step 8) Try heme supplementation to boost enzymatic activity (Box 3) If possible, try a different construct design in which APEX2 is fused to a different part of the protein. Ensure that the linker connecting APEX2 to the protein of interest is long (at least 10–15 aa) and flexible (Experimental design) If you are using a construct in which APEX2 is fused in tandem with a fluorescent protein (FP) to the protein of interest, prepare and test a new construct in which the FP is replaced by a small epitope tag. The pres-ence of an FP tag generally does not affect APEX2 activity, but there may be isolated cases in which removing the FP tag improves DAB staining If your protein of interest is in the secretory pathway, try using HRP in place of APEX2. HRP produces stronger DAB staining than APEX2, but it is larger (44 kDa with glycosylation) and fails to become active outside the secretory pathway. If your protein of interest is a transmembrane protein, ensure that HRP is appended to a portion of the protein that faces the secretory pathway (for example, ER lumen, Golgi lumen, or extracellular space) If acceptable, introduce the construct in a different cell line that is easy to transfect and produces high expression levels of recombinant proteins, such as HEK293T If acceptable, use a stronger promoter and/or harsher transfection con-ditions to increase expression levels. This should produce stronger DAB staining that can hopefully be detected by light microscopy
DAB staining pattern is different from the anticipated pattern
Improper fixation Make sure to prepare the fixative exactly as described in the ‘Reagent Setup’ section and to perform fixation exactly as described in the Procedure section, ensuring that the cells are not subjected to tem-perature shock. Improper fixation can alter the morphology of some organelles, such as mitochondria
Mis-localization artifacts caused by overexpression or by perturbation of the pro-tein of interest by APEX2
Proceed to Step 8 to investigate the problem further
Background DAB staining occurs even in cells lacking APEX2
Endogenous redox proteins are reacting with DAB
Try decreasing H2O2 and DAB concentrations to minimize endogenous background while maintaining APEX2 staining Try preincubating the sample with DAB without H2O2, followed by a brief addition of DAB with H2O2 Try preblocking the sample with 100 mM H2O2 and determine whether endogenous background can be reduced without abolishing APEX2 activity
8 APEX2 expression is not detectable
Transfection failed Follow the troubleshooting suggestions for Step 7 given above
(continued)
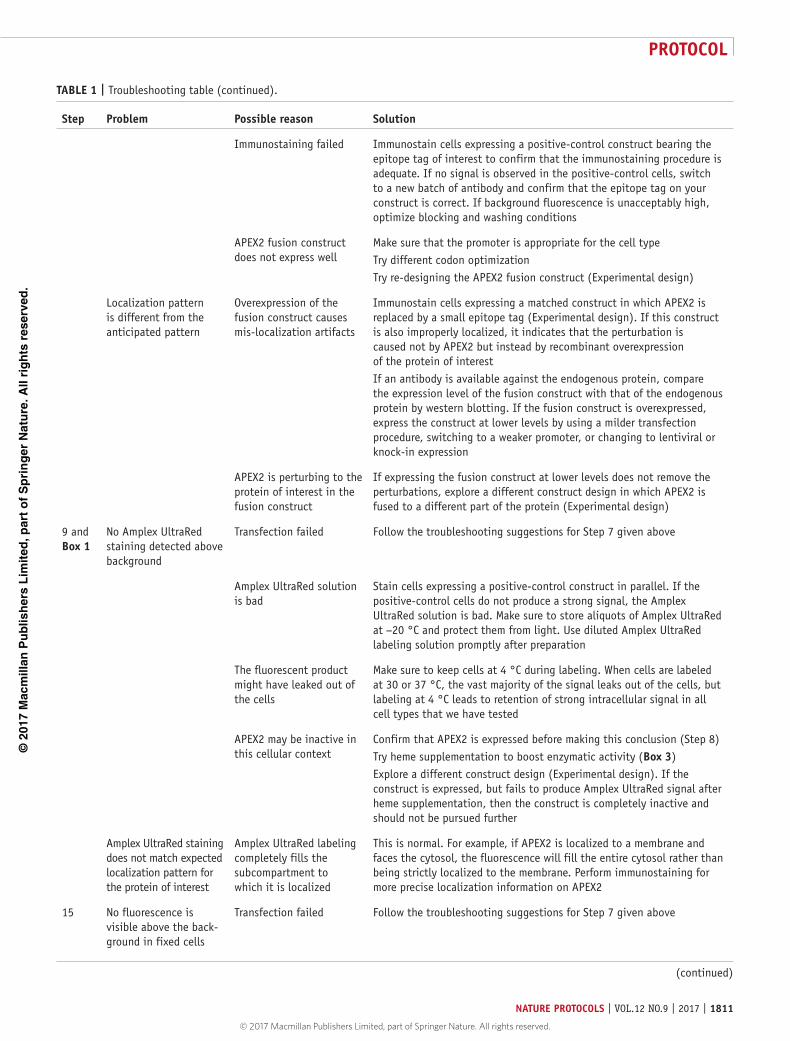
©20
17 M
acm
illan
Pu
blis
her
s L
imit
ed, p
art
of
Sp
rin
ger
Nat
ure
. All
rig
hts
res
erve
d.
© 2017 Macmillan Publishers Limited, part of Springer Nature. All rights reserved. © 2017 Macmillan Publishers Limited, part of Springer Nature. All rights reserved.
protocol
nature protocols | VOL.12 NO.9 | 2017 | 1811
taBle 1 | Troubleshooting table (continued).
step problem possible reason solution
Immunostaining failed Immunostain cells expressing a positive-control construct bearing the epitope tag of interest to confirm that the immunostaining procedure is adequate. If no signal is observed in the positive-control cells, switch to a new batch of antibody and confirm that the epitope tag on your construct is correct. If background fluorescence is unacceptably high, optimize blocking and washing conditions
APEX2 fusion construct does not express well
Make sure that the promoter is appropriate for the cell type Try different codon optimizationTry re-designing the APEX2 fusion construct (Experimental design)
Localization pattern is different from the anticipated pattern
Overexpression of the fusion construct causes mis-localization artifacts
Immunostain cells expressing a matched construct in which APEX2 is replaced by a small epitope tag (Experimental design). If this construct is also improperly localized, it indicates that the perturbation is caused not by APEX2 but instead by recombinant overexpression of the protein of interest If an antibody is available against the endogenous protein, compare the expression level of the fusion construct with that of the endogenous protein by western blotting. If the fusion construct is overexpressed, express the construct at lower levels by using a milder transfection procedure, switching to a weaker promoter, or changing to lentiviral or knock-in expression
APEX2 is perturbing to the protein of interest in the fusion construct
If expressing the fusion construct at lower levels does not remove the perturbations, explore a different construct design in which APEX2 is fused to a different part of the protein (Experimental design)
9 and Box 1
No Amplex UltraRed staining detected above background
Transfection failed Follow the troubleshooting suggestions for Step 7 given above
Amplex UltraRed solution is bad
Stain cells expressing a positive-control construct in parallel. If the positive-control cells do not produce a strong signal, the Amplex UltraRed solution is bad. Make sure to store aliquots of Amplex UltraRed at −20 °C and protect them from light. Use diluted Amplex UltraRed labeling solution promptly after preparation
The fluorescent product might have leaked out of the cells
Make sure to keep cells at 4 °C during labeling. When cells are labeled at 30 or 37 °C, the vast majority of the signal leaks out of the cells, but labeling at 4 °C leads to retention of strong intracellular signal in all cell types that we have tested
APEX2 may be inactive in this cellular context
Confirm that APEX2 is expressed before making this conclusion (Step 8) Try heme supplementation to boost enzymatic activity (Box 3)Explore a different construct design (Experimental design). If the construct is expressed, but fails to produce Amplex UltraRed signal after heme supplementation, then the construct is completely inactive and should not be pursued further
Amplex UltraRed staining does not match expected localization pattern for the protein of interest
Amplex UltraRed labeling completely fills the subcompartment to which it is localized
This is normal. For example, if APEX2 is localized to a membrane and faces the cytosol, the fluorescence will fill the entire cytosol rather than being strictly localized to the membrane. Perform immunostaining for more precise localization information on APEX2
15 No fluorescence is visible above the back-ground in fixed cells
Transfection failed Follow the troubleshooting suggestions for Step 7 given above
(continued)
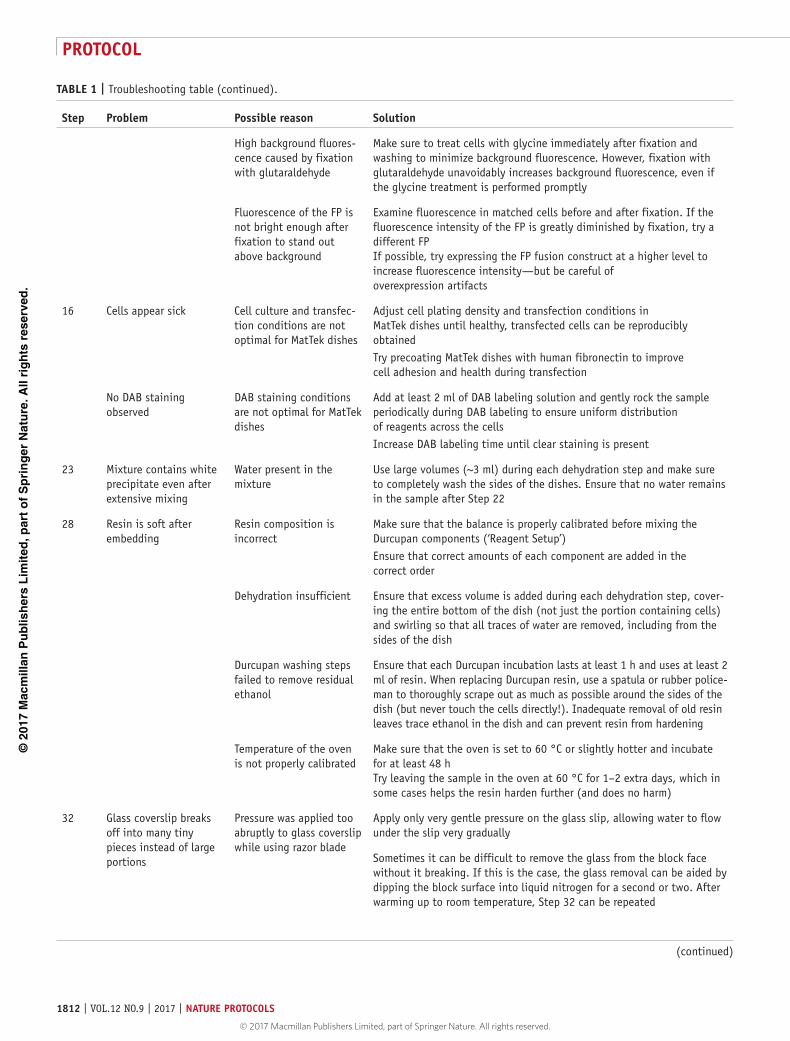
©20
17 M
acm
illan
Pu
blis
her
s L
imit
ed, p
art
of
Sp
rin
ger
Nat
ure
. All
rig
hts
res
erve
d.
© 2017 Macmillan Publishers Limited, part of Springer Nature. All rights reserved.
protocol
1812 | VOL.12 NO.9 | 2017 | nature protocols
© 2017 Macmillan Publishers Limited, part of Springer Nature. All rights reserved.
taBle 1 | Troubleshooting table (continued).
step problem possible reason solution
High background fluores-cence caused by fixation with glutaraldehyde
Make sure to treat cells with glycine immediately after fixation and washing to minimize background fluorescence. However, fixation with glutaraldehyde unavoidably increases background fluorescence, even if the glycine treatment is performed promptly
Fluorescence of the FP is not bright enough after fixation to stand out above background
Examine fluorescence in matched cells before and after fixation. If the fluorescence intensity of the FP is greatly diminished by fixation, try a different FP If possible, try expressing the FP fusion construct at a higher level to increase fluorescence intensity—but be careful of overexpression artifacts
16 Cells appear sick Cell culture and transfec-tion conditions are not optimal for MatTek dishes
Adjust cell plating density and transfection conditions in MatTek dishes until healthy, transfected cells can be reproducibly obtained Try precoating MatTek dishes with human fibronectin to improve cell adhesion and health during transfection
No DAB staining observed
DAB staining conditions are not optimal for MatTek dishes
Add at least 2 ml of DAB labeling solution and gently rock the sample periodically during DAB labeling to ensure uniform distribution of reagents across the cells Increase DAB labeling time until clear staining is present
23 Mixture contains white precipitate even after extensive mixing
Water present in the mixture
Use large volumes (~3 ml) during each dehydration step and make sure to completely wash the sides of the dishes. Ensure that no water remains in the sample after Step 22
28 Resin is soft after embedding
Resin composition is incorrect
Make sure that the balance is properly calibrated before mixing the Durcupan components (‘Reagent Setup’) Ensure that correct amounts of each component are added in the correct order
Dehydration insufficient Ensure that excess volume is added during each dehydration step, cover-ing the entire bottom of the dish (not just the portion containing cells) and swirling so that all traces of water are removed, including from the sides of the dish
Durcupan washing steps failed to remove residual ethanol
Ensure that each Durcupan incubation lasts at least 1 h and uses at least 2 ml of resin. When replacing Durcupan resin, use a spatula or rubber police-man to thoroughly scrape out as much as possible around the sides of the dish (but never touch the cells directly!). Inadequate removal of old resin leaves trace ethanol in the dish and can prevent resin from hardening
Temperature of the oven is not properly calibrated
Make sure that the oven is set to 60 °C or slightly hotter and incubate for at least 48 h Try leaving the sample in the oven at 60 °C for 1–2 extra days, which in some cases helps the resin harden further (and does no harm)
32 Glass coverslip breaks off into many tiny pieces instead of large portions
Pressure was applied too abruptly to glass coverslip while using razor blade
Apply only very gentle pressure on the glass slip, allowing water to flow under the slip very gradually
Sometimes it can be difficult to remove the glass from the block face without it breaking. If this is the case, the glass removal can be aided by dipping the block surface into liquid nitrogen for a second or two. After warming up to room temperature, Step 32 can be repeated
(continued)
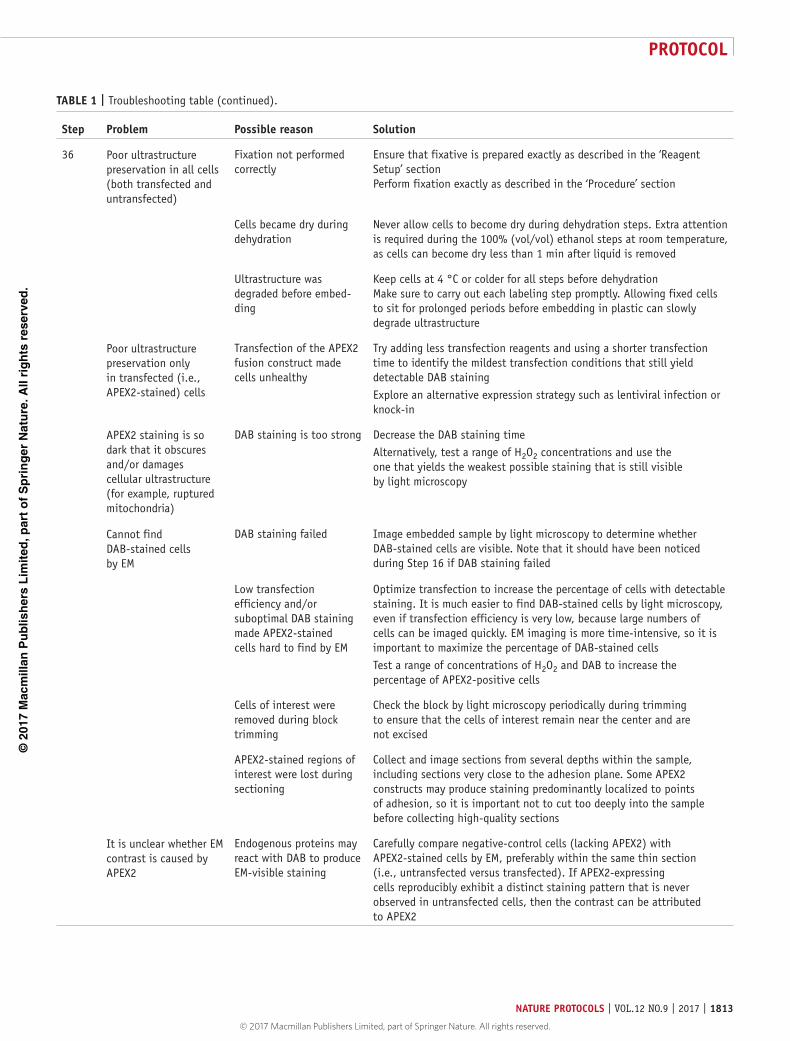
©20
17 M
acm
illan
Pu
blis
her
s L
imit
ed, p
art
of
Sp
rin
ger
Nat
ure
. All
rig
hts
res
erve
d.
© 2017 Macmillan Publishers Limited, part of Springer Nature. All rights reserved. © 2017 Macmillan Publishers Limited, part of Springer Nature. All rights reserved.
protocol
nature protocols | VOL.12 NO.9 | 2017 | 1813
taBle 1 | Troubleshooting table (continued).
step problem possible reason solution
36 Poor ultrastructure preservation in all cells (both transfected and untransfected)
Fixation not performed correctly
Ensure that fixative is prepared exactly as described in the ‘Reagent Setup’ section Perform fixation exactly as described in the ‘Procedure’ section
Cells became dry during dehydration
Never allow cells to become dry during dehydration steps. Extra attention is required during the 100% (vol/vol) ethanol steps at room temperature, as cells can become dry less than 1 min after liquid is removed
Ultrastructure was degraded before embed-ding
Keep cells at 4 °C or colder for all steps before dehydration Make sure to carry out each labeling step promptly. Allowing fixed cells to sit for prolonged periods before embedding in plastic can slowly degrade ultrastructure
Poor ultrastructure preservation only in transfected (i.e., APEX2-stained) cells
Transfection of the APEX2 fusion construct made cells unhealthy
Try adding less transfection reagents and using a shorter transfection time to identify the mildest transfection conditions that still yield detectable DAB staining Explore an alternative expression strategy such as lentiviral infection or knock-in
APEX2 staining is so dark that it obscures and/or damages cellular ultrastructure (for example, ruptured mitochondria)
DAB staining is too strong Decrease the DAB staining time Alternatively, test a range of H2O2 concentrations and use the one that yields the weakest possible staining that is still visible by light microscopy
Cannot find DAB-stained cells by EM
DAB staining failed Image embedded sample by light microscopy to determine whether DAB-stained cells are visible. Note that it should have been noticed during Step 16 if DAB staining failed
Low transfection efficiency and/or suboptimal DAB staining made APEX2-stained cells hard to find by EM
Optimize transfection to increase the percentage of cells with detectable staining. It is much easier to find DAB-stained cells by light microscopy, even if transfection efficiency is very low, because large numbers of cells can be imaged quickly. EM imaging is more time-intensive, so it is important to maximize the percentage of DAB-stained cells Test a range of concentrations of H2O2 and DAB to increase the percentage of APEX2-positive cells
Cells of interest were removed during block trimming
Check the block by light microscopy periodically during trimming to ensure that the cells of interest remain near the center and are not excised
APEX2-stained regions of interest were lost during sectioning
Collect and image sections from several depths within the sample, including sections very close to the adhesion plane. Some APEX2 constructs may produce staining predominantly localized to points of adhesion, so it is important not to cut too deeply into the sample before collecting high-quality sections
It is unclear whether EM contrast is caused by APEX2
Endogenous proteins may react with DAB to produce EM-visible staining
Carefully compare negative-control cells (lacking APEX2) with APEX2-stained cells by EM, preferably within the same thin section (i.e., untransfected versus transfected). If APEX2-expressing cells reproducibly exhibit a distinct staining pattern that is never observed in untransfected cells, then the contrast can be attributed to APEX2
©20
17 M
acm
illan
Pu
blis
her
s L
imit
ed, p
art
of
Sp
rin
ger
Nat
ure
. All
rig
hts
res
erve
d.
© 2017 Macmillan Publishers Limited, part of Springer Nature. All rights reserved.
protocol
1814 | VOL.12 NO.9 | 2017 | nature protocols
© 2017 Macmillan Publishers Limited, part of Springer Nature. All rights reserved.
● tIMInGPlease note that this timing is applicable to researchers with experience preparing cultured cells for EM. Researchers perform-ing this Protocol for the first time should allow extra time for each of the EM sample preparation steps, but the number of days required should remain the same.Step 1, generation of APEX2 fusion constructs: 1–2 weeksSteps 2 and 3, cell plating and transfection for construct validation: 2–3 dSteps 4–7, fixation, glycine blocking, DAB staining, and bright-field imaging: 2–2.5 hStep 8, (optional, but recommended) immunostaining: ~3–4 h (can be performed simultaneously with Steps 4–7)Step 9, (optional) Amplex UltraRed labeling: ~45 min (can be performed simultaneously with Steps 4–7)Steps 10 and 11, plating and transfection of cells for EM: 1–2 dSteps 12–17, fixation, glycine blocking, DAB and OsO4 staining for EM sample prep: 2.5–3 hStep 18, uranyl acetate staining: 1–20 hStep 19, washing out of uranyl acetate: 10 minStep 20, preparation of Durcupan resin mixture: 20 minSteps 21 and 22, dehydration: 1 hSteps 24–26, resin infiltration: 3.5–6 hStep 27, resin polymerization in oven: 2 dSteps 28 and 29, examination of embedded dishes: 0.5–2 hSteps 30 and 31, excision and mounting of area of interest: 15 minSteps 32 and 33, removal of glass coverslip and trimming of block: 20–60 minSteps 34 and 35, cutting of thin sections and placement on grids: 10–30 minStep 36, EM imaging: 15–60 minBox 1, Amplex UltraRed labeling: 1hBox 2, embedding and sectioning of cells as a pellet instead of a monolayer: 5–6 dBox 3, heme supplementation: 1–17 h
antIcIpateD resultssample validation using light microscopyBefore proceeding to EM, APEX2 constructs should be fully validated by light microscopy to confirm good activity, reason-able expression levels, and proper localization (Fig. 2). The shortest possible DAB staining time that yields clear contrast by bright-field microscopy should be used. In our experience, nearly all APEX2 fusion constructs produce DAB staining by light microscopy. If DAB staining is not visible, Amplex UltraRed labeling can reveal whether the APEX2 construct is active at levels that are not detectable by light microscopy, but potentially visible by EM (Box 1). Immunofluorescence should be performed to characterize the expression level of the APEX2 fusion construct and to confirm that the construct overlays with a trusted marker. If the initial APEX2 fusion construct fails validation by light microscopy, the construct should be reconfig-ured and retested (Experimental design).
Bright-field imaging results should be used for guidance in determining the number of fields of view that must be exam-ined by EM. For example, if only 5% of cells exhibited DAB staining that was detectable by bright-field microscopy, then in general at least 20 cells must be examined to discover 1 cell with APEX2 staining, and at least 100 cells must be examined to discover 5 cells with APEX2 staining. If some of the APEX2-stained cells appear unhealthy or exhibit poor ultrastructural preservation, then an even greater number of fields of view must be examined in order to identify at least 5 well-preserved and healthy APEX2-positive cells. It is possible for APEX2-stained cells to appear unstained by bright-field microscopy yet exhibit contrast by EM, but if >200 cells have been examined by EM from multiple thin sections without discovery of APEX2 staining, it is advisable to prepare a new sample that exhibits clear contrast by bright-field microscopy.
electron microscopy data interpretationBefore claiming that an APEX2 fusion construct exhibits a particular subcellular localization by EM, one must establish that this localization is consistently observed across several fields of view. As with any type of imaging, a single field of view can be misleading. It is critical to carefully compare APEX2-stained cells with untransfected cells so that authentic APEX2 staining can be distinguished from endogenous background (Fig. 2). If untransfected cells are present within the same sample as APEX2, capture as many images as possible (ideally >5) containing both APEX2-stained and APEX2-negative cells within the same field of view. Very subtle staining can be difficult to discern; it is preferable to find cells with APEX2 staining that is clearly stronger than the endogenous background. For example, mitochondria in untransfected cells often appear dark by EM after staining with DAB and H2O2, probably a result of endogenous redox proteins generating small amounts of DAB polymer. For an example, see Figure 2l, in which the mitochondrion at the lower left is not stained by APEX but nonetheless appears darker than the sur-rounding cytosol (although not as dark as the APEX-stained ER lumen). In our experience, the intensity of endogenous
©20
17 M
acm
illan
Pu
blis
her
s L
imit
ed, p
art
of
Sp
rin
ger
Nat
ure
. All
rig
hts
res
erve
d.
© 2017 Macmillan Publishers Limited, part of Springer Nature. All rights reserved. © 2017 Macmillan Publishers Limited, part of Springer Nature. All rights reserved.
protocol
nature protocols | VOL.12 NO.9 | 2017 | 1815
mitochondrial staining can vary depending on cell type and experimental conditions. Therefore, to demonstrate convincing APEX2 localization to mitochondria, one must capture images of mitochondria that are clearly stained more strongly than endogenous mitochondria under matched experimental conditions. In another example, APEX2 staining may not even be appar-ent for constructs with diffuse cytosolic localization unless an APEX2-stained cell is imaged next to an untransfected cell.
If negative-control cells are not present in the same sample as APEX2 cells, one must be cautious in comparing staining intensities across multiple images. Many EM image acquisition programs automatically scale contrast, so contrast levels are not necessarily matched across multiple fields of view. We recommend calibrating contrast levels between separate fields of view such that some distinctive endogenous feature, such as the plasma membrane, ribosomes, or chromatin, appears equally dark. This adjustment will approximately match the contrast levels.
Throughout EM imaging, check for abnormalities in cellular ultrastructure, such as disrupted membranes, aggregated organelles, or other perturbations to cell morphology (Fig. 4). If an abnormality is observed in both transfected and untrans-fected cells, then the problem is probably caused by poor fixation or another issue with sample preparation (see ‘Trouble-shooting’ section). If the abnormality is specific to APEX2-stained cells, then the APEX2 construct may be perturbing the cells. One possibility is that overexpression of the APEX2 fusion construct may perturb cellular ultrastructure and/or make cells sick. Note that strong overexpression of APEX2 tethered to some membranes, such as the mitochondrial outer membrane or ER membrane (facing cytosol), can potentially induce abnormal aggregation of the compartments15. Perturbations to cel-lular ultrastructure may not necessarily be caused by APEX2, but instead could be caused by overexpression of the protein to which APEX2 is appended. Another potential problem is that APEX2 staining might be too strong, which can rupture mem-branes and damage subcellular organelles (Fig. 4).
Even if the cells appear healthy and normal in terms of ultrastructure, check for potential artifacts in localization of the APEX2-stained protein. If APEX2 localization is inconsistent with literature reports for the protein of interest, it is possible that the APEX2 fusion is improperly localized—although it is also possible that the literature reports are incorrect12. If APEX2 is fused to a protein that incorporates into a filament or macromolecular complex, ensure that the size of the APEX2-stained structure is consistent with published dimensions. For example, vimentin-APEX2 exhibits staining on intermediate filaments ~10 nm in thickness12,14, consistent with prior reports.
APEX2 staining does not cross membranes, which makes it useful for determining the topology of transmembrane pro-teins12,21. Membranes react with OsO4, which gives them strong contrast by EM, so it can sometimes be difficult to discern the boundary between a membrane and APEX2 staining. Examining the entire length of the membrane within the field of view can facilitate its identification. If by chance the thin section was cut parallel to the plane of a membrane, it will usu-ally not stand out as clearly by EM, so additional imaging may be necessary to identify a clearer field of view.
APEX2 staining may in some cases outline the structure of macromolecular complexes. For example, we found that Con-nexin43-APEX2 staining within gap junctions matched the dimensions of the hexameric Connexin complex12. This analysis was facilitated by 3D tomography, which may not always be possible, but even in single images of thin sections it is often possible to discern periodic structures. One should not assume APEX2 to be capable of outlining individual protein complexes with single-nanometer resolution, considering that APEX2 itself is 4 nm in size, and the DAB polymer can spread beyond these dimensions.
acknoWleDGMents Funding was provided by the US National Institutes of Health (R01-CA186568 to A.Y.T.; P41 GM103412 and R01GM086197 to M.H.E.) and a Howard Hughes Medical Institute Collaborative Initiative Award (to A.Y.T.). J.D.M. and S.S.L. were supported by National Science Foundation Graduate Research and National Defense Science and Engineering fellowships.
autHor contrIButIons J.D.M. and A.Y.T. developed the original APEX tag for electron microscopy. S.S.L. and A.Y.T. developed APEX2. T.J.D. and M.H.E. developed protocols for cell staining, EM sample processing, and imaging by light and electron microscopy. J.D.M. prepared all constructs and cell samples for the figures, and T.J.D. performed all EM sample processing and imaging. J.D.M. wrote the paper. All authors edited the paper.
coMpetInG FInancIal Interests The authors declare competing financial interests: details are available in the online version of the paper.
Reprints and permissions information is available online at http://www.nature.com/reprints/index.html. Publisher’s note: Springer Nature remains neutral with regard to jurisdictional claims in published maps and institutional affiliations.
1. Giepmans, B.N., Adams, S.R., Ellisman, M.H. & Tsien, R.Y. The fluorescent toolbox for assessing protein location and function. Science 312, 217–224 (2006).
2. Fernandez-Suarez, M. & Ting, A.Y. Fluorescent probes for super-resolution imaging in living cells. Nat. Rev. Mol. Cell Biol. 9, 929–943 (2008).
3. Xu, K., Shim, S.-H. & Zhuang, X. in Far-Field Optical Nanoscopy (eds. Tinnefeld, P., Eggeling, C. & Hell, S. W.) 27–64 (Springer, 2015).
4. Eggeling, C. & Hell, S.W. in Far-Field Optical Nanoscopy (eds. Tinnefeld, P., Eggeling, C. & Hell, S. W.) 3–25 (Springer, 2015).
5. De Mey, J., Moeremans, M., Geuens, G., Nuydens, R. & De Brabander, M. High resolution light and electron microscopic localization of tubulin with the IGS (immuno gold staining) method. Cell Biol. Int. Rep. 5, 889–899 (1981).
6. Giepmans, B.N.G., Deerinck, T.J., Smarr, B.L., Jones, Y.Z. & Ellisman, M.H. Correlated light and electron microscopic imaging of multiple endogenous proteins using quantum dots. Nat. Methods 2, 743–749 (2005).
7. Henderson, D. & Weber, K. Three-dimensional organization of microfilaments and microtubules in the cytoskeleton. Immunoperoxidase labelling and stereo-electron microscopy of detergent-extracted cells. Exp. Cell Res. 124, 301–316 (1979).
8. Deerinck, T.J. et al. Fluorescence photooxidation with eosin: a method for high resolution immunolocalization and in situ hybridization detection for light and electron microscopy. J. Cell Biol. 126, 901–910 (1994).
9. Schnell, U., Dijk, F., Sjollema, K.A. & Giepmans, B.N.G. Immunolabeling artifacts and the need for live-cell imaging. Nat. Methods 9, 152–158 (2012).
10. Tokuyasu, K.T. Application of cryoultramicrotomy to immunocytochemistry. J. Microsc. 143, 139–149 (1986).
©20
17 M
acm
illan
Pu
blis
her
s L
imit
ed, p
art
of
Sp
rin
ger
Nat
ure
. All
rig
hts
res
erve
d.
© 2017 Macmillan Publishers Limited, part of Springer Nature. All rights reserved.
protocol
1816 | VOL.12 NO.9 | 2017 | nature protocols
11. Kukulski, W. et al. Correlated fluorescence and 3D electron microscopy with high sensitivity and spatial precision. J. Cell Biol. 192, 111 (2011).
12. Martell, J.D. et al. Engineered ascorbate peroxidase as a genetically encoded reporter for electron microscopy. Nat. Biotechnol. 30, 1143–1148 (2012).
13. Shu, X. et al. A genetically encoded tag for correlated light and electron microscopy of intact cells, tissues, and organisms. PLoS Biol. 9, e1001041 (2011).
14. Ariotti, N. et al. Modular detection of GFP-labeled proteins for rapid screening by electron microscopy in cells and organisms. Dev. Cell 35, 513–525 (2015).
15. Lam, S.S. et al. Directed evolution of APEX2 for electron microscopy and proximity labeling. Nat. Methods 12, 51–54 (2015).
16. Shvets, E., Bitsikas, V., Howard, G., Hansen, C.G. & Nichols, B.J. Dynamic caveolae exclude bulk membrane proteins and are required for sorting of excess glycosphingolipids. Nat. Commun. 6, 6867 (2015).
17. Ludwig, A., Nichols, B.J. & Sandin, S. Architecture of the caveolar coat complex. J. Cell Sci. 129, 3077 (2016).
18. Liu, L.-K., Choudhary, V., Toulmay, A. & Prinz, W.A. An inducible ER–Golgi tether facilitates ceramide transport to alleviate lipotoxicity. J. Cell Biol. 216, 131–147 (2016).
19. Hyenne, V. et al. RAL-1 controls multivesicular body biogenesis and exosome secretion. J. Cell Biol. 211, 27–37 (2015).
20. Hung, V. et al. Proteomic mapping of the human mitochondrial intermembrane space in live cells via ratiometric APEX tagging. Mol. Cell 55, 332–341 (2014).
21. Rhee, H.-W. et al. Proteomic mapping of mitochondria in living cells via spatially restricted enzymatic tagging. Science 339, 1328–1331 (2013).
22. Bertolin, G. et al. Parkin maintains mitochondrial levels of the protective Parkinson’s disease-related enzyme 17-β hydroxysteroid dehydrogenase type 10. Cell Death Differ. 22, 1563–1576 (2015).
23. Fueller, J. et al. Subcellular partitioning of protein tyrosine phosphatase 1B to the endoplasmic reticulum and mitochondria depends sensitively on the composition of its tail anchor. PLoS One 10, e0139429 (2015).
24. Lu, Y.-W. et al. Defining functional classes of Barth syndrome mutation in humans. Hum. Mol. Genet. 25, 1754–1770 (2016).
25. Luo, X. et al. Enhanced transcriptional activity and mitochondrial localization of STAT3 co-induce axon regrowth in the adult central nervous system. Cell Rep. 15, 398–410 (2016).
26. Long, J.C.D. & Fodor, E. The PB2 subunit of the influenza A virus RNA polymerase is imported into the mitochondrial matrix. J. Virol. 90, 8729–8738 (2016).
27. Ludwig, A., Nichols, B.J. & Sandin, S. Architecture of the caveolar coat complex. J. Cell Sci. 29, 3077–3083 (2016).
28. Bohm, U.L. et al. CSF-contacting neurons regulate locomotion by relaying mechanical stimuli to spinal circuits. Nat. Commun. 7, 10866 (2016).
29. Kotewicz, K.M. et al. A single Legionella effector catalyzes a multistep ubiquitination pathway to rearrange tubular endoplasmic reticulum for replication. Cell Host Microbe 21, 169–181 (2017).
30. Ellisman, M.H. et al. Advances in molecular probe-based labeling tools and their application to multiscale multimodal correlated microscopies. J. Chem. Biol. 8, 143–151 (2015).
31. Wong, M. & Munro, S. The specificity of vesicle traffic to the Golgi is encoded in the golgin coiled-coil proteins. Science 346, (2014).
32. Martell, J.D. et al. A split horseradish peroxidase for the detection of intercellular protein-protein interactions and sensitive visualization of synapses. Nat. Biotechnol. 34, 774–780 (2016).
33. Salo, V.T. et al. Seipin regulates ER–lipid droplet contacts and cargo delivery. EMBO J. 35, 2699–2716 (2016).
34. Belevich, I., Joensuu, M., Kumar, D., Vihinen, H. & Jokitalo, E. Microscopy image browser: a platform for segmentation and analysis of multidimensional datasets. PLoS Biol. 14, e1002340 (2016).
35. Bushong, E.A. et al. X-ray microscopy as an approach to increasing accuracy and efficiency of serial block-face imaging for correlated light and electron microscopy of biological specimens. Microsc. Microanal. 21, 231–238 (2015).
36. Heusermann, W. et al. Exosomes surf on filopodia to enter cells at endocytic hot spots, traffic within endosomes, and are targeted to the ER. J. Cell Biol. 213, 173–184 (2016).
37. Su, Y. et al. Mitochondrial transplantation attenuates airway hyperresponsiveness by inhibition of cholinergic hyperactivity. Theranostics 6, 1244–1260 (2016).
38. Lawrence, A.D. et al. Solution structure of a bacterial microcompartment targeting peptide and its application in the construction of an ethanol bioreactor. ACS Synth. Biol. 3, 454–465 (2014).
39. Zumthor, J.P. et al. Static clathrin assemblies at the peripheral vacuole—plasma membrane interface of the parasitic protozoan Giardia lamblia. PLoS Pathog. 12, e1005756 (2016).
40. Lin, T.-Y. et al. Mapping chromatic pathways in the Drosophila visual system. J. Comp. Neurol. 524, 213–227 (2016).
41. Joesch, M. et al. Reconstruction of genetically identified neurons imaged by serial-section electron microscopy. eLife 5, e15015 (2016).
42. Eyre, N.S. et al. Phosphorylation of NS5A Serine-235 is essential to hepatitis C virus RNA replication and normal replication compartment formation. Virology 491, 27–44 (2016).
43. Marceau, C.D. et al. Genetic dissection of Flaviviridae host factors through genome-scale CRISPR screens. Nature 535, 159–163 (2016).
44. Kittelmann, M., Hawes, C. & Hughes, L. Serial block face scanning electron microscopy and the reconstruction of plant cell membrane systems. J. Microsc. 263, 200–211 (2016).
45. Jing, J. et al. Proteomic mapping of ER-PM junctions identifies STIMATE as a regulator of Ca2+ influx. Nat. Cell Biol. 17, 1339–1347 (2015).
46. Chen, C.-L. et al. Proteomic mapping in live Drosophila tissues using an engineered ascorbate peroxidase. Proc. Natl. Acad. Sci. USA 112, 12093–12098 (2015).
47. Hung, V. et al. Spatially resolved proteomic mapping in living cells with the engineered peroxidase APEX2. Nat. Protoc. 11, 456–475 (2016).
48. Dwyer, D.J. et al. Antibiotics induce redox-related physiological alterations as part of their lethality. Proc. Natl. Acad. Sci. USA 111, E2100–E2109 (2014).
49. Choi, H., Yang, Z. & Weisshaar, J.C. Single-cell, real-time detection of oxidative stress induced in Escherichia coli by the antimicrobial peptide CM15. Proc. Natl. Acad. Sci. 112, E303–E310 (2015).
50. Lee, J. et al. An enhanced ascorbate peroxidase 2/antibody-binding domain fusion protein (APEX2-ABD) as a recombinant target-specific signal amplifier. Chem. Commun. 51, 10945–10948 (2015).
51. Lee, S.-Y. et al. APEX fingerprinting reveals the subcellular localization of proteins of interest. Cell Rep. 15, 1837–1847 (2016).
52. Li, J., Wang, Y., Chiu, S.-L. & Cline, H.T. Membrane targeted horseradishperoxidase as a marker for correlative fluorescence and electron microscopy studies. Front. Neural Circuits 4, 6 (2010).
53. Loh, K.H. et al. Proteomic analysis of unbounded cellular compartments: synaptic clefts. Cell 166, 1295–1307 (2016).
54. Kuipers, J. et al. FLIPPER, a combinatorial probe for correlated live imaging and electron microscopy, allows identification and quantitative analysis of various cells and organelles. Cell Tissue Res. 360, 61–70 (2015).
55. Puig, A. & Gilbert, H.F. Protein disulfide isomerase exhibits chaperone and anti-chaperone activity in the oxidative refolding of lysozyme. J. Biol. Chem. 269, 7764–7771 (1994).
56. Wilson, C.J. & Groves, P.M. Fine structure and synaptic connections of the common spiny neuron of the rat neostriatum: a study employing intracellular injection of horseradish peroxidase. J. Comp. Neurol. 194, 599–615 (1980).
57. Gaietta, G. et al. Multicolor and electron microscopic imaging of connexin trafficking. Science 296, 503–507 (2002).
58. Hoffmann, C. et al. Fluorescent labeling of tetracysteine-tagged proteins in intact cells. Nat. Protoc. 5, 1666–1677 (2010).
59. Jiménez-Banzo, A., Nonell, S., Hofkens, J. & Flors, C. Singlet oxygen photosensitization by EGFP and its chromophore HBDI. Biophys. J. 94, 168–172 (2008).
60. Mercogliano, C.P. & DeRosier, D.J. Concatenated metallothionein as a clonable gold label for electron microscopy. J. Struct. Biol. 160, 70–82 (2007).
61. Diestra, E., Fontana, J., Guichard, P., Marco, S. & Risco, C. Visualization of proteins in intact cells with a clonable tag for electron microscopy. J. Struct. Biol. 165, 157–168 (2009).
62. Sharp, K.H., Mewies, M., Moody, P.C.E. & Raven, E.L. Crystal structure of the ascorbate peroxidase-ascorbate complex. Nat. Struct. Mol. Biol. 10, 303–307 (2003).
63. Patterson, W.R. & Poulos, T.L. Crystal structure of recombinant pea cytosolic ascorbate peroxidase. Biochemistry 34, 4331–4341 (1995).
64. Kim, J.H. et al. High cleavage efficiency of a 2A peptide derived from porcine Teschovirus-1 in human cell lines, zebrafish and mice. PLoS One 6, e18556 (2011).
65. Tiscornia, G., Singer, O. & Verma, I.M. Production and purification of lentiviral vectors. Nat. Protoc. 1, 241–245 (2006).
66. McIntosh, J.R. Cellular Electron Microscopy 79 (Academic Press, 2011).67. Bozzola, J.J. & Russell, L.D. Electron Microscopy: Principles and Techniques
for Biologists (Jones & Bartlett Learning, 1999).